80
NetIQ ® AppManager ® for Microsoft SharePoint Server Management Guide December 2013

NetIQ® AppManager® for Microsoft SharePoint Server
Management GuideDecember 2013

Legal Notice
THIS DOCUMENT AND THE SOFTWARE DESCRIBED IN THIS DOCUMENT ARE FURNISHED UNDER AND ARE SUBJECT TO THE TERMS OF A LICENSE AGREEMENT OR A NON-DISCLOSURE AGREEMENT. EXCEPT AS EXPRESSLY SET FORTH IN SUCH LICENSE AGREEMENT OR NON-DISCLOSURE AGREEMENT, NETIQ CORPORATION PROVIDES THIS DOCUMENT AND THE SOFTWARE DESCRIBED IN THIS DOCUMENT "AS IS" WITHOUT WARRANTY OF ANY KIND, EITHER EXPRESS OR IMPLIED, INCLUDING, BUT NOT LIMITED TO, THE IMPLIED WARRANTIES OF MERCHANTABILITY OR FITNESS FOR A PARTICULAR PURPOSE. SOME STATES DO NOT ALLOW DISCLAIMERS OF EXPRESS OR IMPLIED WARRANTIES IN CERTAIN TRANSACTIONS; THEREFORE, THIS STATEMENT MAY NOT APPLY TO YOU.
For purposes of clarity, any module, adapter or other similar material ("Module") is licensed under the terms and conditions of the End User License Agreement for the applicable version of the NetIQ product or software to which it relates or interoperates with, and by accessing, copying or using a Module you agree to be bound by such terms. If you do not agree to the terms of the End User License Agreement you are not authorized to use, access or copy a Module and you must destroy all copies of the Module and contact NetIQ for further instructions.
This document and the software described in this document may not be lent, sold, or given away without the prior written permission of NetIQ Corporation, except as otherwise permitted by law. Except as expressly set forth in such license agreement or non-disclosure agreement, no part of this document or the software described in this document may be reproduced, stored in a retrieval system, or transmitted in any form or by any means, electronic, mechanical, or otherwise, without the prior written consent of NetIQ Corporation. Some companies, names, and data in this document are used for illustration purposes and may not represent real companies, individuals, or data.
This document could include technical inaccuracies or typographical errors. Changes are periodically made to the information herein. These changes may be incorporated in new editions of this document. NetIQ Corporation may make improvements in or changes to the software described in this document at any time.
U.S. Government Restricted Rights: If the software and documentation are being acquired by or on behalf of the U.S. Government or by a U.S. Government prime contractor or subcontractor (at any tier), in accordance with 48 C.F.R. 227.7202-4 (for Department of Defense (DOD) acquisitions) and 48 C.F.R. 2.101 and 12.212 (for non-DOD acquisitions), the government’s rights in the software and documentation, including its rights to use, modify, reproduce, release, perform, display or disclose the software or documentation, will be subject in all respects to the commercial license rights and restrictions provided in the license agreement.
© 2013 NetIQ Corporation and its affiliates. All Rights Reserved.
For information about NetIQ trademarks, see https://www.netiq.com/company/legal/.

Contents
About this Book and the Library 5About NetIQ Corporation 7
1 Introducing AppManager for Microsoft SharePoint Server 9
2 Installing AppManager for Microsoft SharePoint Server 112.1 System Requirements . . . . . . . . . . . . . . . . . . . . . . . . . . . . . . . . . . . . . . . . . . . . . . . . . . . . . . . . . . . . 112.2 Scalability Considerations . . . . . . . . . . . . . . . . . . . . . . . . . . . . . . . . . . . . . . . . . . . . . . . . . . . . . . . . . 122.3 Installing the Module . . . . . . . . . . . . . . . . . . . . . . . . . . . . . . . . . . . . . . . . . . . . . . . . . . . . . . . . . . . . . 132.4 Silently Installing the Module . . . . . . . . . . . . . . . . . . . . . . . . . . . . . . . . . . . . . . . . . . . . . . . . . . . . . . . 152.5 Post-installation Considerations. . . . . . . . . . . . . . . . . . . . . . . . . . . . . . . . . . . . . . . . . . . . . . . . . . . . . 152.6 Configuring the PowerShell Execution Policy . . . . . . . . . . . . . . . . . . . . . . . . . . . . . . . . . . . . . . . . . . 202.7 Changing PowerShell Configuration Settings . . . . . . . . . . . . . . . . . . . . . . . . . . . . . . . . . . . . . . . . . . 232.8 Permissions for Running Knowledge Scripts . . . . . . . . . . . . . . . . . . . . . . . . . . . . . . . . . . . . . . . . . . . 242.9 Troubleshooting Configuration Errors . . . . . . . . . . . . . . . . . . . . . . . . . . . . . . . . . . . . . . . . . . . . . . . . 262.10 Discovering SharePoint Resources . . . . . . . . . . . . . . . . . . . . . . . . . . . . . . . . . . . . . . . . . . . . . . . . . . 282.11 Deploying the Module with Control Center. . . . . . . . . . . . . . . . . . . . . . . . . . . . . . . . . . . . . . . . . . . . . 28
3 SharePoint Knowledge Scripts 313.1 BytesTransfer . . . . . . . . . . . . . . . . . . . . . . . . . . . . . . . . . . . . . . . . . . . . . . . . . . . . . . . . . . . . . . . . . . . 323.2 ConnectionsInterval . . . . . . . . . . . . . . . . . . . . . . . . . . . . . . . . . . . . . . . . . . . . . . . . . . . . . . . . . . . . . . 333.3 ContentDatabaseAccessibility . . . . . . . . . . . . . . . . . . . . . . . . . . . . . . . . . . . . . . . . . . . . . . . . . . . . . . 353.4 ContentManagementEventLog . . . . . . . . . . . . . . . . . . . . . . . . . . . . . . . . . . . . . . . . . . . . . . . . . . . . . 363.5 DBSiteCount . . . . . . . . . . . . . . . . . . . . . . . . . . . . . . . . . . . . . . . . . . . . . . . . . . . . . . . . . . . . . . . . . . . 383.6 DBSpaceUtil . . . . . . . . . . . . . . . . . . . . . . . . . . . . . . . . . . . . . . . . . . . . . . . . . . . . . . . . . . . . . . . . . . . . 393.7 ExtendedWebApplications . . . . . . . . . . . . . . . . . . . . . . . . . . . . . . . . . . . . . . . . . . . . . . . . . . . . . . . . . 413.8 FASTSearchServerStatus . . . . . . . . . . . . . . . . . . . . . . . . . . . . . . . . . . . . . . . . . . . . . . . . . . . . . . . . . 423.9 GenericEventLog . . . . . . . . . . . . . . . . . . . . . . . . . . . . . . . . . . . . . . . . . . . . . . . . . . . . . . . . . . . . . . . . 443.10 HealthAnalyzer . . . . . . . . . . . . . . . . . . . . . . . . . . . . . . . . . . . . . . . . . . . . . . . . . . . . . . . . . . . . . . . . . . 463.11 HealthCheck. . . . . . . . . . . . . . . . . . . . . . . . . . . . . . . . . . . . . . . . . . . . . . . . . . . . . . . . . . . . . . . . . . . . 473.12 InfoPathEventLog. . . . . . . . . . . . . . . . . . . . . . . . . . . . . . . . . . . . . . . . . . . . . . . . . . . . . . . . . . . . . . . . 493.13 IsolatedApps . . . . . . . . . . . . . . . . . . . . . . . . . . . . . . . . . . . . . . . . . . . . . . . . . . . . . . . . . . . . . . . . . . . 513.14 MailServerStatus . . . . . . . . . . . . . . . . . . . . . . . . . . . . . . . . . . . . . . . . . . . . . . . . . . . . . . . . . . . . . . . . 523.15 RecycleBinInfo . . . . . . . . . . . . . . . . . . . . . . . . . . . . . . . . . . . . . . . . . . . . . . . . . . . . . . . . . . . . . . . . . . 533.16 Report_ServerUptime . . . . . . . . . . . . . . . . . . . . . . . . . . . . . . . . . . . . . . . . . . . . . . . . . . . . . . . . . . . . 563.17 Report_SiteInfo . . . . . . . . . . . . . . . . . . . . . . . . . . . . . . . . . . . . . . . . . . . . . . . . . . . . . . . . . . . . . . . . . 583.18 Report_SiteUsage . . . . . . . . . . . . . . . . . . . . . . . . . . . . . . . . . . . . . . . . . . . . . . . . . . . . . . . . . . . . . . . 613.19 Report_WebPartInfo . . . . . . . . . . . . . . . . . . . . . . . . . . . . . . . . . . . . . . . . . . . . . . . . . . . . . . . . . . . . . 633.20 SearchStatus . . . . . . . . . . . . . . . . . . . . . . . . . . . . . . . . . . . . . . . . . . . . . . . . . . . . . . . . . . . . . . . . . . . 653.21 ServerUptime . . . . . . . . . . . . . . . . . . . . . . . . . . . . . . . . . . . . . . . . . . . . . . . . . . . . . . . . . . . . . . . . . . . 663.22 SiteCollectionUserCount . . . . . . . . . . . . . . . . . . . . . . . . . . . . . . . . . . . . . . . . . . . . . . . . . . . . . . . . . . 673.23 SiteEventLog . . . . . . . . . . . . . . . . . . . . . . . . . . . . . . . . . . . . . . . . . . . . . . . . . . . . . . . . . . . . . . . . . . . 693.24 SiteInfo . . . . . . . . . . . . . . . . . . . . . . . . . . . . . . . . . . . . . . . . . . . . . . . . . . . . . . . . . . . . . . . . . . . . . . . . 703.25 SiteUsage. . . . . . . . . . . . . . . . . . . . . . . . . . . . . . . . . . . . . . . . . . . . . . . . . . . . . . . . . . . . . . . . . . . . . . 723.26 VisualModeSiteCount. . . . . . . . . . . . . . . . . . . . . . . . . . . . . . . . . . . . . . . . . . . . . . . . . . . . . . . . . . . . . 75
Contents 3

3.27 WebApplicationUptime. . . . . . . . . . . . . . . . . . . . . . . . . . . . . . . . . . . . . . . . . . . . . . . . . . . . . . . . . . . . 763.28 WebPagePerf . . . . . . . . . . . . . . . . . . . . . . . . . . . . . . . . . . . . . . . . . . . . . . . . . . . . . . . . . . . . . . . . . . . 773.29 WebPartInfo . . . . . . . . . . . . . . . . . . . . . . . . . . . . . . . . . . . . . . . . . . . . . . . . . . . . . . . . . . . . . . . . . . . . 79
4 NetIQ AppManager for Microsoft SharePoint Server Management Guide

About this Book and the Library
The NetIQ AppManager product (AppManager) is a comprehensive solution for managing, diagnosing, and analyzing performance, availability, and health for a broad spectrum of operating environments, applications, services, and server hardware.
AppManager provides system administrators with a central, easy-to-use console to view critical server and application resources across the enterprise. With AppManager, administrative staff can monitor computer and application resources, check for potential problems, initiate responsive actions, automate routine tasks, and gather performance data for real-time and historical reporting and analysis.
Intended AudienceThis guide provides information for individuals responsible for installing an AppManager module and monitoring specific applications with AppManager.
Other Information in the LibraryThe library provides the following information resources:
Installation Guide for AppManager Provides complete information about AppManager pre-installation requirements and step-by-step installation procedures for all AppManager components.
User Guide for AppManager Control Center Provides complete information about managing groups of computers, including running jobs, responding to events, creating reports, and working with Control Center. A separate guide is available for the AppManager Operator Console.
Administrator Guide for AppManager Provides information about maintaining an AppManager management site, managing security, using scripts to handle AppManager tasks, and leveraging advanced configuration options.
Upgrade and Migration Guide for AppManager Provides complete information about how to upgrade from a previous version of AppManager.
Management guides Provide information about installing and monitoring specific applications with AppManager.
Help Provides context-sensitive information and step-by-step guidance for common tasks, as well as definitions for each field on each window.
The AppManager library is available in Adobe Acrobat (PDF) format from the AppManager Documentation page of the NetIQ Web site.
About this Book and the Library 5

6 NetIQ AppManager for Microsoft SharePoint Server Management Guide

About NetIQ Corporation
We are a global, enterprise software company, with a focus on the three persistent challenges in your environment: Change, complexity and risk—and how we can help you control them.
Our ViewpointAdapting to change and managing complexity and risk are nothing new
In fact, of all the challenges you face, these are perhaps the most prominent variables that deny you the control you need to securely measure, monitor, and manage your physical, virtual, and cloud computing environments.
Enabling critical business services, better and faster We believe that providing as much control as possible to IT organizations is the only way to enable timelier and cost effective delivery of services. Persistent pressures like change and complexity will only continue to increase as organizations continue to change and the technologies needed to manage them become inherently more complex.
Our PhilosophySelling intelligent solutions, not just software
In order to provide reliable control, we first make sure we understand the real-world scenarios in which IT organizations like yours operate — day in and day out. That's the only way we can develop practical, intelligent IT solutions that successfully yield proven, measurable results. And that's so much more rewarding than simply selling software.
Driving your success is our passion We place your success at the heart of how we do business. From product inception to deployment, we understand that you need IT solutions that work well and integrate seamlessly with your existing investments; you need ongoing support and training post-deployment; and you need someone that is truly easy to work with — for a change. Ultimately, when you succeed, we all succeed.
Our SolutionsIdentity & Access Governance Access Management Security Management Systems & Application Management Workload Management Service Management
About NetIQ Corporation 7

Contacting Sales SupportFor questions about products, pricing, and capabilities, contact your local partner. If you cannot contact your partner, contact our Sales Support team.
Contacting Technical SupportFor specific product issues, contact our Technical Support team.
Contacting Documentation SupportOur goal is to provide documentation that meets your needs. The documentation for this product is available on the NetIQ Web site in HTML and PDF formats on a page that does not require you to log in. If you have suggestions for documentation improvements, click comment on this topic at the bottom of any page in the HTML version of the documentation posted at www.netiq.com/documentation. You can also email [email protected]. We value your input and look forward to hearing from you.
Contacting the Online User CommunityNetIQ Communities, the NetIQ online community, is a collaborative network connecting you to your peers and NetIQ experts. By providing more immediate information, useful links to helpful resources, and access to NetIQ experts, NetIQ Communities helps ensure you are mastering the knowledge you need to realize the full potential of IT investments upon which you rely. For more information, visit community.netiq.com.
Worldwide: www.netiq.com/about_netiq/officelocations.asp
United States and Canada: 1-888-323-6768
Email: [email protected]
Web Site: www.netiq.com
Worldwide: www.netiq.com/support/contactinfo.asp
North and South America: 1-713-418-5555
Europe, Middle East, and Africa: +353 (0) 91-782 677
Email: [email protected]
Web Site: www.netiq.com/support
8 NetIQ AppManager for Microsoft SharePoint Server Management Guide

1 1Introducing AppManager for Microsoft SharePoint Server
AppManager for Microsoft SharePoint Server enables you to identify and monitor the availability and connectivity of your Microsoft SharePoint servers and server databases. This product supports Microsoft SharePoint Server 2013, Microsoft SharePoint Server 2010 and Microsoft Office SharePoint Server 2007. The Knowledge Scripts provide a complete view of how SharePoint performs in your environment.
AppManager for Microsoft SharePoint Server allows you to:
Monitor the complete SharePoint Server environment.Display all available servers within the SharePoint Server environment, including newly added, modified, or deleted servers.Monitor database space usage by different SharePoint servers.Monitor the event logs for Infopath Forms, Content Management, and generic error events.Monitor the number of bytes transferred per second to and from a SharePoint Web application.Monitor the status and health of SharePoint services and Web applications, as well as the uptime of Web applications on the SharePoint server.Monitor the number of site collections on each SharePoint content database in the server farm, as well as the number of users in a site collection. Monitor the extended Web applications and the mail server status in the server farm. Monitor the default Search service and crawl status in the SharePoint server farm. Monitor Recycle Bin usage for all Web applications running on the SharePoint server, and ensure the Recycle Bin does not exceed the site quota.Track the availability and performance of Web pages in a Web application within the SharePoint Server environment. Monitor and report on how long the SharePoint server has been running since the last reboot.Monitor and report on space utilization and date information for each Web application on the SharePoint server.Monitor and report on the usage information for each Web application on the SharePoint server.Monitor and report on the performance of Web Parts in the SharePoint Server environment.Monitor the accessibility of SharePoint content databases for the Web applications running on the SharePoint server.Monitor the status of the SharePoint FAST Search Server. (SharePoint Server 2010)Monitor the SharePoint Health Analyzer tool, which can automatically check for configuration, performance and usage problems in the SharePoint server farm. (SharePoint Server 2010 or later)Monitor the Visual Mode Site count for each Web application, site collection, and sub-site. (SharePoint Server 2010 or later)
Introducing AppManager for Microsoft SharePoint Server 9

10 NetIQ AppManager for Microsoft SharePoint Server Management Guide

2 2Installing AppManager for Microsoft SharePoint Server
This chapter provides installation instructions and describes system requirements for AppManager for Microsoft SharePoint Server.
This chapter assumes you have AppManager installed. For more information about installing AppManager or about AppManager system requirements, see the Installation Guide for AppManager, which is available on the AppManager Documentation page.
2.1 System RequirementsFor the latest information about supported software versions and the availability of module updates, visit the AppManager Supported Products page. Unless noted otherwise, this module supports all updates, hotfixes, and service packs for the releases listed below.
AppManager for Microsoft SharePoint Server has the following system requirements:
Software/Hardware Version
NetIQ AppManager installed on the AppManager repository (QDB) computers, on the SharePoint computers you want to monitor (AppManager agents), and on all console computers
AppManager 8 Service Pack 2 (8.0.2) or later, or AppManager 7.0.4
The following hotfixes are required for AppManager 7.0.4:
AppManager Repository (QDB) hotfix 72040 and hotfix 72794.
AppManager Operator Console hotfix 72212.
AppManager Management Server hotfix 72041.
AppManager Client Communication Manager and NetIQ AppManager Client Resource Monitor hotfix 72616.
To support computers running Windows Server 2008, AppManager Windows Agent hotfix 71704 or later is required.
Important You must install all hotfixes before installing this release of the module. For more information about hotfixes, see the AppManager Suite Hotfixes page, or contact NetIQ Technical Support.
Microsoft Windows operating system on agent computers
One of the following:
Windows Server 2012
Windows Server 2008 R2
Windows Server 2008 (32-bit or 64-bit)
Windows Server 2003 R2 (32-bit or 64-bit)
Installing AppManager for Microsoft SharePoint Server 11

2.2 Scalability ConsiderationsConsider the following recommendations before deploying AppManager for Microsoft SharePoint Server:
Use an AppManager agent computer that meets the following minimum requirements:Dual Core/Dual vCPU 2.4 GHz (or higher)2 GB RAM, in addition to the RAM needed for Microsoft SharePoint on the server
Follow these Knowledge Script suggestions:Use monitoring policies to allow the monitoring jobs to be automatically updated when changes in the environment, such as a new Web application, are discovered.
NOTE: A monitoring policy is applied on the agent and runs an AppManager job for each Knowledge Script in the KSG. A monitoring policy may apply to many objects, and in the largest environments may not work for configuring AppManager. For assistance with configuring Knowledge Scripts and Knowledge Script Groups in a large environment, contact NetIQ Technical Support.
Ad hoc jobs do not automatically update when changes in the environment, such as a new Web application, are discovered. You must manually update a job to reflect changes to the environment. Stagger the start time of jobs, especially jobs that monitor Web applications, so they do not all start at the same time. Do this by specifying a daily schedule with a frequency of X minutes with a different start time for each job. For example, to monitor every 5 minutes, specify a daily schedule with a frequency of 5 minutes starting at 12:00:00 for the first job, 12:01:00 for the second job, and so on. Do not specify a schedule of regular intervals every 5 minutes.
Consider the following when collecting data and raising events:Schedule jobs that monitor Web applications to start during off-peak hours, such as in the evening or on the weekend. This includes the following Knowledge Scripts: SharePoint_IsolateApps, SharePoint_RecycleBinInfo, SharePoint_SiteInfo, SharePoint_WebPagePerf, and SharePoint_WebPartInfo.
AppManager for Microsoft Windows module installed on repository, agent, and console computers
7.6.170.0 or later. For more information, see the AppManager Module Upgrades & Trials page.
Microsoft SharePoint Server and related applications on the agent computers
One of the following:
Microsoft SharePoint Server 2013
Microsoft SharePoint Server 2010
Microsoft Office SharePoint Server 2007
Microsoft .NET Framework installed on the agent computers
Version 3.5 or later
Microsoft Windows PowerShell installed on the agent computers
Version 2.0 or later
Software/Hardware Version
12 NetIQ AppManager for Microsoft SharePoint Server Management Guide

In large environments, increase the default schedule of the SharePoint_WebPart Info Knowledge Script from every 30 minutes. NetIQ Corporation recommends every 3 hours. For Knowledge Scripts that monitor Web applications and SharePoint content databases, run these jobs on just one server in the SharePoint Server farm because each job you run will display the same information for every server in the farm.
2.3 Installing the ModuleRun the module installer only once on any computer. The module installer automatically identifies and updates all relevant AppManager components on a computer.
Access the AM70-SharePoint-7.x.x.0.msi module installer from the AM70_SharePoint_7.x.x.0 self-extracting installation package on the AppManager Module Upgrades & Trials page.
If you are upgrading from version 7.2, uninstall version 7.2 and perform additional steps to install version 7.4 or later correctly. For more information, see Section 2.3.2, “Upgrading from Version 7.2 or later versions of the Module,” on page 14.
For Windows environments where User Account Control (UAC) is enabled, install the module using an account with administrative privileges. Use one of the following methods:
Log in to the server using the account named Administrator. Then run AM70-SharePoint-7.x.x.0.msi from a command prompt or by double-clicking it.Log in to the server as a user with administrative privileges and run AM70-SharePoint.x.x.0.msi as an administrator from a command prompt. To open a command-prompt window at the administrative level, right-click a command-prompt icon or a Windows menu item and select Run as administrator.
You can install the Knowledge Scripts into local or remote AppManager repositories (QDBs). Install these components only once per QDB.
The module installer now installs Knowledge Scripts for each module directly into the QDB instead of installing the scripts in the \AppManager\qdb\kp folder as in previous releases of AppManager.
2.3.1 Manually Installing the ModuleYou can install the module manually, or you can use Control Center to deploy the module on a remote computer where an agent is installed. For more information, see Section 2.11, “Deploying the Module with Control Center,” on page 28. However, if you do use Control Center to deploy the module, Control Center only installs the agent components of the module. The module installer installs the QDB and console components as well as the agent components on the agent computer.
To install the module manually:
1 Double-click the module installer .msi file. 2 Accept the license agreement. 3 Review the results of the pre-installation check. You can expect one of the following three
scenarios:No AppManager agent is present: In this scenario, the pre-installation check fails, and the installer does not install agent components.An AppManager agent is present, but some other prerequisite fails: In this scenario, the default is to not install agent components because of one or more missing prerequisites. However, you can override the default by selecting Install agent component locally. A
Installing AppManager for Microsoft SharePoint Server 13

missing application server for this particular module often causes this scenario. For example, installing the AppManager for Microsoft SharePoint module requires the presence of a Microsoft SharePoint server on the selected computer.All prerequisites are met: In this scenario, the installer installs the agent components.
4 To install the Knowledge Scripts into the QDB:4a Select Install Knowledge Scripts to install the repository components, including the
Knowledge Scripts, object types, and SQL stored procedures.4b Specify the SQL Server name of the server hosting the QDB, as well as the case-sensitive
QDB name. 5 (Conditional) If you use Control Center 7.x, run the module installer for each QDB attached to
Control Center. 6 (Conditional) If you use Control Center 8.x, run the module installer only for the primary QDB,
and Control Center will automatically replicate this module to secondary QDBs.7 Run the module installer on all console computers to install the Help and console extensions.8 Run the module installer on the Microsoft SharePoint computers you want to monitor (agents) to
install the agent components.9 Perform all required post-installation tasks, such as verifying services and enabling logging. For
more information, see Section 2.5, “Post-installation Considerations,” on page 15.10 (Conditional) If you have not discovered Microsoft SharePoint resources, run the
Discovery_SharePoint Knowledge Script on all agent computers where you installed the module. For more information, see Section 2.10, “Discovering SharePoint Resources,” on page 28.
After the installation has completed, the SharePoint_Install.log file, located in the \NetIQ\Temp\NetIQ_Debug\ServerName folder, lists any problems that occurred.
2.3.2 Upgrading from Version 7.2 or later versions of the ModuleIf you are upgrading from version 7.2 to a more recent version of the module, you need to uninstall version 7.2 and then install the recent version of the module on each SharePoint agent, AppManager repository (QDB), and console.
If you are upgrading from version 7.4 to the recent version of the module, install the recent version on each SharePoint Server agent, AppManager repository (QDB), and console.
Version 7.4 and later versions of the module use PowerShell scripts throughout the module, so you must set the PowerShell execution policy. For more information, see Section 2.6, “Configuring the PowerShell Execution Policy,” on page 20.
This section describes the tasks required to upgrade from version 7.2 or later to version 7.4 or later of the module.
To upgrade from version 7.2 or later to recent version:
1 Stop the ad hoc jobs and remove all SharePoint monitoring policies.2 (Conditional) To upgrade from version 7.2 to version 7.4 or later, uninstall version 7.2 of the
module from agent computers.3 Install the latest version of the module on all AppManager repositories (QDBs), consoles, and
agents. For more information about running the installer, see Section 2.3, “Installing the Module,” on page 13.
14 NetIQ AppManager for Microsoft SharePoint Server Management Guide

4 The module installer automatically runs the Discovery Knowledge Script. If it does not, manually run Discovery_SharePoint. For more information about the Discovery Knowledge Script, see Section 2.10, “Discovering SharePoint Resources,” on page 28.
5 Re-create the ad hoc jobs and create new SharePoint monitoring policies.
2.4 Silently Installing the ModuleTo silently (without user intervention) install a module using the default settings, run the following command from the folder in which you saved the module installer:
msiexec.exe /i "AM70-SharePoint-7.x.x.0.msi" /qn
where x.x is the actual version number of the module installer.
To create a log file that describes the operations of the module installer, add the following flag to the command noted above:
/L* "AM70-SharePoint-7.x.x.0.msi.log"
The log file is created in the folder in which you saved the module installer.
NOTE: To perform a silent install on an AppManager agent running Windows 2008 R2, open a command prompt at the administrative level and select Run as administrator before you run the silent install command listed above.
To silently install the module on a remote AppManager repository, you can use Windows authentication or SQL authentication.
In a 32-bit environment, the default path to the NetIQ_Debug folder is:
C:\Program Files\NetIQ\Temp\
Windows authentication:
msiexec /i "MSIFilePath \AM70-SharePoint-7.x.x.0.msi" /Lv "DebugFolderPath \NetIQ_Debug\SharePoint7.x.x.msi.log" /qn MO_B_QDBINSTALL=1 MO_B_MOINSTALL=0 AM_B_CALLED_FRM_AMSETUP=1 MO_B_SQLSVR_WINAUTH=1 MO_SQLSVR_NAME=SQL Server\Instance MO_QDBNAME=AMRepositoryName
SQL authentication:
msiexec /i "MSIFilePath \AM70-SharePoint-7.x.x.0.msi" /Lv "DebugFolderPath \NetIQ_Debug\SharePoint7.x.x.msi.log" /qn MO_B_QDBINSTALL=1 MO_B_MOINSTALL=0 AM_B_CALLED_FRM_AMSETUP=1 MO_B_SQLSVR_WINAUTH=0 MO_SQLSVR_USER= SQLLogin MO_SQLSVR_PWD=SQLLoginPassword MO_SQLSVR_NAME=SQL Server\Instance MO_QDBNAME=AMRepositoryName
2.5 Post-installation ConsiderationsThis section describes how to configure AppManager to enable this module to discover and work with your SharePoint environment.
Installing AppManager for Microsoft SharePoint Server 15

2.5.1 Verifying SharePoint-related ServicesThe pre-installation checker makes sure the relevant SharePoint-related services are running before you install the module. Based on the type of server you are installing, the SharePoint installation starts the required services.
If you are using SharePoint in a distributed environment, each server will display a list of services specific to the version of SharePoint that the server is running.
Verifying SharePoint Server ServicesUse the following steps to verify whether SharePoint-related services are present.
To verify whether the SharePoint-related services are present:
1 From the Control Panel, select Services from the Administrative Tools folder.2 (Conditional) If the server is running Microsoft SharePoint 2013, the Services window displays
the following services in the list:SharePoint Administration SharePoint Search Host ControllerSharePoint Server Search 15SharePoint Timer ServiceSharePoint Tracing ServiceSharePoint User Code HostSharePoint VSS WriterWorld Wide Web Publishing ServiceForefront Identity Manager ServiceForefront Identity Manager Synchronization Service
3 (Conditional) If the server is running Microsoft SharePoint 2010, the Services window displays the following services in the list:
SharePoint 2010 AdministrationSharePoint 2010 TimerSharePoint 2010 TracingSharePoint 2010 User Code HostSharePoint 2010 VSS WriterSharePoint Foundation Search V4SharePoint Server Search 14World Wide Web Publishing ServiceForefront Identity Manager ServiceForefront Identity Manager Synchronization Service
4 (Conditional) If the server is running Microsoft Office SharePoint Server 2007, the Services window displays the following services in the list:
Windows SharePoint Services AdministrationWindows SharePoint Services SearchWindows SharePoint Services Timer
16 NetIQ AppManager for Microsoft SharePoint Server Management Guide

Windows SharePoint Services TracingWindows SharePoint Services VSSMicrosoft Single Sign-on ServiceWorld Wide Web Publishing Service
2.5.2 Enabling Usage LoggingWhen you enable usage logging, AppManager for Microsoft SharePoint Server tracks and reports usage data for your SharePoint environment. After you enable usage logging, you can run the SiteUsage and WebPagePerf Knowledge Scripts on a SharePoint server to gather site usage and Web page performance information. To enable usage logging, you must be a member of the Farm Administrators SharePoint group.
The following sections describe how to enable usage logging for SharePoint Server 2013, SharePoint Server 2010 and SharePoint Server 2007.
Enabling Usage Logging in SharePoint Server 2013This section describes how to enable usage logging and health data collection for SharePoint Server 2013.
To enable usage logging in SharePoint Server 2013:
1 Open SharePoint Central Administration and click Monitoring.2 In the Reporting section, click Configure usage and health data collection.3 In the Usage Data Collection section, select Enable usage data collection. Ensure that the events
you want to log are selected in the Event Selection section. By default, all events are selected.4 (Optional) If you want to log information about specific resources, data, and processes at certain
points in time, select Enable health data collection in the Health Data Collection section.5 Click OK.
Enabling Usage Logging in SharePoint Server 2010This section describes how to enable usage logging and health data collection for SharePoint Server 2010.
To enable usage logging in SharePoint Server 2010:
1 Open SharePoint Central Administration and click Monitoring.2 In the Reporting section, click Configure usage and health data collection.3 In the Usage Data Collection section, select Enable usage data collection. Ensure that the events
you want to log are selected in the Event Selection section. By default, all events are selected.4 (Optional) If you want to log information about specific resources, data, and processes at certain
points in time, select Enable health data collection in the Health Data Collection section.5 Click OK.6 To verify the settings in Central Administration, click Manage service applications in the
Application Management section.7 Click WSS_UsageApplication.8 Verify that Enable usage data collection is selected.
Installing AppManager for Microsoft SharePoint Server 17

Enabling Usage Logging in SharePoint Server 2007This section describes how to enable usage logging and usage analysis processing for SharePoint Server 2007.
To enable usage logging in SharePoint Server 2007:
1 Open SharePoint Central Administration and click the Operations tab.2 In the Logging and Reporting section, click Usage analysis processing.3 In the Logging Settings section, select Enable Logging.4 In the Log file location field, type the location for the log files. The default location is:
C:\Program Files\Common Files\Microsoft Shared\Web Server Extensions\12\Logs
5 In the Number of log files to create field, type a number. Valid values are between 1 and 30.6 In the Processing Settings section, select Enable usage analysis processing.7 In the Run processing between these times daily fields, specify the time range for running
usage processing.8 Click OK.
2.5.3 Enabling Usage ReportingBy enabling usage reporting, you can create reports that track what users are doing and how they are using a site. After you enable usage reporting, you can run the SiteUsage Knowledge Script on a SharePoint server to gather site usage information.
For SharePoint Server 2010 and later, reporting is enabled by default.
Enabling Usage Reporting in SharePoint Server 2007Before you can enable usage reporting for Shared Services in SharePoint Server 2007, you must configure the Index Server and the Primary Shared Services Provider.
For more information about configuring the Index Server, see http://technet.microsoft.com/en-us/library/dd256003%28v=office.12%29.aspx.For more information about configuring the Primary Shared Services Provider, see http://technet.microsoft.com/en-us/library/cc262649%28v=office.12%29.aspx.
To enable usage reporting from Shared Services in SharePoint Server 2007:
1 Ensure that you have configured the Index Server and the Primary Shared Services Provider. For more information, see the links in the introduction to this section.
2 Open SharePoint Central Administration.3 In the Shared Services Administration section, click the default shared service.4 On the Home page of the default shared service, click Usage reporting in the Office SharePoint
Usage Reporting section.5 In the Processing Settings section, select Enable advanced usage analysis processing.6 In the Search Query Logging section, select Enable search query logging.7 Click OK.
18 NetIQ AppManager for Microsoft SharePoint Server Management Guide

2.5.4 Enabling Web Application ReportingAfter you enable reporting on the Microsoft SharePoint server, you can run the SiteUsage Knowledge Script to monitor site usage information.
For SharePoint Server 2010 and later, reporting is enabled by default.
Enabling Web Application Reporting in SharePoint Server 2007In SharePoint 2007, you activate Web application usage reporting to make the reports available. You can access collected data for reports 24 hours after you enable them.
To enable reporting using Microsoft SharePoint Server 2007:
1 Open SharePoint Central Administration.2 From the Site Actions tab, click Site Settings.3 In the Site Collection Administration section, click Site collection features.4 Scroll down to the Reporting section and click Activate.
2.5.5 Allocating Storage Space for a SharePoint Site CollectionMicrosoft SharePoint Server allows you to allocate storage space for the SharePoint site collection. You can also calculate the amount of space used by the Recycle Bin. After you allocate site quota for a SharePoint site collection, you can run the RecycleBinInfo Knowledge Script on a SharePoint server.
To allocate site quota for a SharePoint site collection:
1 Open SharePoint Central Administration.2 Click Application Management and do one of the following:
(Conditional) If you are running SharePoint Server 2010 or later, in the Site Collections section, click Configure quotas and locks.(Conditional) If you are running SharePoint Server 2007, in the SharePoint Site Management section, click Site collection quotas and locks.
3 In the Site Collection section, select the URL for your site collection.4 In the Site Quota Information section, in the Current quota template box, select Individual
Quota.5 Click OK. By default, the storage limit of a personal site is 100 MB.6 Modify settings for a personal site by doing one of the following:
(Conditional) If you are running SharePoint Server 2010 or later, select Specify quota templates in the SharePoint Site Collections section.(Conditional) If you are running SharePoint Server 2007, select Quota templates in the SharePoint Site Management section.
7 On the Quota Templates page, in the Template Name section, edit an existing quota template or create a new template.
8 In the Storage Limit Values section, in the Limit site storage to a maximum of field, specify the maximum amount of storage space to allocate.
9 Click OK.
Installing AppManager for Microsoft SharePoint Server 19

2.6 Configuring the PowerShell Execution PolicyThis section describes the procedure for configuring the Microsoft PowerShell Execution Policy. The PowerShell Execution Policy determines whether PowerShell scripts are allowed to run.
2.6.1 Understanding PowerShell CmdletsMicrosoft SharePoint 2010 and later uses the Microsoft scripting and command environment known as PowerShell. PowerShell is made up of hundreds of executable objects called cmdlets, pronounced command-lets.
When running the SharePoint category of Knowledge Scripts, AppManager makes a series of calls to PowerShell and the SharePoint 2010 or later cmdlets. AppManager executes the cmdlets to manipulate SharePoint 2010 or later objects. For SharePoint 2007 objects, AppManager uses PowerShell scripts to call the SharePoint 2007 Application Programming Interface (API).
For more information about using PowerShell, see your Microsoft PowerShell documentation.
2.6.2 Configuring the PowerShell Execution PolicyThe PowerShell Execution Policy determines whether PowerShell scripts are allowed to run. By default, the Execution Policy is set to Restricted. If you try to run scripts under the Restricted policy, AppManager generates error messages.
The Execution Policy directly affects the SharePoint Knowledge Scripts. Although the scripts that ship with SharePoint 2007, or later are written in VBScript and installed as scriptname.qml, the logic for the scripts is contained in complementary PowerShell scripts that are installed on the agent computer along with the module. The PowerShell scripts use the same name as the SharePoint Knowledge Scripts, but with a .ps1 extension.
NOTE: The digital signature encoded in an SharePoint Knowledge Script is tied to the contents of the script. If you change the script, the signature is no longer valid and you cannot execute the script. If you change a SharePoint Knowledge Script, you must do one of the following:
Re-sign the scripts using your own digital certificate.Change the Execution Policy to either RemoteSigned or Unrestricted. A group policy that governs script execution overrides any policy changes you make with the Set-ExecutionPolicy cmdlet. For example, if the group policy forbids script execution, you cannot change the policy by running Set-ExecutionPolicy. First change the group policy to allow script execution, and then run Set-ExecutionPolicy to select a specific Execution Policy.
Before AppManager can execute the PowerShell scripts, you must change the Execution Policy from Restricted to one of the following policy options:
AllSigned, which allows execution of scripts that have been digitally signed by a trusted publisher. If you select the AllSigned policy, perform the steps outlined in Section 2.6.3, “Trusting SharePoint PowerShell Scripts,” on page 21.RemoteSigned, which allows local scripts to run regardless of signature, and requires trusted digital signatures only for remote scripts. SharePoint Knowledge Scripts are local scripts.Unrestricted, which allows both local and remote scripts to run, regardless of signature.
20 NetIQ AppManager for Microsoft SharePoint Server Management Guide

To change the PowerShell Execution Policy:
1 Open the SharePoint Command Shell on the agent computer.2 Run the following cmdlet:
Set-ExecutionPolicy policy
where policy is the name of the Execution Policy you choose.3 Repeat Step 1 and Step 2 on all agent computers that are members of the SharePoint server farm.
2.6.3 Trusting SharePoint PowerShell ScriptsWhen a PowerShell script is executed under an AllSigned policy, PowerShell verifies that the script contains a digital signature and that the signature is associated with a trusted publisher. NetIQ Corporation signs the SharePoint PowerShell scripts. If you use the AllSigned policy, you must choose to trust NetIQ Corporation by importing the NetIQ Corporation digital certificate into the local certificate store on each SharePoint server in your environment.
You can import the digital certificate by running one of the SharePoint PowerShell scripts from the command line.
To import the digital certificate:
1 Open the Windows PowerShell Command Shell on the agent computer.2 Change to the AppManager\bin\PowerShell\Scripts directory.3 Type .\SharePoint_GenericEventLog.ps14 Press Enter.5 Type A at the prompt asking whether the script should be allowed to run. 6 Press Enter.
These steps allow the NetIQ Corporation digital certificate to be imported into the certificate store for the user running the script. Run any script once to establish trust.
At this point, trust is established only between NetIQ Corporation and the user running the script. Trust is not established for any other user. If the AppManager agent runs under a different user account such as Local System, a domain account, or a local computer account, the agent will not have a trust relationship and will not be allowed to execute the SharePoint PowerShell scripts.
To extend trust to all other user accounts, see Section 2.6.4, “Extending Trust to All User Accounts,” on page 21.
2.6.4 Extending Trust to All User AccountsTo execute PowerShell scripts under the AllSigned Execution Policy, extend trust to all user accounts. Extending trust is a two-phase process that involves exporting the digital certificate from the current user and importing the digital certificate to all users on the local computer.
Installing AppManager for Microsoft SharePoint Server 21
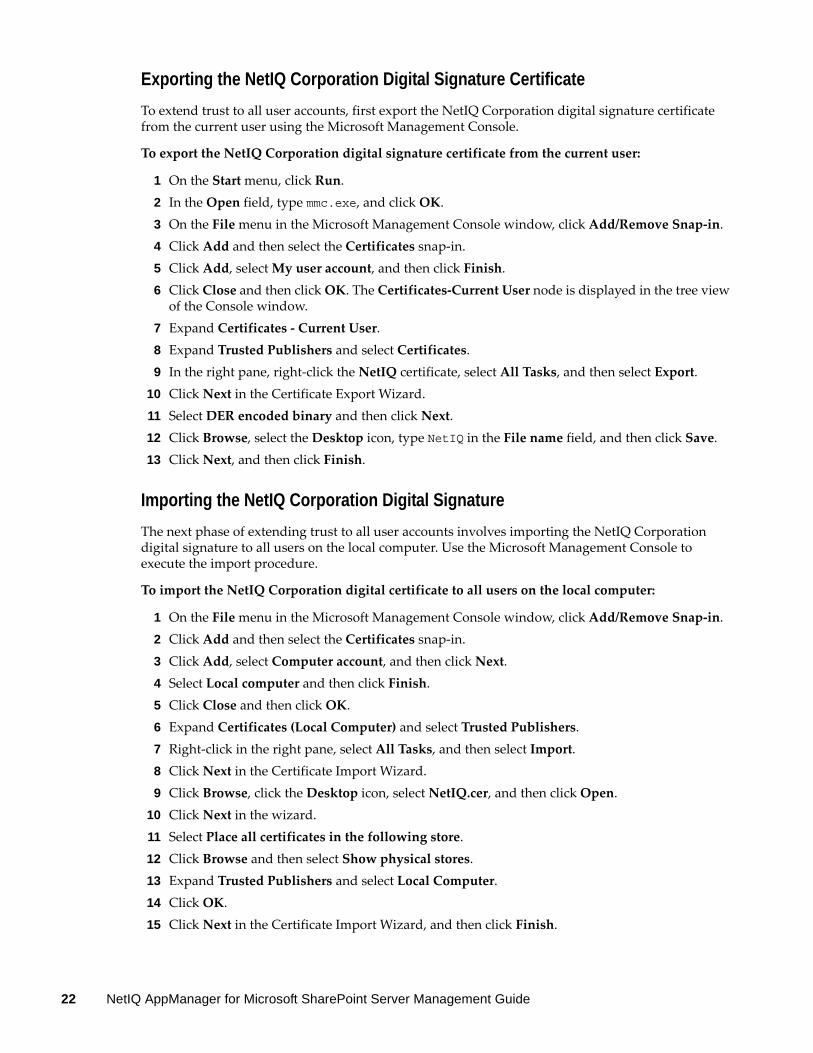
Exporting the NetIQ Corporation Digital Signature CertificateTo extend trust to all user accounts, first export the NetIQ Corporation digital signature certificate from the current user using the Microsoft Management Console.
To export the NetIQ Corporation digital signature certificate from the current user:
1 On the Start menu, click Run.2 In the Open field, type mmc.exe, and click OK.3 On the File menu in the Microsoft Management Console window, click Add/Remove Snap-in. 4 Click Add and then select the Certificates snap-in.5 Click Add, select My user account, and then click Finish.6 Click Close and then click OK. The Certificates-Current User node is displayed in the tree view
of the Console window.7 Expand Certificates - Current User.8 Expand Trusted Publishers and select Certificates.9 In the right pane, right-click the NetIQ certificate, select All Tasks, and then select Export.
10 Click Next in the Certificate Export Wizard.11 Select DER encoded binary and then click Next.12 Click Browse, select the Desktop icon, type NetIQ in the File name field, and then click Save.13 Click Next, and then click Finish.
Importing the NetIQ Corporation Digital SignatureThe next phase of extending trust to all user accounts involves importing the NetIQ Corporation digital signature to all users on the local computer. Use the Microsoft Management Console to execute the import procedure.
To import the NetIQ Corporation digital certificate to all users on the local computer:
1 On the File menu in the Microsoft Management Console window, click Add/Remove Snap-in. 2 Click Add and then select the Certificates snap-in.3 Click Add, select Computer account, and then click Next. 4 Select Local computer and then click Finish.5 Click Close and then click OK. 6 Expand Certificates (Local Computer) and select Trusted Publishers.7 Right-click in the right pane, select All Tasks, and then select Import.8 Click Next in the Certificate Import Wizard.9 Click Browse, click the Desktop icon, select NetIQ.cer, and then click Open.
10 Click Next in the wizard.11 Select Place all certificates in the following store.12 Click Browse and then select Show physical stores.13 Expand Trusted Publishers and select Local Computer.14 Click OK.15 Click Next in the Certificate Import Wizard, and then click Finish.
22 NetIQ AppManager for Microsoft SharePoint Server Management Guide

After you complete both the phases of the trust process, the NetIQ Corporation certificate is contained in the certificate store for the local computer, allowing all users to execute the PowerShell scripts.
2.7 Changing PowerShell Configuration SettingsAppManager for Microsoft SharePoint Server includes the following components:
A client object, MCPSHostClient.dll, which runs within the AppManager agent. This client object starts the server program and asks it to run jobs.A server program, MCPSHostServer.exe, which provides the PowerShell environment in which the SharePoint scripts are executed.
Both components have associated configuration files that define certain operational parameters. You can modify these settings to fine-tune performance or to specify resource usage limits.
The configuration files are in XML format. After making changes, ensure that the files retain their well-formed XML format. Also do not remove or change settings other than those documented here. NetIQ Corporation strongly recommends that you create backup copies of these files before modifying them.
NOTE: This topic does not discuss all configuration settings. As a rule, if a configuration setting is not discussed in this topic, you should not change the value of that setting.
2.7.1 Client Configuration SettingsThe client configuration file, MCPSHostClient.dll.config, resides in the AppManager\bin\PowerShell directory. You can change the following settings.
In the <appSettings> section:
maxActiveServers Use this setting to specify the maximum number of MSPSHostServer.exe instances that can be active at any time. Use this setting in conjunction with maxMemoryUsage to specify a lower memory threshold with an increased number of servers that can be used. This combination is beneficial for situations in which a server exceeds the memory limitation and has to shut down. If only one server can be active at a time, job requests are blocked until the server restarts. If you allow more than one server to be active, job requests can be executed in other server processes or on new servers if the current number of active servers is less than maxActiveServers. serverStartupTimeout Use this setting to specify the number of seconds a job will wait in the client for an opening to become available in a server so that the job can run. A job must wait if maxActiveServers are already running, and if each of those servers is hosting maxActiveClients jobs, otherwise the job will be run in an active server (if an active server exists that is not hosting maxActiveClients), or a new server will be started to host the job.
In the <log4net> section:
file Use this setting to specify the pathname of the log file. If the pathname is a relative path, it is considered to be relative to the \AppManager\bin\PowerShell directory.appendToFile Use this setting to indicate whether the client overwrites the existing log file or appends to it, at the time the client is loaded into the AppManager agent.
Installing AppManager for Microsoft SharePoint Server 23

maxSizeRollBackups Use this setting to specify the number of old log files you want to retain.maximumFileSize Use this setting to specify the maximum size of a log file. After a log file reaches this size, it is deleted, or renamed if the maxSizeRollBackups value is greater than 0.
2.7.2 Server Configuration SettingsThe server configuration file, MCPSHostServer.exe.config, resides in the AppManager\bin\PowerShell directory. You can change the following settings.
In the <appSettings> section:
serverShutdownTimeout Use this setting to specify the number of seconds that the server will remain running while idle, with no jobs executing within it. For example, if you set this option to 1, each MCPSHostServer.exe instance will shut down one second after it enters a state where no jobs are running within it. As long as a single job is running in a server, the server will stay running. When the job count drops to zero, the shutdown timer starts, and when a new job starts running the shutdown timer is turned off and reset.maxActiveClients Use this setting to determine the maximum number of jobs that can run in a single server at the same time. Only jobs that are actively running are taken into account; jobs that are between iterations do not count.maxMemoryUsage Use this setting to specify the maximum amount of memory, in megabytes, that a server will use before it stops accepting new jobs and shuts down. The server will finish executing all jobs currently running on it before the shutdown.
NOTE: If you raise the values for maxMemoryUsage and maxActiveClients, you can decrease the value for maxActiveServers, because many clients can run in a single server.
In the <log4net> section:
file Use this setting to specify the path of the log file. If the path is relative, it is considered to be relative to the \AppManager\bin\PowerShell directory.appendToFile Use this setting to indicate whether the client overwrites the existing log file or appends to it, at the time the client is loaded into the AppManager agent.maxSizeRollBackups Use this setting to specify the number of old log files you want to retain.maximumFileSize Use this setting to specify the maximum size of a log file. After a log file reaches this size, it is deleted, or renamed if the maxSizeRollBackups value is greater than 0.
2.8 Permissions for Running Knowledge ScriptsAppManager for Microsoft SharePoint Server requires that the NetIQ AppManager Client Resource Monitor (netiqmc) and the NetIQ AppManager Client Communication Manager (netiqccm) agent services use one of the following account types:
Agent User accountDomain accountFarm setup account (the user account used to set up the SharePoint server)
24 NetIQ AppManager for Microsoft SharePoint Server Management Guide

2.8.1 Changing Account Types of Agent ServicesYou can change the account type for the netiqmc and netiqccm agent services. If you use the farm setup account, you do not need to do any additional configuration for the account type.
For information about creating an Agent User account and a Domain account, see Section 2.8.2, “Creating an Agent User Account,” on page 25 and Section 2.8.3, “Creating a Domain Account,” on page 26.
To change the account type of the agent services:
1 Start the Services Administrative Tool. To do this, you can open the Administrative Tools folder in the Control Panel.
2 Right-click the NetIQ AppManager Client Communication Manager (netiqccm) service in the list of services, and select Properties.
3 On the Logon tab, specify the appropriate account to use. 4 Click OK.5 Repeat Step 2 through Step 4 for the NetIQ AppManager Client Resource Monitor (netiqmc)
service. 6 Restart both services.
2.8.2 Creating an Agent User AccountYou can create a new local user called Agent User for the netiqmc and netiqccm agent services.
To create the Agent User:
1 Create a new local user named Agent User on the agent computer, and give the Agent User local administrator permissions for that computer.
2 Repeat Step 1 for each SharePoint server in the farm.3 On the SQL Server computer, create a new local user named Agent User, and give the Agent
User normal user permissions (non-administrator).4 On the SQL Server computer, add Agent User to the database logins.5 On the SharePoint configuration database, add Agent User to the Users, and add the following
Role memberships:db_datareader
db_denydatawriter
SharePoint_Shell_Access (SharePoint Server 2010 and later.)WSS_Content_Application_Pools (needed to run stored procedures, or sprocs)
6 For each SharePoint content database, add Agent User to the list of Users.7 (Conditional) If you are running SharePoint Server 2010 or later, for the logging database, give
Agent User the following Role memberships (this allows the WebPagePerf Knowledge Script to run):
db_denydatawriter
db_owner
8 For each SharePoint content database, give Agent User the following Role memberships:db_denydatawriter
db_owner
Installing AppManager for Microsoft SharePoint Server 25

9 (Conditional) If you are running SharePoint Server 2010 or later, set up the account as a site collection administrator by running the following command: Set-SPSite -Identity "SiteCollectionURL" -SecondaryOwnerAlias "ComputerName\Username"
10 Repeat Step 9 for all site collections.
2.8.3 Creating a Domain AccountIf you are running SharePoint Server 2010 or later, you can create a new domain account for the netiqmc and netiqccm agent services.
To create the domain account:
1 Click Start > Programs > Administrative Tools > Active Directory Users and Computers. 2 Create a new domain account, such as MyDomain\SharePoint, and give the new domain
account administrator permissions for each SharePoint server in the farm.
NOTE: You do not need grant any permissions on the SQL server computer.
3 Log on to any SharePoint server with the farm setup account (the user account used to set up the SharePoint server).
4 Open the SharePoint Management shell.5 At the Windows PowerShell command prompt, type the following commands to assign the
account to the SharePoint_Shell_Access role on the SharePoint content databases, and to make the account a member of the WSS_ADMIN_WPG local group on all servers in the farm:
$db = get-SPContentDatabase "ContentDBName"
Add-SPShellAdmin -Username "Domain\Username" -database $db
6 Set up the account as a site collection administrator by running the following command: Set-SPSite -Identity "SiteCollectionURL" -SecondaryOwnerAlias "Domain\Username"
7 Repeat Step 6 for all site collections.8 For the logging database, give Agent User the following Role memberships (this allows the
WebPagePerf Knowledge Script to run):db_denydatawriter
db_owner
2.9 Troubleshooting Configuration ErrorsThis section provides solutions for PowerShell error messages you may encounter.
2.9.1 PowerShell Execution ErrorsKnowledge Scripts in the SharePoint category may raise events such as “PowerShell script failed to run to completion” or “Error executing PowerShell script.” These errors can occur when Knowledge Scripts take a long time to run, or when there is contention for access to the server that executes the PowerShell scripts, MCPSHostServer.exe. The following are some recommendations for resolving these issues:
Increase the amount of memory that can be used by MCPSHostServer.exe. Increasing the memory limit reduces the frequency with which the server restarts due to excessive memory usage. Increasing the memory limit also reduces the number of PowerShell errors; each time the
26 NetIQ AppManager for Microsoft SharePoint Server Management Guide

server recognizes that it is exceeding its memory usage threshold, the server prevents new jobs from executing until all existing jobs have completed and the server restarts. If existing jobs take a significant amount of time to complete, the waiting jobs may time out and return errors. To increase the amount of memory MCPSHostServer.exe can use, modify the value of the maxMemoryUsage setting. For more information, see Section 2.7, “Changing PowerShell Configuration Settings,” on page 23.Increase the number of PowerShell execution environments, or runspaces, that MCPSHostServer.exe can host. If you attempt to run more jobs than the available number of runspaces on the server, the most recent jobs are held back until runspaces become available as existing jobs complete their iterations. Being held back in this manner increases the chance that jobs will time out before running or before completing their iteration. To increase the number of available runspaces, modify the maxActiveClients setting. For more information, see Section 2.7, “Changing PowerShell Configuration Settings,” on page 23.
NOTE: The client’s maxActiveServers configuration option specifies the maximum number of servers that can be active at any time (the default is five). The maxActiveServers configuration value and the maxActiveClients server configuration value determine the total number of jobs that can be serviced at any one time. You can have more than this number of jobs in the “Running” state in AppManager, but only if some of the jobs are between iterations, and not actually running at the same time.
2.9.2 PowerShell Initialization ErrorKnowledge Scripts in the SharePoint category may also raise events such as “Failed to initialize MCPSHostServer PowerShell session.”
The following settings in the server configuration file, MCPSHostServer.exe.config, determine the number of MCPSHostServers running:
maxActiveServersmaxActiveClientsmaxMemoryUsage
When a job runs, the client, MCPSHostClient, checks if there is a server that does not already have the maximum number of jobs running (maxActiveClients), and is not in shutdown mode because of exceeding its maximum amount of memory (maxMemoryUsage). If there is a server that meets the criteria, the client uses that server to run the job.
If no server meets the criteria, the client checks whether the maximum number of MSPSHostServer.exe instances (maxActiveServers) is already running. If it is not, the client starts a new server and submits the job to that server. If the maximum number of instances (maxActiveServers) is already running, and all instances have the maximum number of jobs running (maxActiveClients), then the client holds the job until a server becomes available.
To resolve a PowerShell initialization issue, you can modify maxActiveServers, maxActiveClients, and maxMemoryUsage. For example, by raising the values of maxMemoryUsage and maxActiveClients, you are allowing many clients to run on a single server. In that case, you can decrease the value of maxActiveServers. For more information about these settings, see Section 2.7, “Changing PowerShell Configuration Settings,” on page 23.
Installing AppManager for Microsoft SharePoint Server 27

2.10 Discovering SharePoint ResourcesUse the Discovery_SharePoint Knowledge Script to discover configuration and resource information for SharePoint Servers. The Discovery_SharePoint script also tracks, displays, and provides various alerts about SharePoint services.
If you are running Microsoft SharePoint Server on multiple servers as part of your SharePoint server farm, run Discovery_SharePoint on each server in the farm. Each server from the farm is displayed individually, not as a group, in the Control Center Navigation pane and the Operator Console TreeView.
To ensure the functionality of the SiteUsage and WebPagePerf Knowledge Scripts, enable SharePoint logging so that log files are created. For more information, see Section 2.5.2, “Enabling Usage Logging,” on page 17.
By default, this script runs once for each computer.
NOTE: Run this script on a scheduled basis to discover new SharePoint resources, such as Web applications.
Set the Values tab parameters as needed.
2.11 Deploying the Module with Control CenterYou can use Control Center to deploy the module on a remote computer where an agent is installed. This topic briefly describes the steps involved in deploying a module and provides instructions for checking in the module installation package. For more information, see the Control Center User Guide for AppManager, which is available on the AppManager Documentation page.
2.11.1 Deployment OverviewThis section describes the tasks required to deploy the module on an agent computer.
To deploy the module on an agent computer:
1 Verify the default deployment credentials.
Description How to Set It
Raise event when the discovery succeeds?
Select Yes to raise an event if this script successfully discovers SharePoint resources. The default is unselected.
Event severity when the discovery succeeds
Set the event severity level, from 1 to 40, to reflect the importance when this script successfully discovers SharePoint resources. The default is 25.
Raise event when the discovery fails?
Select Yes to raise an event in which this script does not successfully discover SharePoint resources. The default is Yes.
Event severity when the discovery fails
Set the event severity level, from 1 to 40, to reflect the importance when the script fails to discover SharePoint resources. The default is 5.
Raise event when the discovery partially succeeds?
Select Yes to raise an event in which this script only partially discovers SharePoint resources. The default is Yes.
Event severity when the discovery partially succeeds
Set the event severity level, from 1 to 40, to reflect the importance when the script only partially discovers SharePoint resources. The default is 10.
28 NetIQ AppManager for Microsoft SharePoint Server Management Guide
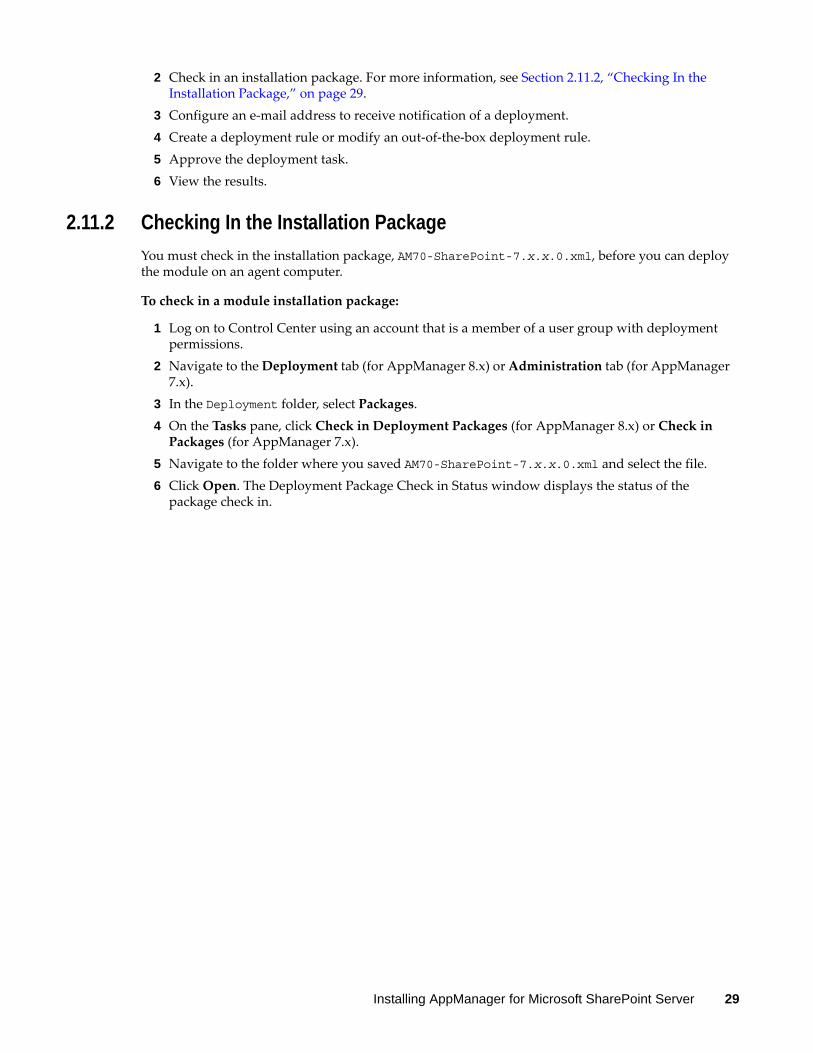
2 Check in an installation package. For more information, see Section 2.11.2, “Checking In the Installation Package,” on page 29.
3 Configure an e-mail address to receive notification of a deployment. 4 Create a deployment rule or modify an out-of-the-box deployment rule. 5 Approve the deployment task. 6 View the results.
2.11.2 Checking In the Installation PackageYou must check in the installation package, AM70-SharePoint-7.x.x.0.xml, before you can deploy the module on an agent computer.
To check in a module installation package:
1 Log on to Control Center using an account that is a member of a user group with deployment permissions.
2 Navigate to the Deployment tab (for AppManager 8.x) or Administration tab (for AppManager 7.x).
3 In the Deployment folder, select Packages.4 On the Tasks pane, click Check in Deployment Packages (for AppManager 8.x) or Check in
Packages (for AppManager 7.x).5 Navigate to the folder where you saved AM70-SharePoint-7.x.x.0.xml and select the file. 6 Click Open. The Deployment Package Check in Status window displays the status of the
package check in.
Installing AppManager for Microsoft SharePoint Server 29

30 NetIQ AppManager for Microsoft SharePoint Server Management Guide

3 3SharePoint Knowledge Scripts
AppManager for Microsoft SharePoint Server provides the following Knowledge Scripts for monitoring Microsoft SharePoint resources. From the Knowledge Script view of Control Center, you can access more information about any NetIQ-supported Knowledge Script by selecting it and clicking Help. In the Operator Console, click any Knowledge Script in the Knowledge Script pane and press F1.
Knowledge Script What It Does
BytesTransfer Monitors the total number of bytes transferred per second to and from a Web application.
ConnectionsInterval Monitors the number of Web application connections.
ContentDatabaseAccessibility Monitors the accessibility of SharePoint content databases for the Web applications running on the SharePoint server.
ContentManagementEventLog Monitors the event log for Content Management error events generated by SharePoint.
DBSiteCount Monitors the number of site collections on each SharePoint content database in the server farm.
DBSpaceUtil Monitors the amount of space used by the SharePoint content database.
ExtendedWebApplications Monitors the extended Web applications in the SharePoint server farm.
FASTSearchServerStatus Monitors the status of the SharePoint FAST Search Server, including availability of the server, the number of queries per minute, and the number of searches per second. (SharePoint Server 2010 only.)
GenericEventLog Monitors the event log for generic error events generated by SharePoint.
HealthAnalyzer Monitors the SharePoint Health Analyzer tool, which allows you to schedule automatic checks for configuration, performance, and usage problems in the SharePoint server farm. (SharePoint Server 2010 and later.)
HealthCheck Monitors the operational status of active SharePoint services and Web applications.
InfoPathEventLog Monitors the event log for InfoPath Forms error events generated by SharePoint.
IsolatedApps Monitors isolated applications in a SharePoint 2007 environment. (SharePoint Server 2007 and IIS 6.0 only.)
MailServerStatus Monitors the mail server status in the SharePoint server farm.
SharePoint Knowledge Scripts 31

3.1 BytesTransferUse this Knowledge Script to monitor the total number of bytes transferred per second to and from a Web application. This script raises an event if the total number of transferred bytes exceeds the threshold you set.
3.1.1 Resource ObjectsSharePoint Server: Web Applications
3.1.2 Default ScheduleThe default interval for this script is every 30 minutes.
RecycleBinInfo Monitors the Recycle Bin usage for all Web applications running on the SharePoint server.
Report_ServerUptime Generates a report about the number of hours the SharePoint server has been operational since the last reboot.
Report_SiteInfo Generates a report about the space utilization and date information for each Web application on the SharePoint server.
Report_SiteUsage Generates a report that contains usage information about each Web application on the SharePoint server.
Report_WebPartInfo Generates a report about the status and availability of Web Parts used by the SharePoint server.
SearchStatus Monitors the Search service and crawl status in the SharePoint server farm.
ServerUptime Monitors the number of hours the SharePoint server has been operational since the last reboot.
SiteCollectionUserCount Monitors the number of users in a site collection.
SiteEventLog Monitors the event log for events on the Web application usage.
SiteInfo Monitors space utilization and date information for each Web application on the SharePoint server.
SiteUsage Monitors usage information about each Web application on the SharePoint server.
VisualModeSiteCount Monitors the Visual Mode Site count for each Web application, site collection, and sub-site on a SharePoint server. (SharePoint Server 2010 and later.)
WebApplicationUptime Monitors the uptime of Web applications on the SharePoint server.
WebPagePerf Monitors the availability and performance of a Web application’s Web pages on the SharePoint server.
WebPartInfo Monitors the status and availability of Web Parts used by the SharePoint server.
Knowledge Script What It Does
32 NetIQ AppManager for Microsoft SharePoint Server Management Guide

3.1.3 Setting Parameter ValuesSet the following parameters as needed:
3.2 ConnectionsIntervalUse this Knowledge Script to monitor the number of Web application connections and the total connections for all Web applications from anonymous and user (non-anonymous) accounts during the monitoring interval. This script raises an event if the number of connections exceeds the threshold you set.
NOTE: If anonymous access is not enabled for the Web applications in the SharePoint site collection, this script raises events only for maximum connections to Web applications from user (non-anonymous) accounts that exceed the threshold.
3.2.1 Resource ObjectsSharePoint Server: Web Applications
3.2.2 Default ScheduleThe default interval for this script is every 30 minutes.
Description How to Set It
General Settings
Job failure event notification
Event severity when job fails Set the event severity level, from 1 to 40, to indicate the importance of an event in which the job fails to monitor the transferred bytes. The default is 5.
Monitor Byte Transfer
Event Notification
Raise event if number of bytes transferred per second exceeds a threshold?
Select Yes to raise an event if the number of bytes transferred per second exceeds the threshold you specify. The default is Yes.
Event severity when the number of bytes transferred exceeds the threshold
Set the event severity level, from 1 to 40, to indicate the importance of an event in which the number of bytes sent or received exceeds the threshold you set. The default is 10.
Threshold -- Maximum bytes received per second
Specify the maximum number of bytes the server can receive before an event is raised. The default is 64000 bytes per second.
Threshold -- Maximum bytes sent per second
Specify the maximum number of bytes the server can send before an event is raised. The default is 64000 bytes per second.
Data Collection
Collect data for current transfer rate (bytes sent, bytes received)?
Select Yes to collect byte transfer data for charts and reports. If enabled, data collection returns byte transfer rate (sent and received) data for the server. The default is unselected.
SharePoint Knowledge Scripts 33

3.2.3 Setting Parameter ValuesSet the following parameters as needed:
Description How to Set It
General Settings
Job failure event notification
Event severity when job fails Set the event severity level, from 1 to 40, to indicate the importance of an event in which the job fails to monitor the number of connections. The default is 5.
Monitor Connections Interval
Event Notification
Raise event if number of connections exceeds any threshold?
Select Yes to raise an event if the number of connections exceeds any of the thresholds you set. The default is Yes.
Event severity when current connections exceed the threshold
Set the severity level, from 1 to 40, to indicate the importance of an event in which the number of current connections exceeds the threshold. The default is 12.
Threshold -- Maximum connections to Web application from anonymous accounts
Specify the maximum number of Web application connections from anonymous accounts that can be open during the monitoring interval. An event is raised if the number of connections exceeds the threshold.The default is 64.
Threshold -- Maximum connections to Web application from non-anonymous accounts
Specify the maximum number of Web application connections from non-anonymous (user) accounts that can be open during the monitoring interval. An event is raised if the number of connections exceeds the threshold. The default is 64.
Threshold -- Maximum total connections to Web server from anonymous accounts
Specify the maximum total connections to all monitored Web applications from anonymous accounts that can be open during the monitoring interval. An event is raised if the number of connections exceeds the threshold. The default is 64.
If you run this Knowledge Script on a child Web Application object, it does not monitor the total connections to a Web server.
Threshold -- Maximum total connections to Web server from non-anonymous accounts
Specify the maximum total number of connections to all monitored Web applications from non-anonymous (user) accounts that can be open during the monitoring interval. An event is raised if the number of connections exceeds the threshold. The default is 64.
If you run this Knowledge Script on a child Web Application object, it does not monitor the total connections to a Web server.
Data Collection
Collect data for number of connections?
Select Yes to collect data for charts and reports. If enabled, data collection returns the number of Web application connections during the monitoring interval. The default is unselected.
34 NetIQ AppManager for Microsoft SharePoint Server Management Guide
3.3 ContentDatabaseAccessibilityUse this Knowledge Script to monitor the accessibility of SharePoint content databases for the Web applications running on the SharePoint server. This Knowledge Script raises an event if the content databases on the SharePoint server or SQL servers are not accessible.
This script collects data about the availability of the content databases. A value of 0 means that the status of the database is Offline for either the SQL servers or the SharePoint server. A value of 100 means that the status of the database is Online for the SQL servers and the SharePoint server.
When you run this Knowledge Script on a SharePoint Database in the Navigation pane (for Control Center) or the TreeView (for the Operator Console), this Knowledge Script monitors all content databases under the parent Database object. To monitor only certain content databases, open the Object tab and deselect the databases you do not want to monitor.
3.3.1 Configuring Security Manager for ContentDatabaseAccessibilityBefore you can run the ContentDatabaseAccessibility Knowledge Script, you need to configure AppManager Security Manager to enable the script to monitor the content databases using SQL authentication.
To configure Security Manager for the ContentDatabaseAccessibility Knowledge Script:
1 In AppManager Security Manager, select the AppManager agent or agents you want to monitor using SQL authorization.
2 On the Custom tab, add a custom entry and complete the following fields for the agent or agents you selected in the previous step:
3 Verify that the SQL login account has been granted the DB_owner role on the content databases you want to monitor with the ContentDatabaseAccessibility script.
3.3.2 Resource ObjectsSharePoint Server: Database
Field Description
Label SharePoint_SQL
Sub-label ServerName\SharePointInstanceName
This field can be configured as default, which means that the SQL login credentials will be used to connect to any content database.
To do this, type default in place of ServerName\SharePointInstanceName
Value 1 Specify the user name for the SQL Server account.
Value 2 Specify the password for the SQL Server account.
Extended application support Required field. Encrypts the user name and password in Security Manager.
SharePoint Knowledge Scripts 35

3.3.3 Default ScheduleThe default interval for this script is every hour.
3.3.4 Setting Parameter ValuesSet the following parameters as needed:
3.4 ContentManagementEventLogUse this Knowledge Script to monitor the event log for Content Management error events generated by SharePoint.
This Knowledge Script raises events for the following error codes:
4958: The content deployment job failed during the publishing process.5322: Content deployment job could not contact the destination server. 5323: The connection to the destination server was lost while transporting the deployment package created by the content deployment job.5325: The content deployment job failed on the destination server during the import phase.5326: The content deployment job failed on the source server during the export phase.
3.4.1 Resource ObjectsSharePoint Server
Description How to Set It
General Settings
Job failure event notification
Event severity when job fails Set the event severity level, from 1 to 40, to indicate the importance of an event in which the job fails to monitor the accessibility of the SharePoint content databases. The default is 5.
Monitor Content Database Accessibility
Comma-separated list of content databases to exclude
Specify a list of the content databases to ignore when monitoring. Use commas without spaces to separate multiple content databases.
Event Notification
Raise event if content databases are inaccessible?
Select Yes to raise an event if the content databases are not accessible. The default is Yes.
Event severity when content databases are inaccessible
Set the event severity level, from 1 to 40, to indicate the importance of an event when the content databases are not accessible. The default is 10.
Data Collection
Collect data for content database accessibility?
Select Yes to collect data about the accessibility of the content databases. The default is unselected.
36 NetIQ AppManager for Microsoft SharePoint Server Management Guide

3.4.2 Default ScheduleThe default interval for this script is every 10 minutes.
3.4.3 Setting Parameter ValuesSet the following parameters as needed:
Description How to Set It
General Settings
Job failure event notification
Event severity when job fails Set the event severity level, from 1 to 40, to indicate the importance of an event in which the job fails to read the Content Management event log. The default is 5.
Additional Settings
Event Details
Event detail format Specify the format of the event details, either as an HTML table or as plain text. The default is HTML Table.
Monitor Content Management Event Log
Event Notification
Raise event if SharePoint generates a Content Management error event?
Select Yes to raise an AppManager event if SharePoint generates a Content Management error event in the event log. The default is Yes.
Event severity when SharePoint generates a Content Management error event
Set the event severity level, from 1 to 40, to indicate the importance of an event in which SharePoint generates a Content Management error event in the event log. The default is 20.
Data Collection
Collect data for the Content Management error event?
Select Yes to collect data for charts and reports. The default is unselected.
Events in past N hours Set this parameter to control event checking for the first interval (after which checking is incremental):
-1 lists all t: he existing entries
N lists events for the past n hours, such as 8 for the past 8 hours, or 50 for the past 50 hours
0 lists only entries from this moment on, without listing any previous entries
The default is 0.
SharePoint Knowledge Scripts 37
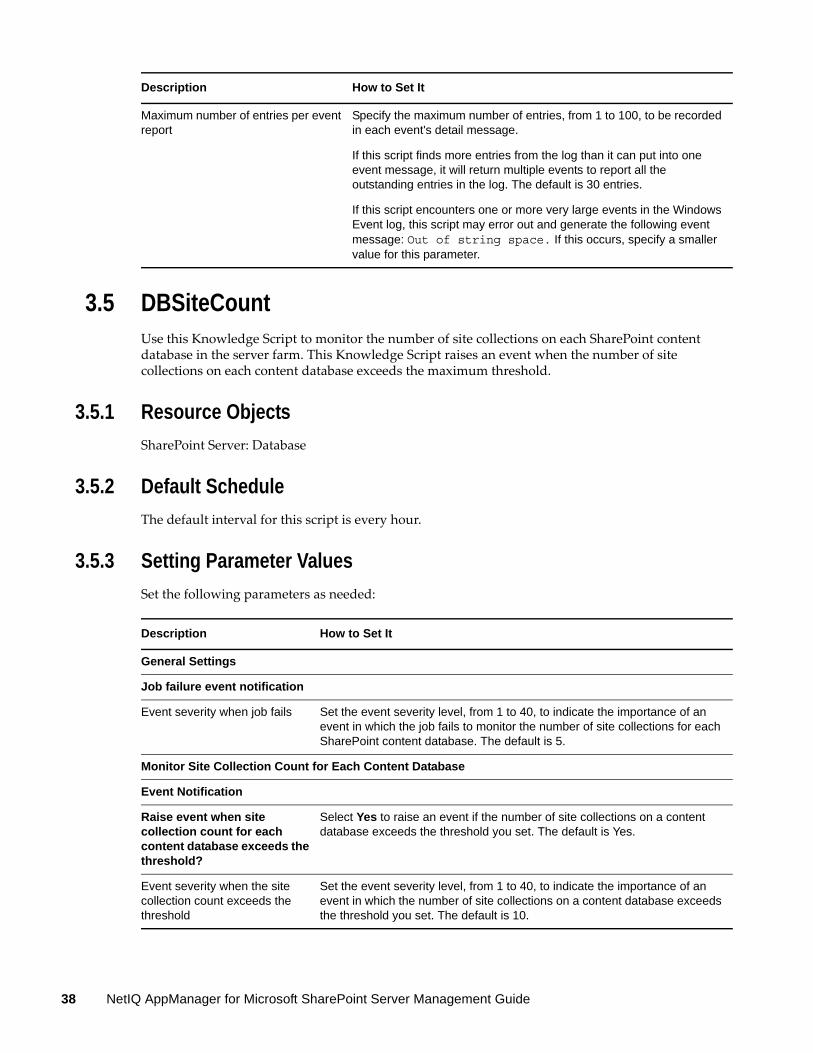
3.5 DBSiteCountUse this Knowledge Script to monitor the number of site collections on each SharePoint content database in the server farm. This Knowledge Script raises an event when the number of site collections on each content database exceeds the maximum threshold.
3.5.1 Resource ObjectsSharePoint Server: Database
3.5.2 Default ScheduleThe default interval for this script is every hour.
3.5.3 Setting Parameter ValuesSet the following parameters as needed:
Maximum number of entries per event report
Specify the maximum number of entries, from 1 to 100, to be recorded in each event's detail message.
If this script finds more entries from the log than it can put into one event message, it will return multiple events to report all the outstanding entries in the log. The default is 30 entries.
If this script encounters one or more very large events in the Windows Event log, this script may error out and generate the following event message: Out of string space. If this occurs, specify a smaller value for this parameter.
Description How to Set It
Description How to Set It
General Settings
Job failure event notification
Event severity when job fails Set the event severity level, from 1 to 40, to indicate the importance of an event in which the job fails to monitor the number of site collections for each SharePoint content database. The default is 5.
Monitor Site Collection Count for Each Content Database
Event Notification
Raise event when site collection count for each content database exceeds the threshold?
Select Yes to raise an event if the number of site collections on a content database exceeds the threshold you set. The default is Yes.
Event severity when the site collection count exceeds the threshold
Set the event severity level, from 1 to 40, to indicate the importance of an event in which the number of site collections on a content database exceeds the threshold you set. The default is 10.
38 NetIQ AppManager for Microsoft SharePoint Server Management Guide

3.6 DBSpaceUtilUse this Knowledge Script to monitor the amount of space used by a SharePoint content database. Space usage is measured in two ways: in megabytes, and as a percentage of the total database space available to the selected content database. The reported size of the content database includes both the content database (MDF file) and the transaction log files (LDF files).
This script raises an event if the size of a content database or the amount of space used by a content database exceeds the threshold you set.
3.6.1 Configuring Security Manager for DBSpaceUtilBefore you can run the DBSpaceUtil Knowledge Script, you need to configure AppManager Security Manager to enable the script to monitor the content databases using SQL authentication.
To configure Security Manager for the DBSpaceUtil Knowledge Script:
1 In AppManager Security Manager, select the AppManager agent or agents you want to monitor using SQL authorization.
2 On the Custom tab, add a custom entry and complete the following fields for the agent or agents you selected in the previous step:
3 Verify that the SQL login account has been granted the DB_owner role on the content databases you want to monitor with the DBSpaceUtil script.
Threshold -- Maximum site collection count for each content database
Specify the maximum number of site collections a content database can contain before an event is raised. The default is 2000.
Data Collection
Collect data for site collection count for each content database?
Select Yes to collect data for the site collection count of each content database. The default is unselected.
Description How to Set It
Field Description
Label SharePoint_SQL
Sub-label ServerName\SharePointInstanceName
This field can be configured as default, which means that the SQL login credentials will be used to connect to any content database.
To do this, type default in place of ServerName\SharePointInstanceName
Value 1 Specify the user name for the SQL Server account.
Value 2 Specify the password for the SQL Server account.
Extended application support Required field. Encrypts the user name and password in Security Manager.
SharePoint Knowledge Scripts 39

3.6.2 Resource ObjectsSharePoint Server: Database
3.6.3 Default ScheduleThe default interval for this script is every 30 minutes.
3.6.4 Setting Parameter ValuesSet the following parameters as needed:
Description How to Set It
General Settings
Job failure event notification
Event severity when job fails Set the event severity level, from 1 to 40, to indicate the importance of an event in which the job fails to monitor a SharePoint content database. The default is 5.
Event Notification
Raise event if the percentage of space used by the content database exceeds threshold?
Select Yes to raise an event if the percentage of space used by the content database exceeds the threshold you set. The amount of space used is the total space used by the content database and the transaction log files. The default is Yes.
Event severity when the percentage of space used by the content database exceeds the threshold
Set the event severity level, from 1 to 40, to indicate the importance of an event in which the percentage of space used by the content database exceeds the threshold you set. The default is 10.
Threshold -- Maximum amount of space used by the content database (in %)
Specify the maximum percentage of space the content database can use before an event is raised. The default is 75.
Raise event if the content database size exceeds threshold?
Select Yes to raise an event if the size of the content database exceeds the threshold you set. The reported size of the content database includes both the content database and the transaction log files. The default is Yes.
Event severity when the content database size exceeds the threshold
Set the event severity level, from 1 to 40, to indicate the importance of an event in which the size of the content database exceeds the threshold you set. The default is 15.
Threshold -- Maximum size of the content database (in MB)
Specify the maximum size of the content database, in megabytes, before an event is raised. The default is 500.
The maximum valid value is 204800.
Data Collection
Collect data for the amount of space used by the content database (in %)?
Select Yes to collect data for charts and reports. If enabled, data collection returns the amount of space utilized by the SharePoint content database, as a percentage. The default is unselected.
Collect data for the size of the content database (in MB)?
Select Yes to collect data for charts and reports. If enabled, data collection returns the size of the SharePoint content database, in megabytes. The default is unselected.
40 NetIQ AppManager for Microsoft SharePoint Server Management Guide

3.7 ExtendedWebApplicationsUse this Knowledge Script to monitor the extended Web applications in the SharePoint server farm. For more information about extending Web applications, see the following Microsoft TechNet topics:
For SharePoint 2013, see (http://technet.microsoft.com/en-us/library/gg276325.aspx)For SharePoint 2010, see (http://technet.microsoft.com/en-us/library/cc261698.aspx)For SharePoint 2007, see (http://technet.microsoft.com/en-us/library/cc287954.aspx)
This Knowledge Script generates events and collects data for the Web applications that are extended in the server farm, on an Intranet, Internet, Extranet, or Custom site.
3.7.1 Resource ObjectSharePoint Server: Web Applications
3.7.2 Default ScheduleThe default schedule for this script is Run once.
3.7.3 Setting Parameter ValuesSet the following parameters as needed:
Description How to Set It
General Settings
Job failure event notification
Event severity when job fails Set the event severity level, from 1 to 40, to indicate the importance of an event in which the job fails to monitor the extended Web applications in the server farm. The default is 5.
Monitor Extended Web Applications
Comma-separated list of Web applications to exclude
Specify a list of Web applications to ignore when monitoring. Use commas to separate multiple Web applications.
Event Notification
Raise event if Web applications are extended?
Select Yes to raise an event if the Web applications are extended. The default is Yes.
Event severity when Web applications are extended
Set the event severity level, from 1 to 40, to indicate the importance of an event in which the Web applications are extended. The default is 10.
Data Collection
Collect data for extended Web applications?
Select Yes to collect data about Web applications that are extended. The default is unselected.
SharePoint Knowledge Scripts 41

3.8 FASTSearchServerStatusUse this Knowledge Script to monitor the status of the FAST Search Server in an environment running Microsoft FAST Search Server 2010 for SharePoint 2010. This script raises an event when the FAST Search Server is unavailable, when the number of queries and failed queries exceed the thresholds you set, and when the average number of searches and time per search exceed the thresholds you set.
3.8.1 Resource ObjectsSharePoint Server: FAST Search Server
3.8.2 Default ScheduleThe default interval for this script is every 30 minutes.
3.8.3 Setting Parameter ValuesSet the following parameters as needed:
Description How to Set It
General Settings
Job failure event notification
Event severity when job fails Set the event severity level, from 1 to 40, to indicate the importance of an event in which the job fails to monitor the status of the FAST Search Server. The default is 5.
Monitor FAST Search Server Status
Monitor FAST Search Server Availability
Event Notification
Raise an event if the FAST Search Server is unavailable during the monitoring interval?
Select Yes to raise an event if the FAST Search Server is not available during monitoring. The default is Yes.
Event severity when the FAST Search Server is unavailable
Set the event severity level, from 1 to 40, to indicate the importance of an event in which the FAST Search Server is not available. The default is 7.
Monitor FAST Search Server Query Result Server
Event Notification
Raise event if the number of failed system queries per second exceeds the threshold?
Select Yes to raise an event in which the number of failed system queries per second exceeds the threshold. The default is Yes.
Event severity when the number of failed system queries per second exceeds the threshold
Set the event severity level, from 1 to 40, to indicate the importance of an event in which the number of failed system queries per second exceeds the threshold. The default is 12.
42 NetIQ AppManager for Microsoft SharePoint Server Management Guide

Threshold -- Maximum number of failed system queries per second
Specify the maximum number of failed system queries per second. The default is 1000.
Raise event if the total number of failed queries per second exceeds the threshold?
Select Yes to raise an event in which the total number of failed queries per second exceeds the threshold. The default is Yes.
Event severity when the total number of failed queries per second exceeds the threshold
Set the event severity level, from 1 to 40, to indicate the importance of an event in which the total number of failed queries per second exceeds the threshold. The default is 14.
Threshold -- Maximum total number of failed queries per second
Specify the maximum total number of failed queries per second. The default is 1000.
Raise event if the number of queries per second exceeds the threshold?
Select Yes to raise an event in which the number of queries per second exceeds the threshold. The default is Yes.
Event severity when the number of queries per second exceeds the threshold
Set the event severity level, from 1 to 40, to indicate the importance of an event in which the number of queries per second exceeds the threshold. The default is 15.
Threshold -- Maximum number of queries per second
Specify the maximum total number of queries per second. The default is 1000.
Monitor FAST Search Server Data Set
Event Notification
Raise event if the average number of searches per minute exceeds the threshold?
Select Yes to raise an event in which the average number of searches per minute exceeds the threshold. The default is Yes.
Event severity when the average number of searches per minute exceeds the threshold
Set the event severity level, from 1 to 40, to indicate the importance of an event in which the average number of searches per minute exceeds the threshold. The default is 8.
Threshold -- Maximum average number of searches per minute
Specify the maximum average number of searches per minute. The default is 1000.
Raise event if the average time per search in milliseconds exceeds the threshold?
Select Yes to raise an event in which the average time per search in milliseconds exceeds the threshold. The default is Yes.
Event severity when the average time per search in milliseconds exceeds the threshold
Set the event severity level, from 1 to 40, to indicate the importance of an event in which the average time per search in milliseconds exceeds the threshold. The default is 10.
Threshold -- Maximum average time per search in milliseconds
Specify the maximum average time per search in milliseconds. The default is 1000.
Data Collection
Description How to Set It
SharePoint Knowledge Scripts 43

3.9 GenericEventLogThis Knowledge Script monitors the event log for generic error events created by SharePoint. The SharePoint administrator can configure the event types in the SharePoint Central Administration site.
This script raises events for the following error codes:
42: Propagation failed to communicate with a query server.2438: Crawler cannot read from registry.2462: Failed to load word breaker.2483|2484: Failed to load protocol handler.3353: Backup failed due to insufficient permissions.4105|4106: Master merge error.4127: Failed to load index.4138: Index is corrupt.7035: Backup failed due to timer job failure.10038: Query server removed from rotation.
3.9.1 Resource ObjectsSharePoint Server: Web Applications
3.9.2 Default ScheduleThe default interval for this script is every 10 minutes.
Collect data for the availability of the FAST Search Server?
Select Yes to collect data about the availability of the FAST Search Server. A value of 0 indicates that the FAST Search Server is not available, and a value of 100 indicates that the server is available. The default is unselected.
Collect data for the number of failed system queries per minute?
Select Yes to collect data about the number of failed system queries per minute. The default is unselected.
Collect data for the total number of failed queries per second?
Select Yes to collect data about the total number of failed queries per second. The default is unselected.
Collect data for the number of queries per second?
Select Yes to collect data about the number of queries per second. The default is unselected.
Collect data for the average number of searches per minute?
Select Yes to collect data about the average number of searches per minute. The default is unselected.
Collect data for the average time per search?
Select Yes to collect data about the average time per search. The default is unselected.
Description How to Set It
44 NetIQ AppManager for Microsoft SharePoint Server Management Guide

3.9.3 Setting Parameter ValuesSet the following parameters as needed:
Description How to Set It
General Settings
Job failure event notification
Event severity when job fails Set the event severity level, from 1 to 40, to indicate the importance of an event in which the GenericEventLog job fails. The default is 5.
Additional Settings
Event Details
Event detail format Specify the format of the event details, either as an HTML table or as plain text. The default is HTML Table.
Monitor Generic Event Log
Event Notification
Raise event if SharePoint generates a generic error event?
Select Yes to raise an event if SharePoint generates a generic error event in the event log. The default is Yes.
Event severity when SharePoint generates an error event
Set the event severity level, from 1 to 40, to indicate the importance of an event in which SharePoint generates an error event. The default is 20.
Data Collection
Collect data for the generic error event?
Select Yes to collect data for charts and reports. The default is unselected.
Events in past N hours Set this parameter to control event checking for the first interval (after which checking is incremental):
-1 lists all the existing entries
N lists events for the past n hours, such as 8 for the past 8 hours, or 50 for the past 50 hours
0 lists only entries from this moment on, without listing any previous entries
The default is 0.
Maximum number of entries per event report
Specify the maximum number of entries, from 1 to 100, that you want to be recorded in each event's detail message.
If this script finds more entries from the log than it can put into one event message, it will return multiple events to report all the outstanding entries in the log. The default is 30 entries.
If this script encounters one or more very large events in the Windows Event log, this script may error out and generate the following event message: Out of string space. If this occurs, specify a smaller value for this parameter.
SharePoint Knowledge Scripts 45

3.10 HealthAnalyzerUse this Knowledge Script to monitor the SharePoint Health Analyzer tool, a feature in Microsoft SharePoint 2010 and later that allows you to schedule automatic checks for configuration, performance, and usage problems in a SharePoint server farm.
This script raises an event when the SharePoint Health Analyzer tool generates rule execution failure, error, warning, or information events.
3.10.1 Resource ObjectsSharePoint Server
3.10.2 Default ScheduleThe default interval for this script is every hour.
3.10.3 Setting Parameter ValuesSet the following parameters as needed:
Description How to Set It
General Settings
Job failure event notification
Event severity when job fails Set the event severity level, from 1 to 40, to indicate the importance of an event in which the HealthAnalyzer job fails. The default is 5.
Additional Settings
Event Details
Event detail format Specify the format of the event details, either as an HTML table or as plain text. The default is HTML Table.
Monitor SharePoint Health Analyzer
Run Health Analyzer during job?
Select Yes to run the SharePoint Health Analyzer tool during the job execution, which allows you to check for configuration, performance, and usage problems in the SharePoint server farm. The default is unselected.
Include or exclude health rules Specify whether to include or exclude health rules for an event. The default is Include.
Semicolon-separated list of Health Analyzer rules to include or exclude from monitoring
Specify a list of the Health Analyzer rules to include or exclude when monitoring. Use semicolons (;) to separate multiple health rules.
Categories of health rules to include or exclude from monitoring
Availability Select Yes to monitor health rule entries in the Availability category. The default is Yes.
Configuration Select Yes to monitor health rule entries in the Configuration category. The default is Yes.
46 NetIQ AppManager for Microsoft SharePoint Server Management Guide

3.11 HealthCheckUse this Knowledge Script to monitor the operational status of active SharePoint services and Web applications. This script checks the status of all SharePoint services and sites on the SharePoint server, and it can start a stopped service or site. HealthCheck will start services that have a startup type of Automatic or Manual. This script raises events if a service or site stops, fails to start, or is restarted successfully. This script generates data streams for service or site availability.
The HealthCheck Knowledge Script does not monitor, start, or raise events for disabled SharePoint Windows services.
Performance Select Yes to monitor health rule entries in the Performance category. The default is Yes.
Security Select Yes to monitor health rule entries in the Security category. The default is Yes.
Custom Select Yes to monitor health rule entries in the Custom category. The default is unselected.
Event Notification
Monitor Health Rule Execution Failure Events
Raise event if Health Analyzer generates rule execution failure events?
Select Yes to raise an event if the Health Analyzer generates a rule execution failure event. The default is Yes.
Event severity when Health Analyzer generates rule execution failure events
Set the event severity level, from 1 to 40, to indicate the importance of an event in which Health Analyzer generates a rule execution failure event. The default is 7.
Monitor Error Events
Raise event if Health Analyzer generates error events?
Select Yes to raise an event if the Health Analyzer generates an error event. The default is Yes.
Event severity when Health Analyzer generates error events
Set the event severity level, from 1 to 40, to indicate the importance of an event in which the Health Analyzer generates an error event. The default is 10.
Monitor Warning Events
Raise event if Health Analyzer generates warning events?
Select Yes to raise an event if the Health Analyzer generates a warning event. The default is Yes.
Event severity when Health Analyzer generates warning events
Set the event severity level, from 1 to 40, to indicate the importance of an event in which the Health Analyzer generates a warning event. The default is 15.
Monitor Informational Events
Raise event if Health Analyzer generates informational events?
Select Yes to raise an event if the Health Analyzer generates an informational event. The default is unselected.
Event severity when Health Analyzer generates informational events
Set the event severity level, from 1 to 40, to indicate the importance of an event in which the Health Analyzer generates an informational event. The default is 25.
Description How to Set It
SharePoint Knowledge Scripts 47

3.11.1 Resource ObjectsSharePoint Server: Services (Windows services), SharePoint Services, and Web Applications
3.11.2 Default ScheduleThe default interval for this script is every 5 minutes.
3.11.3 Setting Parameter ValuesSet the following parameters as needed:
Description How to Set It
General Settings
Job Failure Notification
Event severity when job fails Set the event severity level, from 1 to 40, to indicate the importance of an event in which the HealthCheck job fails. The default is 5.
Monitor Services
Start service or site if it is stopped?
Select Yes to automatically start all stopped services or sites on the SharePoint server. The default is Yes.
Only activated services can be automatically started. If an administrator has deactivated a service, AppManager cannot start it. This script starts services that have the startup type Automatic or Manual.
Event Notification
Raise event if service or site is stopped and should not be started?
Select Yes to raise an event if a monitored service or site is stopped but you did not enable the Start service or site if it is stopped? parameter. The default is Yes.
Event severity when service or site is stopped and should not be started
Set the event severity level, from 1 to 40, to indicate the importance of an event in which a monitored service or site is stopped but you did not enable the Start service or site if it is stopped? parameter. The default is 15.
Raise event if service or site fails to start?
Select Yes to raise an event if AppManager cannot start a monitored service or site. The default is Yes.
Event severity when service or site fails to start
Set the event severity level, from 1 to 40, to indicate the importance of an event in which AppManager cannot start a monitored service. The default is 5.
Raise event if stopped service or site has been started?
Select Yes to raise an event if a service or site has been started since the last time this script ran. The default is Yes.
Event severity when stopped service or site has been started
Set the event severity level, from 1 to 40, to indicate the importance of an event in which a service or site has been started since the last time this script ran. The default is 25.
Data Collection
Collect data for service or site availability?
Select Yes to collect data for SharePoint services and site availability. The default is unselected.
48 NetIQ AppManager for Microsoft SharePoint Server Management Guide

3.12 InfoPathEventLogUse this Knowledge Script to monitor the event log for InfoPath Forms error events generated by SharePoint. This script raises events for the following error codes:
5337: InfoPath Forms Services business logic failed.5338: InfoPath Forms Services calculations exceeded the maximum limit.5339: InfoPath Forms Services rules exceeded the maximum limit.5340: InfoPath Forms Services business logic exceeded the maximum limit of operations.5341: InfoPath Forms Services was running business logic when ASP.NET request timed out.5342: A form template’s business logic caused an OutOfMemory exception.5343: InfoPath Forms Services business logic exception occurred while loading a form template.5369: InfoPath Forms Services cannot find or load ifsFileNames.xml.5374: InfoPath Forms Services postback failure.5733: InfoPath form templates have conflicting business logic assembly identities.5734: InfoPath Forms Services business logic attempted to store a nonserializable object.5736: InfoPath Forms Services DoS postbacks per session.5737: InfoPath Forms Services user has exceeded the maximum number of actions per postback.5757: InfoPath Forms Services found an unexpected session state version.5758: InfoPath Forms Services data adapter security error submit.5759: InfoPath Forms Services solution cache churning.5760: InfoPath Forms Services event counter mismatch.6932: InfoPath Forms Services data adapter security error query.7056: InfoPath Forms Services failed to load a form template.7083: InfoPath Forms Services user has exceeded the maximum session state size.7095: The second stage Recycle bin has reached 90% capacity.7898: InfoPath Forms Services not working due to invalid State Service configuration.
3.12.1 Resource ObjectsSharePoint Server
3.12.2 Default ScheduleThe default interval for this script is every 10 minutes.
3.12.3 Setting Parameter ValuesSet the following parameters as needed:
Description How to Set It
General Settings
Job failure event notification
SharePoint Knowledge Scripts 49

Event severity when job fails Set the event severity level, from 1 to 40, to indicate the importance of an event in which the job fails to read the InfoPath event log. The default is 5.
Additional Settings
Event Details
Event detail format Specify the format of the event details, either as an HTML table or as plain text. The default is HTML Table.
Monitor InfoPath Event Log
Event Notification
Raise event if SharePoint generates an InfoPath Forms error event?
Select Yes to raise an event if SharePoint generates an InfoPath Forms error event in the event log. The default is Yes.
Event severity when SharePoint generates an InfoPath Forms error event
Set the event severity level, from 1 to 40, to indicate the importance of an event in which SharePoint generates an InfoPath Forms error event. The default is 20.
Data Collection
Collect data for InfoPath Forms error events?
Select Yes to collect data to generate charts and reports for InfoPath Forms error events. The default is unselected.
Events in past N hours Set this parameter to control event checking for the first interval (after which checking is incremental):
-1 lists all the existing entries
N lists events for the past n hours, such as 8 for the past 8 hours, or 50 for the past 50 hours
0 lists only entries from this moment on, without listing any previous entries
The default is 0.
Maximum number of entries per event report
Specify the maximum number of entries, from 1 to 100, that you want to be recorded in each event's detail message.
If this script finds more entries from the log than it can put into one event message, it will return multiple events to report all the outstanding entries in the log. The default is 30 entries.
If this script encounters one or more very large events in the Windows Event log, this script may error out and generate the following event message: Out of string space. If this occurs, specify a smaller value for this parameter.
Description How to Set It
50 NetIQ AppManager for Microsoft SharePoint Server Management Guide

3.13 IsolatedAppsUse this Knowledge Script to monitor isolated applications in a SharePoint Server 2007 environment. This Knowledge Script works with SharePoint Server 2007 and Internet Information Services (IIS) 6.0 only.
An isolated application is a stand-alone application that adds functionality to a SharePoint site, such as a third-party product created for use with SharePoint. An isolated application runs out-of-process, directly from the Web Server. Typically, an isolated application shares its resources with other components in that application.
If several isolated applications run at the same time, SharePoint may not perform optimally. Monitoring the number of isolated applications can improve the performance of SharePoint. This script raises an event if the number of isolated applications exceeds the threshold you set.
3.13.1 Resource ObjectsSharePoint Server: Web Applications
3.13.2 Default ScheduleThe default interval for this script is every 24 hours.
3.13.3 Setting Parameter ValuesSet the following parameters as needed:
Description How to Set It
General Settings
Job failure event notification
Event severity when job fails Set the event severity level, from 1 to 40, to indicate the importance of an event in which the job fails to monitor an isolated application. The default is 5.
Monitor Isolated Applications
Event Notification
Raise event if number of isolated applications exceeds threshold?
Select Yes raise an event if the number of isolated applications exceeds the threshold you set. The default is Yes.
Event severity when the number of isolated applications exceeds the threshold
Set the severity level, from 1 to 40, to indicate the importance of an event in which number of isolated applications exceeds the threshold you set. The default is 8.
Threshold -- Maximum isolated applications
Specify the maximum number of isolated applications that are allowed before an event is raised. The default is 10.
Data Collection
Collect data for number of isolated applications?
Select Yes to collect data for charts and reports. If enabled, data collection returns the number of isolated applications. The default is unselected.
SharePoint Knowledge Scripts 51

3.14 MailServerStatusUse this Knowledge Script to monitor the mail server status in the server farm. This Knowledge Script raises an event when the SMTP server is not configured in the SharePoint server farm or when the SMTP server is not available.
This script sends test emails for each job iteration. To ensure that these emails do not fill your inbox, NetIQ Corporation recommends the following:
Schedule the job to run at longer intervals so that the script sends test emails less frequently.Create a rule in Microsoft Exchange to periodically delete the test messages.
3.14.1 Resource ObjectsSharePoint Server: Web Applications
3.14.2 Default ScheduleThe default interval for this script is every 15 minutes.
3.14.3 Setting Parameter ValuesSet the following parameters as needed:
Description How to Set It
General Settings
Job failure event notification
Event severity when job fails Set the event severity level, from 1 to 40, to indicate the importance of an event in which the job fails to monitor the status of the mail server. The default is 5.
Monitor Mail Server Status
Event Notification
Raise event if SMTP server is not configured?
Select Yes to raise an event if the SMTP server is not configured. The default is Yes.
Event severity when SMTP server is not configured
Set the event severity level, from 1 to 40, to indicate the importance of an event in which the SMTP server is not configured. The default is 15.
Raise event if SMTP server is not available?
Select Yes to raise an event if the SMTP server is not available. The default is Yes.
Event severity when SMTP server is not available
Set the event severity level, from 1 to 40, to indicate the importance of an event in which the SMTP server is not available. The default is 10.
Data Collection
Collect data for availability of SMTP server?
Select Yes to collect data for the availability of the SMTP server. The default is unselected.
A value of 0 means that the SMTP server is either not configured or is unavailable. A value of 100 means that the SMTP server is configured and available.
52 NetIQ AppManager for Microsoft SharePoint Server Management Guide

3.15 RecycleBinInfoUse this Knowledge Script to monitor Recycle Bin usage for all Web applications running on the SharePoint server. This script raises an event if the percentage of the site quota for the Recycle Bin exceeds the specified threshold.
This script monitors two stages of Recycle Bins for site quota usage. By default, SharePoint Server enables the first, or primary, stage of the Recycle Bin. To monitor the secondary stage of the Recycle Bin, enable the secondary Recycle Bin. For more information about enabling the Recycle Bin features, see the Microsoft SharePoint documentation.
For each stage, you can configure this script to raise a warning alert or critical alert when Recycle Bin site quota utilization exceeds a particular threshold. In addition, you can configure this script to empty the Recycle Bin when it reaches a specific threshold, and to raise an event when primary or secondary stage Recycle Bin items have been deleted.
The secondary Recycle Bin utilizes 50% of the site quota value. For example, if the site quota value is 10 MB, by default the secondary recycle bin uses 5 MB. The value of the secondary Recycle Bin can be customized by changing the value of the site quota.
3.15.1 Resource ObjectsSharePoint Server: Web Applications
3.15.2 Default ScheduleThe default interval for this script is every 24 hours.
3.15.3 Setting Parameter ValuesSet the following parameters as needed:
Description How to Set It
General Settings
Job failure event notification
Event severity when job fails Set the event severity level, from 1 to 40, to indicate the importance of an event in which the job fails to monitor a Recycle Bin. The default is 5.
Monitor Recycle Bin Information
Comma-separated list of Web applications to exclude
Specify a list of Web applications to ignore when monitoring. Use commas to separate multiple Web applications.
File path of a file containing a list of site collection URLs to exclude from monitoring (one per line)
Specify the UNC or file path of a file that contains a list of sites to ignore when monitoring. In the file, list the sites to be excluded, one site per line.
The site collection URLs in your list must be in the same format as they appear in event messages. Include the http:// at the beginning of the URL, and do not include a trailing "/" at the end of the URL (which will cause the job to monitor the site collection you are trying to exclude).
SharePoint Knowledge Scripts 53

When a quota is not configured for a site, set a value to calculate the site’s utilization
Specify a value for a site that does not have a quota configured. This value is used to calculate the utilization percentage of the site. The default is 0, which means that this script will not monitor Recycle Bins for site collections that do not have a quota configured.
Event Notification
Monitor First Stage Recycle Bin
Raise warning event if first stage Recycle Bin site quota utilization exceeds threshold?
Select Yes to raise a warning event if the first stage Recycle Bin site quota exceeds the threshold you set. The default is Yes.
By default, the Knowledge Script job reads the quota configured in the SharePoint site. If the quota is not configured in the site, the job reads the quota configured in this Knowledge Script.
Event severity when first stage Recycle Bin site quota utilization exceeds threshold
Set the severity level, from 1 to 40, to indicate the importance of an event in which the first stage site quota usage threshold is exceeded. The default is 15.
Threshold -- Maximum warning threshold for first stage Recycle Bin site quota utilization
Specify the maximum first stage site quota utilization allowed before a warning event is raised. The default is 85%.
Raise critical event if first stage Recycle Bin site quota utilization exceeds threshold?
Select Yes to raise a critical event if the first stage Recycle Bin site quota exceeds the threshold you set. The default is Yes.
By default, the Knowledge Script job reads the quota configured in the SharePoint site. If the quota is not configured in the site, the job reads the quota configured in this Knowledge Script.
Event severity when first stage Recycle Bin site quota utilization exceeds threshold
Set the severity level, from 1 to 40, to indicate the importance of an event in which the first stage site quota usage threshold is exceeded. The default is 10.
Threshold -- Maximum critical threshold for first stage Recycle Bin site quota utilization
Specify the maximum site quota utilization allowed before a critical event is raised. The default is 95%.
Empty first stage Recycle Bin if site quota utilization exceeds critical threshold?
Select Yes to empty the first stage Recycle Bin if the site quota utilization exceeds the threshold you set for raising critical events. The default is unselected.
Raise event when all the first stage Recycle Bin items are deleted successfully?
Select Yes to raise an event when the first stage Recycle Bin items are deleted. The default is unselected.
Event severity when all the first stage Recycle Bin items are deleted successfully
Set the severity level, from 1 to 40, to indicate the importance of an event in which the first stage Recycle Bin items are deleted. The default is 25.
Monitor Second Stage Recycle Bin
Raise warning event if second stage Recycle Bin site quota utilization exceeds threshold?
Select Yes to raise a warning event if the second stage Recycle Bin site quota exceeds the threshold you set. The default is Yes.
By default, the Knowledge Script job reads the quota configured in the SharePoint site. If the quota is not configured in the site, the job reads the quota configured in this Knowledge Script.
Description How to Set It
54 NetIQ AppManager for Microsoft SharePoint Server Management Guide

Event severity when second stage Recycle Bin site quota utilization exceeds threshold
Set the severity level, from 1 to 40, to indicate the importance of an event in which the second stage site quota usage threshold is exceeded. The default is 15.
Threshold -- Maximum warning threshold for second stage Recycle Bin site quota utilization
Specify the maximum second stage site quota utilization allowed before a warning event is raised. The default is 85%.
Raise critical event if second stage Recycle Bin site quota utilization exceeds threshold?
Select Yes to raise a critical event if the second stage Recycle Bin site quota exceeds the threshold you set. The default is Yes.
By default, the Knowledge Script job reads the quota configured in the SharePoint site. If the quota is not configured in the site, the job reads the quota configured in this Knowledge Script.
Event severity when second stage Recycle Bin site quota utilization exceeds threshold
Set the severity level, from 1 to 40, to indicate the importance of an event in which the second stage site quota usage threshold is exceeded. The default is 10.
Threshold -- Maximum critical threshold for second stage Recycle Bin site quota utilization
Specify the maximum site quota utilization allowed before a critical event is raised. The default is 95%.
Empty second stage Recycle Bin if site quota utilization exceeds critical threshold?
Select Yes to empty the second stage Recycle Bin if the site quota utilization exceeds the threshold you set for raising critical events. The default is unselected.
Raise event when all the second stage Recycle Bin items are deleted successfully?
Select Yes to raise an event when the second stage Recycle Bin items are deleted. The default is unselected.
Event severity when all the second stage Recycle Bin items are deleted successfully
Set the severity level, from 1 to 40, to indicate the importance of an event in which the second stage Recycle Bin items are deleted. The default is 25.
Raise event if a site does not have a quota template configured?
Select Yes to raise an event if the site does not have a quota template configured. The default is unselected.
Event severity when a site does not have a quota template configured
Set the event severity level, from 1 to 40, to indicate the importance of an event in which a site does not have a quota template configured. The default is 11.
Data Collection
Collect data for first stage Recycle Bin site quota utilization?
Select Yes to collect data for charts and reports. If enabled, data collection returns data for first stage Recycle Bin site quota use. The default is unselected.
The RecycleBinInfo script will not collect data if the quota is set to 0, or if the following parameter is set to 0: When a quota is not configured for a site, set a value to calculate the site’s utilization, even if you select Yes for that parameter.
Description How to Set It
SharePoint Knowledge Scripts 55

3.16 Report_ServerUptimeUse this Knowledge Script to summarize the number of hours the SharePoint server has been operational since the last reboot. This report allows you to make a statistical analysis of the data point values.
This report uses data collected by the ServerUptime Knowledge Script.
3.16.1 Resource ObjectReport agent
3.16.2 Default ScheduleThe default schedule for this script is Run once.
3.16.3 Setting Parameter ValuesSet the following parameters as needed:
Collect data for second stage Recycle Bin site quota utilization?
Select Yes to collect data for charts and reports. If enabled, data collection returns data for second stage Recycle Bin site quota use. The default is unselected.
The RecycleBinInfo script will not collect data if the quota is set to 0, or if the following parameter is set to 0: When a quota is not configured for a site, set a value to calculate the site’s utilization, even if you select Yes for that parameter.
Description How to Set It
Description How to Set It
Data Source
Select computers Select the computers for your report.
Select time range Set a specific or sliding time range for data included in your report.
Select peak weekdays Select the day or days of the week to include in your report.
Select the style Select the style for the report:
By computer: Shows one value for each computer you selected.
By legend: Shows one value for each different legend (the legend is a truncated form of the data stream legend visible in the Operator Console).
By computer and legend: Shows one value for each unique legend from each computer.
The default is By computer and legend.
Data Settings
56 NetIQ AppManager for Microsoft SharePoint Server Management Guide

Statistics to show Select the statistical method to display data in the report:
Average: Average value of data points for the time range of the report
Minimum: Minimum value of data points for the time range of the report
Maximum: Maximum value of data points for the time range of the report
Min/Avg/Max: Minimum, average, and maximum values of data points for the time range of the report
Range: Range of values in the data stream (maximum - minimum = range)
StandardDeviation: Measure of how widely values are dispersed from the mean
Sum: Total value of data points for the time range of the report
Close: Last value for the time range of the report
Change: Difference between the first and last values for the time range of the report (close - open = change)
Count: Number of data points for the time range of the report
The default is Average.
Select sorting/display option Select whether data is sorted, or the method of display:
No sort: Data is not sorted
Sort: Data is sorted by value (lowest to highest from front to back; highest to lowest from left to right)
Top %: Chart only the top N% of selected data
Top N: Chart only the top N of selected data
Bottom %: Chart only the bottom N% of data
Bottom N: Chart only the bottom N of selected data
The default is No sort.
Percentage/count for top/bottom Specify a number for either the percentage or count defined in the previous parameter (for example, Top 10%, or Top 10). The default is 25.
Truncate top/bottom? If you select Yes, then the data table shows only the top or bottom N or % (for example, only the top 10%). Otherwise, the table shows all data. The default is unselected.
Show totals on the table? If you select Yes, additional calculations are made for each column of numbers in a table, and the following values are listed at the end of the table:
Report Average: Average of all values in a column
Report Minimum: Minimum value in a column
Report Maximum: Maximum value in a column
Report Total: Total of all values in a column
The default is unselected.
Report Settings
Description How to Set It
SharePoint Knowledge Scripts 57

3.17 Report_SiteInfoUse this Knowledge Script to summarize information about the Web applications on the SharePoint server, sorted by date and space utilized. This report allows you to make a statistical analysis of the data point values.
This report uses data collected by the SiteInfo Knowledge Script.
3.17.1 Resource ObjectReport agent
3.17.2 Default ScheduleThe default schedule for this script is Run once.
Include parameter help card? Select Yes to include a table in the report that lists parameter settings for the report script. The default is Yes.
Include table? Select Yes to include a table of data stream values in the report. The default is Yes.
Include chart? Select Yes to include a chart of data stream values in the report. The default is Yes.
Select chart style Define the graphic properties of the charts in your report.
Select output folder Set parameters for the output folder.
Add job ID to output folder name?
Select Yes to append the job ID to the name of the output folder. A job ID helps you correlate a specific instance of a Report Script and the corresponding report. The default is unselected.
Select properties Set miscellaneous report properties as needed.
Add time stamp to title? Select Yes to append a timestamp to the title of the report, making each title unique. The timestamp is composed of the date and time the report was generated.
A timestamp lets you run consecutive iterations of the same report without overwriting previous output. The default is unselected.
Event Notification
Event for report success? Select Yes to raise an event in which the report is successfully generated. The default is Yes.
Severity level for report success Set the event severity level, from 1 to 40, to indicate the importance of an event in which the report is generated successfully. The default is 35.
Severity level for report with no data
Set the event severity level, from 1 to 40, to indicate the importance of an event in which the report contains no data. The default is 25.
Severity level for report failure Set the event severity level, from 1 to 40, to indicate the importance of an event in which the report is not generated. The default is 5.
Description How to Set It
58 NetIQ AppManager for Microsoft SharePoint Server Management Guide

3.17.3 Setting Parameter ValuesSet the following parameters as needed:
Parameter How to Set It
Data Source
Select computerwizard Select the computers for your report.
Select the style Select the style for the report:
By computer: Shows one value for each computer you selected.
By data stream: Shows one value for each different legend on the report
By computer and data stream: Shows one value for each unique legend from each computer.
By Knowledge Script: Shows values based on this Knowledge Script.
All data streams on one page: Shows values of all data streams on a single page.
The default is By computer.
Select time range Set a specific or sliding time range for data included in your report.
Select peak weekdays Select the days of the week to include in your report.
Aggregation by Select an aggregation method by which to display data in the report:
Minute: Average values based on minutes.
Hour: Average values based on hours.
Day: Average values based on days.
The default is Hour.
Aggregation interval Select an aggregation interval by which to display data in the report. You can select an aggregation interval in the range of 1 through 90. The report displays data based both on the aggregation method and interval. For example, 90 hours, 24 minutes, 7 days.
SharePoint Knowledge Scripts 59

Statistics to show per period Select a statistical method by which to display data in the report:
Average: Average value of data points for the time range of the report
Minimum: Minimum value of data points for the time range of the report
Maximum: Maximum value of data points for the time range of the report
Count: Number of data points for the time range of the report
Sum: Total value of data points for the time range of the report
3Sigma: The average + (3 * standard deviation) and average - (3 * standard deviation).
Std: Measure of how widely values are dispersed from the mean.
Box: Lower fence, 25% point, median, 75% point, and upper fence for the aggregation interval.
Open: The first value for the aggregation interval.
Close: Last value for the time range of the report.
The default is Average.
Report Settings
Include parameter help card? Select Yes to include a table in the report that lists parameter settings for the report script. The default is Yes.
Include table? Select Yes to include a table of data stream values in the report. The default is Yes.
Include chart? Select Yes to include a chart of data stream values in the report. The default is Yes.
Select chart style Define the graphic properties of the charts in your report.
Select output folder Set parameters for the output folder.
Add job ID to output folder name?
Select Yes to append the job ID to the name of the output folder. A job ID helps you correlate a specific instance of a Report Script and the corresponding report. The default is unselected.
Select properties Set miscellaneous report properties as needed.
Add time stamp to title? Select Yes to append a timestamp to the title of the report, making each title unique. The timestamp is composed of the date and time the report was generated.
A timestamp lets you run consecutive iterations of the same report without overwriting previous output. The default is unselected.
Event Notification
Event for report success? Select Yes to raise an event in which the report is successfully generated. The default is Yes.
Severity level for report success Set the event severity level, from 1 to 40, to indicate the importance of an event in which the report is generated successfully. The default is 35.
Severity level for report with no data
Set the event severity level, from 1 to 40, to indicate the importance of an event in which the report contains no data. The default is 25.
Parameter How to Set It
60 NetIQ AppManager for Microsoft SharePoint Server Management Guide

3.18 Report_SiteUsageUse this Knowledge Script to summarize usage information about each Web application on the SharePoint server. This report allows you to make a statistical analysis of the data point values.
This report uses data collected by the SiteUsage Knowledge Script.
3.18.1 Resource ObjectReport agent
3.18.2 Default ScheduleThe default schedule for this script is Run once.
3.18.3 Setting Parameter ValuesSet the following parameters as needed:
Severity level for report failure Set the event severity level, from 1 to 40, to indicate the importance of an event in which the report is not generated. The default is 5.
Parameter How to Set It
Description How to Set It
Data Source
Select computerwizard Select the computers for your report.
Select the style Select the style for the report:
By computer: Shows one value for each computer you selected.
By data stream: Shows one value for each different legend on the report
By computer and data stream: Shows one value for each unique legend from each computer.
By Knowledge Script: Shows values based on this Knowledge Script.
All data streams on one page: Shows values of all data streams on a single page.
The default is By computer.
Select time range Set a specific or sliding time range for data included in your report.
Select peak weekdays Select the days of the week to include in your report.
SharePoint Knowledge Scripts 61

Aggregation by Select an aggregation method by which to display data in the report:
Minute: Average values based on minutes.
Hour: Average values based on hours.
Day: Average values based on days.
The default is Hour.
Aggregation interval Select an aggregation interval by which to display data in the report. You can select an aggregation interval in the range of 1 through 90. The report displays data based both on the aggregation method and interval. For example, 90 hours, 24 minutes, 7 days.
Statistics to show per period Select a statistical method by which to display data in the report:
Average: Average value of data points for the time range of the report.
Minimum: Minimum value of data points for the time range of the report.
Maximum: Maximum value of data points for the time range of the report.
Count: Number of data points for the time range of the report.
Sum: Total value of data points for the time range of the report.
3Sigma: The average + (3 * standard deviation) and average - (3 * standard deviation).
Std: Measure of how widely values are dispersed from the mean.
Box: Lower fence, 25% point, median, 75% point, and upper fence for the aggregation interval.
Open: The first value for the aggregation interval.
Close: Last value for the time range of the report.
The default is Average.
Report Settings
Include parameter help card? Select Yes to include a table in the report that lists parameter settings for the report script. The default is Yes.
Include table? Select Yes to include a table of data stream values in the report. The default is Yes.
Include chart? Select Yes to include a chart of data stream values in the report. The default is Yes.
Select chart style Define the graphic properties of the charts in your report.
Select output folder Set parameters for the output folder.
Add job ID to output folder name?
Select Yes to append the job ID to the name of the output folder. A job ID helps you correlate a specific instance of a Report Script and the corresponding report. The default is unselected.
Select properties Set miscellaneous report properties as needed.
Description How to Set It
62 NetIQ AppManager for Microsoft SharePoint Server Management Guide

3.19 Report_WebPartInfoUse this Knowledge Script to summarize the status and availability of Web Parts used by the SharePoint server. This report allows you to make a statistical analysis of the data point values.
This report uses data collected by the WebPartInfo Knowledge Script.
3.19.1 Resource ObjectReport agent
3.19.2 Default ScheduleThe default schedule for this script is Run once.
3.19.3 Setting Parameter ValuesSet the following parameters as needed:
Add time stamp to title? Select Yes to append a timestamp to the title of the report, making each title unique. The timestamp is composed of the date and time the report was generated.
A timestamp lets you run consecutive iterations of the same report without overwriting previous output. The default is unselected.
Event Notification
Event for report success? Select Yes to raise an event in which the report is successfully generated. The default is Yes.
Severity level for report success Set the event severity level, from 1 to 40, to indicate the importance of an event in which the report is generated successfully. The default is 35.
Severity level for report with no data
Set the event severity level, from 1 to 40, to indicate the importance of an event in which the report contains no data. The default is 25.
Severity level for report failure Set the event severity level, from 1 to 40, to indicate the importance of an event in which the report is not generated. The default is 5.
Description How to Set It
Description How to Set It
Data Source
Select computer wizard Select the computers for your report.
SharePoint Knowledge Scripts 63

Select the style Select the style for the report:
By computer: Shows one value for each computer you selected.
By data stream: Shows one value for each different legend on the report
By computer and data stream: Shows one value for each unique legend from each computer.
By Knowledge Script: Shows values based on this Knowledge Script.
All data streams on one page: Shows values of all data streams on a single page.
The default is By computer.
Select time range Set a specific or sliding time range for data included in your report.
Select peak weekdays Select the days of the week to include in your report.
Aggregation by Select an aggregation method by which to display data in the report:
Minute: Average values based on minutes.
Hour: Average values based on hours.
Day: Average values based on days.
The default is Hour.
Aggregation interval Select an aggregation interval by which to display data in the report. You can select an aggregation interval in the range of 1 through 90. The report displays data based both on the aggregation method and interval. For example, 90 hours, 24 minutes, 7 days.
Statistics to show per period Select a statistical method by which to display data in the report:
Average: Average value of data points for the time range of the report.
Minimum: Minimum value of data points for the time range of the report.
Maximum: Maximum value of data points for the time range of the report.
Count: Number of data points for the time range of the report.
Sum: Total value of data points for the time range of the report.
3Sigma: The average + (3 * standard deviation) and average - (3 * standard deviation).
Std: Measure of how widely values are dispersed from the mean.
Box: Lower fence, 25% point, median, 75% point, and upper fence for the aggregation interval.
Open: The first value for the aggregation interval.
Close: Last value for the time range of the report.
The default is Average.
Report Settings
Include parameter help card? Select Yes to include a table in the report that lists parameter settings for the report script. The default is Yes.
Description How to Set It
64 NetIQ AppManager for Microsoft SharePoint Server Management Guide

3.20 SearchStatusUse this Knowledge Script to monitor the Search service and crawl status in the SharePoint server farm. This script monitors default Search services, and does not monitor custom Search services. This Knowledge Script raises an event when the Search service or the crawl is down.
3.20.1 Resource ObjectsSharePoint Server
3.20.2 Default ScheduleThe default interval for this script is every hour.
Include table? Select Yes to include a table of data stream values in the report. The default is Yes.
Include chart? Select Yes to include a chart of data stream values in the report. The default is Yes.
Select chart style Define the graphic properties of the charts in your report.
Select output folder Set parameters for the output folder.
Add job ID to output folder name?
Select Yes to append the job ID to the name of the output folder. A job ID helps you correlate a specific instance of a Report Script and the corresponding report. The default is unselected.
Select properties Set miscellaneous report properties as needed.
Add time stamp to title? Select Yes to append a timestamp to the title of the report, making each title unique. The timestamp is composed of the date and time the report was generated.
A timestamp lets you run consecutive iterations of the same report without overwriting previous output. The default is unselected.
Event Notification
Event for report success? Select Yes to raise an event in which the report is successfully generated. The default is Yes.
Severity level for report success Set the event severity level, from 1 to 40, to indicate the importance of an event in which the report is generated successfully. The default is 35.
Severity level for report with no data
Set the event severity level, from 1 to 40, to indicate the importance of an event in which the report contains no data. The default is 25.
Severity level for report failure Set the event severity level, from 1 to 40, to indicate the importance of an event in which the report is not generated. The default is 5.
Description How to Set It
SharePoint Knowledge Scripts 65

3.20.3 Setting Parameter ValuesSet the following parameters as needed:
3.21 ServerUptimeUse this Knowledge Script to monitor the number of hours the servers hosting the SharePoint server have been operational since the last reboot, giving you real-time data about the availability of the SharePoint server. This script raises an event if servers hosting the SharePoint server are rebooted during the monitoring interval.
3.21.1 Resource ObjectSharePoint Server
Description How to Set It
General Settings
Job failure event notification
Event severity when job fails Set the event severity level, from 1 to 40, to indicate the importance of an event in which the job fails to monitor the Search service and crawl status in the server farm. The default is 5.
Monitor Search Service Status
Event Notification
Raise event when heartbeat of search service is down?
Select Yes to raise an event if the heartbeat of the Search service is down. The default is Yes.
Event severity when heartbeat of search service is down
Set the event severity level, from 1 to 40, to indicate the importance of an event in which the heartbeat of the Search service is down. The default is 10.
Monitor Crawl Status
Raise event when crawl status is down?
Select Yes to raise an event if the crawl is down. The default is Yes.
Event severity when crawl status is down
Set the event severity level, from 1 to 40, to indicate the importance of an event in which the crawl is down. The default is 15.
Data Collection
Collect data for search service status? Select Yes to collect data for charts and reports. If enabled, data collection returns data about the status of the Search service. The default is unselected.
A value of 0 means that the Search service is down. A value of 100 means that the Search service is up.
Collect data for crawl status? Select Yes to collect data for charts and reports. If enabled, data collection returns data about the status of the crawl. The default is unselected.
A value of 0 means that the crawl is down. A value of 100 means that the crawl is up.
66 NetIQ AppManager for Microsoft SharePoint Server Management Guide

3.21.2 Default ScheduleThe default interval for this script is every 5 minutes.
3.21.3 Setting Parameter ValuesSet the following parameters as needed:
3.22 SiteCollectionUserCountUse this Knowledge Script to monitor the number of users in a site collection.
This Knowledge Script monitors the three user types that SharePoint sites support: AllUsers, SiteUsers, and Users. The following list describes each type:
AllUsers: Obtains the collection of users that represents all users who are either members of the site, or who have browsed to the site as authenticated members of a domain group in the site.SiteUsers: Obtains the collection of all users that belong to the site collection.Users: Obtains the collection of users that are explicitly assigned permissions in the Web site.
For more information about SharePoint user types, see the Microsoft SharePoint documentation.
This Knowledge Script raises an event when the count for AllUsers, SiteUsers, or Users exceeds the threshold.
3.22.1 Resource ObjectsSharePoint Server: Web Applications
Description How to Set It
General Settings
Job failure event notification
Event severity when job fails Set the event severity level, from 1 to 40, to indicate the importance of an event in which the job fails to monitor the number of hours the SharePoint server has been operational since the last reboot. The default is 5.
Monitor Server Uptime
Event Notification
Raise an event if a system is rebooted during the monitoring interval?
Select Yes to raise an event if a computer hosting the SharePoint server is rebooted during the monitoring interval. The default is Yes.
Event severity when system is rebooted
Set the severity level, from 1 to 40, to indicate the importance of the event in which a system is rebooted during the monitoring interval. The default is 25.
Data Collection
Collect data for SharePoint Server reboot?
Select Yes to collect data about SharePoint Server reboot. The default is unselected.
SharePoint Knowledge Scripts 67

3.22.2 Default ScheduleThe default interval for this script is every hour.
3.22.3 Setting Parameter ValuesSet the following parameters as needed:
Description How to Set It
General Settings
Job failure event notification
Event severity when job fails Set the event severity level, from 1 to 40, to indicate the importance of an event in which the job fails to monitor the number of users in a site collection. The default is 5.
Monitor Number of Users in a Site Collection
Event Notification
Raise event when the All Users count exceeds the threshold?
Select Yes to raise an event if the All Users count exceeds the threshold. The default is Yes.
Event severity when the All Users count exceeds the threshold
Set the event severity level, from 1 to 40, to indicate the importance of an event in which the All Users count exceeds the threshold you set. The default is 10.
Threshold -- Maximum count for All Users
Specify the maximum count for All Users before an event is raised. The default is 1000.
Raise event when the Site Users count exceeds the threshold?
Select Yes to raise an event if the Site Users count exceeds the threshold. The default is Yes.
Event severity when the Site Users count exceeds the threshold
Set the event severity level, from 1 to 40, to indicate the importance of an event in which the Site Users count exceeds the threshold you set. The default is 15.
Threshold -- Maximum count for Site Users
Specify the maximum count for Site Users before an event is raised. The default is 1000.
Raise event when the Users count exceeds the threshold?
Select Yes to raise an event if the Users count exceeds the threshold. The default is Yes.
Event severity when the Users count exceeds the threshold
Set the event severity level, from 1 to 40, to indicate the importance of an event in which the Users count exceeds the threshold you set. The default is 25.
Threshold -- Maximum count for Users Specify the maximum count for Users before an event is raised. The default is 1000.
Data Collection
Collect data for the All Users count? Select Yes to collect data for charts and reports. If enabled, data collection returns the All Users count for the site collection. The default is unselected.
Collect data for the Site Users count? Select Yes to collect data for charts and reports. If enabled, data collection returns the Site Users count for the site collection. The default is unselected.
68 NetIQ AppManager for Microsoft SharePoint Server Management Guide

3.23 SiteEventLogUse this Knowledge Script to monitor the event log for events related to Web application usage on the SharePoint server.
This script raises events for the following error codes:
642: User Account Maintenance.5187: My Web application Creation failure.5550: A Web application move operation has failed--leaving the Web application structure in an unusual state.5551: A Web application copy operation has failed--leaving the Web application structure in an unusual state.5552: A Web application deletion operation has failed--leaving the Web application structure in an unusual state.5553: Web application Synch failed.5555: Content Database Synchronization failed.5707: Profile Import failed.5708: Membership Import failed.
3.23.1 Resource ObjectsSharePoint Server
3.23.2 Default ScheduleThe default interval for this script is every 10 minutes.
3.23.3 Setting Parameter ValuesSet the following parameters as needed:
Collect data for the Users count? Select Yes to collect data for charts and reports. If enabled, data collection returns the Users count for the site collection. The default is unselected.
Description How to Set It
Description How to Set It
General Settings
Job failure event notification
Event severity when job fails Set the event severity level, from 1 to 40, to indicate the importance of an event in which the SiteEventLog job fails. The default is 5.
Additional Settings
Event Details
SharePoint Knowledge Scripts 69

3.24 SiteInfoUse this Knowledge Script to monitor space utilization and date information about the Web applications on the SharePoint server. The space information refers to the size of the file, and the date information refers to when the file was last modified.
Space utilization information includes the number of Web applications that have been added recently, along with the number of existing Web applications that have been modified, and Web applications that have been deleted. You can obtain detailed information about SharePoint Web application types such as documents, document libraries, and lists in report format.
This script helps you quickly locate the Web applications that are using more than the maximum amount of allotted space. The script raises an event if date or space utilization exceeds the threshold you set.
Event detail format Specify the format of the event details, either as an HTML table or as plain text. The default is HTML Table.
Monitor Site Event Log
Event Notification
Raise event if the Web application raises an error?
Select Yes to raise an event if the Web application raises an error event in the event log. The default is Yes.
Event severity when an event is raised Set the event severity level, from 1 to 40, to indicate the importance of an event raised as a result of an error event in the event log. The default is 20.
Data Collection
Collect data for site event log? Select Yes to collect data for charts and reports. The default is unselected.
Events in past N hours Set this parameter to control event checking for the first interval (after which checking is incremental):
-1 lists all the existing entries
N lists events for the past n hours, such as 8 for the past 8 hours, or 50 for the past 50 hours
0 lists only entries from this moment on, without listing any previous entries
The default is 0.
Maximum number of entries per event report
Specify the maximum number of entries, from 1 to 100, that you want to be recorded in each event's detail message.
If this script finds more entries from the log than it can put into one event message, it will return multiple events to report all the outstanding entries in the log. The default is 30 entries.
If this script encounters one or more very large events in the Windows Event log, this script may error out and generate the following event message: Out of string space. If this occurs, specify a smaller value for this parameter.
Description How to Set It
70 NetIQ AppManager for Microsoft SharePoint Server Management Guide
Note that the SharePoint module only discovers Web applications with at least one site collection. This script raises an event if the Web application has no site collections or if there is no data available for the Web application.
Web application information is displayed in report format, which you can customize.
3.24.1 Resource ObjectsSharePoint Server: Web Applications
3.24.2 Default ScheduleThe default interval for this script is every 24 hours.
3.24.3 Setting Parameter ValuesSet the following parameters as needed:
Description How to Set It
General Settings
Job failure event notification
Event severity when job fails Set the event severity level, from 1 to 40, to indicate the importance of an event in which the SiteInfo job fails. The default is 5.
Event Notification
Raise event for date information?
Select Yes to raise an event in which the Knowledge Script collects date information for Web applications on the SharePoint server. The default is Yes.
Event severity when site date information is collected successfully
Set the event severity level, from 1 to 40, to indicate the importance of an event in which the Web application date information is successfully collected. The default is 25.
Raise event for space utilization?
Select Yes to raise an event in which the Knowledge Script collects space utilization information for Web applications on the SharePoint server. The default is Yes.
Event severity when space utilization data is collected successfully
Set the event severity level, from 1 to 40, to indicate the importance of an event in which space utilization information about Web applications is successfully collected. The default is 25.
Raise event if no data is available?
Select Yes to raise an event if no date or space utilization information exists for the Web applications on the SharePoint server. The default is unselected.
Event severity when no data is available
Set the event severity level, from 1 to 40, to indicate the importance of an event in which no space utilization or date information exists. The default is 11.
Data Collection
Collect site date information? Select Yes to collect site date information. If enabled, data collection returns information about the date that sites were created and last modified. The default is unselected.
SharePoint Knowledge Scripts 71

3.25 SiteUsageUse this Knowledge Script to monitor usage information about each Web application on the SharePoint server.
This script collects usage information based on the following parameters:
URLUserOperating System
Collect site space utilization data?
Select Yes to collect information about the space utilized by each site on the SharePoint server. If enabled, data collection returns information about how much space each site uses. The default is unselected.
Monitoring
Enter date in the format mm/dd/yyyy
To monitor date information, such as when a file was last modified, specify the date in the following format: mm/dd/yyyy
If you alter the date format, the report displays an error. The default is blank. If you leave this setting blank, the job uses the current date for filtering the date information.
Select site type: Select the type of SharePoint Web application that you want to view in the report. This Knowledge Script identifies Web application types using codes. Select:
0-All: To view all Web application types in the report
1-Lists: To view only the “lists” Web application type in the report
2-Document Library: To view only the “document library” Web application type in the report
3-Document: To view only the “documents” Web application type in the report.
If you do not select a specific Web application type, this script displays all Web application types in the report by default.
Threshold -- Maximum KB of space utilized by each site
Specify the maximum amount of space that can be used by Web applications before an event is raised. The default is 0 KB.
Display report in ascending order?
Select Yes to view the report items in the ascending order of the items’ last modified date. The space utilization information is ordered by size (in KB). The default is unselected.
The maximum number of records to display
Specify the maximum number of records per site collection that you want to display in your report.
If you set the number of records to 0, the SiteInfo script displays all the records.
If you set the number of records to 5, for example, the SiteInfo script displays the 5 top records for each site collection. So If you have 20 site collections, the report displays 100 records.
The default is 50.
Description How to Set It
72 NetIQ AppManager for Microsoft SharePoint Server Management Guide

BrowserReferrer URL
Web application usage information is displayed in report format. You can customize the format in which the report displays the information.
3.25.1 Resource ObjectsSharePoint Server: Web Applications
3.25.2 Default ScheduleThe default interval for this script is every hour.
3.25.3 Setting Parameter ValuesSet the following parameters as needed:
Description How to Set It
General Settings
Job failure event notification
Event severity when job fails Set the event severity level, from 1 to 40, to indicate the importance of an event in which the job fails to monitor usage information about Web applications. The default is 5.
Monitor Site Usage
Comma-separated list of Web applications to exclude
Specify a list of Web applications to ignore when monitoring. Use commas to separate multiple Web applications.
File path of a file containing a list of site collection URLs to exclude from monitoring (one per line)
Specify the UNC or file path of a file that contains a list of sites to ignore when monitoring. In the file, list the sites to be excluded, one site per line.
The site collection URLs in your list must be in the same format as they appear in event messages. Include the http:// at the beginning of the URL, and do not include a trailing "/" at the end of the URL (which will cause the job to monitor the site collection you are trying to exclude).
SharePoint Knowledge Scripts 73

Select report type: Select the report type that you want to view. The report type dictates how data is filtered (included or excluded).
This script uses the following codes to identify report types. Select the code to view the report based on that code. The default is 0-URL.
0-URL: URLs of pages that are visited, or of pages for lists that are updated.
1-User: Names of users who visited the Web application.
2-OS: The operating system used on the client computer. All Web application usage data refers specifically to visits from referrer URLs external to the application.
3-Browser: The type of Web browser used to visit the SharePoint Web application. All usage data refers specifically to visits from referrer URLs external to the application.
4-RefURL: External URLs through which users navigated to the SharePoint application.
Select report format: Select the format in which you want to view the report. The default is 0-Day-wise.
0-Day-wise: Displays usage information for each day over the previous 31 days, not including the day the report is generated.
1-Summary: Summarizes usage information for the previous 31 days, not including the day the report is generated.
The maximum number of records to display
Specify the maximum number of records per site collection that you want to display in your report.
If you set the number of records to 0, the SiteUsage script displays all the records.
If you set the number of records to 5, for example, the SiteUsage script displays the 5 top records for each site collection in the report.
The default value is 50.
Data Collection
Collect site usage data on the SharePoint server?
Select Yes to collect usage data for Web applications on your SharePoint Server. The default is unselected.
Include detail report Select this parameter to display the detail report with data points. The default is unselected.
Event Notification
Raise event when the site usage report is created?
Select Yes to raise an event in which a report for Web application usage is generated. The default is Yes.
Event severity when the site usage report is created
Set the event severity level, from 1 to 40, to indicate the importance of an event in which a report for Web application usage is generated. The default is 25.
Raise event when site usage report is unable to be created?
Select Yes to raise an event if no usage information exists for the Web applications on the SharePoint server, so no report can be generated. The default is Yes.
Description How to Set It
74 NetIQ AppManager for Microsoft SharePoint Server Management Guide

3.26 VisualModeSiteCountUse this Knowledge Script to monitor the Visual Mode Site count for each Web application, site collection, and sub-site on a Microsoft SharePoint 2010 server or later.
The Visual Upgrade feature in SharePoint 2010 or later is a site-level setting that selects which product version UI to use when displaying the site.
This Knowledge Script raises an event if the number of visual or non-visual sites exceeds the threshold. This script collects usage data for visual and non-visual site counts.
3.26.1 Resource ObjectsSharePoint Server: Web Applications
3.26.2 Default ScheduleThe default interval for this script is every 15 minutes.
3.26.3 Setting Parameter ValuesSet the following parameters as needed:
Event severity when site usage report is unable to be created
Set the event severity level, from 1 to 40, to indicate the importance of an event in which no usage information exists. The default is 11.
Description How to Set It
Description How to Set It
General Settings
Job failure event notification
Event severity when job fails Set the event severity level, from 1 to 40, to indicate the importance of an event in which the job fails to monitor the Visual Mode Site count for Web applications. The default is 5.
Monitor Visual Mode Site Counts for all Web Applications
Event Notification
Raise event if number of visual site counts exceeds threshold?
Select Yes to raise an event if the number of visual site counts exceed the threshold. The default is Yes.
Event severity when visual mode site counts exceeds threshold
Set the event severity level, from 1 to 40, to indicate the importance of an event in which the number of visual site counts exceed the threshold. The default is 10.
Threshold -- Maximum number of visual mode site counts
Specify the maximum number of visual mode site counts allowed before an event is raised. The default is 1000.
Raise event if number of non-visual mode site counts exceeds threshold?
Select Yes to raise an event if the number of non-visual mode site counts exceeds the threshold. The default is Yes.
SharePoint Knowledge Scripts 75

3.27 WebApplicationUptimeUse this Knowledge Script to monitor the uptime of Web applications on your SharePoint server. Uptime is the minimum time (threshold) that Web applications on your SharePoint server should run. This script raises an event if uptime for Web applications falls below the threshold you set.
3.27.1 Resource ObjectsSharePoint Server: Web Applications
3.27.2 Default ScheduleThe default interval for this script is every hour.
3.27.3 Setting Parameter ValuesSet the following parameters as needed:
Event severity when non-visual mode site counts exceed threshold
Set the event severity level, from 1 to 40, to indicate the importance of an event in which the number of non-visual mode site counts exceeds the threshold. The default is 15.
Threshold -- Maximum number of non-visual mode site counts
Specify the maximum number of non-visual mode site counts allowed before an event is raised. The default is 1000.
Data Collection
Collect data for visual site counts?
Select Yes to collect usage data for visual site counts on your SharePoint server. The default is unselected.
Collect data for non-visual site counts?
Select Yes to collect usage data for non-visual site counts on your SharePoint server. The default is unselected.
Description How to Set It
Description How to Set It
General Settings
Job failure event notification
Event severity when job fails Set the event severity level, from 1 to 40, to indicate the importance of an event in which the job fails to monitor usage Web application uptime. The default is 5.
Monitor Web Application Uptime
Event Notification
Raise event if Web application uptime falls below threshold?
Select Yes to raise an event if the length of time a Web application has been running falls below the threshold you set. The default is Yes.
Event severity when uptime falls below threshold
Set the severity level, from 1 to 40, to indicate the importance of the event if the Web application uptime falls below the threshold you set. The default is 10.
76 NetIQ AppManager for Microsoft SharePoint Server Management Guide

3.28 WebPagePerfUse this Knowledge Script to monitor the performance of Web pages in a SharePoint Web application.
Performance is measured in terms of the bandwidth you specify. Bandwidth is the number of bytes transferred to and from Web applications. This script raises an event if a log entry exceeds the bandwidth threshold you set. The script will only raise events if the number of bytes transferred to and from Web applications is greater than 0 MB.
For SharePoint 2007, this script retrieves performance information by scanning the SharePoint log entries. The script uses the current date’s log file to retrieve the performance information. The script uses the Usage Analysis logs found in the following folder:
\Program Files\Common Files\Microsoft Shared\Web server extensions\12\LOGS\guid of Webpp\
For SharePoint 2010 or later , this script retrieves performance information by reading from the logging database.
Threshold -- Minimum Web application uptime
Specify the minimum uptime that a Web application must maintain to prevent an event from being raised. The default is 10000 seconds.
Data Collection
Collect data for Web application uptime?
Select Yes to collect data about Web application uptime. The default is unselected.
Description How to Set It
SharePoint Knowledge Scripts 77

3.28.1 Configuring Security Manager for WebPagePerfBefore you can run the WebPagePerf Knowledge Script, configure AppManager Security Manager for the specific agents from the SharePoint server farm you want to monitor.
To configure Security Manager for the WebPagePerf Knowledge Script:
1 Select the agent or agents you want this script to monitor. These agents should contain information for all sites and Web applications from the farm.
2 On the Custom tab in AppManager Security Manager, add a custom entry and complete the following fields for the agent or agents you selected in the previous step:
3 Run the WebPagePerf script on the agent or agents as needed.
3.28.2 Resource ObjectsSharePoint Server: Web Applications
3.28.3 Default ScheduleThe default interval for this script is every 24 hours.
3.28.4 Setting Parameter ValuesSet the following parameters as needed:
Field Description
Label SharePoint_SQL
Sub-label ServerName\SharePointInstanceName
Because separate SQL instances are created, and the WebPagePerf Knowledge Script gets data from the logging database in a SharePoint instance, you need to provide the database server name, along with the instance name related to SharePoint in SQL.
Value 1 Specify the user name for the SQL Server account.
Value 2 Specify the password for the SQL Server account.
Extended application support Required field. Encrypts the user name and password in Security Manager.
Description How to Set It
General Settings
Job failure event notification
Event severity when job fails Set the event severity level, from 1 to 40, to indicate the importance of an event in which the job fails to monitor the performance of Web pages in a SharePoint Web application. The default is 5.
Monitor Web Page Performance
78 NetIQ AppManager for Microsoft SharePoint Server Management Guide

3.29 WebPartInfoUse this Knowledge Script to monitor the status and availability of Web Parts used by the SharePoint server.
A Web Part is a modular unit of information located within the SharePoint site collection. A typical example of a Web Part is a digital dashboard on your company’s SharePoint site collection, which integrates numerous information sources, enterprise applications, and other resources on a single page.
This script raises an event when it collects information about Web Parts and displays it in report format.
3.29.1 Resource ObjectsSharePoint Server: Web Applications
3.29.2 Default ScheduleThe default interval for this script is every 30 minutes.
Event Notification
Raise event if log entries exceed the bandwidth threshold?
Select Yes to raise an event in which log entries exceed the bandwidth threshold you specify. The default is Yes.
Event severity when bandwidth exceeds the threshold
Set the event severity level, from 1 to 40, to indicate the importance of an event in which the bandwidth exceeds the threshold. The default is 8.
Threshold -- maximum bandwidth
Specify the maximum bandwidth allowed before an event is raised. This script supports a maximum bandwidth of 4096 MB. The default is 1 MB.
Raise event if Web page performance information collected successfully?
Select Yes to raise an event in which details of Web page performance are collected successfully. The default is unselected.
Event severity when Web page performance information collected successfully
Set the event severity level, from 1 to 40, to indicate the importance of an event in which Web page performance data is collected successfully. The default is 25.
Raise event if no data is available?
Select Yes to raise an event if no bandwidth information exists for the Web page on the SharePoint server. The default is unselected.
Event severity when no data is available
Set the event severity level, from 1 to 40, to indicate the importance of an event in which no bandwidth information exists. The default is 11.
Data Collection
Collect data for matching log entries?
Select Yes to collect data for charts and reports. The default is unselected.
Description How to Set It
SharePoint Knowledge Scripts 79

3.29.3 Setting Parameter ValuesSet the following parameters as needed:
Description How to Set It
General Settings
Job failure event notification
Event severity when job fails Set the event severity level, from 1 to 40, to indicate the importance of an event in which the job fails to monitor Web Parts used by the SharePoint server. The default is 5.
Monitor Web Part Information
Comma-separated list of Web applications to exclude
Specify a list of Web applications to ignore when monitoring. Use commas without spaces to separate multiple Web applications.
File path of a file containing a list of site collection URLs to exclude from monitoring (one per line)
Specify the UNC or file path of a file that contains a list of sites to ignore when monitoring. In the file, list the sites to be excluded, one site per line.
The site collection URLs in your list must be in the same format as they appear in event messages. Include the http:// at the beginning of the URL, and do not include a trailing “/” at the end of the URL (which will cause the job to monitor the site collection you are trying to exclude).
Event Notification
Raise event when Web Part details are collected?
Select Yes to raise an event in which details of Web Parts used by the SharePoint server are collected. The default is Yes.
Event severity when Web Part detail collection is successful
Set the event severity level, from 1 to 40, to indicate the importance of an event in which Web Part details are successfully collected. The default is 25.
Raise event when Web Part details are unable to be collected?
Select Yes to raise an event if no Web Part information exists for the selected object on the SharePoint server. The default is Yes.
Event severity when Web Part details are unable to be collected
Set the event severity level, from 1 to 40, to indicate the importance of an event in which no Web Part information exists. The default is 11.
Data Collection
Collect data for Web Parts on the SharePoint server?
Select Yes to collect data points for all Web Parts on the SharePoint site collection. The default is unselected.
80 NetIQ AppManager for Microsoft SharePoint Server Management Guide


