February 28 4 , 201 RPA Inc. T 55 University Ave. Suite 501 I Toronto, ON, Canada M5J 2H7 I + 1 (416) 947 0907 www.rpacan.com NEW GOLD INC. TECHNICAL REPORT ON THE MESQUITE MINE, IMPERIAL COUNTY, CALIFORNIA, .S.A. U NI 43-101 Report Qualified Persons: Richard J. Lambert, P.E. Wayne W. Valliant, P.Geo. Kathleen Ann Altman, Ph.D., P.E.
Transcript
February 28 4, 201
RPA Inc. T55 University Ave. Suite 501 I Toronto, ON, Canada M5J 2H7 I + 1 (416) 947 0907 www.rpacan.com
NEW GOLD INC.
TECHNICAL REPORT ON THEMESQUITE MINE, IMPERIAL COUNTY,CALIFORNIA, .S.A.U
NI 43-101 Report
Qualified Persons:
Richard J. Lambert, P.E. Wayne W. Valliant, P.Geo. Kathleen Ann Altman, Ph.D., P.E.
Report Control Form Document Title Technical Report on the Mesquite Mine, Imperial County,
California, U.S.A.
Client Name & Address
New Gold Inc. 12200 East Briarwood Ave., Suite 165 Centennial, Colorado 80112 USA
Document Reference
Project #2180
Status & Issue No.
FINAL Version
0
Issue Date February 28, 2014 Lead Authors Richard J. Lambert
Wayne W. Valliant Kathleen A. Altman
(Signed) (Signed) (Signed)
Peer Reviewer Deborah A. McCombe (Signed)
Project Manager Approval Richard J. Lambert (Signed)
Project Director Approval Deborah A. McCombe (Signed)
Report Distribution Name No. of Copies Client RPA Filing 1 (project box)
Roscoe Postle Associates Inc.
55 University Avenue, Suite 501 Toronto, ON M5J 2H7
Technical Report NI 43-101 – February 28, 2014 Page ii
CAUTIONARY NOTE WITH RESPECT TO FORWARD LOOKING INFORMATION
Certain information and statements contained in this report are “forward looking” in nature. All information and statements in this report, other than statements of historical fact, that address events, results, outcomes, or developments that New Gold and/or the Qualified Persons who authored this report expect to occur are “forward-looking statements”. Forward-looking statements are statements that are not historical facts and are generally, but not always, identified by the use of forward-looking terminology such as “plans”, “expects”, “is expected”, “budget”, “scheduled”, “estimates”, “forecasts”, “intends”, “anticipates”, “projects”, “potential”, “believes” or variations of such words and phrases or statements that certain actions, events or results “may”, “could”, “would”, “should”, “might” or “will be taken”, “occur” or “be achieved” or the negative connotation of such terms. Forward-looking statements include, but are not limited to, statements with respect to anticipated production rates; grades; projected metallurgical recovery rates; infrastructure, capital, operating and sustaining costs; the projected life of mine; the proposed pit design phase development and potential impact on cash flow; estimates of Mineral Reserves and Resources; the future price of gold; government regulations; the maintenance or renewal of any permits or mineral tenures; estimates of reclamation obligations that may be assumed; requirements for additional capital; environmental risks; and general business and economic conditions. All forward-looking statements in this report are necessarily based on opinions and estimates made as of the date such statements are made and are subject to important risk factors and uncertainties, many of which cannot be controlled or predicted. Material assumptions regarding forward-looking statements are discussed in this report, where applicable. In addition to, and subject to, such specific assumptions discussed in more detail elsewhere in this report, the forward-looking statements in this report are subject to the following assumptions: (1) there being no signification disruptions affecting the operation of the mine; (2) the availability of certain consumables and services and the prices for diesel, natural gas, cyanide, fuel oil, electricity and other key supplies being approximately consistent with current levels; (3) labour and materials costs increasing on a basis consistent with current expectations; (4) that all environmental approvals, required permits, licenses and authorizations will continue to be held on the same or similar terms and obtained from the relevant governments and other relevant stakeholders within the expected timelines; (5) certain tax rates; (6) the timelines for exploration activities; and (7) assumptions made in Mineral Resource and Reserve estimates, including geological interpretation grade, recovery rates, gold price assumption, and operational costs; and general business and economic conditions. Forward-looking statements involve known and unknown risks, uncertainties and other factors which may cause the actual results, performance or achievements to be materially different from any of the future results, performance or achievements expressed or implied by forward-looking statements. These risks, uncertainties and other factors include, but are not limited to, decrease of future gold prices; cost of labour, supplies, fuel and equipment rising; adverse changes in anticipated production, including discrepancies between actual and estimated production, Reserves, Resources and recoveries; exchange rate fluctuations; title risks; regulatory risks, and political or economic developments in the United States; changes to tax
www.rpacan.com
New Gold Inc. – Mesquite Mine, Project #2180
Technical Report NI 43-101 – February 28, 2014 Page iii
rates; changes to; risks and uncertainties with respect to obtaining necessary permits, land use rights and other tenure from the State and private landowners or delays in obtaining same; risks associated with maintaining and renewing permits and complying with permitting requirements, and other risks involved in the gold exploration and development industry; as well as those risk factors discussed elsewhere in this report, in New Gold’s latest Annual Information Form, Management’s Discussion and Analysis and its other SEDAR filings from time to time. All forward-looking statements herein are qualified by this cautionary statement. Accordingly, readers should not place undue reliance on forward-looking statements. New Gold and the Qualified Persons who authored of this report undertake no obligation to update publicly or otherwise revise any forward-looking statements whether as a result of new information or future events or otherwise, except as may be required by law. CAUTIONARY NOTE TO U.S. READERS CONCERNING ESTIMATES OF MEASURED, INDICATED AND INFERRED MINERAL RESOURCES Information concerning the Mesquite Mine has been prepared in accordance with Canadian standards under applicable Canadian securities laws, and may not be comparable to similar information for United States companies. The terms “Mineral Resource”, “Measured Mineral Resource”, “Indicated Mineral Resource” and “Inferred Mineral Resource” used in this report are Canadian mining terms as defined in accordance with National Instrument 43-101 (“NI 43-101”) under guidelines set out in the Canadian Institute of Mining, Metallurgy and Petroleum (“CIM”) Standards on Mineral Resources and Mineral Reserves adopted by the CIM Council on November 27, 2010. While the terms “Mineral Resource”, “Measured Mineral Resource”, “Indicated Mineral Resource” and “Inferred Mineral Resource” are recognized and required by Canadian securities regulations, they are not defined terms under standards of the United States Securities and Exchange Commission. As such, certain information contained in this report concerning descriptions of mineralization and resources under Canadian standards is not comparable to similar information made public by United States companies subject to the reporting and disclosure requirements of the United States Securities and Exchange Commission. An “Inferred Mineral Resource” has a great amount of uncertainty as to its existence and as to its economic and legal feasibility. It cannot be assumed that all or any part of an “Inferred Mineral Resource” will ever be upgraded to a higher category. Readers are cautioned not to assume that all or any part of an “Inferred Mineral Resource” exists, or is economically or legally mineable.
www.rpacan.com
New Gold Inc. – Mesquite Mine, Project #2180
Technical Report NI 43-101 – February 28, 2014 Page i
3 RELIANCE ON OTHER EXPERTS ................................................................................. 3-1
4 PROPERTY DESCRIPTION AND LOCATION ................................................................ 4-1 Location ......................................................................................................................... 4-1 Land Tenure .................................................................................................................. 4-1
5 ACCESSIBILITY, CLIMATE, LOCAL RESOURCES, INFRASTRUCTURE AND PHYSIOGRAPHY ............................................................................................................... 5-1
6 HISTORY ........................................................................................................................ 6-1
20 ENVIRONMENTAL STUDIES, PERMITTING, AND SOCIAL OR COMMUNITY IMPACT ......................................................................................................................................... 20-1
Environmental Studies ................................................................................................. 20-1 Project Permitting ........................................................................................................ 20-1 Social or Community Requirements ............................................................................. 20-2 Mine Closure Requirements ......................................................................................... 20-4
21 CAPITAL AND OPERATING COSTS .......................................................................... 21-1 Capital Costs ............................................................................................................... 21-1
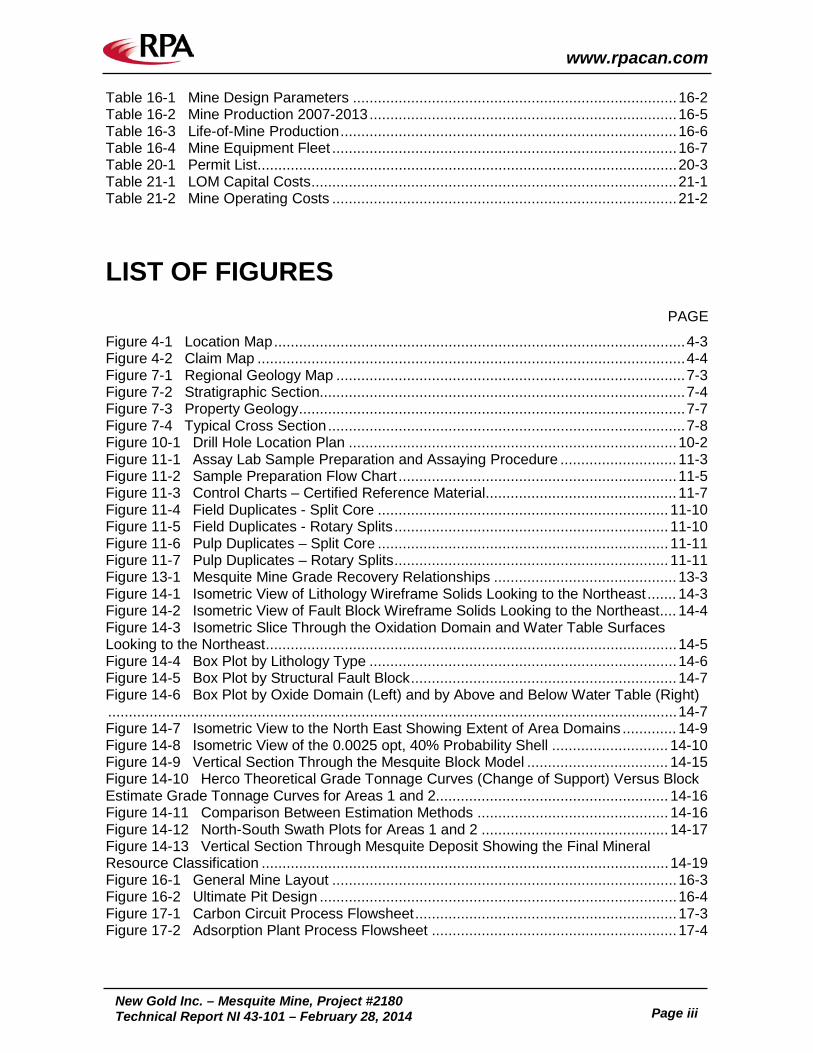
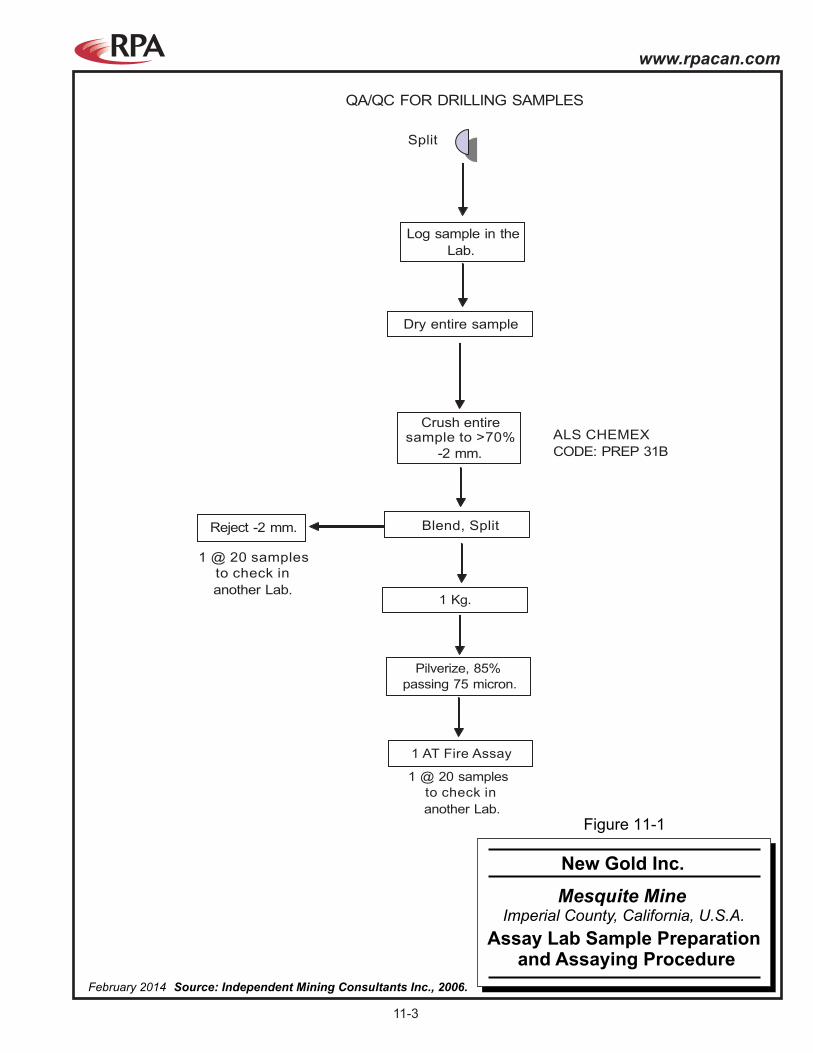
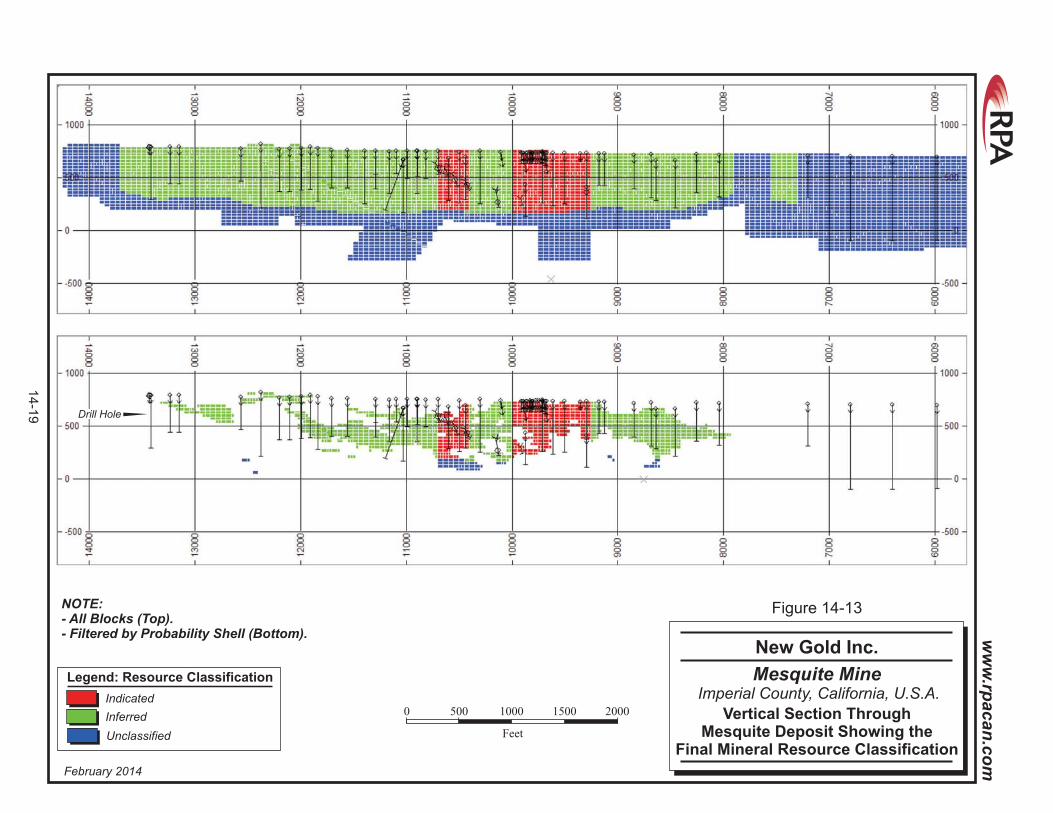
Figure 4-1 Location Map ................................................................................................... 4-3 Figure 4-2 Claim Map ....................................................................................................... 4-4 Figure 7-1 Regional Geology Map .................................................................................... 7-3 Figure 7-2 Stratigraphic Section........................................................................................ 7-4 Figure 7-3 Property Geology ............................................................................................. 7-7 Figure 7-4 Typical Cross Section ...................................................................................... 7-8 Figure 10-1 Drill Hole Location Plan ............................................................................... 10-2 Figure 11-1 Assay Lab Sample Preparation and Assaying Procedure ............................ 11-3 Figure 11-2 Sample Preparation Flow Chart ................................................................... 11-5 Figure 11-3 Control Charts – Certified Reference Material.............................................. 11-7 Figure 11-4 Field Duplicates - Split Core ...................................................................... 11-10 Figure 11-5 Field Duplicates - Rotary Splits .................................................................. 11-10 Figure 11-6 Pulp Duplicates – Split Core ...................................................................... 11-11 Figure 11-7 Pulp Duplicates – Rotary Splits .................................................................. 11-11 Figure 13-1 Mesquite Mine Grade Recovery Relationships ............................................ 13-3 Figure 14-1 Isometric View of Lithology Wireframe Solids Looking to the Northeast ....... 14-3 Figure 14-2 Isometric View of Fault Block Wireframe Solids Looking to the Northeast .... 14-4 Figure 14-3 Isometric Slice Through the Oxidation Domain and Water Table Surfaces Looking to the Northeast ................................................................................................... 14-5 Figure 14-4 Box Plot by Lithology Type .......................................................................... 14-6 Figure 14-5 Box Plot by Structural Fault Block ................................................................ 14-7 Figure 14-6 Box Plot by Oxide Domain (Left) and by Above and Below Water Table (Right) ......................................................................................................................................... 14-7 Figure 14-7 Isometric View to the North East Showing Extent of Area Domains ............. 14-9 Figure 14-8 Isometric View of the 0.0025 opt, 40% Probability Shell ............................ 14-10 Figure 14-9 Vertical Section Through the Mesquite Block Model .................................. 14-15 Figure 14-10 Herco Theoretical Grade Tonnage Curves (Change of Support) Versus Block Estimate Grade Tonnage Curves for Areas 1 and 2........................................................ 14-16 Figure 14-11 Comparison Between Estimation Methods .............................................. 14-16 Figure 14-12 North-South Swath Plots for Areas 1 and 2 ............................................. 14-17 Figure 14-13 Vertical Section Through Mesquite Deposit Showing the Final Mineral Resource Classification .................................................................................................. 14-19 Figure 16-1 General Mine Layout ................................................................................... 16-3 Figure 16-2 Ultimate Pit Design ...................................................................................... 16-4 Figure 17-1 Carbon Circuit Process Flowsheet ............................................................... 17-3 Figure 17-2 Adsorption Plant Process Flowsheet ........................................................... 17-4
www.rpacan.com
New Gold Inc. – Mesquite Mine, Project #2180
Technical Report NI 43-101 – February 28, 2014 Page 1-1
1 SUMMARY EXECUTIVE SUMMARY RPA Inc. (RPA) was retained by New Gold Inc. (New Gold) to prepare an independent
Technical Report on the Mesquite Mine near Brawley, California, U.S.A. The purpose of this
report is to provide an update, for public disclosure, of the Mesquite Mine operations. This
Technical Report conforms to NI 43-101 Standards of Disclosure for Mineral Projects (NI 43-
101). RPA visited the property on November 6-7, 2013. The mine operations were reviewed,
including the active mining phases, waste dumps, heap leach pad, and process facilities.
New Gold is an intermediate gold mining company with four operating assets: New Afton Mine
in Canada, Mesquite Mine in the United States, Cerro San Pedro in Mexico, and Peak Mines
in Australia. In addition, the company has development projects in Canada and Chile. New
Gold completed a business combination with Western Goldfields Inc. (WGI) on June 1, 2009.
Western Mesquite Mines, Inc. (WMMI), a wholly-owned subsidiary of New Gold, is the current
operator of the Mesquite Mine. The major assets and facilities of WMMI are an open pit gold
heap leach mining operation with a carbon-in-column (CIC) processing circuit. A smelting
furnace, assay laboratory, administration building, and truck shop facility are also located on
the mine site. The Mesquite Mine received regulatory approval to begin mining operations on
July 2, 2007, after the issuance of the Air Quality permit from the Imperial County Air Pollution
Control District. Commercial production at Mesquite recommenced in January 2008 and has
been operating continuously since. In 2013, the mine produced 107,000 ounces of gold.
CONCLUSIONS
ADEQUACY OF PROCEDURES RPA and various other firms and independent consultants have reviewed the methods and
procedures utilized by New Gold, WGI, Newmont, Santa Fe, and Gold Fields Mining
Corporation (Gold Fields) at the Mesquite Mine to gather geological, geotechnical, and
assaying information and found them reasonable and meeting generally accepted industry
standards for an operating property.
www.rpacan.com
New Gold Inc. – Mesquite Mine, Project #2180
Technical Report NI 43-101 – February 28, 2014 Page 1-2
ADEQUACY OF DATA RPA is of the opinion that the Mesquite Mine has conducted exploration and development
sampling and analysis programs using standard practices, providing generally reasonable
results. In RPA’s opinion, the resulting data can effectively be used in the subsequent
estimation of resources and reserves.
ADEQUACY OF STUDY This Technical Report is based on the operating data over the past six years for the Mesquite
Mine. RPA is of the opinion that this data and the supporting documents were prepared using
standard industry practices and provide reasonable results and conclusions.
COMPLIANCE WITH CANADIAN DEFINITION STANDARDS RPA is of the opinion that the current drill hole database is sufficient for generating a resource
model for use in resource and reserve estimation. Recovery and cost estimates are based
upon sufficient data and engineering to support a reserve statement. Economic analysis using
these estimates generates a positive cash flow, which supports a reserve statement.
Measured and Indicated Resources for all areas, inclusive of Mineral Reserves, are 313 million
metric tonnes grading 0.49 g/t Au for 4.90 million contained troy ounces of gold. Inferred
Resources are an additional 17.5 million metric tonnes grading 0.42 g/t Au. The estimated
Proven and Probable Mineral Reserves for the Mesquite Mine total 115.9 million metric tonnes
grading 0.60 g/t Au, containing 2.24 million ounces of gold.
In RPA’s opinion, the resource and reserve estimates have been created utilizing acceptable
methodologies. RPA is also of the opinion that the classification of Measured and Indicated
Resources, stated in Table 1-1, and Proven and Probable Reserves, stated in Table 1-2, meet
the Canadian Institute of Mining, Metallurgy and Petroleum (CIM) Definition Standards for
Mineral Resources and Mineral Reserves adopted by the CIM Council on November 27, 2010
(CIM definitions).
RECOMMENDATIONS
RPA offers the following recommendations:
1. Continue operating the Mesquite Mine. Annual operating costs are a nominal US$100 million per year.
www.rpacan.com
New Gold Inc. – Mesquite Mine, Project #2180
Technical Report NI 43-101 – February 28, 2014 Page 1-3
2. Bulk densities have been based on historic data due to a lack of bulk density data present in the sample database. RPA recommends that New Gold review the tonnage factors currently being used.
3. Continue to monitor the heap leach pad recoveries and evaluate whether there is
a correlation between grade and recovery. This is an ongoing process included in the mine operating budget; no additional costs are anticipated.
ECONOMIC ANALYSIS Under NI 43-101 rules, producing issuers may exclude the information required for Item 22 –
Economic Analysis, on properties currently in production, unless the Technical Report includes
a material expansion of current production. RPA notes that New Gold is a producing issuer,
the Mesquite Mine is currently in production, and a material expansion is not included in the
current Life-of-Mine plans. RPA has performed an economic analysis of the Mesquite Mine
using the estimates presented in this report and confirms that the outcome is a positive cash
flow that supports the statement of Mineral Reserves.
TECHNICAL SUMMARY
PROPERTY DESCRIPTION AND LOCATION The Mesquite Mine is located approximately 35 mi to the east of the town of Brawley,
California, and about 52 mi northwest of the city of Yuma, Arizona. It is located at Latitude 33°
03’ North and Longitude 114° 59’ West. Access to the property is from California State
Highway 78 and then north along a paved private road into the Mesquite site. The property is
approximately 24 mi north of the border with Mexico and 16 mi west of the border with the
State of Arizona.
The Mesquite Mine is operated by New Gold’s wholly owned subsidiary WMMI.
LAND TENURE The mineral rights at the Mesquite Mine consist of 212 unpatented and 53 patented mining
lode claims, 122 patented and 97 unpatented mill site claims, 658 acres of California state
leased land, and 315 acres of fee lands, for a total of approximately 5,200 acres. All the
properties are controlled by WMMI.
The claims located on federally owned lands are administered by the Bureau of Land
Management (BLM).
www.rpacan.com
New Gold Inc. – Mesquite Mine, Project #2180
Technical Report NI 43-101 – February 28, 2014 Page 1-4
Patented mining lode claims and patented mill site claims on U.S. Federal Land represent a
secure title to the land. Unpatented mining and mill site claims do not have a termination date
as long as annual assessment work is maintained and the land is held for mining purposes.
The Federal fee land is leased by WMMI and can also be maintained indefinitely as long as
the annual maintenance fees are paid.
EXISTING INFRASTRUCTURE Currently, the major assets and facilities associated with the Mesquite Mine are:
• The physical plant site including heap leach pads, process plant, assay lab, workshops, warehouses, administration buildings, and dry facilities.
• Facilities providing basic infrastructure to the mine, including: electric power, heat,
water treatment and supply, and sewage treatment.
• Mine infrastructure including open pits, ramps, maintenance shops, and mobile equipment fleet.
• Access by paved highway to towns and cities with additional infrastructure.
HISTORY Gold was first discovered at Mesquite by track crews building the Southern Pacific railroad
around 1876. The first strike and claims in the area were staked at this time by Felisaro Parro.
During the 1920s and 1930s, small-scale subsistence placer mining was conducted in the
district by jobless men searching for gold in the Chocolate Mountains and surrounding foothills.
Larger placer and lode mining was reported in the area from 1937 through to the mid-1970s.
Commercial gold production at Mesquite started in March 1986 as a heap leach gold operation
by Gold Fields. In 1993, Santa Fe Pacific Gold Corporation (Santa Fe) acquired the Mesquite
Mine in California from Gold Fields. In May 1997, Santa Fe was acquired by Newmont Mining
Corporation (Newmont). Newmont mined the deposit through May 2001 when there was a
slope failure in the Big Chief pit and the existing reserves at a US$300/oz gold price were
deemed to be uneconomic. Gold recovery from the Mesquite heap continued through to 2007.
A total of 154 million tons of material grading 0.026 opt Au had been placed on the leach pads
when mining operations stopped in 2001. Approximately 3.05 million ounces of gold were
recovered between 1985 and 2007 with a calculated average gold recovery of 76.5% prior to
the restart of operations in late 2007.
www.rpacan.com
New Gold Inc. – Mesquite Mine, Project #2180
Technical Report NI 43-101 – February 28, 2014 Page 1-5
WGI acquired the Mesquite Mine from Newmont in November 2003. WGI completed a
feasibility study in 2006 and restarted operations in late 2007. Commercial production was
achieved in January 2008. In June 2009, following a business combination with WGI, New
Gold became the operator. Newmont’s 2% net smelter royalty on the project was transferred
to Franco-Nevada Corporation in 2007.
Since 2007, an additional 837,000 ounces have been produced, bringing the total production
to 3.9 million ounces since 1985.
GEOLOGY AND MINERALIZATION The Mesquite District lies on the southwest flank of the Chocolate Mountains, in amphibolite
grade metamorphic rocks of the upper plate of the Vincent-Chocolate Mountain Thrust. These
upper plate rocks represent a fragment of Precambrian and Mesozoic continental crust that
has an extremely complex history.
The Mesquite Mine comprises two subparallel, Oligocene-age deposits: Big Chief – Vista (Big
Chief, Cholla, and Lena, Rubble Ridge, Panhandle, and Vista) and Rainbow (Cherokee,
Rainbow, and East Rainbow). Gold mineralization is hosted in Mesozoic gneisses that are
intruded by biotite/muscovite rich granites. The district is covered by a thin veneer (0-300 ft)
of Tertiary and Quaternary sediments, shed from the south slope of the Chocolate Mountains.
Gold mineralization is bound by post-mineral faulting related to the Neogene San Andreas fault
system.
EXPLORATION STATUS New Gold has not conducted exploration on the Project other than drilling.
Drilling has totalled approximately 3.1 million ft in 6,821 holes of which WMMI drilled
approximately 268,800 ft in 593 holes. A total of 118 holes in the database were exploratory
in nature, and tested for satellite deposits. The holes were mostly drilled vertically. In general,
the disseminated mineralization is flat-lying or with a moderate 16º southwest dip and therefore
the vertical drilling provides an appropriate measure of the true mineralization thickness.
New Gold also conducted an exploration drilling program in 2010-2011 to test the potential for
defining economic Mineral Resources in the sulphide mineralization below the current Mineral
www.rpacan.com
New Gold Inc. – Mesquite Mine, Project #2180
Technical Report NI 43-101 – February 28, 2014 Page 1-6
Reserves. The program comprised 36,341 ft of diamond drilling and reverse circulation drilling
in 36 holes. A significant Mineral Resource was not delineated and additional exploration was
not recommended.
The potential for lateral extensions of mineralization is largely limited by the permit boundaries.
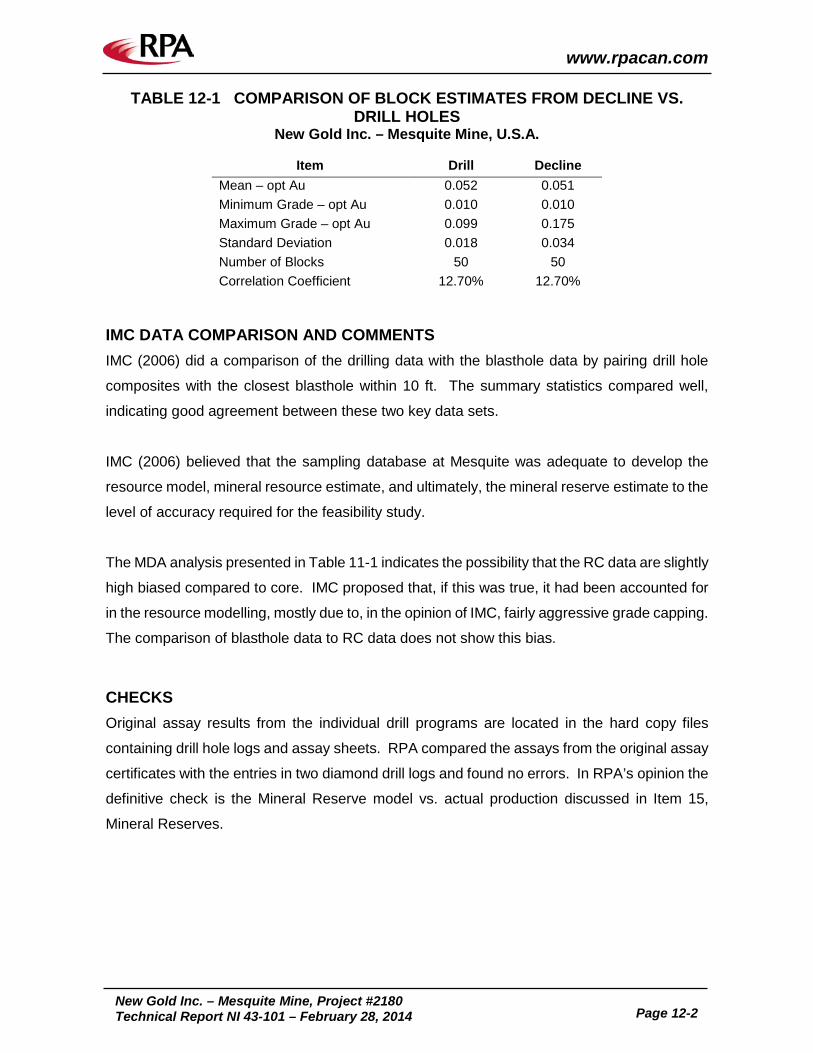
MINERAL RESOURCES The updated Mesquite Mineral Resource model was completed by Robert Sim, P.Geo., of SIM
Geological Inc. and Bruce Davis, FAusIMM, of BD Resource Consulting Inc. (SIM and BDRC).
The December 31, 2013 Mineral Resources are reported in Table 1-1 as constrained by the
2013 optimized pit shell.
TABLE 1-1 MINERAL RESOURCES – DECEMBER 31, 2013 New Gold Inc. – Mesquite Mine
1. CIM definitions were followed for Mineral Resources. 2. Mineral Resources are estimated at a cut-off grade of 0.0035 opt (0.12 g/t) Au for Oxide and
Transition and 0.0070 opt (0.24 g/t) Au for Sulphide. 3. Mineral Resources are estimated using a long-term gold price of US$1,400 per ounce. 4. Mineral Resources are reported below the December 2013, as-mined topographic surface,
constrained by the 2013 optimized pit. 5. Mineral Resources are inclusive of Mineral Reserves. 6. Numbers may not add due to rounding.
RPA reviewed the estimate completed by SIM and BDRC and is of the opinion that the
Mesquite Mineral Resource estimate has been conducted to a high standard and is appropriate
for public disclosure. SIM and BDRC classification methodologies and Measured and
Indicated categories are reasonable.
MINERAL RESERVES The Mineral Reserve estimate for the Mesquite Mine, effective December 31, 2013, is
summarized in Table 1-2.
www.rpacan.com
New Gold Inc. – Mesquite Mine, Project #2180
Technical Report NI 43-101 – February 28, 2014 Page 1-7
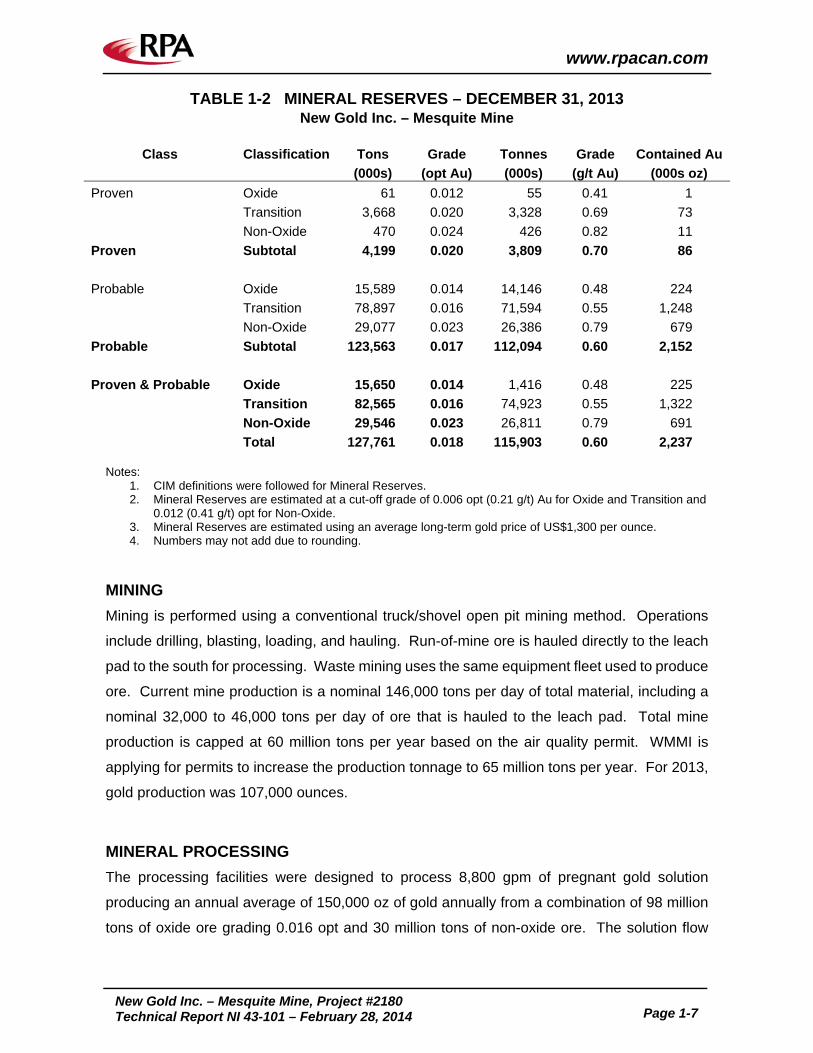
TABLE 1-2 MINERAL RESERVES – DECEMBER 31, 2013 New Gold Inc. – Mesquite Mine
Class Classification Tons Grade Tonnes Grade Contained Au
1. CIM definitions were followed for Mineral Reserves. 2. Mineral Reserves are estimated at a cut-off grade of 0.006 opt (0.21 g/t) Au for Oxide and Transition and
0.012 (0.41 g/t) opt for Non-Oxide. 3. Mineral Reserves are estimated using an average long-term gold price of US$1,300 per ounce. 4. Numbers may not add due to rounding.
MINING Mining is performed using a conventional truck/shovel open pit mining method. Operations
include drilling, blasting, loading, and hauling. Run-of-mine ore is hauled directly to the leach
pad to the south for processing. Waste mining uses the same equipment fleet used to produce
ore. Current mine production is a nominal 146,000 tons per day of total material, including a
nominal 32,000 to 46,000 tons per day of ore that is hauled to the leach pad. Total mine
production is capped at 60 million tons per year based on the air quality permit. WMMI is
applying for permits to increase the production tonnage to 65 million tons per year. For 2013,
gold production was 107,000 ounces.
MINERAL PROCESSING The processing facilities were designed to process 8,800 gpm of pregnant gold solution
producing an annual average of 150,000 oz of gold annually from a combination of 98 million
tons of oxide ore grading 0.016 opt and 30 million tons of non-oxide ore. The solution flow
www.rpacan.com
New Gold Inc. – Mesquite Mine, Project #2180
Technical Report NI 43-101 – February 28, 2014 Page 1-8
rate was approximately 13,000 gpm at the time of the site visit. The total life-of-mine tonnage
will be approximately 128 million tons at an average grade of 0.018 opt gold.
The processing facilities include the following operations:
Heap leaching of run-of-mine (ROM) ore Carbon adsorption Desorption and gold recovery Reagents and utilities Water services
ENVIRONMENTAL, PERMITTING AND SOCIAL CONSIDERATIONS The Mesquite Mine received regulatory approval to begin mining operations on July 2, 2007,
after the issuance of the Air Quality permit from the Imperial County Air Pollution Control
District.
New Gold has obtained permits and authorizations from federal, state, and local agencies to
operate current facilities and activities. New Gold reports that it is in compliance with issued
permits and that there have been no notices of violations issued by agencies in the past year.
New Gold also reports excellent working relationships with regulatory agencies and the public.
The closure and reclamation plan for the Mesquite Mine has been developed by New Gold
with the specific objective of leaving the land in a useful, safe, and stable configuration capable
of supporting native plant life, providing wildlife habitat, maintaining watershed functions, and
supporting limited livestock grazing. Total closure costs are estimated to be US$16.3 million.
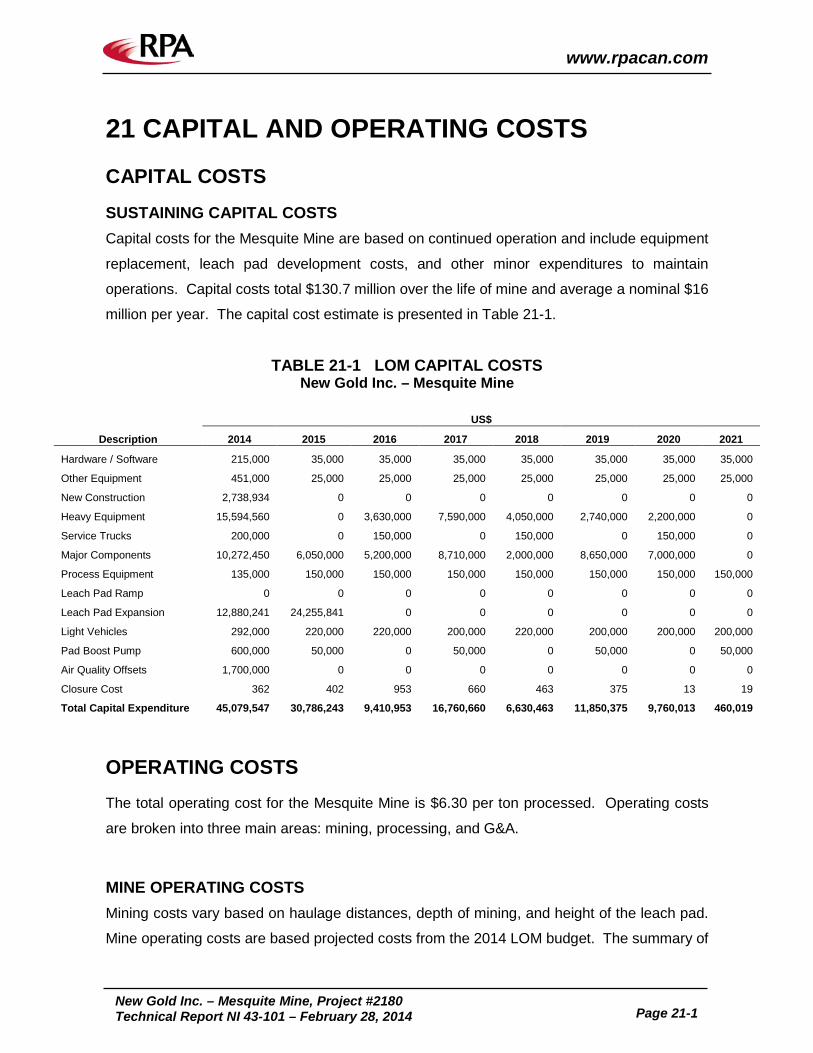
CAPITAL AND OPERATING COST ESTIMATES Capital costs for the Mesquite Mine are based on continued operation and include equipment
replacement, leach pad development costs, and other minor expenditures to maintain
operations. Capital costs total US$130.7 million over the life of mine and average a nominal
US$16 million per year.
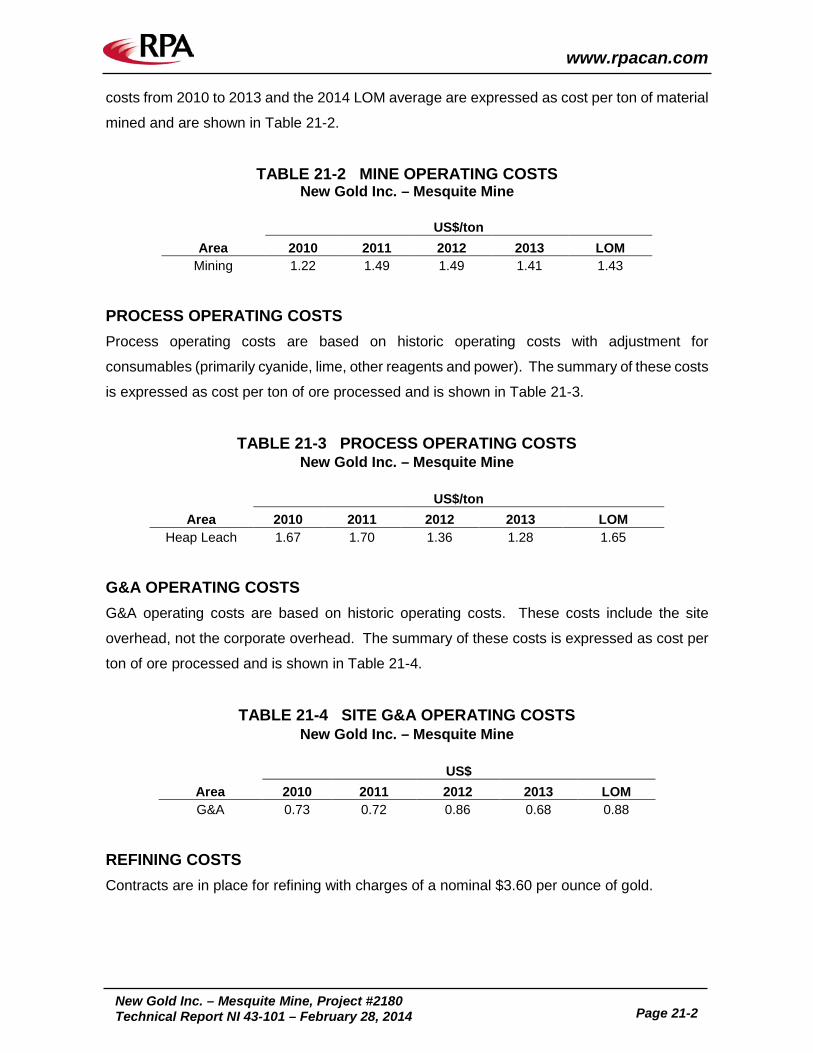
The total operating cost for the Mesquite Mine is US$6.30 per ton processed. The 2014 LOM
averages for mining, processing, and G&A operating costs are US$1.43 per ton of material
mined, US$1.65 per ton of ore processed, and US$0.88 per ton of ore processed, respectively.
Contracts are in place for refining with charges of a nominal US$3.60 per ounce of gold.
www.rpacan.com
New Gold Inc. – Mesquite Mine, Project #2180
Technical Report NI 43-101 – February 28, 2014 Page 2-1
2 INTRODUCTION RPA Inc. (RPA) was retained by New Gold Inc. (New Gold) to prepare an independent
Technical Report on the Mesquite Mine near Brawley, Imperial County, California, U.S.A. The
purpose of this report is to provide an update, for public disclosure, of the Mesquite Mine
operations. This Technical Report conforms to NI 43-101 Standards of Disclosure for Mineral
Projects (NI 43-101). RPA visited the property on November 6-7, 2013. The mine operations
were reviewed, including the active mining phases, waste dumps, heap leach pad, and process
facilities.
New Gold is an intermediate gold mining company with four operating assets: New Afton Mine
in Canada, Mesquite Mine in the United States, Cerro San Pedro in Mexico, and Peak Mines
in Australia. In addition, the company has development projects in Canada and Chile. New
Gold completed a business combination with Western Goldfields Inc. (WGI) on June 1, 2009.
Western Mesquite Mines, Inc. (WMMI), a wholly-owned subsidiary of New Gold, is the current
operator of the Mesquite Mine. The major assets and facilities of WMMI are an open pit gold
heap leach mining operation with a carbon-in-column (CIC) processing circuit. A smelting
furnace, assay laboratory, administration building, and truck shop facility are also located on
the mine site. The Mesquite Mine received regulatory approval to begin mining operations on
July 2, 2007, after the issuance of the Air Quality permit from the Imperial County Air Pollution
Control District. Commercial production at Mesquite recommenced in January 2008 and the
mine has been operating continuously since. In 2013, the mine sold 105,000 ounces of gold.
SOURCES OF INFORMATION For this Technical Report, a site visit was carried out by Richard J. Lambert, P.E., Principal
Mining Consultant, Wayne W. Valliant, P.Geo., Principal Geologist, and Kathleen A. Altman,
Ph.D., P.E., on November 6-7, 2013. During the site visit and subsequent meetings,
discussions were held with:
• Bill Martinich, Mine Manager, WMMI • Frank Simms, Operations Controller, WMMI • Gary Boyle, Mine Superintendent, WMMI • Shaun Holley, Maintenance Superintendent, WMMI • Jerry Hepworth, Environmental Manager, WMMI • Jeff Fuerstenau, Plant Manager, WMMI
www.rpacan.com
New Gold Inc. – Mesquite Mine, Project #2180
Technical Report NI 43-101 – February 28, 2014 Page 2-2
• Jessica Tiffin, Process Operations Supervisor, WMMI • Don Wagstaff, Chief Geologist, WMMI • Hubert Schimann, Chief Engineer, WMMI • George Hufford, Sr. Mine Engineer, WMMI • Mike Worley, Sr, Environmental Coordinator, WMMI • William Werner, Mine Engineer, WMMI. • Matt Bradford, Mine Geologist, WMMI • Chris Longton, Exploration Geologist, WMMI • Nick Legere, Exploration Geologist, WMMI. • Rob Sim, Sim Geological Inc. • John Bligh, Database Manager, New Gold, Vancouver
Mr. Lambert is responsible for Sections 15, 16, 19, and 22 of this report and shares
responsibility for Sections 1, 2, 3, 18, 20, 21, 24, 25, and 26. Mr. Valliant is responsible for
Sections 4-12, and 14 and shares responsibility for Sections 1, 2, 25, and 26. Dr. Altman is
responsible for Sections 13 and 17 and shares responsibility for Sections 1, 18, 20, 21, 24, 25,
and 26.
The documentation reviewed, as well as any other sources of information, is listed at the end
of this report in Section 27 (References).
www.rpacan.com
New Gold Inc. – Mesquite Mine, Project #2180
Technical Report NI 43-101 – February 28, 2014 Page 2-3
LIST OF ABBREVIATIONS Units of measurement used in this report conform to the imperial system. For reporting Mineral
Resources and Mineral Reserves, both imperial and metric units of measurement are used.
All currency in this report is US dollars (US$) unless otherwise noted.
a annum kWh kilowatt-hour A ampere L litre bbl barrels lb pound btu British thermal units L/s litres per second °C degree Celsius m metre C$ Canadian dollars M mega (million); molar cal calorie m2 square metre cfm cubic feet per minute m3 cubic metre cm centimetre µ micron cm2 square centimetre MASL metres above sea level d day µg microgram dia diameter m3/h cubic metres per hour dmt dry metric tonne mi mile dwt dead-weight ton min minute °F degree Fahrenheit µm micrometre ft foot mm millimetre ft2 square foot mph miles per hour ft3 cubic foot MVA megavolt-amperes ft/s foot per second MW megawatt g gram MWh megawatt-hour G giga (billion) oz Troy ounce (31.1035g) Gal Imperial gallon oz/st, opt ounce per short ton g/L gram per litre ppb part per billion Gpm Imperial gallons per minute ppm part per million g/t gram per tonne psia pound per square inch absolute gr/ft3 grain per cubic foot psig pound per square inch gauge gr/m3 grain per cubic metre RL relative elevation ha hectare s second hp horsepower st short ton hr hour stpa short ton per year Hz hertz stpd short ton per day in. inch t metric tonne in2 square inch tpa metric tonne per year J joule tpd metric tonne per day k kilo (thousand) US$ United States dollar kcal kilocalorie USg United States gallon kg kilogram USgpm US gallon per minute km kilometre V volt km2 square kilometre W watt km/h kilometre per hour wmt wet metric tonne kPa kilopascal wt% weight percent kVA kilovolt-amperes yd3 cubic yard kW kilowatt yr year
www.rpacan.com
New Gold Inc. – Mesquite Mine, Project #2180
Technical Report NI 43-101 – February 28, 2014 Page 3-1
3 RELIANCE ON OTHER EXPERTS This report has been prepared by RPA for New Gold. The information, conclusions, opinions,
and estimates contained herein are based on:
• Information available to RPA at the time of preparation of this report, • Assumptions, conditions, and qualifications as set forth in this report, and • Data, reports, and other information supplied by New Gold and other third party
sources.
For the purpose of this report, RPA has relied on ownership information provided by New Gold.
RPA has not researched property title or mineral rights for the Project and expresses no
opinion as to the ownership status of the property.
RPA has relied on New Gold for guidance on applicable taxes, royalties, and other government
levies or interests, applicable to revenue or income from Project.
Except for the purposes legislated under provincial securities laws, any use of this report by
any third party is at that party’s sole risk.
www.rpacan.com
New Gold Inc. – Mesquite Mine, Project #2180
Technical Report NI 43-101 – February 28, 2014 Page 4-1
4 PROPERTY DESCRIPTION AND LOCATION LOCATION The Mesquite Mine is located at Latitude 33° 03’ North and Longitude 114° 59’ West in Imperial
County, in southern California. The property is approximately 24 miles north of the border with
Mexico and 16 miles west of the border with the State of Arizona. The Mesquite Mine is
operated by New Gold’s wholly owned subsidiary, Western Mesquite Mines, Inc. (WMMI). A
location map for the project is presented in Figure 4-1.
The project survey control is based on a local coordinate system.
LAND TENURE
MINERAL CONCESSIONS The mineral rights at the Mesquite Mine consist of 212 unpatented and 53 patented mining
lode claims, 122 patented and 97 unpatented mill site claims, 658 acres of California state
leased land, and 315 acres of fee lands, for a total of approximately 5,200 acres. All the
aforementioned properties are controlled by WMMI.
The claims located on federally owned lands are administered by the Bureau of Land
Management (BLM). Details on the property claims and mining claims are included in
Appendix A and a detailed claim map is provided as Figure 4-2.
Patented mining lode claims and patented mill site claims on U.S. Federal Land represent a
secure title to the land. Unpatented mining and mill site claims do not have a termination date
as long as annual assessment work is maintained and the land is held for mining purposes.
The Federal fee land is leased by WMMI and can also be maintained indefinitely as long as
the annual maintenance fees are paid.
AGREEMENTS AND ENCUMBRANCES In November 2003, WGI acquired the Mesquite Mine from Newmont Mining Corporation
(Newmont) through an Asset Purchase Agreement. Under this agreement, WGI acquired the
www.rpacan.com
New Gold Inc. – Mesquite Mine, Project #2180
Technical Report NI 43-101 – February 28, 2014 Page 4-2
Mesquite Mine through a transfer of WGI common stock and warrants. In addition, WGI
assumed the environmental reclamation and closure liability at the Mesquite Mine.
All of the claims have certain restrictions in common which are:
• the applicable land use restrictions of the California Desert Conservation Areas; • any multiple use rights of third parties as provided for in the applicable federal laws
and regulations; and • reservations to the United States, for right of way for ditches or canals constructed
by the Federal Government.
Some of the unpatented claims may have small areas that encroach on the Chocolate
Mountain Gunnery Range. Any portions of the claims that are located inside the gunnery
range are invalid, but do not affect any known potential mining areas.
99
101
80 5
80
50
101
5
395
199
97
95
80
93
6
506
50
15
95
93
40
95
95
395
95
2
10
8
8
10
5
15
101
5
99
14
15
58
95
95
361
395
6
80
40
Red Bluff
Chico
Napa
Placerville
Santa Rosa
Fairfield
Fort Bragg
Ukiah
Susanville
Yuba City
San Rafael
San Francisco
Berkeley
Oakland
Stockton
ModestoYosemite Village
FreemontPalo Alto
Mendocino
Mill Valley
Mammoth Lakes
Davis
Vallejo
Sunnyvale Merced
Fresno
MaderaWatsonville
Santa Cruz
SalinasMonterey
VisaliaTulare
Delano
Bakersfield
Coalinga
Paso Robles
Morro Bay
Los Gatos
Gilroy
Big Sur
Barstow
San Luis Obispo
Santa Maria
Lompoc
Santa Barbara
Oxnard
Ventura Glendale
Anaheim
Santa Ana
Santa Monica
San Bernadino
Riverside
Palm SpringsTorrance
Long Beach
Avalon
Oceanside EscondidoBrawley
Needles
El Centro
Yuma
Ridgecrest
Los Angeles
Pasadena
San Diego
Chula VistaEl Cajon Calexico
Crescent CityYreka
Weed
Eureka
Alturas
Redding
Bishop
Independence
Lone Pine
San Jose
Blythe
Carson City
Sacramento
Monterey Bay
San Francisco Bay
LakeTahoe
Mono Lake
Salton Sea
ShastaLake
Pyramid Lake
Walker Lake
Lake Mead
Great SaltLake
Hum
bold
t R
iver
White R
iver
San Joaquin River
Colo
rado R
iverKern River
Sacra
men
to R
iver
Santa Barbara Channel
Santa Cruz I.
Santa Catalina I.
Gulf ofCalifornia
P A C I F I C
O C E A N
IMPERIAL
OREGONIDAHO
ARIZONA
NEVADA
NE
VA
DA
MEXICO
NEVADA
C a l i f o r n i a
UTAH
UTAH
IDAHO
UTA
H
MESQUITE MINE33°03'18"N, 114°58'49"W
Legend:
State Capital
Cities
Major Highway
Railroad
County Boundary
State Border
0 50 250
Kilometres
100 150 200
N
February 2014
Mesquite Mine
Location Map
Imperial County,Southern California, U.S.A.
New Gold Inc.
Figure 4-1
4-3
www.rpacan.com
LANDFILL
Mine Development Area (FENCE)
Location Monument
Data for these Claims is Based on Mineral Surveys\by Registered Surveyors. 3rd order or better.
Data for these Claims is Based on Location Notices,Claim Plats and other Data filed by Various Companiesand is not based on a Mineral Survey. Less than 3rdorder surveys.
OWNED BY LACSD
OWNED BY W.M.M.I.
Section 33, T.13S, R.19E.GUNNERY RANGE BOUNDARY
31 32 33 34
18
33
15
Tract 38
17 16
7 108 9
6 35 4
0 1000 2000 3000 4000 feet
0 500 10 metres00
N
February 2014 Source: New Gold Inc., 2009.
Mesquite Mine
Claim Map
New Gold Inc.
Imperial County, California, U.S.A.
Figure 4-2
4-4
ww
w.rp
acan
.co
m
www.rpacan.com
New Gold Inc. – Mesquite Mine, Project #2180
Technical Report NI 43-101 – February 28, 2014 Page 4-5
SURFACE RIGHTS LOS ANGELES COUNTY SANITATION DISTRICT LANDFILL In 1993, a Mineral Lease and Landfill Agreement was signed between Hanson Resource
Company (HNRC) and Hospah Coal Company (Hospah), a subsidiary of Newmont Mining
Corporation (Newmont), in conjunction with Santa Fe Pacific Minerals Corporation (SFPMC).
Los Angeles County Sanitation District (LACSD) is now the successor to HNRC and WMMI
assumed the rights and obligations of Hospah / SFPMC / Newmont when the Mesquite
operation was acquired by WGI on November 9, 2003.
LACSD has constructed a landfill facility adjacent to and overlying portions of the existing
Mesquite Mine property. The landfill project will be located on private land owned by LACSD,
as shown in Figure 4-2. The landfill is expected to have an operational life of 100 years with
a receiving capacity of 20,000 tons of landfill material per day. As part of the landfill project,
LACSD has constructed a rail spur from the main rail line at Brawley to the site for delivery of
containerized waste from their facilities in the Los Angeles area.
Under the agreement, WMMI has retained the right to explore, mine, extract, process, market
and sell ore, and otherwise conduct mining and processing activities, anywhere within the
Mesquite property for an initial period through 2024 with automatic extensions until 2078.
LACSD has the right to utilize portions of the overburden stockpiles and spent ore from the
leach pads for use as daily cover for the landfill as well as for construction materials for general
purposes as well as liner design. This resource will be jointly used by both LACSD and WMMI,
but WMMI will have a priority.
WMMI remains responsible for the reclamation and environmental obligations for materials
mined and processed from previous or future mining activities according to the existing permit
requirements. If LACSD requires additional treatment, relocation, or additional processing of
stockpiled or rinsed heap materials, the Landfill Lease Agreement stipulates that WMMI will be
compensated for any additional costs incurred.
The 1993 Agreement provides for joint use of assets associated with the Mesquite Property
for the mutual benefit of both parties. Water is delivered to the property by WMMI from a well
field located southeast of the mine. The water wells and associated pipeline will be operated
and maintained by WMMI and water will be provided to LACSD with the costs shared based
on proportional usage. Other infrastructure items, such as access roads, power lines, and
www.rpacan.com
New Gold Inc. – Mesquite Mine, Project #2180
Technical Report NI 43-101 – February 28, 2014 Page 4-6
communications systems, will be treated on an individual basis. LACSD has realigned the
access road for the landfill project. Power lines and communication systems have been
chosen to operate as independent systems with all costs being the responsibility of the
individual parties.
ROYALTIES The majority of the mineral reserves planned for future mining at Mesquite will be subject to a
0.5% to 2% production royalty due Franco-Nevada Corporation depending on the claim group.
WMMI also pays a 6% to 9% net smelter royalty (depending on the relevant gold price) to the
California State Lands Commission on production from certain California State leased lands
under a Mineral Extraction Lease between WMMI and the California State Lands Commission.
Below $1,300 per troy ounce of gold, the royalty is 6%. From $1,300 to $1,800 per troy ounce
of gold, the royalty is 7%. From $1,800 to $3,600 per troy ounce of gold, the royalty is 8% and
above $3,600 per troy ounce of gold, the royalty increases to a maximum of 9%.
RPA is not aware of any environmental liabilities on the property. New Gold has all required
permits to conduct the proposed work on the property. RPA is not aware of any other
significant factors and risks that may affect access, title, or the right or ability to operate on the
property.
www.rpacan.com
New Gold Inc. – Mesquite Mine, Project #2180
Technical Report NI 43-101 – February 28, 2014 Page 5-1
5 ACCESSIBILITY, CLIMATE, LOCAL RESOURCES, INFRASTRUCTURE AND PHYSIOGRAPHY ACCESSIBILITY The Mesquite Mine is located approximately 35 miles to the east of the town of Brawley,
California, and about 52 miles northwest of the city of Yuma, Arizona. Access to the
property is from California State Highway 78 and then north along a paved private road
into the Mesquite site. Figure 4-1 shows the general location.
CLIMATE The climate for Mesquite is arid, with high temperatures in the summer generally in the
100°F to 110°F range and winter highs generally in the 70°F to 80°F range. Winter
temperatures are rarely below 32°F. Based on data collected at the Yuma weather station,
the average annual temperature is 73°F. The lowest minimum average temperature is
42°F occurring during January. Precipitation can occur throughout the year, but is most
common during the late summer months (August, September) or during the winter months
of January through March. Precipitation at the property totals less than three inches per
year. Commonly, the majority of a year’s precipitation occurs in one or two short duration
storm events. Annual evaporation as measured at the Yuma weather station is 97.7 in.
The combination of low precipitation and high evaporation results in a situation where
surface runoff from the area is uncommon. Washes in the area are dry and will channel
runoff only during severe storm events. On average, this may occur once per year,
although it is not uncommon to have one to two year periods with no surface flows. When
surface flows do occur, washes will typically flow for periods of less than one hour.
PHYSIOGRAPHY The Mesquite Mine is located a few miles to the southwest of the Chocolate Mountains
and the Chocolate Mountain Gunnery Range, at an elevation of between 600 ft and 1,000
ft above sea level. The property is on an alluvial fan that slopes gently from the northeast
to the southwest. The vegetation consists of sparse desert vegetation with creosote bush,
brittle brush, barrel cactus, and cholla cactus present.
www.rpacan.com
New Gold Inc. – Mesquite Mine, Project #2180
Technical Report NI 43-101 – February 28, 2014 Page 5-2
LOCAL RESOURCES Accommodations, supplies, and labour are available in either Brawley, California,
population 25,000 (2010 census), or Yuma, Arizona, population 93,000 (2010 census).
Consequently, mining suppliers and contractors are locally available.
INFRASTRUCTURE ELECTRICAL POWER Electricity for the mine is provided through a 92 kV power line. Power is supplied to the
site by Imperial Irrigation District Power Company. Power is stepped down from 92 kV to
13.2 kV on-site. All power distribution from this point onwards is distributed on equipment
and infrastructure owned by WMMI.
WATER Water for the project is supplied from the existing Vista well field located approximately
two miles south of California State Highway 78. The two current active wells are deemed
capable of supplying the water requirements for both WMMI and the LACSD. With the
new 18 in. diameter line in place, the two existing pumping systems are capable of
supplying approximately 2,000 gpm of fresh water to the operation. The mine will require
about 1,000 gpm and the landfill a maximum of 700 gpm when operating at full capacity.
HEAP LEACH PAD Leach Pad 7 has been designed by Tetra Tech with total capacity of a nominal 99.4 million
tons with an additional 32.5 million tons capacity remaining on Pad 6. As of December
2013, there was remaining capacity of a nominal 131.9 million tons. This should be
sufficient for the 127.7 million tons of mineral reserves.
www.rpacan.com
New Gold Inc. – Mesquite Mine, Project #2180
Technical Report NI 43-101 – February 28, 2014 Page 6-1
6 HISTORY The description of the history of the project is summarized from the Micon (2006) report.
The first gold production at the Mesquite project dates to the late 1800s and early 1900s
when placer gold was recovered on a small scale. After World War II, small-scale
subsistence mining continued. At times, hundreds of people worked the mines or
prospected in the area.
Gold was first discovered at Mesquite by track crews building the Southern Pacific railroad
around 1876. The first strike and claims in the area were staked at this time by Felisaro
Parro. During the 1920s and 1930s, small-scale subsistence placer mining was conducted
in the district by jobless men searching for gold in the Chocolate Mountains and
surrounding foothills. Larger placer and lode mining was reported in the area from 1937
through to the mid-1970s.
In 1957, prospectors Richard and Ann Singer, staked 27 claims in the area, and began a
dry washing campaign that lasted until the late 1980s. Attempts at lode mining on the
Mesquite property were initiated during the 1950s and continued through the late 1970s
with no significant production recorded. The largest shaft was the Big Chief, sunk by
Charlie Wade and K.W. Kelly, to a depth of 150 ft. Gold Fields Mining Corporation (Gold
Fields) became interested in the property in 1980 and spent the next two years exploring
and acquiring a land position. Once a land position had been acquired, Gold Fields started
an exploratory drill program and, in late 1982, announced that it had identified a bulk
mineable gold deposit. A more detailed description of the history of the exploration
programs is found in Section 10, Drilling.
Exploration during the 1970s included work by Placer-Amax, Conoco, Glamis Gold
Corporation (Glamis Gold), Newmont, and Gold Fields. Exploration sampling, trenching,
and drilling identified a number of gold bearing zones. The results and details concerning
the pre-Gold Fields exploration are not available for inclusion in this report.
In 1980, Gold Fields acquired the property and conducted exploration. They initiated a
thorough exploration program that included surface sampling and geophysics. In
September 1981, Gold Fields drilled twelve rotary drill holes, ten of which encountered
www.rpacan.com
New Gold Inc. – Mesquite Mine, Project #2180
Technical Report NI 43-101 – February 28, 2014 Page 6-2
significant mineralization within 200 ft of the surface. In 1982, Gold Fields drilled the Big
Chief deposit on a 141 ft fence line, with holes spaced 141 ft apart along the fence line.
This campaign employed 5-1/4 inch reverse circulation (RC) holes above the water table
(approximately 200 ft) and 3-1/16 inch core holes below the water table. By September
1982, 350 exploration holes had been drilled. By September 1983, a total of 868 holes
were completed totalling 284,439 ft of drilling. About half of the holes in the present
database were completed by mid-year 1988 (3,200 holes and 1.3 million ft). Gold Fields,
Santa Fe, and Newmont continued to drill on the Mesquite property by mostly RC drilling
as they mined the deposits, although Gold Fields completed most of the drilling on the
property. By 1993, over 5,000 holes had been completed by Gold Fields totalling 2.4
million ft.
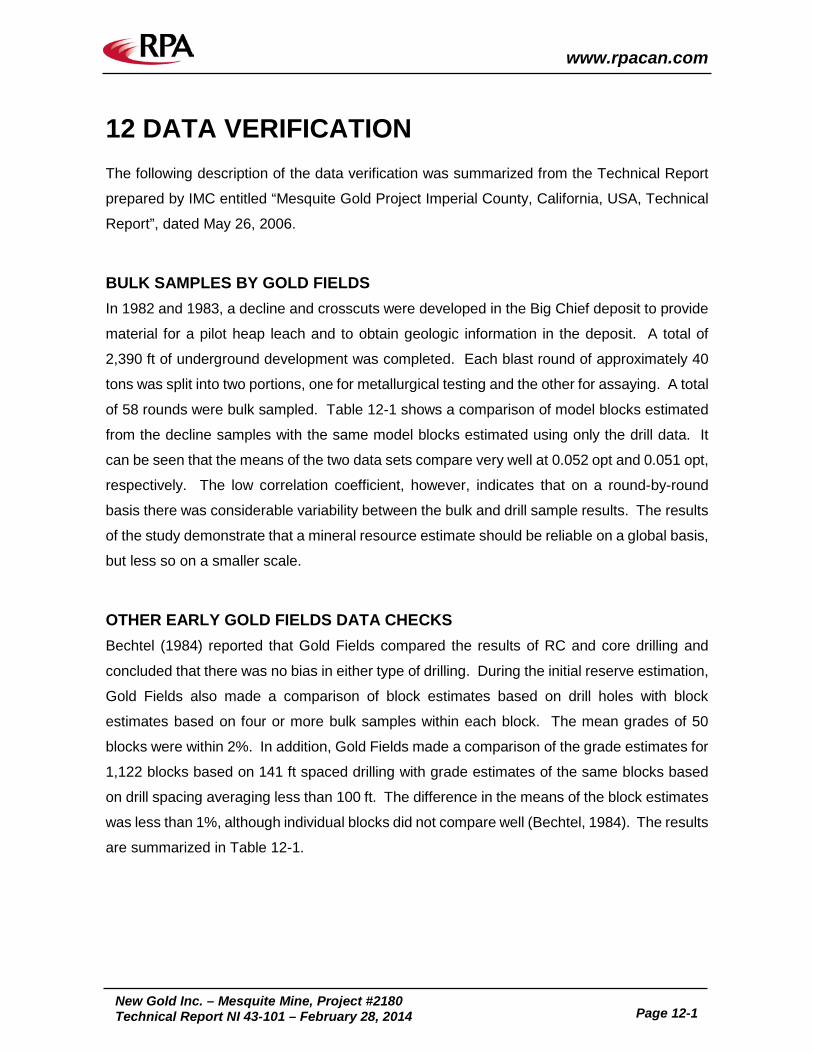
In late 1982, sinking of a decline began with the objective of improving the confidence in
the drill results of the Big Chief deposit. A total of 2,390 ft of underground decline
development (586 rounds) near the centre of the deposit was completed in 1983 (Bechtel,
1984). The decline was driven to provide material for pilot heap leach tests and to allow
detailed geologic mapping and bulk sampling of the deposit. Each round from the decline
was bulk sampled and a comparison with drill sampling was noted by Bechtel (1984). A
total of 50 model blocks were estimated from the decline data and compared to the same
blocks estimated from drill holes drilled along the path of the decline on 20 ft intervals.
The average grade of the two estimates compared closely, although the grade estimates
of individual blocks did not correlate well.
Gold Fields, Santa Fe, and Newmont continued to drill and develop the Big Chief, Vista,
Cherokee, Rainbow, Lena, and Gold Bug deposits on the property. The initial grid at Big
Chief was reduced to 70 ft with infill drilling along the 141 ft space fence lines. The Vista
deposit was initially drilled on 140 ft sections, with drill holes spaced 70 ft apart on the
sections. The other deposits were drilled initially on 200 ft to 400 ft grids, with infill drilling
generally completed on 100 ft spacing.
Gold Fields began commercial gold production in the Big Chief pit at Mesquite in March
1986 as a heap leach gold operation. In 1993, Santa Fe Pacific Gold Corporation (Santa
Fe) acquired the Chimney Creek Mine in Nevada and the Mesquite Mine in California from
Gold Fields. In May 1997, Santa Fe was acquired by Newmont Mining Corporation
www.rpacan.com
New Gold Inc. – Mesquite Mine, Project #2180
Technical Report NI 43-101 – February 28, 2014 Page 6-3
(Newmont). Newmont mined the deposit through May 2001, when there was a slope
failure in the Big Chief pit and the existing reserves at a $300/oz gold price were deemed
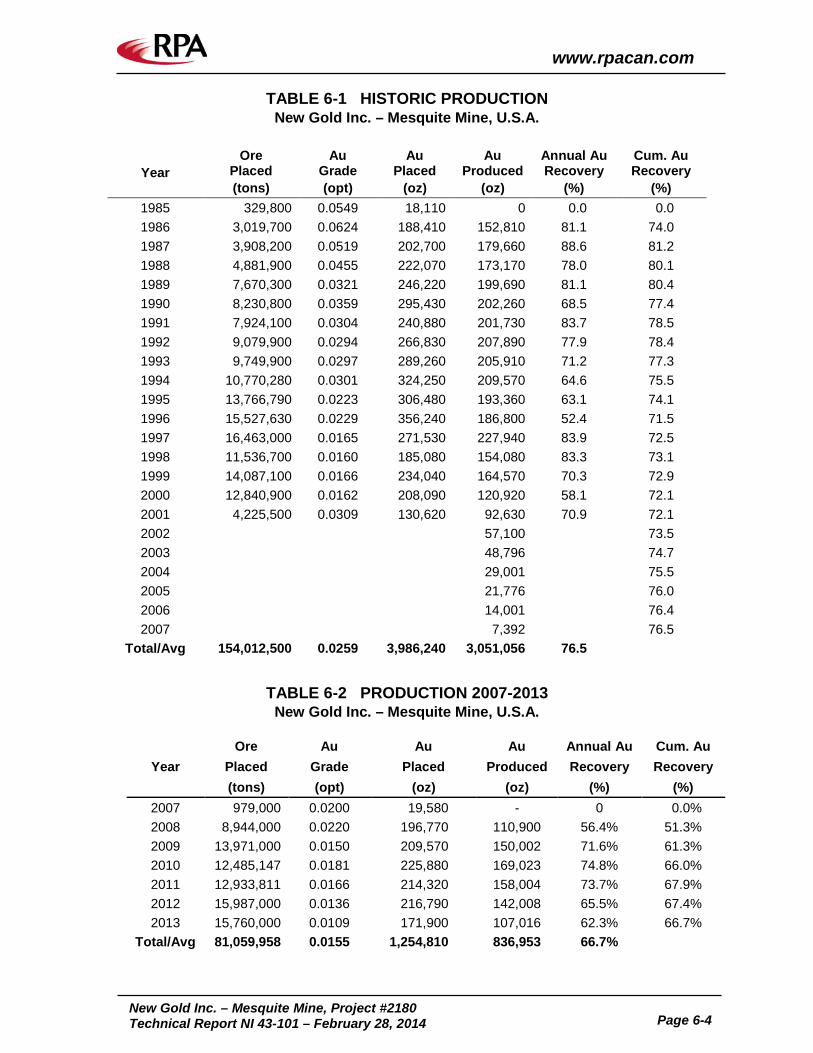
to be uneconomic. Gold recovery from the Mesquite heap continued through to 2007. A
total of 154 million tons of material grading 0.026 opt Au had been placed on the leach
pads when mining operations stopped in 2001. Approximately 3.05 million oz of gold were
recovered between 1985 and 2007 with a calculated average gold recovery of 76.5% prior
to the restart of operations in late 2007. Table 6-1 shows a summary of the historical mine
production.
WGI acquired the Mesquite Mine from Newmont in November 2003. WGI completed a
feasibility study in 2006 (Micon, 2006), and restarted operations in late 2007. In May 2006,
WGI reported 201.9 million tons grading 0.018 opt Au containing 3.56 million ounces gold
of Measured and Indicated Mineral Resources and 12.4 million tons grading 0.019 opt Au
of Inferred Mineral Resources. Proven and Probable Mineral Reserves were estimated at
130.9 million tons grading 0.018 opt Au. The foregoing Mineral Reserves and Mineral
Resources were considered compliant with CIM definitions.
Commercial production was achieved in January 2008. In June 2009, following a business
combination with WGI, New Gold became the operator. Newmont’s 2% net smelter royalty
on the project was transferred to Franco-Nevada Corporation in 2007.
Since 2007, an additional 837,000 ounces have been produced, bringing the total
production to 3.9 million ounces since 1985. Table 6-2 shows a summary of the mine
production from 2007 to 2013.
www.rpacan.com
New Gold Inc. – Mesquite Mine, Project #2180
Technical Report NI 43-101 – February 28, 2014 Page 6-4
TABLE 6-1 HISTORIC PRODUCTION New Gold Inc. – Mesquite Mine, U.S.A.
Technical Report NI 43-101 – February 28, 2014 Page 7-1
7 GEOLOGICAL SETTING AND MINERALIZATION REGIONAL GEOLOGY The description of the regional geology was taken from a paper written by Newmont Mesquite
personnel (Smith et al., 1999).
The Mesquite District lies on the southwest flank of the Chocolate Mountains, in amphibolite
grade metamorphic rocks of the upper plate of the Vincent-Chocolate Mountain Thrust. These
upper plate rocks represent a fragment of Precambrian and Mesozoic continental crust that
has an extremely complex history. During the Precambrian a gneissic complex was formed,
followed by several episodes of plutonic intrusion into the gneisses. Granitic rocks were again
intruded during the early Triassic and late Jurassic – early Cretaceous periods. The upper
plate rocks were also subjected to several phases of amphibolite facies regional
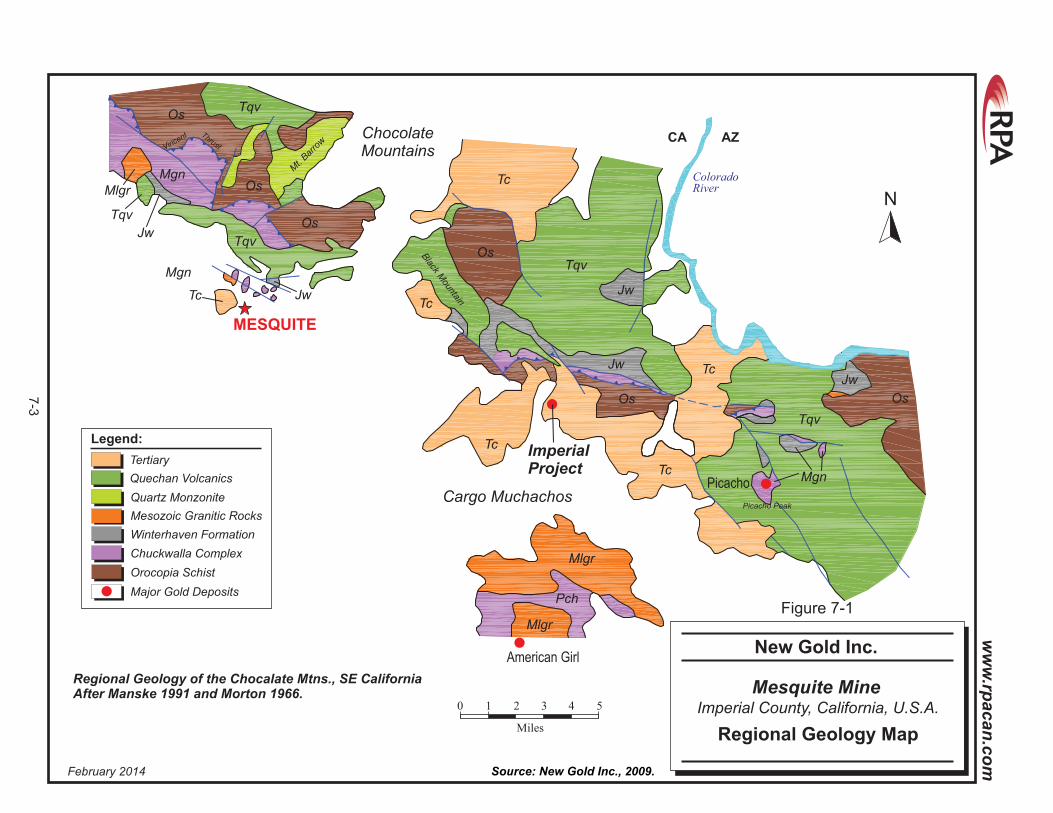
metamorphism, ranging from Precambrian to Mesozoic. Figure 7-1 illustrates the relationship
between the Mesquite deposit and the major faulting in the area. The map also includes the
locations of some other prospects/deposits that seem to be associated with the same regional
faulting.
Lithologies exposed in the southern Chocolate Mountains include Proterozoic granitic and
metamorphic rocks, Mesozoic metamorphic and plutonic units, early to mid-Tertiary volcanic
and plutonic rocks, and Tertiary to recent sedimentary units shown in Figure 7-1 (Manske,
1991). The Proterozoic is represented by the Chuckwalla Complex, while the Mesozoic terrain
is a structurally complicated package of gneisses, schist, phyllite, and plutons (Manske, 1991).
Mesozoic rock units include the Orocopia Schist, and Jurassic (?) Winterhaven Formation,
which are overlain by Tertiary Quechan Volcanic rocks and Quaternary alluvial deposits. A
stratigraphic section of the Mesquite area is shown in Figure 7-2.
The Chuckwalla Complex, locally referred to as the Mesquite Gneiss package, consists of
amphibolite to greenschist grade gneisses and schists and plutonic rocks (Manske, 1991).
These upper plate Proterozoic to Mesozoic metamorphic rocks are intruded by a series of
Mesozoic quartz diorite to peraluminous granite plutons (Haxel and Dillon, 1978). U/Pb isotope
dating of these intrusives indicates Jurassic to Cretaceous ages (80 Ma to 105 Ma) (Manske,
1991).
www.rpacan.com
New Gold Inc. – Mesquite Mine, Project #2180
Technical Report NI 43-101 – February 28, 2014 Page 7-2
The Chuckwalla Complex was thrust over the Orocopia Schist along the Vincent-Chocolate
Mountain Thrust (80 Ma to 74 Ma). The Orocopia is a medium to coarse-grained albite-
epidote-amphibolite grade schist, which is exposed along the core of the Chocolate Mountains
(Manske, 1991). The protolith of this formation was a middle Jurassic graphitic greywacke.
This unit does not outcrop in the Mesquite Mine, but it presumably underlies the district as the
regional basement (Haxel and Dillon, 1978).
The Chuckwalla and Orocopia sequence has been offset by the high-angle, normal Singer
Fault (8 Ma to 10 Ma). This N60o-70oW (75o-85o NE dipping) fault places the younger
Winterhaven Formation in contact with the older, higher metamorphic grade Chuckwalla and
Orocopia. The Winterhaven Formation comprises phyllites, quartzites, conglomerates, and
metavolcanics and appears to represent Jurassic volcanic and sedimentary protoliths,
metamorphosed at a lower greenschist grade (Manske, 1991).
The metamorphic and plutonic terrains were uplifted and eroded during the early Tertiary.
Oligocene calc-alkaline magmatism, consisting of andesite and rhyodacite flows (32 Ma) and
ignimbrites and tuffs (26 Ma) covered the eroded surface as part of the Quechan Volcanics.
The Mt. Barrow quartz monzonite sequence was then intruded (Crowe, 1978, Manske, 1991).
These dates are coincident with gold mineralization events, dated at approximately 26 Ma to
38 Ma. Following emplacement of the Mt. Barrow stock, the district was subjected to Tertiary
extension. This tectonism generated large-scale northwest-trending faults, and reactivated
some Mesozoic thrusts (Haxel and Grubensky, 1984). Near the end of Tertiary extension, the
area was regionally deformed resulting in fold axes trending west-northwest. The Chocolate
Mountains form the axis of a west-northwest trending antiform within the regional fold set, with
Mesquite lying on a z-fold along the southwest limb (Manske, 1991).
Erosion of these folded terrains produced poorly sorted conglomerates, fanglomerates, sands,
and silts. These Miocene deposits provide a mantle (10 ft to 500 ft thick) over most the
Mesquite district (Manske, 1991). A late Miocene basalt flow and recent alluvial gravel
deposits cap these units. The right-lateral strike slip motions on the San Andreas system (8
Ma to 10 Ma) have transected all of above noted lithologies, with the exception of recent gravel
deposits. A local splay of this system, the Singer Fault, is located between the Chocolate
Mountains and the Mesquite Mine.
MESQUITE
Mgn
Mgn
Mlgr
Jw
Jw Jw
JwJw
Tc
Tc
Cargo Muchachos
ChocolateMountains
Mt.
Barro
w
TcPicacho
American Girl
ImperialProject
Tc
Mlgr
Mlgr
Pch
Tc
Tc
CA
Tqv
Tqv
ColoradoRiver
TqvOs
Os
Os
Os
Os Os
Mgn
Tqv
Tqv
AZ
Black
Mountain
Picacho Peak
Vincent Thrust
0 1 5
Miles
2 3 4
N
Tertiary
Legend:
Quartz Monzonite
Quechan Volcanics
Mesozoic Granitic Rocks
Winterhaven Formation
Chuckwalla Complex
Orocopia Schist
Major Gold Deposits
February 2014 Source: New Gold Inc., 2009.
Regional Geology of the Chocalate Mtns., SE CaliforniaAfter Manske 1991 and Morton 1966. Mesquite Mine
Regional Geology Map
New Gold Inc.
Imperial County, California, U.S.A.
Figure 7-1
7-3
ww
w.rp
acan
.co
m
Medium grained albite-epidote-amphibolite faciesschist to coarse grained amphibolite faciesschist, graywacke protolith. Unknown thickness>170 Ma. Not exposed at mesquite Mine.
Orocopia Schist (Os) -
Quartz, biotite, feldspar rich granite, minormuscovite, white, coarse to fine grained, dikes,and sills common, 5-50 feet thick, 158-160 Ma.
Pegmatite (Jpeg) -
Quartz, Muscovite, Feldspar rich granite, whitecoarse to medium grained, sill and dikes common,grades laterally into pegmatite dikes, 5-100 feetthick, 60-105 Ma.
Muscovite Granite (Klgr, Kmgs) -
Biotite (60%), Quartz (30-40%), and feldspar richgneiss, black-dark grey, fine grained, equigranular,thin quartzite interbeds, greater than 1200 feetthick, gradational contact with Hbg unit. 145-170 Ma.
Biotite (10-30%), Quartz (70-90%), and feldsparrich gneiss, weak layering, salt and pepperappearance. Protolith of impure feldspathicquartzarenite to quartzarenite. 350 to 400feet thick, 145-170 Ma.
Black-Grey, rhyodacite and andesite flows, 32 Ma.Quechan Volcanics (Tqv) -
Chuckwalla Complex (mc)
Fine to medium grained calcareous quartzite,well rounded. Sandstone protolich. 145-170 Ma.
Bay Horse Quartzite (Jbg) -
Muscovite schist with tourmaline and amphibolerich layers, quartzofeldspathic zones with epidote,and blastoporphyritic units. Medium to lite gray, 0-125 feet thick.
Muscovite Schist (Jms) -
Interstratified siltstone, quartz muscovite schist,and quartz muscovite hematite phyllite, fine tomedium grained, pale green to pink, greaterthan 1000 feet thick, 145-205 Ma.
Winterhaven Formation (Jw, Mzw) -
Tert
iary
Jura
ssic
-Cre
tace
ou
s
Au
Min
eral
izat
ion
Jura
ssic
-Cre
tace
ou
s
Mela-diorite, quartz, plagioclase, biotite, and chloritecomposition, coarse grained, light gray to green, cutby Alaskite Granite, thickness unknown, 145-205 Ma.
Mesozoic Intrusives (Jmd, and Jd, Mzi) -
0 100 500
Feet
200 300 400
February 2014 Source: Independent Mining Consultants Inc., 2006.
NOTE:Tecno-Stratigraphic columnof the Chocolate Mountain
and Mesquite Mine(Manske, 1991, Morton, 1966)
Mesquite Mine
Stratigraphic Section
Imperial County, California, U.S.A.
New Gold Inc.
Figure 7-2
7-4
www.rpacan.com
www.rpacan.com
New Gold Inc. – Mesquite Mine, Project #2180
Technical Report NI 43-101 – February 28, 2014 Page 7-5
PROPERTY GEOLOGY The description of property geology is taken for the most part from a report by Della Libera et
al. (2011).
The Mesquite Mine comprises two sub-parallel, Oligocene-age mineralized zones: Big Chief
– Vista (Big Chief, Cholla, and Lena, Rubble Ridge, Panhandle, and Vista), and Rainbow
(Cherokee, Rainbow, and East Rainbow). Gold mineralization is hosted in Mesozoic gneisses
that are intruded by biotite/muscovite rich granites. The district is covered by a thin veneer (0-
300 ft) of Tertiary and Quaternary sediments, shed from the south slope of the Chocolate
Mountains. Gold mineralization is bound by post-mineral faulting related to the Neogene San
Andreas fault system.
STRATIGRAPHY The stratigraphic succession at Mesquite should be subdivided in three Gneiss Units, which
form a geologic continuum grading from a felsic upper unit represented as Biotite Gneiss (BG)
to a mafic lower unit represented as Mafic Gneiss (MG). A compositionally intermediate unit
defined as Jurassic Hornblend Biotite Gneiss is a transitional unit located between the upper
felsic and lower mafic schist.
The BG has a 60% to 80% felsic component (quartz dominant) with fine, weakly‐foliated biotitic
bands. In contrast to the lower units, BG is more commonly affected by brittle deformation and
nearly to completely oxidized with weak alteration to spotty pale mint green sericite in feldspar
sites or less commonly as bright green epidote replacing entire crystals. BG occasionally
contains fine‐medium grained, sub‐anhedral, pale yellow to white sphene.
The Hornblende‐Biotite gneiss (HBG) has a 40% to 60% felsic component with ductile
deformational fabrics. Quartz and feldspar content varies with depth grading from quartz‐
dominant to feldspar (plagioclase>orthoclase)‐dominant. The unit is also characterized by the
presence of yellow-orange to bright orange "axe‐head" sphene of various grain size and
crystallinity, augens of felsic‐dominant pegmatoid (PG), and local centimeters to meter tonalite
augens with rotational tails. The unit is locally mylonitic where ductile features are cut by brittle
deformation as suggested by the presence of weak mylonitic fabric in rotated angular blocks
and rubble in shear zones. The feldspars in the mafic‐dominant intervals are commonly altered
to pale green sericite. PG bands in HBG are predominantly grey with more quartz than
www.rpacan.com
New Gold Inc. – Mesquite Mine, Project #2180
Technical Report NI 43-101 – February 28, 2014 Page 7-6
feldspar, becoming more feldspar‐rich with depth. HBG is distinguished from BG by the
presence of ductile fabric, decreased felsic content, the size, color, and shape of the "axe‐
head" sphene, and the alteration of feldspars in mafic‐dominant bands of HBG. Increased
chloritization of biotite is common to the HBG along boundaries with PG.
The Mafic Gneiss (MG) is similar compositionally to the HBG with the distinction of increased
mafic content (70% to 80%) and a decrease in felsic‐dominant augens and bands. A mylonitic
texture is commonly observed and typically subtle, but can be spectacular with bold "S"‐type
folds. The mafic‐dominant bands of the MG can be distinctly schistose. PG bands in MG are
more white than grey with an increase in feldspar content. The felsic grains in the mafic‐
dominant intervals are predominantly plagioclase>orthoclase with 2‐10 vol.% quartz, locally
up to 50% by volume.
Miocene and Pliocene (?) sandstone, conglomerate, siltstone and sparse basalt interbeds
unconformably overlie the mineralized gneissic rock.
STRUCTURE Oligocene northwest‐striking dextral strike‐slip faults and north‐striking extensional faults are
the dominant control of gold mineralization at Mesquite. The fault sets mutually cut each other
and thus, likely formed contemporaneously. Post‐mineral deformation reactivated the
northwest‐ and north‐striking fault systems and developed a northeast‐striking left‐lateral
oblique slip fault set, which cuts and offsets the earlier north‐ and northwest‐striking fault sets
and disrupt the gold‐bearing ore bodies.
ALTERATION The alteration observed in pit exposures and drill core is largely confined to narrow fracture
selvages as sericite and/or chlorite, quartz ± adularia veins and breccias, and ankerite‐
dolomite veins and breccias. The alteration intensity is directly related to hydro fracture density
and is better developed in the BG than HBG or MG.
Figure 7-3 and 7-4 illustrate the local geology of the Mesquite Mine area.
12000 E8000 E 16000 E14000 E 22000 E14000 N
20000 E18000 E12000 N
10000 N
8000 N
6000 N
14000 N
12000 N
10000 N
8000 N
6000 N
4000 N
Legend:
Mine Dumps/Leach Pads
MESOZOIC-
JURASSIC
STRATIGRAPHY
MS-Muscovite Schist and Gneiss
Pegmatite
Muscovite Granite
Quechan Volcanics
Quaternary/Tertiary Alluvium
Mesozoic Intrusives
MG-Mafic Gneiss
Alaskite
HBG-Hornblende-Biotite Gneiss
BG-Biotite Gneiss
Winterhaven Fm.
InterfaultFault Contact
STRUCTURE
QUATERNARY/
TERTIARY
CRETACEOUS
0 1000
Feet
2000
N
10000 E
February 2014 Source: Independent Mining Consultants Inc., 2006.
NOTE:Mesquite Mine Geology 1997, Based on Pit and District Mapping.Modified from Manske, 1991, Morales, 1994 and Willis and Tosdal, 1992.
Mesquite Mine
Property Geology
New Gold Inc.
Imperial County, California, U.S.A.
Figure 7-3
7-7
ww
w.rp
acan
.co
m
AA’ CROSS SECTION THROUGH BIG CHIEF & CHOLLA
BB’ CROSS SECTION THROUGH VISTA & EAST RAINBOW
Tc
Tc Tc TcTc
SW
Dump
Bg
Bg
Bg
BgBg
Bg
Bg
Ultimate Pit
Current Pit Profile
Current Pit Profile
Hbg
Hbg
HbgHbg
Hbg
Hbg
Hbg
MS
Proposed E. Rainbow Expansion
Redox
MG
MG MG
MG MG
Whv
Whv
>0.006 oz/st Au
>0.006 oz/st Au
>0.006 oz/st Au
>0.006 oz/st Au
MG
Sin
ger F
ault
Sin
ger F
ault
Tc
Dump
Dump
NECHOLLABIG CHIEF
SW NEEAST RAINBOWVISTA
0 200 1000
Feet
400 600 800
0 200 1000
Feet
400 600 800
February 2014 Source: Independent Mining Consultants Inc., 2006.
NOTE: Cross sections are through gold deposit area(s)
Mesquite Mine
Typical Cross Section
New Gold Inc.
Imperial County, California, U.S.A.
Figure 7-4
7-8
ww
w.rp
acan
.co
m
www.rpacan.com
New Gold Inc. – Mesquite Mine, Project #2180
Technical Report NI 43-101 – February 28, 2014 Page 7-9
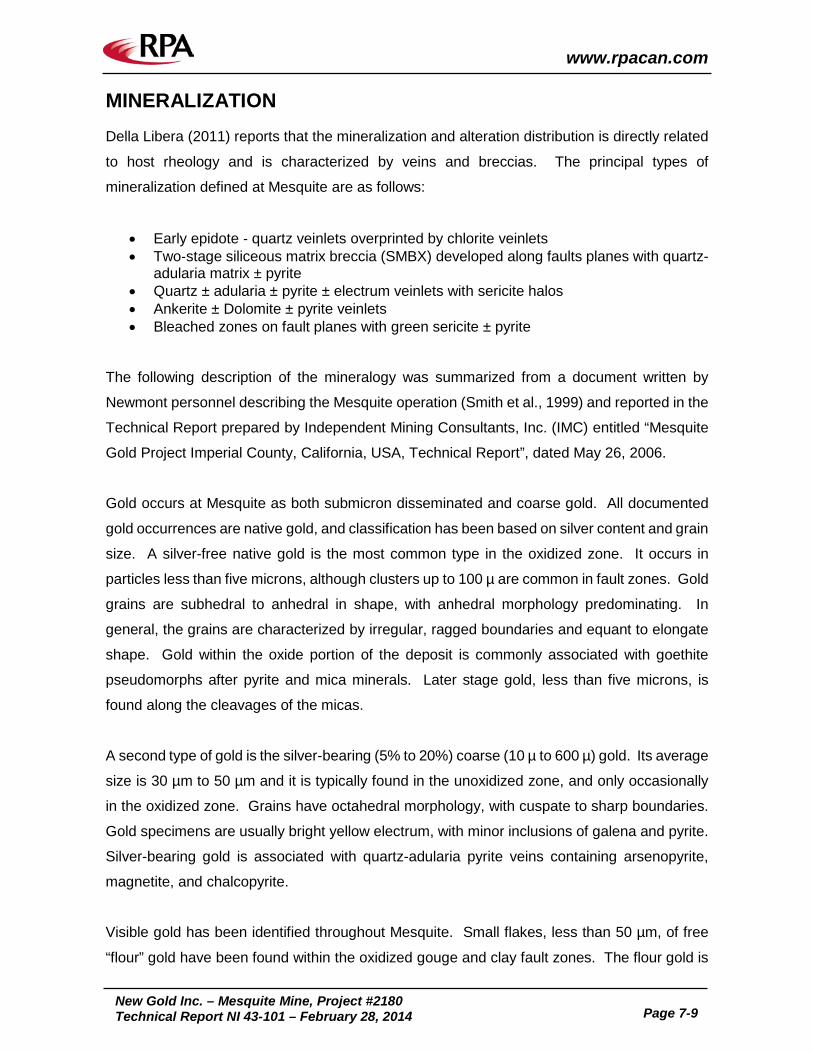
MINERALIZATION Della Libera (2011) reports that the mineralization and alteration distribution is directly related
to host rheology and is characterized by veins and breccias. The principal types of
mineralization defined at Mesquite are as follows:
• Early epidote ‐ quartz veinlets overprinted by chlorite veinlets • Two‐stage siliceous matrix breccia (SMBX) developed along faults planes with quartz-
adularia matrix ± pyrite • Quartz ± adularia ± pyrite ± electrum veinlets with sericite halos • Ankerite ± Dolomite ± pyrite veinlets • Bleached zones on fault planes with green sericite ± pyrite
The following description of the mineralogy was summarized from a document written by
Newmont personnel describing the Mesquite operation (Smith et al., 1999) and reported in the
Technical Report prepared by Independent Mining Consultants, Inc. (IMC) entitled “Mesquite
Gold Project Imperial County, California, USA, Technical Report”, dated May 26, 2006.
Gold occurs at Mesquite as both submicron disseminated and coarse gold. All documented
gold occurrences are native gold, and classification has been based on silver content and grain
size. A silver-free native gold is the most common type in the oxidized zone. It occurs in
particles less than five microns, although clusters up to 100 µ are common in fault zones. Gold
grains are subhedral to anhedral in shape, with anhedral morphology predominating. In
general, the grains are characterized by irregular, ragged boundaries and equant to elongate
shape. Gold within the oxide portion of the deposit is commonly associated with goethite
pseudomorphs after pyrite and mica minerals. Later stage gold, less than five microns, is
found along the cleavages of the micas.
A second type of gold is the silver-bearing (5% to 20%) coarse (10 µ to 600 µ) gold. Its average
size is 30 µm to 50 µm and it is typically found in the unoxidized zone, and only occasionally
in the oxidized zone. Grains have octahedral morphology, with cuspate to sharp boundaries.
Gold specimens are usually bright yellow electrum, with minor inclusions of galena and pyrite.
Silver-bearing gold is associated with quartz-adularia pyrite veins containing arsenopyrite,
magnetite, and chalcopyrite.
Visible gold has been identified throughout Mesquite. Small flakes, less than 50 µm, of free
“flour” gold have been found within the oxidized gouge and clay fault zones. The flour gold is
www.rpacan.com
New Gold Inc. – Mesquite Mine, Project #2180
Technical Report NI 43-101 – February 28, 2014 Page 7-10
thought to be a result of remobilization during oxidation and is supergene in nature. Gold is
typically associated with titanium oxides (rutile) and hematite. These zones are limited in
extent (one inch to three feet wide, with three feet to 50 ft of strike length), but can be extremely
high grade. Selective sampling indicates typical gold values of 1.0 opt to 2.0 opt Au, with a
high of 35.9 opt Au recorded in Big Chief.
Coarse-grained hypogene gold has also been noted with more frequency and larger size in
the unoxidized portion of the deposits. Recent test work on non-oxidized ore indicates that
65% to 78% of the gold is liberated free milling gold, 13% is associated with refractory sulphide
minerals, and the remainder is associated with iron oxides and carbonates. Grain size ranges
from 10 µm to 600 µm, with no textural indications of re-mobilization. Coarse gold generally
occurs as electrum within quartz veins (occluded and void fill), while the refractory portion is
found within overgrowth rims of arsenopyrite, chalcopyrite, and pyrite.
www.rpacan.com
New Gold Inc. – Mesquite Mine, Project #2180
Technical Report NI 43-101 – February 28, 2014 Page 8-1
8 DEPOSIT TYPES The following description of the deposit types was summarized from the Technical Report
prepared by IMC entitled “Mesquite Gold Project Imperial County, California, USA, Technical
Report”, dated May 26, 2006.
The gold mineralization at Mesquite was deposited in an epithermal setting, within 500 ft to
1,000 ft of the surface. The majority of the economically attractive mineralization is found in
the biotite gneiss and hornblende-biotite gneiss, while the mafic gneiss and intrusive rocks are
generally less mineralized. Gold mineralization is found both disseminated and vein hosted
within these units. The majority of the veining is controlled by faults and fault junctions which
have moderate to steep dips.
The gold mineralization dominantly occurs in two types:
• Pods of mineralization that are limited in lateral and vertical extent at fault intersections.
• Trends of mineralization along faults.
www.rpacan.com
New Gold Inc. – Mesquite Mine, Project #2180
Technical Report NI 43-101 – February 28, 2014 Page 9-1
9 EXPLORATION New Gold has conducted exploration drilling on the Project as described here and in Drilling,
Section 10.
EXPLORATION POTENTIAL New Gold conducted an exploration drilling program in 2010-2011 to test the potential for
defining economic Mineral Resources in the sulphide mineralization below the current Mineral
Reserves. The program comprised 36,341 ft of diamond drilling and reverse circulation drilling
in 36 holes. A significant Mineral Resource was not delineated and additional exploration was
not recommended.
The potential for lateral extensions of mineralization is largely limited by the permit boundaries.
www.rpacan.com
New Gold Inc. – Mesquite Mine, Project #2180
Technical Report NI 43-101 – February 28, 2014 Page 10-1
10 DRILLING Drilling on the Project has totalled approximately 3.1 million ft in 6,821 holes of which
WMMI drilled approximately 268,800 ft in 593 holes. Of the total holes drilled to date, 118
holes in the database were exploratory in nature, and tested for satellite deposits.
The holes were mostly drilled vertically. In general, the disseminated mineralization is flat-
lying or with a moderate 16º southwest dip and therefore the vertical drilling provides an
appropriate measure of the true mineralization thickness.
DRILLING BY PREVIOUS OPERATORS The pre-WMMI drilling comprises 2.7 million ft of drilling in 6,221 drill holes, most of which
are RC holes. A total of 103 holes in the database were diamond drill holes. During the
early development of the property, 128 of the RC drill holes were deepened by diamond
drilling below the water table. A total of 13 PQ core holes that were drilled for metallurgical
testing were not found in the current drill hole database. Most of the drill holes were
vertical holes and have not been downhole surveyed.
The drill hole locations are illustrated in Figure 10-1.
Hig
hw
ay 7
8
31 32 33 34
18 1517 16
7 108 9
6 35 4
0 1000
Feet
2000 3000 4000
N
February 2014 Source: New Gold Inc., 2009.
Mesquite Mine
Drill Hole Location Plan
New Gold Inc.
Imperial County, California, U.S.A.
Figure 01 -1
10-2
ww
w.rp
acan
.co
m
www.rpacan.com
New Gold Inc. – Mesquite Mine, Project #2180
Technical Report NI 43-101 – February 28, 2014 Page 10-3
REVERSE CIRCULATION DRILLING AND LOGGING Gold Fields completed most of the RC drilling on the property; more than 5,000 holes for
2.4 million feet. The methods used by Santa Fe and Newmont have not been
documented.
The initial sampling by Gold Fields on the RC drilling was completed using two field
samplers to collect and quarter each 2.5 ft drill interval from a Jones riffle beneath the drill
cyclone. Approximately 85% of the samples were dry. Wet sampling was completed by
a rotary wet sampler located beneath the drill cyclone, and during wet sampling flocculent
was added to aid the settling of fines.
Portions of each 2.5 ft interval bags were poured into sieves and washed. The washed
samples were then placed into trays to half fill the cells in the trays. The sample chips in
the trays were then logged by a company geologist. No sample trays are available
because the trays were discarded before WGI acquired the property.
CORE DRILLING AND LOGGING Core drilling was generally completed using HQ core, which was transported to Yuma,
Arizona, where it was cleaned and photographed. The core was logged, marked, and
rock quality designation (RQD) measurements were taken from each five-foot interval.
Core recovery information is not available in the database. The core from the various drill
campaigns was discarded before WGI acquired the property.
TWIN HOLE COMPARISON Gold Fields drilled two pairs of twin RC/diamond drill holes during the preproduction
exploration. They concluded that the assays showed the same overall distribution of gold
grades although with high local variation. The correlation coefficient for the paired
composites is 55%; the mean value of the core composites (20 ft) was 0.028 opt Au; and
the mean of the RC composites (also 20 ft) was 0.027 opt Au. The coefficient of variation
was 1.3 for the core composites and 0.9 for the RC composites (Bechtel, 1984).
Mine Development Associates (MDA) found, and reported in its December 2004 Technical
Report, that a number of the vertical diamond drill holes had been drilled within 25 ft of
The following description of the sample method and approach was summarized from the
Technical Report prepared by IMC entitled “Mesquite Gold Project Imperial County,
California, USA, Technical Report”, dated May 26, 2006.
REVERSE CIRCULATION SAMPLING Gold Fields’ initial sampling on the RC drilling was completed using two field samplers to
collect and quarter each 2.5 ft drill interval from a Jones riffle located beneath the drill
cyclone. The succeeding 2.5 ft interval split was combined to produce a quarter split of
the five-foot interval. This sample generally weighed 25 lb to 30 lb. This sample was
placed in bags and trucked to Yuma, Arizona, to the Gold Fields in-house sample
preparation facility. The samples were dried in Yuma prior to processing.
Details of Santa Fe and Newmont sampling methods have not been documented.
DIAMOND DRILL CORE SAMPLING The whole core was transported to Gold Fields in-house sample preparation facility in
Yuma, Arizona. The whole core was reduced, with the primary size reduction done with
a jaw crusher followed by secondary crushing with a rolls crusher. After crushing, the
sample preparation was similar to RC drilling.
BLASTHOLE DRILLING In addition to the drilling data, over 650,000 blasthole samples were taken during mine
operations from 1985 to 2001. Blastholes were drilled on 19 ft to 24 ft spacing on each
bench to define the ore and waste boundaries while mining. The blasthole samples were
collected by the blasthole driller using a through-the-deck “rocket” sampler, and assayed
at the mine laboratory using methyl-isobutylketone (MIBK) gold dissolution and atomic
absorption assaying.
www.rpacan.com
New Gold Inc. – Mesquite Mine, Project #2180
Technical Report NI 43-101 – February 28, 2014 Page 10-6
The assay information for most of these data is available in a database. Historically, the
blasthole database has been used to reconcile the various resource models developed for
the property. This means that, on a continuous basis, a key step in the development of
resource models was the comparison of how the modelling techniques performed
compared to these historic data. IMC also used these data to reconcile the model on
which the current mineral resource estimate is based.
COMMENTS REGARDING SAMPLING METHOD AND APPROACH The sampling methods and approaches used for the sampling of the Mesquite deposit are
consistent with the deposit and mineralization type. Though the data are historic in nature,
the descriptions provided indicate the sampling was done correctly. IMC (2006) reported
that they were not aware of any deficiencies in sampling method or sample recovery that
would impact on the reliability of the results.
In RPA’s opinion, the sampling method and approach are appropriate for mineral resource
estimation. Although the data are historic and details of the Santa Fe and Newmont
sampling methods have not been documented, the mineral resource estimates vs. actual
production reconciliation has been reasonable and therefore minimizes these issues.
DRILLING BY WMMI WMMI drilled 593 holes for a total of 268,800 ft. Diamond drilling accounted for 35,404 ft
in 36 holes.
REVERSE CIRCULATION SAMPLING Drilling is always done wet. Samples are taken every five feet. The sample weight ranges
from 5 lb to 50 lb, however, sampling plates in the cyclone are modified as needed to
produce a typical sample weight of 30 lb to 40 lb.
The sample splitter on the drill rig is washed out at least every drill rod, i.e., every 10 ft or
20 ft, depending on the type of drill. A five gallon bucket with a “rice” bag collects the
sample under the cyclone discharge chute. Flocculent is sometimes used to help settle
out the fines.
www.rpacan.com
New Gold Inc. – Mesquite Mine, Project #2180
Technical Report NI 43-101 – February 28, 2014 Page 10-7
Duplicate samples are taken on a random basis at the rate of one per 140 ft of drilling,
approximately a 30:1 ratio, e.g., five to six duplicates are taken for an 800 ft hole.
Sample bags and tags are pre-numbered in the office by the WMMI drilling crew and
stacked on the ground in order by the drill hole. Samples typically sit for at least five days
in the field to dry before being collected by the WMMI drilling crew and prepared for
shipping to an off-site laboratory for assays.
DIAMOND DRILL LOGGING AND SAMPLING Drill core was transported daily in sealed cardboard core boxes from the drill site to the
core logging facility on site. The front of each core box was marked with consecutive box
numbers, drill hole number, and drilled interval at the rig and a wood block was inserted
for each run drilled.
At the core logging facility, the project geologists marked intervals to be sampled and
logged the core before each box was photographed and then split. The core recovery and
rock quality data was collected between driller’s block intervals and core recovery was
also recorded for each sample interval. The core was continuously sampled at five foot
intervals. The core was logged noting lithology, alteration, mineralization, and structures.
Core descriptions and geotechnical measurements were entered directly onto a laptop
using Core View digital logging software.
Sampling was completed using a core saw for all competent rock intervals and using a
core splitter for friable material such as fault gouge. For each sample interval, one‐half
split of the core was placed in consecutively numbered plastic bags with correspondingly
numbered sample tickets. The other half was placed back into the original core box and
a corresponding numbered ticket was stapled inside the box for each interval sampled.
The boxes of split core were placed in secured storage inside the core storage facility.
www.rpacan.com
New Gold Inc. – Mesquite Mine, Project #2180
Technical Report NI 43-101 – February 28, 2014 Page 11-1
11 SAMPLE PREPARATION, ANALYSES AND SECURITY PRE-WMMI The following description of the sample method, analysis and security was summarized from
the Technical Report prepared by IMC entitled “Mesquite Gold Project Imperial County,
California, USA, Technical Report”, dated May 26, 2006.
SAMPLE SECURITY The samples were collected, split, and placed in sealed bags at the drill site and transported
to the Mesquite Mine exploration sample preparation facilities located in Yuma, Arizona, by
company employees. The sample pulps were prepared in Yuma and were shipped to assay
laboratories. Most of the samples were shipped to Gold Fields’ assay laboratory facilities in
Lakewood, Colorado. Although the procedure used by Santa Fe or Newmont has not been
formally documented, the only probable change to sampling protocol was that the Yuma office
was closed during this time resulting in sample preparation work being done at the mine site.
DRILL SAMPLE PREPARATION AND ANALYSIS Reverse circulation drill samples, core samples, and bulk samples (from the decline), were
treated at the Gold Fields sample preparation facility in Yuma, Arizona. The previously
prepared 40 lb bulk sample and the drill samples were crushed to minus 10 mesh and then
split in a Jones splitter to approximately one pound. This sample was pulverized to minus 150
mesh and split into four pulps. One of these pulps was fire-assayed at Gold Fields’ laboratory
in Lakewood, Colorado. Check assays were run on 20% of the samples by submitting a
second pulp to either Skyline Laboratory or Barringer Laboratory. The check assays made on
the duplicate pulps were noted to agree with the original assay with no bias and 95%
correlation coefficient. It is unknown if the aforementioned laboratories were certified.
During sample preparation, periodic checks were made for coarse gold by running the reject
material through a Denver gold saver and carrying out both visual and quantitative
assessments of the results (Bechtel, 1984).
www.rpacan.com
New Gold Inc. – Mesquite Mine, Project #2180
Technical Report NI 43-101 – February 28, 2014 Page 11-2
Due to the historic nature of the Mesquite assay data, the certification applicable to the
Barringer and Skyline laboratories during the course of their work is not known. Both were
commercial laboratories that were heavily relied on by the mining industry during that time. It
is also reported that a significant number of the assays were done by the Gold Fields facility
in Lakewood, Colorado. Note that much of the Gold Fields laboratory analyses would have
been in the areas of Big Chief that have been mostly mined out and would not be a major
factor for future production.
QUALITY ASSURANCE/QUALITY CONTROL, CHECK SAMPLES, CHECK ASSAYS According to Bechtel (1984), Gold Fields prepared all drill samples (both core and RC) and the
bulk samples from the decline at its sample preparation laboratory in Yuma, Arizona. After the
samples were fire assayed at the Gold Fields’ laboratory in Lakewood, Colorado, check assays
were done on approximately 20% of the samples. A second duplicated pulp was assayed by
either Barringer Laboratory or Skyline Laboratory.
Gold Fields’ comparison of 1,383 check assays with the corresponding original assays shows
a good correlation of the two sets of data. The means were within approximately 5% and the
correlation coefficient was 95%.
The QA/QC procedures by Santa Fe or Newmont have not been formally documented, but
QA/QC, check samples, and check assays were done as evidenced by information in the hard
copy files existing for each individual hole. In addition, a program of soluble cyanide assaying
was performed along with the fire assaying.
Figure 11-1 illustrates the sample preparation and assay procedure. In RPA’s opinion, the
sample preparation, security, and analytical procedures were adequate for Mineral Resource
estimation.
ALS CHEMEX
CODE: PREP 31B
QA/QC FOR DRILLING SAMPLES
Log sample in the
Lab.
Dry entire sample
Crush entiresample to >70%
-2 mm.
Split
Reject -2 mm. Blend, Split
1 Kg.
Pilverize, 85%
passing 75 micron.
1 AT Fire Assay
1 @ 20 samples
to check in
another Lab.
1 @ 20 samples
to check in
another Lab.
February 2014 Source: Independent Mining Consultants Inc., 2006.
The conventional approach to setting reference standard acceptance limits is to use the
expected assay ±2 standard deviations. Only 3% of the assays would be expected to fall
outside the limits and values would be expected to be randomly distributed about the
standard’s expected value. Five CRMs, less than 1% of the 610 submitted were outside the
limits. The results for G312-7 were on average 7% below the expected value, however, in
absolute terms it was only 0.01 g/t Au. In RPA’s opinion the results support the integrity of the
database used for mineral resource estimation. The control charts for results of the six CRMs
are illustrated in Figure 11-3.
www.rpacan.com
New Gold Inc. – Mesquite Mine, Project #2180
Technical Report NI 43-101 – February 28, 2014 Page 11-7
FIGURE 11-3 CONTROL CHARTS – CERTIFIED REFERENCE MATERIAL
0.20.40.60.8
11.21.4
1042
711
309
1166
011
775
1194
112
124
1227
112
461
1262
755
7519
5578
8555
7992
5580
6155
8313
5586
8555
9377
5596
7756
0087
5605
6456
1001
5611
8656
1461
5619
3156
2248
5625
4856
3140
5909
37
Grad
e (g
/t A
u)
Sample Number
G300-8
Expected -2SD +2SD Actual
0.19
0.21
0.23
0.25
1987
2019
8862
1990
3619
9167
1992
7619
9370
1995
4819
9709
1998
0219
9957
2001
1920
0742
2009
5112
7034
712
7053
812
7095
512
7113
812
7141
812
7156
112
7170
112
7184
712
7198
712
7207
812
7239
912
7265
012
7287
312
7310
0
Grad
e (g
/t A
u)
Sample Number
G312-7
Actual Expected -2SD +2SD
1.00
1.20
1.40
1.60
1.80
1001
910
271
1122
811
409
1189
812
187
1250
312
731
1996
3020
0097
2009
0555
7730
5583
5355
8938
5592
7556
1038
5614
4256
2118
5625
6956
2793
5631
0256
3300
5633
9612
7026
512
7081
112
7166
212
7227
712
7257
512
7302
5
Grad
e (g
/t A
u)
Sample Number
G901-7
Actual Expected -2SD +2SD
www.rpacan.com
New Gold Inc. – Mesquite Mine, Project #2180
Technical Report NI 43-101 – February 28, 2014 Page 11-8
0.550.600.650.700.750.80
1005
310
294
1041
710
610
1077
211
001
1105
311
148
1149
011
554
5588
5355
9503
5595
4055
9581
5596
2655
9683
5598
3155
9978
5600
7356
0222
5604
0556
0514
5606
3556
0874
5615
2856
1565
5616
7356
1916
5619
7459
0711
Grad
e (g
/t A
u)
Sample Number
G901-9
Actual Expected -2SD +2SD
0.700.750.800.850.900.951.001.05
1007
310
361
1082
819
8901
1992
5519
9648
1998
7520
0058
2010
6455
9508
5595
8755
9938
5602
4356
0599
5607
5456
0893
5616
3956
2010
5624
0859
0782
5909
1512
7057
912
7079
012
7093
412
7123
712
7154
012
7172
312
7196
912
7225
512
7279
112
7298
5
Grad
e (g
/t A
u)
Sample Number
G907-2
Actual Expected -2SD +2SD
0.15
0.25
0.35
0.45
0.55
0.65
1047
010
736
1091
511
188
1175
412
689
1990
5419
9331
1998
2320
0926
5576
7655
9616
5601
8156
0614
5612
1956
1404
5618
3956
2368
5625
0956
2839
5630
1912
7040
912
7117
112
7160
112
7221
612
7262
9
Grad
e (g
/t A
u)
Sample Number
G909-7
Actual Expected -2SD +2SD
www.rpacan.com
New Gold Inc. – Mesquite Mine, Project #2180
Technical Report NI 43-101 – February 28, 2014 Page 11-9
BLANK SAMPLES WMMI inserted 482 blank samples into the sample stream to check for contamination, drift,
and tampering. Blank samples comprised waste from a barren rhyolite outcrop on the
Mesquite site as well as samples used by the on-site laboratory.
In RPA’s opinion, the blank samples should have a maximum acceptance level of three times
the detection level of the analytical process, i.e., 3 x 0.003 = 0.01 g/t Au. The results
demonstrate that:
• 97.9% of the control blanks returned values within the maximum acceptance level; • 1.2% of the control blanks returned values between three and four times the detection
level; • 0.9% of the control blanks returned values greater than four times the detection limit.
In RPA’s opinion, the results indicate minimal evidence of contamination, drift, or tampering.
FIELD DUPLICATES WMMI submitted 298 split core duplicates and 376 split rotary sample duplicates during the
2010-2011 and 2013 drilling programs. Duplicate samples are used to monitor data variability
as a function of sample homogeneity. In RPA’s opinion the results of the field duplicates
support the use of the database for Mineral Resource estimation. Figures 11-4 and 11-5
illustrate the results of the field duplicate sample program.
www.rpacan.com
New Gold Inc. – Mesquite Mine, Project #2180
Technical Report NI 43-101 – February 28, 2014 Page 11-10
FIGURE 11-4 FIELD DUPLICATES - SPLIT CORE
FIGURE 11-5 FIELD DUPLICATES - ROTARY SPLITS
PULP DUPLICATES WMMI submitted duplicate pulp samples from 309 split core samples and 386 split rotary
samples during the 2010 and 2013 drilling programs. In RPA’s opinion the results of the pulp
duplicates support the use of the database for Mineral Resource estimation. Figures 11-6 and
11-7 illustrate the results of the pulp duplicate sample program.
R² = 0.9466
0.00
0.50
1.00
1.50
2.00
2.50
3.00
3.50
4.00
4.50
0.00 0.50 1.00 1.50 2.00 2.50 3.00 3.50 4.00 4.50
Dupl
icat
e (g
/t A
u)
Original (g/t Au)
Field Duplicates - Split Core
R² = 0.9814
0.00
0.50
1.00
1.50
2.00
2.50
3.00
3.50
4.00
4.50
0.00 0.50 1.00 1.50 2.00 2.50 3.00 3.50 4.00 4.50
Dupl
icat
e (g
/t A
u)
Original (g/t Au)
Field Duplicates - Rotary Splits
www.rpacan.com
New Gold Inc. – Mesquite Mine, Project #2180
Technical Report NI 43-101 – February 28, 2014 Page 11-11
FIGURE 11-6 PULP DUPLICATES – SPLIT CORE
FIGURE 11-7 PULP DUPLICATES – ROTARY SPLITS
R² = 0.95
0.00
0.50
1.00
1.50
2.00
2.50
3.00
3.50
4.00
4.50
0.00 0.50 1.00 1.50 2.00 2.50 3.00 3.50
Dupl
icat
e (g
/t A
u)
Original (g/t Au)
Pulp Duplicates - Split Core
R² = 0.993
0.000.501.001.502.002.503.003.504.004.505.00
0.00 1.00 2.00 3.00 4.00 5.00
Dupl
icat
e (g
/t A
u)
Original (g/t Au)
Pulp Duplicates - Rotary Splits
www.rpacan.com
New Gold Inc. – Mesquite Mine, Project #2180
Technical Report NI 43-101 – February 28, 2014 Page 12-1
12 DATA VERIFICATION The following description of the data verification was summarized from the Technical Report
prepared by IMC entitled “Mesquite Gold Project Imperial County, California, USA, Technical
Report”, dated May 26, 2006.
BULK SAMPLES BY GOLD FIELDS In 1982 and 1983, a decline and crosscuts were developed in the Big Chief deposit to provide
material for a pilot heap leach and to obtain geologic information in the deposit. A total of
2,390 ft of underground development was completed. Each blast round of approximately 40
tons was split into two portions, one for metallurgical testing and the other for assaying. A total
of 58 rounds were bulk sampled. Table 12-1 shows a comparison of model blocks estimated
from the decline samples with the same model blocks estimated using only the drill data. It
can be seen that the means of the two data sets compare very well at 0.052 opt and 0.051 opt,
respectively. The low correlation coefficient, however, indicates that on a round-by-round
basis there was considerable variability between the bulk and drill sample results. The results
of the study demonstrate that a mineral resource estimate should be reliable on a global basis,
but less so on a smaller scale.
OTHER EARLY GOLD FIELDS DATA CHECKS Bechtel (1984) reported that Gold Fields compared the results of RC and core drilling and
concluded that there was no bias in either type of drilling. During the initial reserve estimation,
Gold Fields also made a comparison of block estimates based on drill holes with block
estimates based on four or more bulk samples within each block. The mean grades of 50
blocks were within 2%. In addition, Gold Fields made a comparison of the grade estimates for
1,122 blocks based on 141 ft spaced drilling with grade estimates of the same blocks based
on drill spacing averaging less than 100 ft. The difference in the means of the block estimates
was less than 1%, although individual blocks did not compare well (Bechtel, 1984). The results
are summarized in Table 12-1.
www.rpacan.com
New Gold Inc. – Mesquite Mine, Project #2180
Technical Report NI 43-101 – February 28, 2014 Page 12-2
TABLE 12-1 COMPARISON OF BLOCK ESTIMATES FROM DECLINE VS. DRILL HOLES
New Gold Inc. – Mesquite Mine, U.S.A.
Item Drill Decline Mean – opt Au 0.052 0.051 Minimum Grade – opt Au 0.010 0.010 Maximum Grade – opt Au 0.099 0.175 Standard Deviation 0.018 0.034 Number of Blocks 50 50 Correlation Coefficient 12.70% 12.70%
IMC DATA COMPARISON AND COMMENTS IMC (2006) did a comparison of the drilling data with the blasthole data by pairing drill hole
composites with the closest blasthole within 10 ft. The summary statistics compared well,
indicating good agreement between these two key data sets.
IMC (2006) believed that the sampling database at Mesquite was adequate to develop the
resource model, mineral resource estimate, and ultimately, the mineral reserve estimate to the
level of accuracy required for the feasibility study.
The MDA analysis presented in Table 11-1 indicates the possibility that the RC data are slightly
high biased compared to core. IMC proposed that, if this was true, it had been accounted for
in the resource modelling, mostly due to, in the opinion of IMC, fairly aggressive grade capping.
The comparison of blasthole data to RC data does not show this bias.
CHECKS Original assay results from the individual drill programs are located in the hard copy files
containing drill hole logs and assay sheets. RPA compared the assays from the original assay
certificates with the entries in two diamond drill logs and found no errors. In RPA’s opinion the
definitive check is the Mineral Reserve model vs. actual production discussed in Item 15,
Mineral Reserves.
www.rpacan.com
New Gold Inc. – Mesquite Mine, Project #2180
Technical Report NI 43-101 – February 28, 2014 Page 13-1
13 MINERAL PROCESSING AND METALLURGICAL TESTING METALLURGICAL TESTING
HISTORICAL TESTING A significant amount of metallurgical testwork has been by all of the owners of the Mesquite
Mine. It has included testing of crushed ore, run-of-mine ore and both oxide and non-oxide
ore. The data has been reported extensive in previous NI 43-101 Technical Reports (IMC,
MDA).
Now that a significant amount of operating data has been accumulated, it is a more reliable
prediction of gold recovery and reagent consumption than the out dated metallurgical test data.
PRODUCTION DATA 2007 TO 2013 The relevant production data to be considered is from July 2007 when the mine reopened and
year-end 2013. During this time period approximately 82 million tons of ore containing
1,263,000 oz of gold have been placed on the heap leach pads with an average grade of
0.0155 opt Au. By December 2013, a total of 840,730 oz of gold had been produced, having
an overall average recovery of 66.5%. A summary is provided in Table 13-1.
TABLE 13-1 MESQUITE MINE PRODUCTION 2007 - 2013 New Gold Inc. – Mesquite Mine, U.S.A.
1. CIM definitions were followed for Mineral Resources. 2. Mineral Resources are estimated at a cut-off grade of 0.0035 opt (0.12 g/t) Au for Oxide and
Transition and 0.0070 opt (0.24 g/t) Au for Sulphide. 3. Mineral Resources are estimated using a long-term gold price of US$1,400 per ounce. 4. Mineral Resources are reported below the December 2013, as-mined topographic surface,
constrained by the 2013 optimized pit. 5. Mineral Resources are inclusive of Mineral Reserves. 6. Numbers may not add due to rounding.
RPA reviewed the estimate completed by SIM and BDRC and is of the opinion that the
Mesquite Mineral Resource Estimate has been conducted to a high standard and is
appropriate for public disclosure. SIM and BDRC classification methodologies and Measured
and Indicated categories are reasonable.
www.rpacan.com
New Gold Inc. – Mesquite Mine, Project #2180
Technical Report NI 43-101 – February 28, 2014 Page 14-2
DATABASE SIM and BDRC were provided with a drill hole database in comma delimited format text files
containing collar, down hole survey, assay and geological data. The cut-off date of the
database used for modelling is August 30, 2013.
The database consists of 6,571 drill holes with a total length of 2,908,197 ft. The majority of
these holes were within the vicinity of the Mesquite deposit, only 118 holes did not fall within
close proximity of the deposit and are deemed exploration holes, testing for satellite deposits.
The assay database consists of 516,677 samples, including a number of intervals greater than
20 feet in length. Intervals greater than 20 ft in length were assigned zero values. The gold
grades along with a small amount of information pertaining to cyanide soluble gold are
recorded in the database. The cyanide soluble information amounts to only 3% of the assays
and is deemed insufficient to be included in the resource estimate. A summary of the assay
data is provided in Table 14-2.
TABLE 14-2 SUMMARY OF RESOURCE DOMAINS New Gold Inc. – Mesquite Mine
GEOLOGICAL MODELS AND DOMAINS Wireframes surfaces and solids were provided to SIM and BDRC by New Gold personnel. The
wireframes represent geological and hydrogeological features pertinent to the resource
estimate.
New Gold generated wireframes for lithology, structural fault block, oxide domain and water
table as illustrated in Figures 14-1 to 14-3.
Drill Hole
10,000 Feet
Winterhaven
Legend: Lithology
Biotite Gneiss
Hornblende Biotite Gneiss
Mica Schist
Mafic Gneiss
February 2014
Mesquite Mine
Isometric View of LithologyWireframe Solids
(Looking to the Northeast)
New Gold Inc.
Imperial County, California, U.S.A.
Figure 14-1
14-3
ww
w.rp
acan
.co
m
10,000 Feet
February 2014
Mesquite Mine
Isometric View of Fault BlockWireframe Solids
(Looking to the Northeast)
New Gold Inc.
Imperial County, California, U.S.A.
Figure 14-2
14-4
ww
w.rp
acan
.co
m
Drill Hole
5,000 Feet
Base of Complete Oxidation
Legend:
Top of Fresh Rock
Water Table
February 2014
Mesquite Mine
Isometric Slice Through the OxidationDomain and Water Table Surfaces
(Looking to the Northeast)
New Gold Inc.
Imperial County, California, U.S.A.
Figure 14-3
14-5
ww
w.rp
acan
.co
m
www.rpacan.com
New Gold Inc. – Mesquite Mine, Project #2180
Technical Report NI 43-101 – February 28, 2014 Page 14-6
COMPOSITING Drill hole sample data were composited into five feet lengths starting at the top of the hole.
The composite length corresponds to the dominant sampling length, approximately 97% of the
samples are five feet in length. Composites were length weighted. No density weighting was
applied during compositing.
The various domain wireframes were used to assign codes to composites on a majority basis.
RPA concurs with the compositing strategy adopted and deems it appropriate to support
Mineral Resource Estimation. The sampling length is appropriate to capture geological
complexities that may be masked by longer compositing lengths.
EXPLORATORY DATA ANALYSIS Exploratory Data Analysis (EDA) was performed on the drill hole samples to investigate
statistical distinctions between geological features. SIM and BDRC divided the drill hole
samples up into the following categories for EDA:
• Lithology (Figure 14-4)
• Structural fault block (Figure 14-5)
• Oxide domain (Figure 14-6)
• Above and below the water table (Figure 14-6)
FIGURE 14-4 BOX PLOT BY LITHOLOGY TYPE
www.rpacan.com
New Gold Inc. – Mesquite Mine, Project #2180
Technical Report NI 43-101 – February 28, 2014 Page 14-7
FIGURE 14-5 BOX PLOT BY STRUCTURAL FAULT BLOCK
FIGURE 14-6 BOX PLOT BY OXIDE DOMAIN (LEFT) AND BY ABOVE AND BELOW WATER TABLE (RIGHT)
www.rpacan.com
New Gold Inc. – Mesquite Mine, Project #2180
Technical Report NI 43-101 – February 28, 2014 Page 14-8
In addition to univariate statistical analysis, contact profile analysis was performed to evaluate
the grade trends between domains.
SIM and BDRC concluded that there is no clear statistical distinction between the different
geological features. Rather, four domains, geographical separated, were outlined based on
the distribution of gold grades, nature of the occurrence of grade and the orientation of grade
trends. The domains used for further exploratory data analysis and modeling are shown Figure
14-7 and a summary of the domaining distinctions is given in Table 14-3.
TABLE 14-3 SUMMARY OF MESQUITE RESOURCE DOMAINS New Gold Inc. – Mesquite Mine
Domain Criteria for domains
Area 1 Mineralization tends to be higher-grade, with more distinct and continuous zones.
Area 2 Gold zones tend to be more patchy in nature with moderate grades.
Area 3 Continuous higher-grade zones, similar to Area 1, but with a gentle dip to the southeast.
Area 4 Separated from Area 3 by about 1000 feet, Area 4 has some continuous zones of gold but these tend to be smaller and this Area contains lower average grades. It also exhibits a gentle dip to the southeast.
In addition, probability shells were used to separate higher grade portions of the resource from
surrounding low grade areas. A gold grade threshold of 0.0025 opt was chosen for single
indicator estimation. The resulting probabilities were visually inspected and blocks with
probabilities greater than 40% were chosen for the generation of the probability shell used for
additional sub-domaining of the deposit (Figure 14-8).
Drill Hole
10,000 Feet
Area 1
Legend:
Area 3
Area 2
Area 4
February 2014
Mesquite Mine
Isometric View to the North EastShowing Extent of Area Domains
New Gold Inc.
Imperial County, California, U.S.A.
Figure 14-7
14-9
ww
w.rp
acan
.co
m
Drill Hole
10,000 Feet
February 2014
Mesquite Mine
Isometric View of 0.0025 opt,40% Probability Shell
New Gold Inc.
Imperial County, California, U.S.A.
Figure 14-8
14-1
0
ww
w.rp
acan
.co
m
www.rpacan.com
New Gold Inc. – Mesquite Mine, Project #2180
Technical Report NI 43-101 – February 28, 2014 Page 14-11
The composite statistics for the resource areas is given in table 14-4.
TABLE 14-4 SUMMARY STATISTICS FOR MESQUITE RESOURCE DOMAINS New Gold Inc. – Mesquite Mine
Area 1 Area 2 Area 3 Area 4 Other
Number of Composites 46,895 41,328 65,505 30,859 383,958
Min 0 0 0 0 0 Max 5.830 4.780 15.300 0.734 7.500 Mean 0.031 0.018 0.021 0.014 0.002 Std Dev 0.121 0.073 0.126 0.020 0.021 CV 3.9 4.2 6.0 1.4 8.8
RPA concurs with the SIM and BDRC findings that there is no distinct correlation between
geological features and grade distribution. RPA finds the choice of resource domains and the
use of probability shells acceptable.
BULK DENSITY Due to a lack of bulk density data present in the sample database, SIM and BDRC used
tonnage factors sourced from the 2010 RPA technical report. Block tonnage factors of 13.58
ft3/ton and 15.94 ft3/ton were assigned for hard rock and gravel, respectively, based on
historical data. These correspond to specific gravities of 2.36 and 2.01, respectively.
RPA recommends that New Gold review the tonnage factors currently being used.
OUTLIER TREATMENT The Mesquite Mine assay and composite distributions are very strongly positively skewed with
a disproportionate amount of metal contained within a small proportion of the samples. BDRC
and SIM approached outlier treatment using; capping of high grade outliers to the capping
values shown in Table 14-5 and a distance restriction of 35 ft from the block centroid for grade
values higher than the outlier restriction values also shown in Table 14-5.
www.rpacan.com
New Gold Inc. – Mesquite Mine, Project #2180
Technical Report NI 43-101 – February 28, 2014 Page 14-12
TABLE 14-5 SUMMARY OF MESQUITE OUTLIER RESTRICTION New Gold Inc. – Mesquite Mine
Area 1 Area 2 Area 3 Area 4 Other
Number of Composites 46,895 41,328 65,505 30,859 383,958 Capping Value 4 2 3.5 0.35 4 Outlier Restriction Value (max influence of 35 ft) 2 0.5 1.5 0.2 0.1 Mean Capped Grade 0.030 0.017 0.021 0.014 0.002 Stdev 0.113 0.055 0.080 0.019 0.015 CV 3.7 3.2 3.9 1.4 6.3 Number of Caps (primary capping Grade) 9 13 11 7 8
RPA reviewed the capping grades and found the values to be quite high. Reconciliation on a
pit by pit basis (Table 14-6) shows the model yielding 8% less tons and 15% higher grade
resulting in 8% extra ounces being reported. It is possible that the extra metal is attributed to
the relatively high capping grades.
TABLE 14-6 MESQUITE PIT BY PIT RECONCILIATION New Gold Inc. – Mesquite Mine
VARIOGRAPHY Experimental spatial analysis was performed on the composited samples within each area for
composites falling within the probability shell and collectively for all areas, for samples falling
outside of the probability shell (designated “other”). A nugget effect and two exponential
structures were fit to experimental correlograms. A summary of the variogram parameters
used during interpolation is summarised in Table 14-7.
www.rpacan.com
New Gold Inc. – Mesquite Mine, Project #2180
Technical Report NI 43-101 – February 28, 2014 Page 14-13
TABLE 14-7 VARIOGRAM PARAMETERS New Gold Inc. – Mesquite Mine
1st Structure 2nd Structure
Domain Axis Nugget Sill 1 Sill 2 Range (ft)
Azimuth (o)
Dip (o)
Range (ft)
Azimuth (o)
Dip (o)
Area 1 Major 0.35 0.604 0.046 36 146 15 849 136 0 Semi-major 11 239 10 202 46 44 Minor 7 1 72 49 46 -46
Area 2 Major 0.35 0.64 0.01 37 309 0 758 96 14 Semi-major 7 3 90 261 338 62 Minor 4 219 0 119 12 -24
Area 3 Major 0.35 0.625 0.025 28 353 14 299 4 30 Semi-major 6 262 4 167 276 -4 Minor 5 156 76 64 13 -59
Area 4 Major 0.5 0.324 0.176 19 159 80 754 330 19 Semi-major 16 207 -7 426 64 11 Minor 8 116 -7 61 183 68
Other Major 0.2 0.768 0.032 36 11 13 454 167 -22 Semi-major 8 281 0 245 99 42 Minor 4 191 77 92 238 39
BLOCK MODEL A block model with the dimensions 50 ft X 50 ft X 30 ft was chosen for the Mesquite Mine.
Blocks were coded according to domain using a majority rules criteria. The proportion of
blocks above and below the pre-mining topographic surface was also stored in the block
model. The block model limits for the Mesquite Project are summarised in Table 14-8.
TABLE 14-8 BLOCK MODEL LIMITS New Gold Inc. – Mesquite Mine
Direction Minimum Maximum Block Size (feet) Number of Blocks
East 6000 25000 50 380 North 4000 15500 50 230 Elevation -290 1000 30 43
RPA is of the opinion that the block size represents an appropriate Selective Mining Unit (SMU)
and is appropriate for resource estimation given the density of drilling.
www.rpacan.com
New Gold Inc. – Mesquite Mine, Project #2180
Technical Report NI 43-101 – February 28, 2014 Page 14-14
INTERPOLATION PARAMETERS An individual set of estimation parameters was developed for each area. Composites across
areas were shared while the probability shell was used as a hard boundary. Sensitivity of the
global estimate to estimation parameters was aided by a method known as “Herco” or hermite
polynomial correction. The method involves correcting an underlying distribution (normally
nearest neighbour or composites), and then creation of a theoretical grade tonnage curve
given information on change of support provided by the composite variogram and the block
size. The theoretical grade tonnage curve is then compared to block estimates and
interpolation parameters are adjusted until a suitable match is achieved. SIM and BDRC
corrected the histogram of the declustered composites.
A summary of the interpolation strategy adopted by SIM and BDRC is given in Table 14-9.
TABLE 14-9 INTERPOLATION STRATEGY New Gold Inc. – Mesquite Mine
Search Ellipse Range (ft) Number of Composites
Domain X Y Z Min/block Max/block Max/hole Octant Search
Area 1 750 750 200 6 60 10 1 DH per octant Area 2 750 750 200 6 48 8 1 DH per octant Area 2 750 750 200 6 48 8 1 DH per octant Area 4 750 750 200 6 60 10 1 DH per octant Other 750 750 200 6 32 8 1 DH per octant
RPA reviewed the interpolation strategy and is of the opinion that given the validation
discussed in the estimate validation section, the strategy is reasonable. RPA would
recommend, as an improvement to the interpolation strategy, aligning the search ellipse with
the variogram rotations and reducing the Z-axis range.
VALIDATION Sim and BDRC validated the block using the following validation procedures:
1. Visual inspection of the block model 2. Comparison with the theoretical grade tonnage curve (Herco) 3. Comparison with other estimation methods 4. Swath Plots 5. Comparison with previous estimate
Some examples of the results of the block model validation procedures are given in Figures
14-9 to 14-12.
1100
1000
900
1200
1100
1000
900
1000
1200
0 0
1000
< 0.005
Legend: Grade (OPT)
0.010 - 0.015
0.005 - 0.010
0.015 - 0.020
0.020 - 0.025
0.025 - 0.030
0.030 - 0.035
0.035 - 0.040
0.050 - 0.055
0.060 - 0.065
0.055 - 0.060
0.065 - 0.070
0.070 - 0.075
0.075 - 0.080
0.080 - 0.085
0.085 - 0.090
0.040 - 0.045
0.045 - 0.050
0.090 - 0.095
> 0.095
0 100 500
Feet
200 300 400
February 2014
Mesquite Mine
Vertical Section Through theMesquite Block Model
New Gold Inc.
Imperial County, California, U.S.A.
Figure 14-9
14-1
5
ww
w.rp
acan
.co
m
www.rpacan.com
New Gold Inc. – Mesquite Mine, Project #2180
Technical Report NI 43-101 – February 28, 2014 Page 14-16
FIGURE 14-10 HERCO THEORETICAL GRADE TONNAGE CURVES (CHANGE OF SUPPORT) VERSUS BLOCK ESTIMATE GRADE TONNAGE CURVES FOR
AREAS 1 AND 2
FIGURE 14-11 COMPARISON BETWEEN ESTIMATION METHODS
www.rpacan.com
New Gold Inc. – Mesquite Mine, Project #2180
Technical Report NI 43-101 – February 28, 2014 Page 14-17
FIGURE 14-12 NORTH-SOUTH SWATH PLOTS FOR AREAS 1 AND 2
RPA reviewed the results of the validation performed and is of the opinion that that the
interpolation strategies and underlying resource estimation assumptions are adequate to
support Mineral Resource reporting as per NI43-101.
RESOURCE CLASSIFICATION Mineral Resources at the Mesquite Mine have been classified using a distance to sample
based technique. SIM and BDRC, also considered the relative degree of confidence based
off of years of production history, statistical information and an indicator variogram for 30 ft
composites using a 0.01 opt gold threshold.
TABLE 14-10 CLASSIFICATION CRITERIA New Gold Inc. – Mesquite Mine
Classification Average Sample
Distance Drilling Pattern Additional criteria
Measured 50 75 ft by 75 ft High degree of consistency Indicated 140 200 ft by 200 ft Relatively high degree of consistency and continuity Inferred max = 300 - -
www.rpacan.com
New Gold Inc. – Mesquite Mine, Project #2180
Technical Report NI 43-101 – February 28, 2014 Page 14-18
Subsequent to flagging block using the criteria described above, SIM and BDRC manually
created classification wireframes for re-flagging blocks, ensuring that the block designation fell
within continuous and consistent areas. Figure 14-13 shows an example of the final Mesquite
Mineral Resource classification.
RPA reviewed the classification of the Mesquite Deposit and is of the opinion that classification
has been performed to a high standard and is consistent with industry practices.
MINERAL RESOURCES The 2013 end of year Mineral Resources are reported below the June 2013 as-mined
topographic surface and are constrained by the 2013 optimized pit shell. Table 14-11 gives a
detailed breakdown of the Mineral Resources at the Mesquite Mine.
TABLE 14-11 2013 MINERAL RESOURCES FOR THE MESQUITE DEPOSIT – DECEMBER 31, 2013
1. CIM definitions were followed for Mineral Resources. 2. Mineral Resources are estimated at a cut-off grade of 0.0035 opt (0.12 g/t) Au for Oxide and Transition
and 0.0070 opt (0.24 g/t) Au for Sulphide. 3. Mineral Resources are estimated using a long-term gold price of US$1,400 per ounce. 4. Mineral Resources are reported below the December 2013, as-mined topographic surface, constrained
by the December 2013 optimized pit. 5. Mineral Resources are inclusive of Mineral Reserves. 6. Numbers may not add due to rounding.
Drill Hole
Indicated
Legend: Resource Classification
Unclassified
Inferred0 500 2000
Feet
1000 1500
February 2014
Mesquite Mine
Vertical Section ThroughMesquite Deposit Showing the
Final Mineral Resource Classification
NOTE:- All Blocks (Top).- Filtered by Probability Shell (Bottom).
New Gold Inc.
Imperial County, California, U.S.A.
Figure 14-13
14-1
9
ww
w.rp
acan
.co
m
www.rpacan.com
New Gold Inc. – Mesquite Mine, Project #2180
Technical Report NI 43-101 – February 28, 2014 Page 15-1
15 MINERAL RESERVE ESTIMATE SUMMARY The mineral reserve estimate for the Mesquite Mine, effective December 31, 2013, is
summarized in Table 15-1.
TABLE 15-1 MINERAL RESERVES – DECEMBER 31, 2013 New Gold Inc. – Mesquite Mine
Class Classification Tons Grade Tonnes Grade Contained Au
1. CIM definitions were followed for Mineral Reserves. 2. Mineral Reserves are estimated at a cut-off grade of 0.006 opt (0.21 g/t) Au for Oxide and Transition and
0.012 opt (0.41 g/t) Au for Non-Oxide. 3. Mineral Reserves are estimated using an average long-term gold price of US$1,300 per ounce. 4. Numbers may not add due to rounding.
DILUTION Within the mine planning software, single blocks below cut-off within a mineralized area are
included in the mining shapes as dilution.
CUT-OFF GRADE Cut-off grades are based on the 2006 analysis done by IMC and included in the Micon NI 43-
101 Technical Report. Cut-off grades at that time were based on operating costs of $2.25 per
ton and a gold price of $500 per ounce of gold. Using a recovery of 75% for oxides and 35%
for non-oxides, the breakeven cut-off is estimated to be 0.006 opt for oxides and 0.012 opt for
www.rpacan.com
New Gold Inc. – Mesquite Mine, Project #2180
Technical Report NI 43-101 – February 28, 2014 Page 15-2
non-oxides. Using current operating costs of $3.37 per ton and gold prices of $1,300 per
ounce, RPA estimates a breakeven cut-off of 0.003 opt for oxides and 0.007 opt for non-oxides
showing that factors used for cut-off are conservative. The higher cut-off grade allows for
operating costs, capital costs, and a small margin.
RECONCILIATION From 2007, Mesquite operation has produced 5% more tons at the modelled grade for 5%
more contained ounces gold than defined by the mineral reserve model for the same volume
of mineralization mined. A new model was developed in August 2013 which was reconciled
to production over the past five years.
RPA is unaware of any non-technical issues, e.g., social, political, legal, environmental, that
would affect the Mineral Resource and Mineral Reserve estimates.
www.rpacan.com
New Gold Inc. – Mesquite Mine, Project #2180
Technical Report NI 43-101 – February 28, 2014 Page 16-1
16 MINING METHODS MINING OPERATIONS The Mesquite Mine is an operating open pit mine with ore processing by heap leaching using
a carbon-in-column (CIC) circuit to recover gold. Current mine production is a nominal 146,000
tons per day of total material, including a nominal 32,000 to 46,000 tons per day of ore that is
hauled to the leach pad. Total mine production is capped at 60 million tons per year based on
the air quality permit. WMMI is applying for permits to increase the production tonnage to 65
million tons per year. For 2013, gold production was 107,000 ounces.
The mine operations restarted in late 2007 with commercial production in January 2008. There
are six full years of operating data which were combined with the life-of-mine plan to develop
an economic model and life-of-mine cash flow.
MINE DESIGN Mining is performed through a conventional truck/shovel open pit mining method. Operations
include drilling, blasting, loading and hauling. ROM ore is hauled directly to the leach pad to
the south for processing. Waste mining utilizes the same equipment fleet used to produce ore.
The primary waste disposal facilities are to the north (Cherokee, Rainbow 3), west, (Big Chief)
and east (Rainbow Long) of the active mining pits with a potential opportunity for backfilling
some of the mining areas as they are completed. The mine general layout is shown in Figure
16-1.
The Whittle software was used for pit optimization. Whittle uses the Lerchs-Grossmann
Floating Cone algorithm at a series of gold prices within the ultimate pit shell to define separate
mining phases. Final mining phases were defined by the pit shell defined at a gold price of
$1,250 per ounce. Mineral reserves were generated from the pit designs produced around
these shells.
The pit optimization utilized metallurgical recoveries of 75% for oxide ores and 35% for non-
oxide ores. Oxidation is defined by LECO sulphur results with non-oxide ores having 0.4 to
0.7% sulphur. Sulphur levels above 0.7% are classified as waste. The input parameters for
the pit optimization were based on mining costs of $1.23/ton mined plus $0.015/ton per bench
(30 ft) below 700 ft elevation. An additional $0.20/ton was added to the mining cost for all
www.rpacan.com
New Gold Inc. – Mesquite Mine, Project #2180
Technical Report NI 43-101 – February 28, 2014 Page 16-2
material other than fill. Other costs used include a processing cost of $1.70/ton ore and a
General and Administrative cost of $1.00/ton ore. Other input parameters are based on third-
party pit stability analysis and current refining prices. Mineral Reserves are summarized in
Tables 15-1.
Given the results of the Whittle pit optimization, a final mineable pit was developed by WMMI.
Slope angles used for design held to recommendations from BGC Engineering and prior
criteria established by Engineering Analytics. Numerous pit slope stability analyses have been
conducted over the years with work from Call & Nicholas (1986), Shepard Miller (1999), C.O.
2009), BGC Engineering Inc. (2013) and Nicklaus Engineering Inc. (2013).
Final highwall slope angle criteria vary by area with the steepest walls on the south and
shallowest in the northeast. Pit design considered operational concerns such as highwall
slopes, ramp placement and phase pit geometry. Road geometry considered adequacy for
the 205-ton haulage fleet to be used for width and performance characteristics up to the
maximum gradeability. Maintaining haulage ramps to a maximum of 10% has been proven to
maintain fleet performance and equipment longevity. Minimum pushback widths accounted
for fleet access, shovel turn radius, and mobility within the active mining areas. The key design
parameters are shown in Table 16-1.
TABLE 16-1 MINE DESIGN PARAMETERS New Gold Inc. – Mesquite Mine
Haul Road Width 100 ft Haul Road Grade 10% Interramp Slope Angles: - from 0° to 90° 37° - from 90° to 270° 43° - from 270° to 330° 37-43° - from 330° to 360° 27° Mining Bench Height 30 ft Vertical Interval between Catch benches 60 ft Minimum Operating Width 200 ft Minimum Design Pushback Width 350 ft
The ultimate pit designs for Vista, Vista West, Big Chief, and Brownie are shown in Figure 16-
2.
5000
15000
20000
0
15000
5000
10000
10000
15000
05000
10000
5000 200001500010000
Leach Pad
Big Chief
Big Chief
Brownie
BRO
BB2
Cherokee
Rainbow 3
Rainbow
Vista
VistaWest
VC1
VC2VW1
VW2
VW3
BC1 BA3
BC6
0 1000 5000
Feet
2000 3000 4000
N
February 2014
Mesquite Mine
General Mine Layout
New Gold Inc.
Imperial County, California, U.S.A.
Figure 16-1
16-3
www.rpacan.com
5000
15000
20000
0
15000
5000
10000
10000
15000
05000
10000
5000 200001500010000
Leach Pad
Big Chief
Big Chief
Brownie
BRO
BB2
Cherokee
Rainbow 3
Rainbow
Vista
VistaWest
VC1
VC2VW1
VW2
VW3
BC1 BA3
BC6
0 1000 5000
Feet
2000 3000 4000
N
February 2014
Mesquite Mine
Ultimate Pit Design
New Gold Inc.
Imperial County, California, U.S.A.
Figure 16-2
16-4
www.rpacan.com
www.rpacan.com
New Gold Inc. – Mesquite Mine, Project #2180
Technical Report NI 43-101 – February 28, 2014 Page 16-5
MINE PLANNING The Mesquite open pit designs were developed based on a $1,250 per ounce gold price. The
low-grade nature of the deposit dictates the use of large-scale open pit mining equipment for
efficient and cost-effective mine development. The pits are divided into multiple phases to
meet the ore production rate and maintain a nominal 3.1:1 (W:O) stripping ratio through the
mine life. There are three phases for the Vista West area (VW1,VW2, VW3), four phases for
the Big Chief area (BA3,BB2,BC1,BC6), and two phases for the Vista area (VC1, VC2).
Haulage profiles were determined for each bench from each phase to the leach pad or waste
dump location for each production year. The mining schedule is based on a nominal annual
ore production rate of 13.5 million tons of ROM ore per annum. The life of the mine spans ten
years from 2014 to 2023. Backfilling of prior mined pits is used wherever possible to reduce
haulage costs.
MINE PRODUCTION SCHEDULE The mine production schedule was generated based on reserves within the designed pit
phases using the following parameters and guidelines:
• Target of a nominal 13.5 million tons of ore per annum, or 38,500 tons per day • Target high grade and low stripping in the earlier pit phases
The schedule includes 127.8 million tons of proven and probable mineral reserves. The
production figures from 2007 to 2013 are shown in Table 16-2 and life-of-mine production, in
Table 16-3.
TABLE 16-2 MINE PRODUCTION 2007-2013 New Gold Inc. – Mesquite Mine
MINE EQUIPMENT Two hydraulic shovels (44 yd3) are used as the primary loading units. The hydraulic shovels
are supported by two front-end-loaders (28 yd3, 26 yd3) which provide additional loading
capacity as well as clean-up support. Off-highway 205-ton haul trucks are used as the primary
haulage unit. Mine mobile equipment fleet requirements are based on the annual mine
production schedule for ore and waste, mine shift schedules, and equipment productivity
estimates. Table 16-4 lists the current major mine equipment fleet. The mine work schedule
is two 12-hour shifts per day, seven days per week.
Drilling is performed with a fleet of rotary down-the-hole hammer drills (8¾ in. diameter) on a
nominal 26 ft x 26 ft pattern or a 28 ft x 28 ft pattern. Blasting is controlled to minimize
backbreak. The overall powder factor is 0.26 to 0.32 lb/ton. Holes are drilled to a 30 ft bench
height with 3 ft of sub-drilling for a total depth of 33 ft.
www.rpacan.com
New Gold Inc. – Mesquite Mine, Project #2180
Technical Report NI 43-101 – February 28, 2014 Page 16-7
TABLE 16-4 MINE EQUIPMENT FLEET New Gold Inc. – Mesquite Mine
Equipment Manufacturer Size Quantity
Truck - MT3700AC Terex 205 ton 16 Truck - 789C Caterpillar 195 ton 2 Wheel Loader - L1350 LeTourneau 28 yd3 1 Wheel Loader - WA1200 Komatsu 26 yd3 1 Hydraulic Shovel - RH340 Terex 44 yd3 2 Motor Grader - 16M Caterpillar 16 ft 2 Track Dozer - D10T Caterpillar 580 HP 3 Track Dozer - D9T Caterpillar 410 HP 2 Wheel Dozer - 834H Caterpillar 498 HP 2 Drill - D45KS Sandvik 45,000 lb 4 Water Truck - 777F Caterpillar 20,000 gal 2
www.rpacan.com
New Gold Inc. – Mesquite Mine, Project #2180
Technical Report NI 43-101 – February 28, 2014 Page 17-1
17 RECOVERY METHODS PROCESS PLANT
SUMMARY The processing facilities were designed to process 8,800 gpm of pregnant gold solution
producing up to 140,000 oz of gold annually from a combination of 98 million tons of oxide ore
grading 0.016 opt and 30 million tons of non-oxide ore. WMMI reported that the solution flow
rate was approximately 13,000 gpm at the time of the site visit. The total life-of-mine tonnage
will be approximately 128 million tons at an average grade of 0.018 opt gold.
The processing facilities include the following operations:
• Heap leaching • Carbon adsorption • Desorption and gold recovery • Reagents and utilities • Water services
Originally the ore was crushed, however since the operation was re-started in 2007, on run-of-
mine (ROM) ore is leached. ROM ore, with lime added for pH control, is trucked to the heap
leach pad. The ore is stacked to a height of 20 ft. The ultimate pad height has been increased
from 200 ft to 300 ft.
Dilute sodium cyanide solution is pumped from either the barren or the intermediate solution
ponds and distributed to the surface of the leach pad with drip emitters. The solution then
percolates through the pad extracting the gold. The gold bearing pregnant solution is collected
in a series of flume boxes, with the option to direct solution to the intermediate pond, the barren
solution tank, or the pregnant solution tank. Low-grade solution in the intermediate pond is
pumped back to areas of the leach pad that contain fresh ore in order to increase the solution
grade prior to processing. The higher grade solution that is collected from areas that are newly
under leach is directed to the pregnant solution tank.
From the pregnant solution tank, the gold bearing solution is pumped to the adsorption plant,
which includes six ton carbon-in-columns (CIC), where the gold is recovered from the solution
by adsorption onto activated carbon. Solution flows by gravity from the first column to the last
www.rpacan.com
New Gold Inc. – Mesquite Mine, Project #2180
Technical Report NI 43-101 – February 28, 2014 Page 17-2
column. Solution discharging from the last column overflows to the barren tank where liquid
sodium cyanide, fresh water, liquid caustic and antiscalant are added, as necessary, to make
up fresh leach solution, which is returned to the leach pad for additional leaching of the ore.
The flowsheet is shown in Figure 17-1.
The activated carbon is advanced counter current to the solution flow in the CIC circuit. Loaded
carbon from the first column of the CIC circuit is transported to the desorption circuit located
at the existing gold plant via trailer (Figure 17-2).
At the gold plant, the activated carbon is washed with a dilute hydrochloric acid solution for
removal of inorganic contaminants and stripped in a traditional pressure Anglo American
Research Lab (AARL) strip circuit. Electrowinning cells are used to recover gold from the strip
solution. The sludge recovered from the electrowinning circuit is mixed with fluxes and melted
in an induction furnace to produce doré gold bars. After stripping, the carbon is thermally
regenerated in a carbon reactivation kiln for removal of organic contaminants. Following
stripping and regeneration, the carbon is loaded into a trailer and returned to the CIC columns
for re-use.
At the time of the site visit, WMMI was modifying the gold recovery plant to include an acetic
acid wash to remove mercury from the carbon.
Caustic soda, liquid sodium cyanide, antiscalant, hydrochloric acid, and lime are received in
bulk quantities and stored as required. Appropriate storage and containment facilities are
provided for all of the reagents and all acids are stored separately from all cyanide mixing and
distribution areas.
New Gold is a signatory to the International Cyanide Management Code. The Mesquite Mine
became certified in October 2011. The certification is scheduled for renewal in October 2014.
The processing circuits are designed to contain the water associated with normal precipitation
events. The storm water ponds are designed to contain the excess water from an extreme
event, such as a 24-hour, 100-year storm.
LEGEND:
PRIMARY PROCESS FLOW
SECONDARY PROCESS FLOW
INTERMITTENT / BYPASS PROCESS FLOW
BARREN
SOLUTION
PUMPS (3)
BARREN SOLUTION
CARBON
BOX
CARBON
SAFETY
SCREEN
CARBON
CARBON
CARBON TRANSPORT
TRUCK
PAD 6 EXPANSION
CARBON
CARBON
CARBON
PREGNANT SOLUTION POND
(EXISTING)
PREGNANT SOLUTION PUMP BOX
(EXISTING)
PREGNANT SOLUTION
PUMPS (2)
(EXISTING)
PREGNANT SOLUTION
PUMP BOX
PREGNANT
SOLUTION
PUMPS (2)
1
2
4
5
3
CARBON COLUMNS
BARREN SOLUTION
PUMP BOX
MAKE-UP WATER
607-FS-02
607-FS-02
607-FS-02
PAD 6PAD 5
February 2014 Source: New Gold Inc., 2009.
Mesquite Mine
Carbon CircuitProcess Flowsheet
New Gold Inc.
Imperial County, California, U.S.A.
Figure 71 -1
17-3
ww
w.rp
acan
.co
m
LEGEND:
PRIMARY PROCESS FLOW
SECONDARY PROCESS FLOW
INTERMITTENT / BYPASS PROCESS FLOW
SLUDGE
SLAG
DORE BAR
INDUCTION
FURNACE
607-FS-01
607-FS-01
607-FS-01
MAKE-UP WATER
BOILER
STRIP SOLUTION
TANK
STRIP SOLUTION
TRANSFER SUMP
ELECTROLYTE
FEED TANK
DESORPTION
VESSEL
CARBON REGENERATION
KILN
CARBON
HOPPER
CARBON FINES
STORAGE
FILTER PRESS
FEED PUMP
BARREN PUMP
(EXISTING)
BARREN SOLUTION PUMP
(EXISTING)
ELECTROWINING CELLSHEAT EXCHANGER
HEAT EXCHANGER
COOLING WATER
TO DRAIN
1 2
DESORPTION
VESSEL
FILTER PRESS
SUMP
DRAIN
TO NEW CARBON ABSORPTION PLANT
HEAT EXCHANGER
February 2014 Source: New Gold Inc., 2009.
Mesquite Mine
Adsorption PlantFlowsheetProcess
New Gold Inc.
Imperial County, California, U.S.A.
Figure 71 -2
17-4
ww
w.rp
acan
.co
m
www.rpacan.com
New Gold Inc. – Mesquite Mine, Project #2180
Technical Report NI 43-101 – February 28, 2014 Page 17-5
WATER SERVICES From the water wells, fresh water is pumped to the raw water tank, the barren solution tank or
the barren solution pond. From the raw water tank, it can be distributed to the potable water
system, the gland water tank, and the process water tank. Process water will be used for dust
suppression, for make-up water in the heap leaching circuit, as wash water for the carbon
screens, to mix strip solution and acid wash solution, and for carbon attrition. The wells
produce 3,000 gpm of fresh water which is sufficient to meet the needs of the operation.
www.rpacan.com
New Gold Inc. – Mesquite Mine, Project #2180
Technical Report NI 43-101 – February 28, 2014 Page 18-1
18 PROJECT INFRASTRUCTURE INFRASTRUCTURE ELECTRICAL POWER Electricity for the mine is provided through a 92 kV power line. Power is supplied to the site
by Imperial Irrigation District Power Company. Power is stepped down from 92 kV to 13.2 kV
on-site. All power distribution from this point onwards is distributed on equipment and
infrastructure owned by WMMI.
WATER Water for the project is supplied from the existing Vista well field located approximately two
miles south of California State Highway 78. The two current active wells are deemed capable
of supplying the water requirements for both WMMI and the LACSD. With the new 18 in.
diameter line in place, the two existing pumping systems are capable of supplying
approximately 3,000 gpm of fresh water to the operation which is sufficient to supply the mine
and the landfill.
HEAP LEACH PAD Leach Pad 7 and the infill between the leach pads has been designed by Tetra Tech with total
capacity of a nominal 99.4 million tons with an additional 32.5 million tons capacity remaining
on Pad 6. As of December 2013, there was remaining total capacity of a nominal 131.9 million
tons. This should be sufficient for the 127.7 million tons of mineral reserves.
www.rpacan.com
New Gold Inc. – Mesquite Mine, Project #2180
Technical Report NI 43-101 – February 28, 2014 Page 19-1
19 MARKET STUDIES AND CONTRACTS MARKETS The gold markets are mature global markets with reputable smelters and refiners located
throughout the world.
Gold is a principal metal traded at spot prices for immediate delivery. The market for gold
trading typically spans 24 hours a day within multiple locations around the world (such as New
York, London, Zurich, Sydney, Tokyo, Hong Kong, and Dubai). Daily prices are quoted on the
New York spot market and can be found on www.kitco.com. The average New York spot gold
price for 2013 was $1,411 per troy ounce. The New York price, as of December 31, 2013, was
$1,204 per troy ounce. The three-year and five-year rolling average prices through the end of
December 2013 are $1,549 and $1,369 per troy ounce, respectively. This Technical Report
uses $1,300 per troy ounce for the economic analysis, just less than the five-year rolling
average.
Operations at the Mesquite Mine are expected to produce a nominal 125,000 ounces of gold,
annually, over an estimated remaining mine life of ten years.
CONTRACTS Doré is shipped from site to major refineries including Metalor and Johnson Matthey. Contracts
are in place for refining with charges of a nominal $3.60 per ounce of gold with payment of
Technical Report NI 43-101 – February 28, 2014 Page 20-1
20 ENVIRONMENTAL STUDIES, PERMITTING, AND SOCIAL OR COMMUNITY IMPACT ENVIRONMENTAL STUDIES The Mesquite Mine received regulatory approval to begin mining operations on July 2, 2007,
after the issuance of the Air Quality permit from the Imperial County Air Pollution Control
District. WMMI is in compliance with all permits.
The Mesquite Mine is a mature mine from an environmental, permit and social perspective.
Modern day open pit mining and heap leach operations have dated back to the 1980s.
Through its ownership history (Gold Fields, Santa Fe Gold, Newmont and now New Gold) it
has had a very successful environmental track record and operating history. The
environmental staff is also “seasoned” and brings operating and compliance success(es) from
previous operations and employment. During the course of interviews with staff, no Notice of
Violation(s) (NOV’s) were reported and relationship(s) with nearby communities and agencies
were relayed as amicable and no adversarial relationships or issues appeared to be present.
The closure and reclamation plan for the Mesquite Mine has been developed by WMMI with
the assistance of independent consultants with the specific objective of leaving the land in a
useful, safe, and stable configuration capable of supporting native plant life, providing wildlife
habitat, maintaining watershed functions, and supporting limited livestock grazing. Total
closure costs are estimated to be $16.3 million.
PROJECT PERMITTING New Gold is performing environmental baseline monitoring to document compliance with
existing operations and to support future permitting efforts associated with Brownie Pit and
Heap Leach facility expansion (Slot Heap/Pad #7). No environmental issues were reported
that would adversely impact permitting of these efforts.
New Gold and its predecessors have developed plans and obtained federal, state and local
approval(s) for waste and tailings disposal, site monitoring, and water management both during
operations and post mine closure.
www.rpacan.com
New Gold Inc. – Mesquite Mine, Project #2180 Technical Report NI 43-101 – February 28, 2014 Page 20-2
In addition, they are International Cyanide Code “Certified” through the development and
implementation of a Cyanide Management Plan (and training). The Cyanide Code is a
voluntary program designed to assist the global gold mining industry and the producers and
transporters of cyanide used in gold mining in improving cyanide management practices, and
to publicly demonstrate their compliance with the Cyanide Code through an independent and
transparent process. The Cyanide Code is intended to reduce the potential exposure of
workers and communities to harmful concentrations of cyanide‚ to limit releases of cyanide to
the environment‚ and to enhance response actions in the event of an exposure or release.
They will require recertification audit/verification in October 2014.
New Gold has obtained permits and authorizations from federal, state and local agencies to
operate current facilities and activities. Table 20-1 provides a current list of the permits and
plans they are and/or have operated under. They report that they are in compliance with
issued permits and that there have been no notices of violations issued by agencies in the past
year.
SOCIAL OR COMMUNITY REQUIREMENTS New Gold reports excellent working relationships with regulatory agencies and the public.
They are pursuing Slot Heap/Pad #7 with the agencies and do not anticipate any adverse
reactions or delays with this proposed activity.
On a separate matter, New Gold is proceeding with permitting the expansion of the Brownie
Pit. In doing so, they will have to evaluate the impact(s) of the California Backfill Law (14 CCR
Section 3704). The Brownie pit has a small area of approximately 10 acres that falls outside
the Surface Disturbance Boundary. At this time New Gold management indicates that they
are looking into the cost of compliance with this Law, and are working with local agencies to
determine if the area is “grandfathered” under the current Law as its area that is already
disturbed on three sides.
www.rpacan.com
New Gold Inc. – Mesquite Mine, Project #2180 Technical Report NI 43-101 – February 28, 2014 Page 20-3
TABLE 20-1 PERMIT LIST New Gold Inc. – Mesquite Mine
Name Agency (Authority) Permit Number Approval Date Expiration/Renewal Date
1601 Streambed Alteration Agreement CDFG letter California Department of Fish & Game 6‐097‐00 25‐May‐11 na
1601 Streambed Alteration Notification California Department of Fish & Game 6‐097‐00 30‐Sept‐10 year 2020
1601 Streambed Alteration Permit California Department of Fish & Game 6‐097‐00 18‐Feb‐03 year 2020
1603 Streambel Alteration Permit California Department of Fish & Game 5‐373‐96 19‐Dec‐96
2081 Incidental Take Permit California Department of Fish & Game 2081‐2003‐011‐06 12‐Aug‐03 year 2020
Air Quality Permit Receipt 2012 Imperial County Air Pollution Control District varies n/a Annual 31‐Dec‐12
Air Quality Permits Receipt 2011 Imperial County Air Pollution Control District All AQ Permits 7‐Jan‐2011 31‐Dec‐2011
AQ 3937 Permit Receipt Imperial County Air Pollution Control District 3937 receipts 2010
AQ Permit 1920C historic Imperial County Air Pollution Control District 1920C 2‐Mar‐92 superceeded
AQ Permit 1920C‐1 Imperial County Air Pollution Control District 1920C‐1 2‐July‐07 Annual Fee‐ DEC
AQ Permit 1920C‐2 Imperial County Air Pollution Controll District 1920C‐2 7‐Aug‐2013 Annual Fee ‐ DEC
AQ Permit 2613 soil remediation Imperial County Air Pollution Control District 2613 12‐Jul‐96 31‐Dec‐03
AQ Permit 2613 Imperial County Air Pollution Control District 2613 12‐Jul‐96 31‐Dec‐03
AQ Permit 3710 Imperial County Air Pollution Control District 3710 1‐May‐07 Annual Fee‐ DEC
AQ Permit 3854 Imperial County Air Pollution Control District 3854 27‐Sept‐10 Annual Fee‐ DEC
AQ Permit 3937 Imperial County Air Pollution Control District 3937 10‐Jul‐09 Annual Fee‐ DEC
AQ Permit 4005 Imperial County Air Pollution Control District 4005 27‐Oct‐10 Annual Fee‐ DEC
AQ Permit 4005A Modification letter Imperial County Air Pollution Control District 4005 Nov‐17‐11 na
AQ Permit 4005A Imperial County Air Pollution Control District 4005A Apr‐08‐11 Annually Dec
AQ Permit 4005A‐1 Imperial County Air Pollution Control District 4005A‐1 9‐Jan‐12 Annual Fee‐ DEC
AQ Permit 4005A2 Imperial County Air Pollution Control District 4005 A2 24‐Apr‐13 Annual Fee‐ DEC
AQ Permit 4006A Imperial County Air Pollution Control District 4006A 8‐June‐11 Annual Fee‐ DEC
AQ Permit 4187 Imperial County Air Pollution Control District 4187 12‐Apr‐12 na
AQ Permit 4204 (Draft NAD Permit) Imperial County Air Pollution Control District 4204 DRAFT 4204 DRAFT
AQ Permit 4204 (NAD Rainbow Butress) Imperial County Air Pollution Control District 4204 30‐May‐12 27‐Oct‐12
AQ Temporary Permit 4328 Imperial County Air Pollution Control District 4328 9‐Sep‐13 na
Biological Opinion (Ammendment) US Fish & Wildlife Service 1‐6‐92‐F‐22 22‐Apr‐1994 na
Biological Opinion (Minor Modification) US Fish & Wildlife Service 1‐6‐92‐F‐22 6‐Jul‐1992 na
Biological Opinion 1‐6‐92‐F‐28 US Fish & Wildlife Service 1‐6‐92‐F‐28 1‐Jun‐1992 na
Biological Opinion 1‐6‐98‐F‐39 US Fish & Wildlife Service 1‐6‐98‐F‐39 7‐Jul‐1998 na
Biological Opinion US Fish & Wildlife Service 1‐6‐92‐F‐22R3 10‐Aug‐01
Biological Opinion US Fish & Wildlife Servies 1‐6‐92‐F‐22 26‐Mar‐1992 na
Bioremediation Site Operating Plan Santa Fe Pacific Gold Corporation na Feb‐96 na
Business License 2013 Imperial County 250 3‐Jun‐13 22‐Feb‐14
California Cyanide Management Plan Bureau of Land Management na 3‐Apr‐92 na
Conditional Use Permit Imperial County Planning and Building Development Services 09‐0020 5‐Oct‐10 5‐Oct‐2030
CUPA Certificate 2007 California Department of Toxic Substances Control EPA ID# CAD109163071 1‐Jan‐2007 31‐Dec‐2007
CUPA Certificate 2009 California Department of Toxic Substances Control EPA ID# CAD109163071 Jan‐1‐2009 31‐Dec‐2009
CUPA Certificate 2010 California Department of Toxic Substances Control EPA ID#CAD109163071 1‐Jan‐2010 31‐Dec‐2010
CUPA Certificate 2011 California Department of Toxic Substances Control EPA ID#CAD109163071 01‐Jan‐11 Annual fee 31‐Dec‐2011
Encroachment Permit ‐ Transfer of Mesquite Mine Permits California Department of Transportation 11‐92‐6AD‐1139 & 11‐91‐6RP0377 & 141‐91‐6RP0376 17‐Feb‐93 closed file
Encroachment Permit access road California Department of Transportation 11‐91‐6RP0377 30‐Apr‐91 closed file
Encroachment Permit Kiosk California Department of Transportation 11‐92‐6AD1139 24‐Nov‐92 na
Encroachment Permit Route 78 Imperial County 6173‐88 9‐May‐88 na
Encroachment Permit Zappone Road Imperial County 6172‐88 9‐May‐88 na
Encroachments historical completed California Department of Transportation varies 25‐Jul‐88 na
EPA Notifications‐ historic US Environmental Protection Agency ID# CAD109163071 na na
Explosives Permit Bureau of Alcohol, Toboacco and Firearms 9‐CA‐025‐3J‐01263 22‐Aug‐07 1‐Sept‐13
Grant Deed LACSD Los Angeles County Sanitation District na 25‐Jun‐93 na
Hazardous Waste Generator CUPA Certificate California Department of Toxic Substances Control EPA ID# CAD109163071 01‐Jan‐12 Annaul fee 31‐Dec‐12
Heliport Permit California Department of Transportation Imp‐3(H) 8‐Feb‐95 na
Letter Nonhaz Petroleum Contaminated Soil Imperial County Public Health Department na 10‐Jul‐96 na
Memo 10‐Apr‐1992 Bureau of Land Management 1‐6‐96‐F‐22 na na
Memo 21‐July‐1992 Bureau of Land Management 1‐6‐92‐F‐22 na na
Mineral Lease and Landfill Facilities Lease Agreement Los Angeles County Sanitation District na na
MSHA Identity Report 1995 Mine Saferty Health Administration Mine ID# 04‐04614 1‐Jan‐95 na
MSHA Identity Report 2003 Mine Safety Health Administation Mine ID #04‐04614 11‐Jul‐03 na
MSHA Identity Report Mine Safety Health Administration Mine ID#04‐04614 27‐Sep‐10 na
NPDES General Permit‐ historic WDID 713S012061 California Regional Water Quality Control Board WDID 713S012061 26‐Dec‐95 superceeded
NPDES General Permit California Regional Water Quality Control Board WDID 713I018532 22‐Dec‐03
Pesticide Use Permit Imperial County Office of Agriculture 13‐05‐131465N 30‐June‐2004 30‐June‐2005
Plan of Operations‐ Expansion Bureau of Land Management na 23‐Nov‐98 na
PTO Air Pressure Tank Ca. Dept. of Occupational Safety & Health LO5509‐68 19‐Jan‐11 18‐Jan‐16
PTO Liquefied Petroleum Gas Tank Ca. Dept. of Occupational Safety & Health A012306‐11 20‐Jan‐11 19‐Jan‐13
PTO Steam Boiler (2) Ca. Dept. of Occupational Safety & Health B028433‐04 18‐Jan‐12 17‐Jan‐13
PTO Steam Boiler Ca. Dept. of Occupational Safety & Health B028433‐04 19‐Jan‐11 19‐Jan‐12
Public Water System Permit Imperial County Public Health Dept. Division of Environmental Health 1300643 24‐Jan‐12 na
Public Water System Renewal Permit 2013 Imperial County Public Health Department PT0005483 WA0000045 01‐Jan‐2013 Annual Renweal 31‐Dec‐13
Public Water System Renewal Permit Imperial County Public Health Department PT0005483 1‐Jan‐10 Annual Renewal 31‐Dec‐11
Public Water System Renwal Permit Imperial County Public Health Department PT0005483 WA0000045 01‐Jan‐12 Annual Renewal 31‐Dec‐12
Radio Station Authorization Federal Communications Commission varies varies varies
Radio Station Authorizations‐ Historic Federal Communications Commission varies varies varies
Reclamation Permit 23‐84 California Office of Mine Reclamation 23‐84 22‐Apr‐85 na
Reclamation Permit 98‐0004 California Office of Mine Reclamation 98‐0004 Oct‐01 na
Reclamation Plan Appendix B California Office of Mine Reclamation na Final Oct‐ 01 na
Reclamtion Permit 28‐88 California Office of Mine Reclamation 28‐88 5‐Feb‐88 na
Record Of Decision ‐ Mesquite Expansion Bureau of Land Management 98121054 16‐Jul‐02 na
Record of Decision ‐ VCR Project Bureau Of Land Management CAMC 109887/121229 4‐Nov‐1987 na
ROW Amendment‐ Waterline Bureau of Land Management CA‐19129 25‐Jun‐07 na
ROW IID Distribution Line Bureau of Land Management CA‐17187 25‐May‐85 na
ROW Utility Corridor Bureau of Land Management CA‐19129 12‐Sep‐86 Annual Rental Fee 1‐Jan
Septic Permit 6212 Imperial County Public Health Department varies xx
SMARA Ordinance TITLE9Div20_2008 Imperial County Planning and Building Development Services na 2008 na
Solid Waste Exemption Imperial County Public Health Department 13‐AA0025 1‐Jul‐99 (original 10‐Oct‐84) facility closed, no longer used
State Lease for Mineral Extraction California State Lands Commission PRC 8039.2 1‐Oct‐12 30‐Sep‐22
Used Oil Tank Project California Department of Toxic Substances Control na 1993 na
Waste Dischagre Permit 95‐016 Leach Pad Expansion Approval California Regional Water Quality Control Board 95‐016 WDID 7A132140003 2007‐2008 na
Waste Discharge Permit 93‐043 California Regional Water Quality Control Board 93‐043 WDID 7A132222001 17‐Nov‐93 facility closed, no longer used
Waste Discharge Permit 95‐016 Monitoring Program California Regional Water Quality Control Board 95‐016 WDID 7A132140003 30‐Dec‐98
Waste Discharge Permit 95‐016 Vista Pad Closure California Regional Water Quality Control Board 95‐016 WDID 7A132140003 11‐May‐07 na
Waste Discharge permit 95‐016 California Regional Water Quality Control Board 95‐016 WDID 7A132140003 29‐Mar‐95
www.rpacan.com
New Gold Inc. – Mesquite Mine, Project #2180 Technical Report NI 43-101 – February 28, 2014 Page 20-4
MINE CLOSURE REQUIREMENTS Reclamation plans have been developed by New Gold and approved by the applicable
regulatory agencies. In general, these plans call for the heap rinsing, removal of structures,
grading of surface(s), application of growth medium and revegetation. The intent is to provide
for a beneficial post mining land use.
New Gold has retained the company of Robinson Engineering (Robinson) to calculate the
internal and bond level reclamation cost estimates for Mesquite. The current estimate for Life
of Mine (currently permitted) reclamation is $15,366,929 ($US Dollars). At the same time, New
Gold currently maintains seven separate Bonds totaling $14,342,870 to guarantee that
proposed and approved reclamation activities will be performed. These include:
- 1983 Mesquite Reclamation (Rec. Plan 23-84/Bond # 1000839415) = $1,468,000 - 1988 Vista Reclamation (Rec. Plan 28-88/Bond # 1000839414) = $1,218,200 - 1998 Expansion Reclamation (Rec. Plan 98-0004/Bond # 1000839410) = $2,304,489 - Regional Water Board Closure Bond (Bond # 1000839417) = $550,000 - BLM Closure Bond (Bond # 1000839411) = $8,690,398 - Lease Compliance Bond (Bond # 1000839413) = $50,000 - Big Chief Tension Crack Bond on State Lands (Bond # 1000839416) = $61,783
Robinson has recommended that Bond # 1000839410 be increased by $207,797 and Bond #
1000839411 be increased by $234,255 to match their closure commitments.
These numbers are developed by a third party and are considered reasonable estimates for
an independent party to perform reclamation and closure activities.
www.rpacan.com
New Gold Inc. – Mesquite Mine, Project #2180
Technical Report NI 43-101 – February 28, 2014 Page 21-1
21 CAPITAL AND OPERATING COSTS CAPITAL COSTS
SUSTAINING CAPITAL COSTS Capital costs for the Mesquite Mine are based on continued operation and include equipment
replacement, leach pad development costs, and other minor expenditures to maintain
operations. Capital costs total $130.7 million over the life of mine and average a nominal $16
million per year. The capital cost estimate is presented in Table 21-1.
TABLE 21-1 LOM CAPITAL COSTS New Gold Inc. – Mesquite Mine
REFINING COSTS Contracts are in place for refining with charges of a nominal $3.60 per ounce of gold.
www.rpacan.com
New Gold Inc. – Mesquite Mine, Project #2180
Technical Report NI 43-101 – February 28, 2014 Page 22-1
22 ECONOMIC ANALYSIS Under NI 43-101 rules, producing issuers may exclude the information required for Item 22 –
Economic Analysis, on properties currently in production, unless the Technical Report includes
a material expansion of current production. RPA notes that New Gold is a producing issuer,
the Mesquite Mine is currently in production, and a material expansion is not included in the
current Life-of-Mine plans. RPA has performed an economic analysis of the Mesquite Mine
using the estimates presented in this report and confirms that the outcome is a positive cash
flow that supports the statement of Mineral Reserves.
www.rpacan.com
New Gold Inc. – Mesquite Mine, Project #2180
Technical Report NI 43-101 – February 28, 2014 Page 23-1
23 ADJACENT PROPERTIES Several properties have been mined within a mineralized belt running between the Chocolate
Mountains to the north and the southern slopes of the Cargo Muchacho Mountains to the
south. The belt extends from the Mesquite Mine to about 20 mi to the southeast. Properties
that have been mined include the Picacho Mine and the American Girl Mine. The Imperial
Project is located about 10 mi to the southeast from the Mesquite Mine.
On a larger scale the mineralized belt is thought to continue south into northern Mexico.
Newmont is a joint venture partner with Penoles on La Herradura Mine located 250 mi
southeast of Mesquite in Northern Mexico.
RPA has not verified the information presented here on the adjacent properties. Information
regarding mineralization at adjacent properties is not necessarily indicative of mineralization
at Mesquite.
www.rpacan.com
New Gold Inc. – Mesquite Mine, Project #2180
Technical Report NI 43-101 – February 28, 2014 Page 24-1
24 OTHER RELEVANT DATA AND INFORMATION No additional information or explanation is necessary to make this Technical Report
understandable and not misleading.
www.rpacan.com
New Gold Inc. – Mesquite Mine, Project #2180
Technical Report NI 43-101 – February 28, 2014 Page 25-1
25 INTERPRETATION AND CONCLUSIONS ADEQUACY OF PROCEDURES RPA and various other firms and independent consultants have reviewed the methods and
procedures utilized by New Gold, WGI, Newmont, Santa Fe, and Gold Fields at the Mesquite
Mine to gather geological, geotechnical, and assaying information and found them reasonable
and meeting generally accepted industry standards for an operating property.
ADEQUACY OF DATA RPA is of the opinion that the Mesquite Mine has conducted exploration and development
sampling and analysis programs using standard practices, providing generally reasonable
results. In RPA’s opinion, the resulting data can effectively be used in the subsequent
estimation of resources and reserves.
ADEQUACY OF STUDY This Technical Report is based on the operating data over the past six years for the Mesquite
Mine. RPA is of the opinion that this data and the supporting documents were prepared using
standard industry practices and provide reasonable results and conclusions.
COMPLIANCE WITH CANADIAN DEFINITION STANDARDS RPA is of the opinion that the current drill hole database is sufficient for generating a resource
model for use in resource and reserve estimation. Recovery and cost estimates are based
upon sufficient data and engineering to support a reserve statement. Economic analysis using
these estimates generates a positive cash flow, which supports a reserve statement.
Measured and Indicated Resources for all areas, inclusive of Mineral Reserves, are 313 million
metric tonnes grading 0.49 g/t Au for 4.90 million contained troy ounces of gold. Inferred
Resources are an additional 17.5 million metric tonnes grading 0.42 g/t Au. The estimated
Proven and Probable Mineral Reserves for the Mesquite Mine total 115.9 million metric tonnes
grading 0.60 g/t Au, containing 2.24 million ounces of gold.
In RPA’s opinion, the resource and reserve estimates have been created utilizing acceptable
methodologies. RPA is also of the opinion that the classification of Measured and Indicated
Resources, stated in Table 14-1, and Proven and Probable Reserves, stated in Table 15-1,
meet the CIM definitions.
www.rpacan.com
New Gold Inc. – Mesquite Mine, Project #2180
Technical Report NI 43-101 – February 28, 2014 Page 26-1
26 RECOMMENDATIONS RPA offers the following recommendations:
1. Continue operating the Mesquite Mine. Annual operating costs are a nominal $100 million per year.
2. Bulk densities have been based on historic data due to a lack of bulk density data present in the sample database. RPA recommends that New Gold review the tonnage factors currently being used.
3. Continue to monitor the heap leach pad recoveries and evaluate whether there is
a correlation between grade and recovery. This is an ongoing process included in the mine operating budget; no additional costs are anticipated.
www.rpacan.com
New Gold Inc. – Mesquite Mine, Project #2180
Technical Report NI 43-101 – February 28, 2014 Page 27-1
27 REFERENCES Bechtel Civil and Minerals, 1984: Mesquite Project Feasibility Study, prepared for Gold Fields
Operating Co. BGC Engineering Inc., 2013(a): Annual Geotechnical Review, prepared for New Gold Inc.,
September 18, 2013. BGC Engineering, Inc., 2013(b): Rainbow Pit – East Wall Stability and Impact on Highway 78,
prepared for New Gold Inc., September 20, 2013. Della Libera, M., et al., 2011: Mesquite Sulfide Project, 2010 Annual Report, February 28,
2011. Engineering Analytics, Inc., 2009: Stope Stability Analyses of the East Rainbow Pit Expansion,
March 2009. Haxel, G.B., and Dillon, J.T., 1978: The Pelona-Orocopia Schist and the Vincent-Chocolate
Mountain Thrust System, Southern California, in D.G. Howell and K.A. MacDougall, Mesozoic Paleogeography of the Western United States, SEPM Pacific Coast Paleogeography Symposium 2, pp. 453-469.
Independent Mining Consultants Inc., 2009: Mineral Resources and Mineral Reserves
Verification, Letter Report, March 30, 2009. Independent Mining Consultants Inc., 2006: Mesquite Gold Project Imperial County, California,
USA, Technical Report, May 26, 2006. Longton, C.M., 2011: Internal memo regarding interpretation of lithology in Mesquite Mine,
May 11, 2011. Longton, C.M., 2011: Internal memo regarding “Mesquite Geology” , February 4, 2011. Manske, S.L., 1991: Epithermal Gold Mineralization in Gneissic Rocks of the Mesquite District,
Imperial County, California, Ph.D. Dissertation at Stanford University. Micon International Limited, 2006: Technical Report on the Mesquite Mine Expansion,
Feasibility Study, Imperial County, California, by R.M. Gowans and M.G. Hester, prepared for Western Goldfields, Inc., August 6, 2006.
Nicklaus Engineering Inc., 2013: Geotechnical Design Report State Highway 78 Repair at
Mesquite Mine, prepared for New Gold Inc., July 26, 2013. Scott Wilson RPA, 2010: Technical Report on the Mesquite Mine, Brawley, California, USA,
by R.J. Lambert, W.W. Valliant and H. Krutzelmann, prepared for New Gold Inc., February 26, 2010.
Smith et al., 1999: Regional Geology, Internal Report to Newmont Mining Corporation.
www.rpacan.com
New Gold Inc. – Mesquite Mine, Project #2180
Technical Report NI 43-101 – February 28, 2014 Page 27-2
Western Mesquite Mines, Inc., 2013, Monthly Operations Report, December 2013. WWMI, 2013, Pad Recon – Monthly Rpt (Oct 13), Excel Worksheet, October 2013.
www.rpacan.com
New Gold Inc. – Mesquite Mine, Project #2180
Technical Report NI 43-101 – February 28, 2014 Page 28-1
28 DATE AND SIGNATURE PAGE This report titled “Technical Report on the Mesquite Mine, Imperial County, California, U.S.A.”
and dated February 28, 2014, was prepared and signed by the following authors:
(Signed & Sealed) “Richard J. Lambert” Dated at Toronto, ON February 28, 2014 Richard J. Lambert, P.E. Principal Mining Engineer (Signed & Sealed) “Wayne W. Valliant” Dated at Toronto, ON February 28, 2014 Wayne W. Valliant, P.Geo. Principal Geologist (Signed & Sealed) “Kathleen A. Altman” Dated at Toronto, ON February 28, 2014 Kathleen A. Altman, Ph.D., P.E. Principal Metallurgist
www.rpacan.com
New Gold Inc. – Mesquite Mine, Project #2180
Technical Report NI 43-101 – February 28, 2014 Page 29-1
29 CERTIFICATE OF QUALIFIED PERSON RICHARD J. LAMBERT I, Richard J. Lambert, P.E., as an author of this report titled “Technical Report on the Mesquite Mine, Imperial County, California, U.S.A.” prepared for New Gold Inc., and dated February 28, 2014, do hereby certify that:
1. I am Principal Mining Consultant with Roscoe Postle Associates Inc. of Suite 505, 143 Union Boulevard, Lakewood, CO, USA 80227.
2. I am a graduate of Mackay School of Mines, University of Nevada, Reno, U.S.A., with
a Bachelors of Science degree in Mining Engineering in 1980, and Boise State University, with a Masters of Business Administration degree in 1995.
3. I am a Registered Professional Engineer in the state of Wyoming (#4857), the state of
Idaho (#6069), and the state of Montana (#11475). I am licensed as a Professional Engineer in the Province of Ontario (Reg. #100139998). I have been a member of the Society for Mining, Metallurgy, and Exploration (SME) since 1975, and a Registered Member (RM#1825610) since May 2006. I have worked as a mining engineer for a total of 33 years since my graduation. My relevant experience for the purpose of the Technical Report is: • Review and report as a consultant on numerous mining projects for due diligence
and regulatory requirements • Mine engineering, mine management, mine operations and mine financial
analyses, involving copper, gold, silver, nickel, cobalt, uranium, oil shale, phosphates, coal and base metals located in the United States, Canada, Zambia, Madagascar, Turkey, Bolivia, Chile, Brazil, Serbia, Australia, Russia and Venezuela.
4. I have read the definition of "qualified person" set out in National Instrument 43-101 (NI
43-101) and certify that by reason of my education, affiliation with a professional association (as defined in NI 43-101) and past relevant work experience, I fulfill the requirements to be a "qualified person" for the purposes of NI 43-101.
5. I visited the Mesquite Mine from November 6-7, 2013 and previously on July 22-23, 2009.
6. I am responsible for the preparation of Sections 15, 16, 19 to 22, and 24 and collaborated with my co-authors on Sections 1, 2, 3, 6, 25, and 26 of the Technical Report.
7. I am independent of the Issuer applying the test set out in Section 1.5 of NI 43-101.
8. I prepared a previous Technical Report on the Mesquite Mine dated February 26, 2010.
9. I have read NI 43-101, and the Technical Report has been prepared in compliance with NI 43-101 and Form 43-101F1.
www.rpacan.com
New Gold Inc. – Mesquite Mine, Project #2180
Technical Report NI 43-101 – February 28, 2014 Page 29-2
10. At the effective date of the Technical Report, to the best of my knowledge, information, and belief, the Technical Report contains all scientific and technical information that is required to be disclosed to make the Technical Report not misleading.
Dated this 28th day of February 2014 (Signed & Sealed) “Richard J. Lambert” Richard J. Lambert, P.E.
www.rpacan.com
New Gold Inc. – Mesquite Mine, Project #2180
Technical Report NI 43-101 – February 28, 2014 Page 29-3
WAYNE W. VALLIANT I, Wayne W. Valliant, P.Geo., as an author of this report titled “Technical Report on the Mesquite Mine, Imperial County, California, U.S.A.” prepared for New Gold Inc., and dated February 28, 2014, do hereby certify that:
1. I am Principal Geologist with Roscoe Postle Associates Inc. of Suite 501, 55 University Ave Toronto, ON, M5J 2H7.
2. I am a graduate of Carleton University, Ottawa, Ontario, Canada in 1973 with a
Bachelor of Science degree in Geology.
3. I am registered as a Geologist in the Province of Ontario (Reg. #1175). I have worked as a geologist for a total of 40 years since my graduation. My relevant experience for the purpose of the Technical Report is: • Review and report as a consultant on more than fifty mining operations and
projects around the world for due diligence and resource/reserve estimation • General Manager of Technical Services for corporation with operations and mine
development projects in Canada and Latin America • Superintendent of Technical Services at three mines in Canada and Mexico • Chief Geologist at three Canadian mines, including two gold mines
4. I have read the definition of "qualified person" set out in National Instrument 43-101 (NI
43-101) and certify that by reason of my education, affiliation with a professional association (as defined in NI 43-101) and past relevant work experience, I fulfill the requirements to be a "qualified person" for the purposes of NI 43-101.
5. I visited the Mesquite Mine on November 6-7, 2013, and previously on July 22-23, 2009.
6. I am responsible for Sections 4-12, and 14 and share responsibility for Sections 1, 2, 25, and 26 of the Technical Report.
7. I am independent of the Issuer applying the test set out in Section 1.5 of NI 43-101.
8. I prepared a previous Technical Report on the Mesquite Mine dated February 26, 2010.
9. I have read NI 43-101, and the Technical Report has been prepared in compliance with NI 43-101 and Form 43-101F1.
10. At the effective date of the Technical Report, to the best of my knowledge, information, and belief, the Technical Report contains all scientific and technical information that is required to be disclosed to make the Technical Report not misleading.
Dated this 28th day of February 2014 (Signed & Sealed) “Wayne W. Valliant” Wayne W. Valliant, P. Geo.
www.rpacan.com
New Gold Inc. – Mesquite Mine, Project #2180 Technical Report NI 43-101 – February 28, 2014 Page 29-4
KATHLEEN ANN ALTMAN I Kathleen Ann Altman, P.E., as an author of this report titled “Technical Report on the Mesquite Mine, Imperial County, California, U.S.A.” prepared for New Gold Inc., and dated February 28, 2014, do hereby certify that:
1. I am Principal Metallurgist with RPA (USA) Ltd. of Suite 505, 143 Union Boulevard,Lakewood, Co., USA 80228.
2. I am a graduate of the Colorado School of Mines in 1980 with a B.S. in MetallurgicalEngineering. I am a graduate of the University of Nevada, Reno Mackay School of Mineswith an M.S. in Metallurgical Engineering in 1994 and a Ph.D. in Metallurgical Engineeringin 1999.
3. I am registered as a Professional Engineer in the State of Colorado (Reg. #37556) and aQualified Professional Member of the Mining and Metallurgical Society of America(Member #01321QP). I have worked as a metallurgical engineer for a total of 33 yearssince my graduation. My relevant experience for the purpose of the Technical Report is:• Review and report as a metallurgical consultant on numerous mining operations and
projects around the world for due diligence and regulatory requirements.• I have worked for operating companies, including the Climax Molybdenum Company,
Barrick Goldstrike, and FMC Gold in a series of positions of increasing responsibility.• I have worked as a consulting engineer on mining projects for approximately 15 years
in roles such a process engineer, process manager, project engineer, area manager,study manager, and project manager. Projects have included scoping, prefeasibilityand feasibility studies, basic engineering, detailed engineering and start-up andcommissioning of new projects.
• I was the Newmont Professor for Extractive Mineral Process Engineering in the MiningEngineering Department of the Mackay School of Earth Sciences and Engineering atthe University of Nevada, Reno from 2005 to 2009.
4. I have read the definition of "qualified person" set out in National Instrument 43-101 (NI 43-101) and certify that by reason of my education, affiliation with a professional association(as defined in NI 43-101) and past relevant work experience, I fulfill the requirements to bea "qualified person" for the purposes of NI 43-101.
5. I did not visit the Mesquite Mine.
6. I am responsible for Sections 13 and 17 and share responsibility for Sections 1, 18, 20, 21,24, 25, and 26 of the Technical Report.
7. I am independent of the Issuer applying the test set out in Section 1.5 of NI 43-101.
8. I have had no prior involvement with the property that is the subject of the Technical Report.
9. I have read NI 43-101, and the Technical Report has been prepared in compliance with NI43-101 and Form 43-101F1.
www.rpacan.com
New Gold Inc. – Mesquite Mine, Project #2180 Technical Report NI 43-101 – February 28, 2014 Page 29-5
10. At the effective date of the Technical Report, to the best of my knowledge, information, andbelief, the Technical Report contains all scientific and technical information that is requiredto be disclosed to make the Technical Report not misleading.