Supplemental Information Molecular Cell, Volume 43 The Initiation Factor TFE and the Elongation Factor Spt4/5 Compete for Binding to the RNAP Clamp during Transcription Initiation and Elongation Dina Grohmann, Julia Nagy, Anirban Chakraborty, Daniel Klose, Daniel Fielden, Richard H. Ebright, Jens Michaelis, and Finn Werner Figure S1. Homology Model of M. jannaschii TFE (A and B) Structural alignment of the models (coloured in green) of the M. jannaschii TFE WH- (A) and ZR-domains (B) with the structures (coloured in grey) of the S. solfataricus WH- (pdb 1Q1H, A) and the H. sapiens TFIIE alpha ZR-domains (1VD4, B). Structural alignments were made using VMD (Humphrey et al., 1996). The Zn-ion is highlighted as yellow sphere.
Transcript
Supplemental Information Molecular Cell, Volume 43
The Initiation Factor TFE and the Elongation Factor Spt4/5
Compete for Binding to the RNAP Clamp during Transcription
Initiation and Elongation
Dina Grohmann, Julia Nagy, Anirban Chakraborty, Daniel Klose,
Daniel Fielden, Richard H. Ebright, Jens Michaelis, and Finn Werner
Figure S1. Homology Model of M. jannaschii TFE (A and B) Structural alignment of the models (coloured in green) of the M.
jannaschii TFE WH- (A) and ZR-domains (B) with the structures (coloured in
grey) of the S. solfataricus WH- (pdb 1Q1H, A) and the H. sapiens TFIIE
alpha ZR-domains (1VD4, B). Structural alignments were made using VMD
(Humphrey et al., 1996). The Zn-ion is highlighted as yellow sphere.
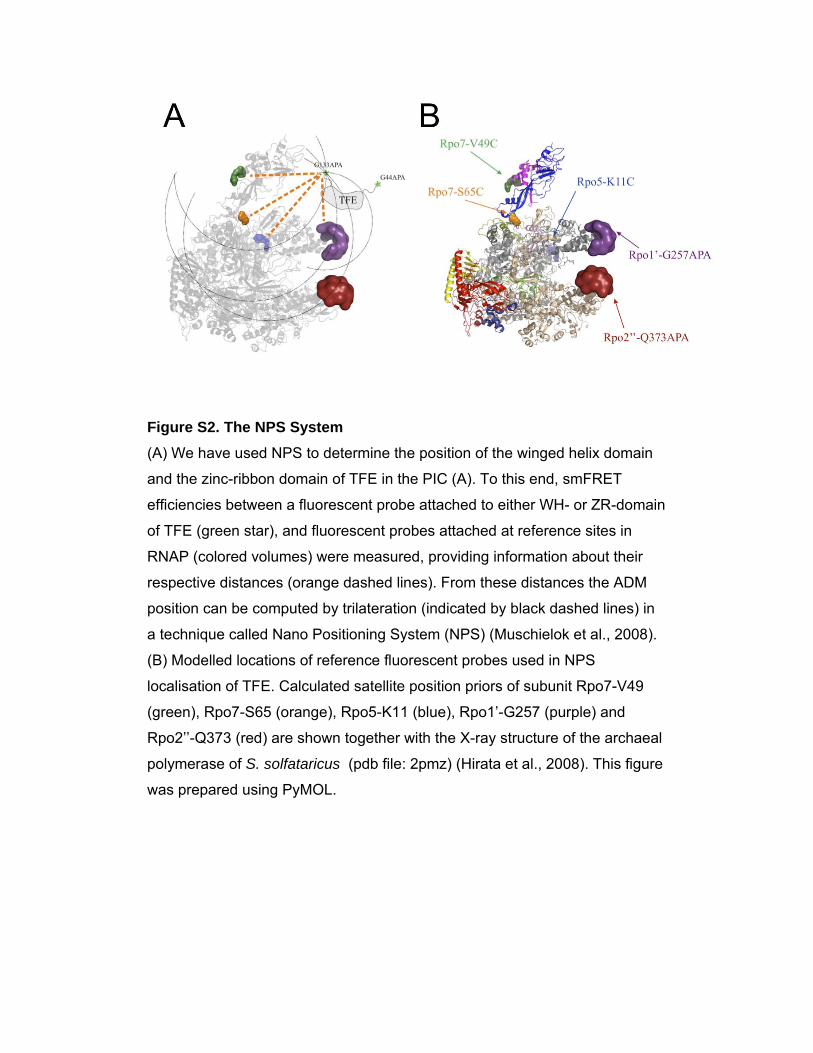
Figure S2. The NPS System (A) We have used NPS to determine the position of the winged helix domain
and the zinc-ribbon domain of TFE in the PIC (A). To this end, smFRET
efficiencies between a fluorescent probe attached to either WH- or ZR-domain
of TFE (green star), and fluorescent probes attached at reference sites in
RNAP (colored volumes) were measured, providing information about their
respective distances (orange dashed lines). From these distances the ADM
position can be computed by trilateration (indicated by black dashed lines) in
a technique called Nano Positioning System (NPS) (Muschielok et al., 2008).
(B) Modelled locations of reference fluorescent probes used in NPS
localisation of TFE. Calculated satellite position priors of subunit Rpo7-V49
(green), Rpo7-S65 (orange), Rpo5-K11 (blue), Rpo1’-G257 (purple) and
Rpo2’’-Q373 (red) are shown together with the X-ray structure of the archaeal
polymerase of S. solfataricus (pdb file: 2pmz) (Hirata et al., 2008). This figure
was prepared using PyMOL.
Figure S3. Complete Histograms of the Measured FRET Pairs Used to Determine the Position of the Winged Helix Domain (A-D) and the Zinc-Ribbon Domain (E-H) of TFE Shown are the frame-wise histograms of (A) TFEG44 – Rpo7-V49; (B) TFEG44
TFEG133 – Rpo1’-G257. The histograms where fitted with a double (A-C, F) or
single (D-E, G-H) Gaussian distribution indicated by the blue lines (all results
of the fits are summarized in Table S1 and S2).
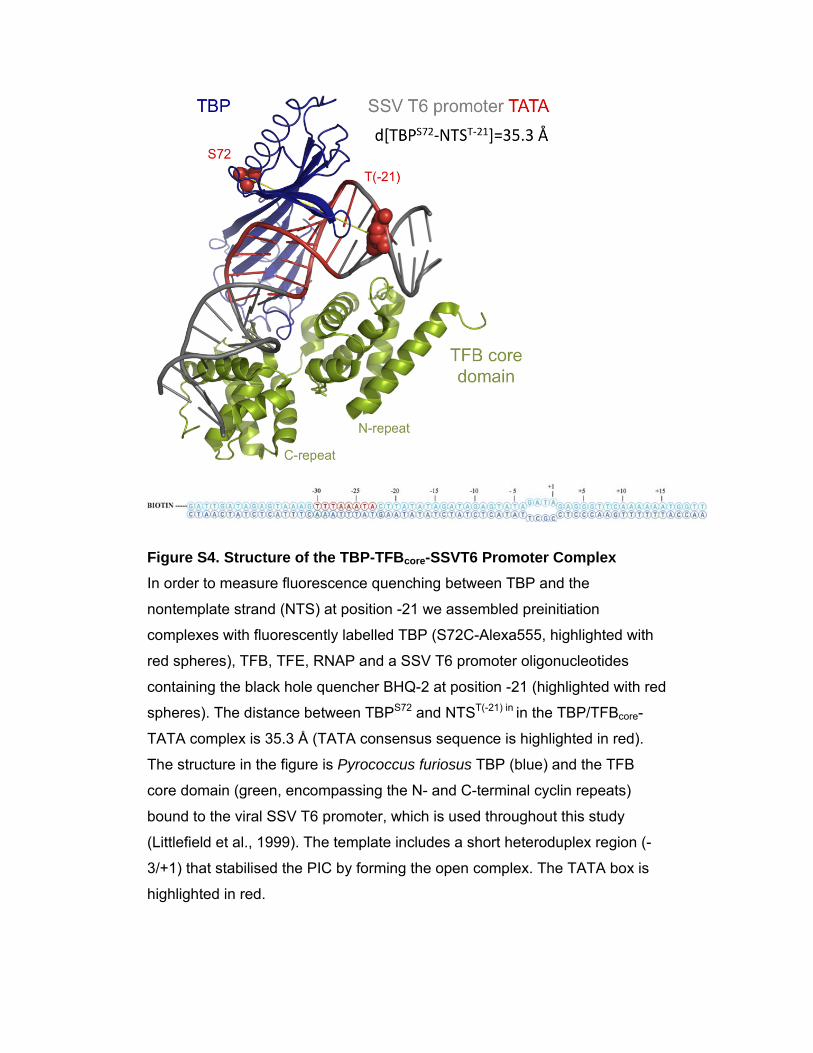
Figure S4. Structure of the TBP-TFBcore-SSVT6 Promoter Complex In order to measure fluorescence quenching between TBP and the
nontemplate strand (NTS) at position -21 we assembled preinitiation
complexes with fluorescently labelled TBP (S72C-Alexa555, highlighted with
red spheres), TFB, TFE, RNAP and a SSV T6 promoter oligonucleotides
containing the black hole quencher BHQ-2 at position -21 (highlighted with red
spheres). The distance between TBPS72 and NTST(-21) in in the TBP/TFBcore-
TATA complex is 35.3 Å (TATA consensus sequence is highlighted in red).
The structure in the figure is Pyrococcus furiosus TBP (blue) and the TFB
core domain (green, encompassing the N- and C-terminal cyclin repeats)
bound to the viral SSV T6 promoter, which is used throughout this study
(Littlefield et al., 1999). The template includes a short heteroduplex region (-
3/+1) that stabilised the PIC by forming the open complex. The TATA box is
highlighted in red.
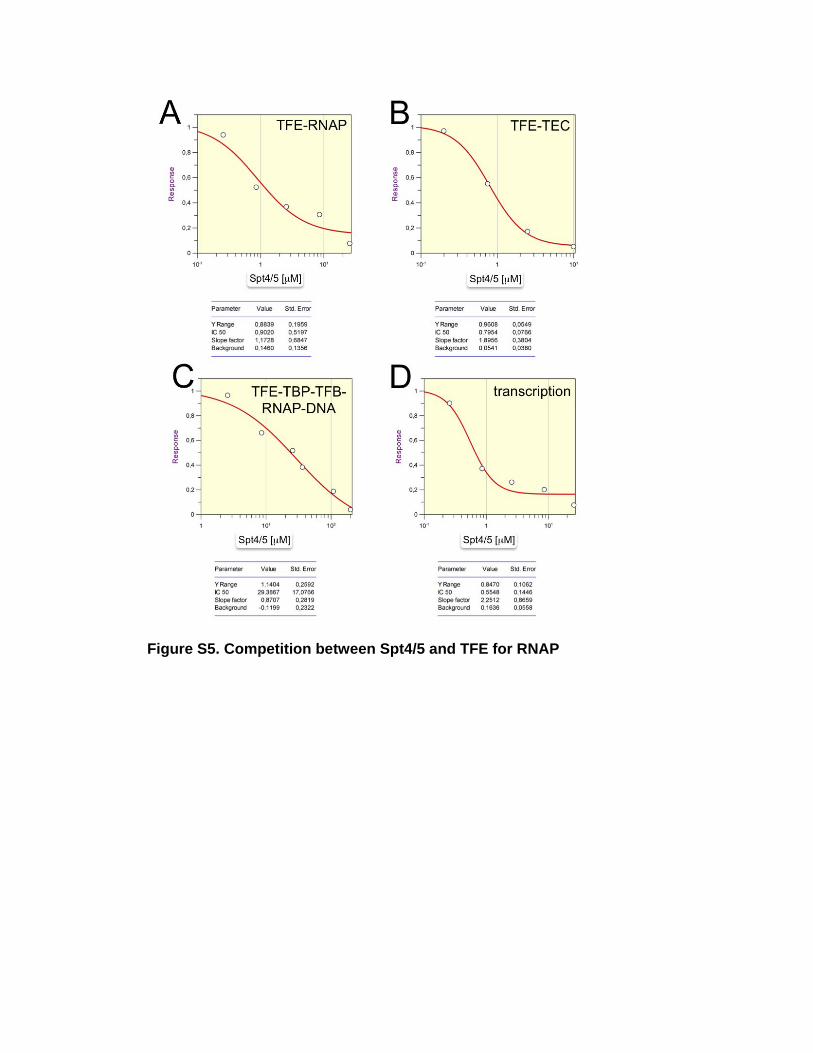
Figure S5. Competition between Spt4/5 and TFE for RNAP
180°
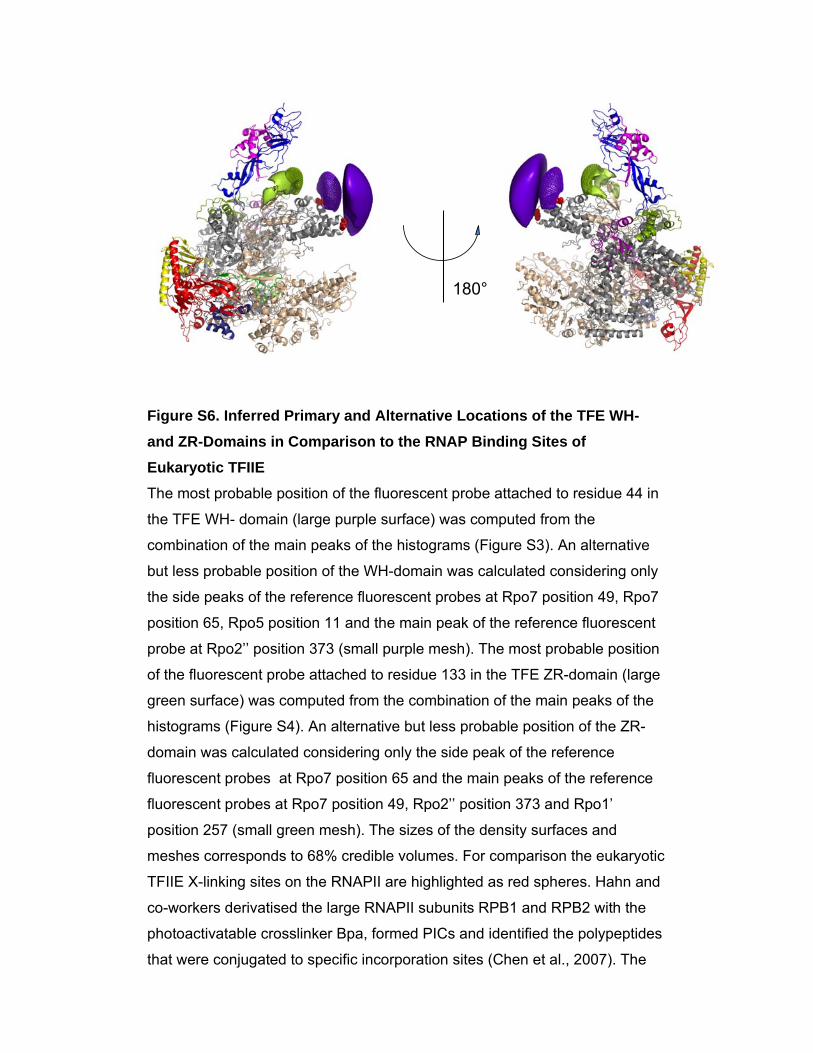
Figure S6. Inferred Primary and Alternative Locations of the TFE WH- and ZR-Domains in Comparison to the RNAP Binding Sites of Eukaryotic TFIIE The most probable position of the fluorescent probe attached to residue 44 in
the TFE WH- domain (large purple surface) was computed from the
combination of the main peaks of the histograms (Figure S3). An alternative
but less probable position of the WH-domain was calculated considering only
the side peaks of the reference fluorescent probes at Rpo7 position 49, Rpo7
position 65, Rpo5 position 11 and the main peak of the reference fluorescent
probe at Rpo2’’ position 373 (small purple mesh). The most probable position
of the fluorescent probe attached to residue 133 in the TFE ZR-domain (large
green surface) was computed from the combination of the main peaks of the
histograms (Figure S4). An alternative but less probable position of the ZR-
domain was calculated considering only the side peak of the reference
fluorescent probes at Rpo7 position 65 and the main peaks of the reference
fluorescent probes at Rpo7 position 49, Rpo2’’ position 373 and Rpo1’
position 257 (small green mesh). The sizes of the density surfaces and
meshes corresponds to 68% credible volumes. For comparison the eukaryotic
TFIIE X-linking sites on the RNAPII are highlighted as red spheres. Hahn and
co-workers derivatised the large RNAPII subunits RPB1 and RPB2 with the
photoactivatable crosslinker Bpa, formed PICs and identified the polypeptides
that were conjugated to specific incorporation sites (Chen et al., 2007). The
eukaryotic TFIIE factor was cross linked to residues RPB1 His-213 and -286
highlighted as red spheres on the structure of the archaeal RNAP
(corresponding to residues Rpo1 Lys-186 and Gln-259 in S. solfataricus
RNAP, pdb 2PMZ).
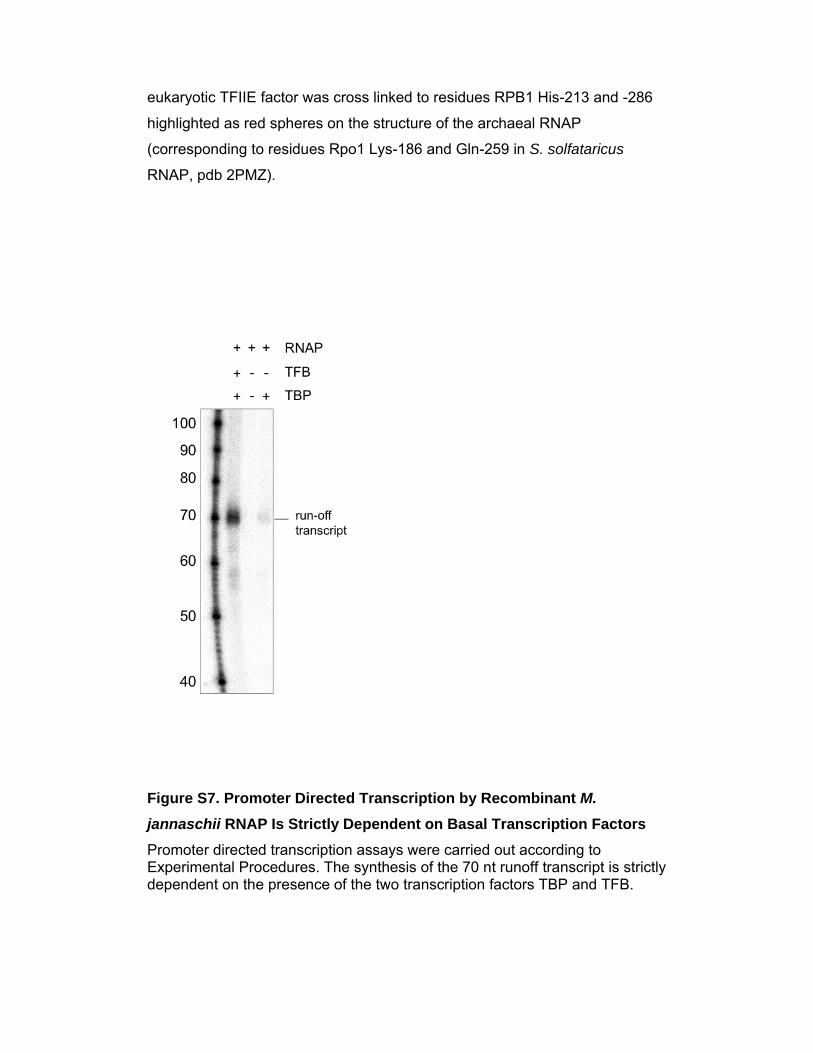
Figure S7. Promoter Directed Transcription by Recombinant M.
jannaschii RNAP Is Strictly Dependent on Basal Transcription Factors Promoter directed transcription assays were carried out according to Experimental Procedures. The synthesis of the 70 nt runoff transcript is strictly dependent on the presence of the two transcription factors TBP and TFB.
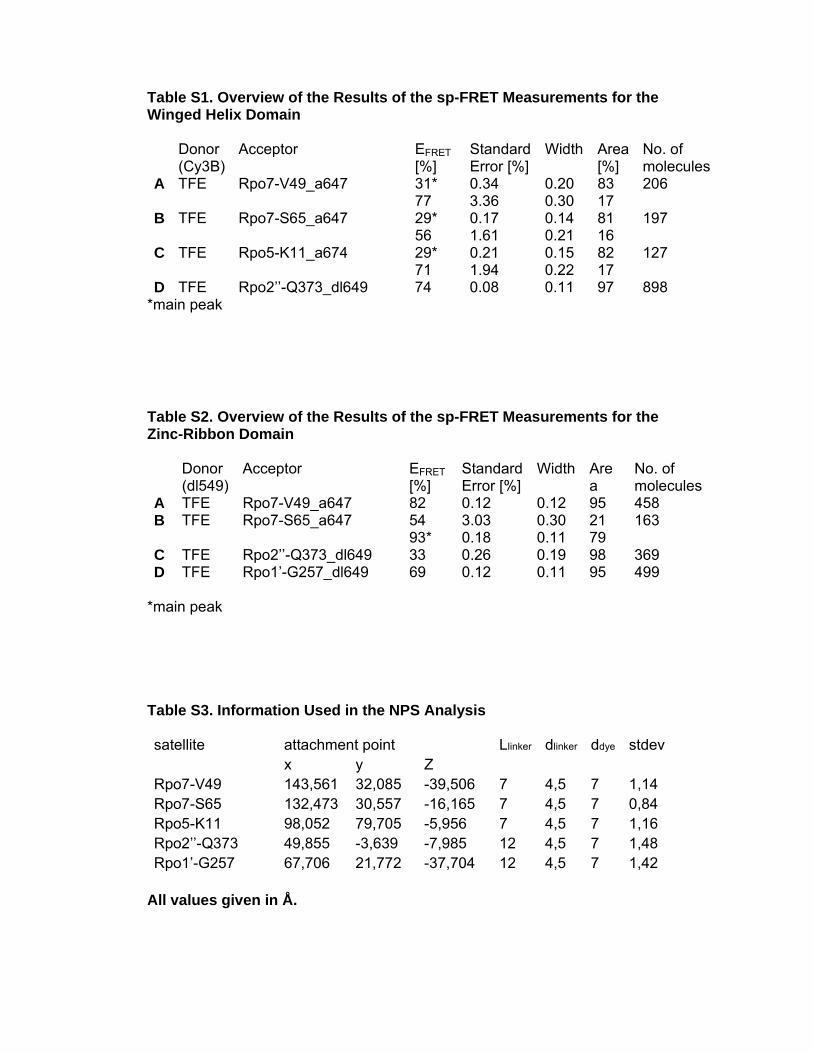
Table S1. Overview of the Results of the sp-FRET Measurements for the Winged Helix Domain Donor
pyridoxal, 0.05 mg/ml riboflavin, 1 mg/ml biotin and antibiotics (ampicillin and
tetracycline). Cells were grown for another 24h and pelleted (4000 g, 15 min,
4°C). The cell pellet was resuspended in 5 ml of minimal medium and
expanded in 500 ml M9 minimal medium (with the supplements as described
above). At an optical density of 0.6–0.8 at 600 nm, 1 mM IPTG was added to
induce protein expression. The cultures were grown for 6h after induction in
the presence of 1 mM of the unnatural amino acid p-azido-L-phenylalanine
(Chem-Impex international). The cells were harvested by centrifugation and
lysed in a buffer containing containing urea (8M), Tris/HCl (50 mM, pH 7.5),
and NaCl (250 mM) and subjected to a freeze/thaw cycle and TFE, Rpo1’,
Rpo2” and TFE were purified by nickel-affinity chromatography on a 1ml Ni-
NTA column (GE Healthcare) following the manufacturer's protocols. The
target protein was eluted in a buffer containing urea (8M), Tris/HCl (50 mM,
pH 7.5), NaCl (250 mM) and 250 mM imidazole. TFE derivatives were
renaturated on-column using a linear gradient from 6 M to 0 M urea in a buffer
containing 250 mM NaCl, 50 mM Tris-/HCl pH7.5, 100 mM ZnSO4, 30%
glycerol, 20 mM imidazole) and subsequently eluted in the same buffer
containing 250 mM imidazole. Typical yields were 4 mg/l expression culture
for TFE derivatives and 4-7 mg/l expression for RNAP-subunit derivatives
Rpo1’257 and Rpo2”373. Rpo5-11C and Rpo7-49C and -65C derivatives
respectively, were prepared as described in (Grohmann et al., 2009).
Protein Chemical Modification. TFE and RNAP-subunit derivatives containing
site-specifically incorporated p-azido-L-phenylalanine were labeled by
Staudinger ligation using phosphine derivatives of fluorescent probes
(Chakraborty et al., 2010; Kiick et al., 2002). TFE derivatives were labeled
using Cy3B-phosphine (Chakraborty et al., 2010); RNAP-subunit derivates
were labeled with DL649-phosphine (Pierce). Following reaction of 0.5 mg
TFE derivative or 6 mg of RNAP-subunit derivative with a 5-fold molar excess
of fluorophore-phosphine for 2-16 h at 37°C, beta-mercaptoethanol was
added to 1 mM, and, in the case of TFE derivatives, the product was isolated
and refolded on a 1-ml Ni-NTA column (GE Healthcare; methods for isolation
and refolding as in preceding section). Labelling efficiencies were ~50% for
TFE derivatives and ~10-40% for RNAP-subunit derivatives. Rpo5 and Rpo7
derivatives were labeled as described in (Grohmann et al., 2009).
In vitro reconstitution of M.jannaschii RNAP including fluorescently labeled
RNAP subunits. Fluorescently labeled RNAP subunits were directly
introduced into RNAP reconstitution reactions following protocols described
earlier (Werner and Weinzierl, 2002). The excess of non-coupled fluorophore-
phosphine was removed during the dialysis steps of the reconstitution process
and additionally by size-fractionation the RNAP in a gel filtration run
(Superose 6, GE Healthcare).
Nanopositioning System Experiments
Determination of the winged helix and the zinc-ribbon domain of TFE by using
NPS
The X-ray structure of the archaeal polymerase of S. solfataricus (Hirata et al.,
2008) was used as a reference frame for the position calculation. Moreover,
the volume occupied in the crystal structure was used as a restriction for the
possible positions of the dye molecules. We assumed zero probability density
within an already occupied volume, which was the volume of the protein
shrunk by 1 Å to account for uncertainties in the x-ray structure, and equal
probability density elsewhere in order to calculate the ADM prior.
The recently developed NPS method (software freely available at
http://www.cup.uni-muenchen.de/pc/michaelis/) was applied separately for the
two different positions of TFE using the measured FRET efficiencies and the
information about the possible SDM positions and Förster distances as
described above. As a result we obtain the probability density function for the
winged helix and the zinc-ribbon domain of TFE. From this we calculate the
smallest volumes that enclose a certain probability, so-called credible
volumes. The surface of the credible volume was displayed by using the
interactive visualisation program PyMOL.
Determination of the isotropic Förster radius
For each donor-acceptor pair the isotropic Förster radius R0iso was determined
using standard procedures (Vamosi et al., 1996). First, the quantum yield of
the donor sample was determined using Rhodamine 101 dissolved in ethanol
as a standard (QY = 100 %). Second, overlap integrals were calculated from
recorded donor emission spectra (528 to 700 nm with an excitation
wavelength of 523 nm) and acceptor absorption spectra (400 to 700 nm). The
winged helix domain of TFE was labelled at position G44APA with the donor
dye Cy3B. The quantum yield of the donor was determined to 71 % and the
calculated isotropic Förster radius R0iso resulted in 69 Å. The zinc-ribbon
domain TFE-G133APA was labelled with the donor dye DyLight549. We
assume a fluorescence quantum yield of 6 %
(http://www.thermo.com/eThermo/CMA/PDFs/Various/File_9349.pdf) and
calculated the isotropic Förster radius R0iso of 45 Å.
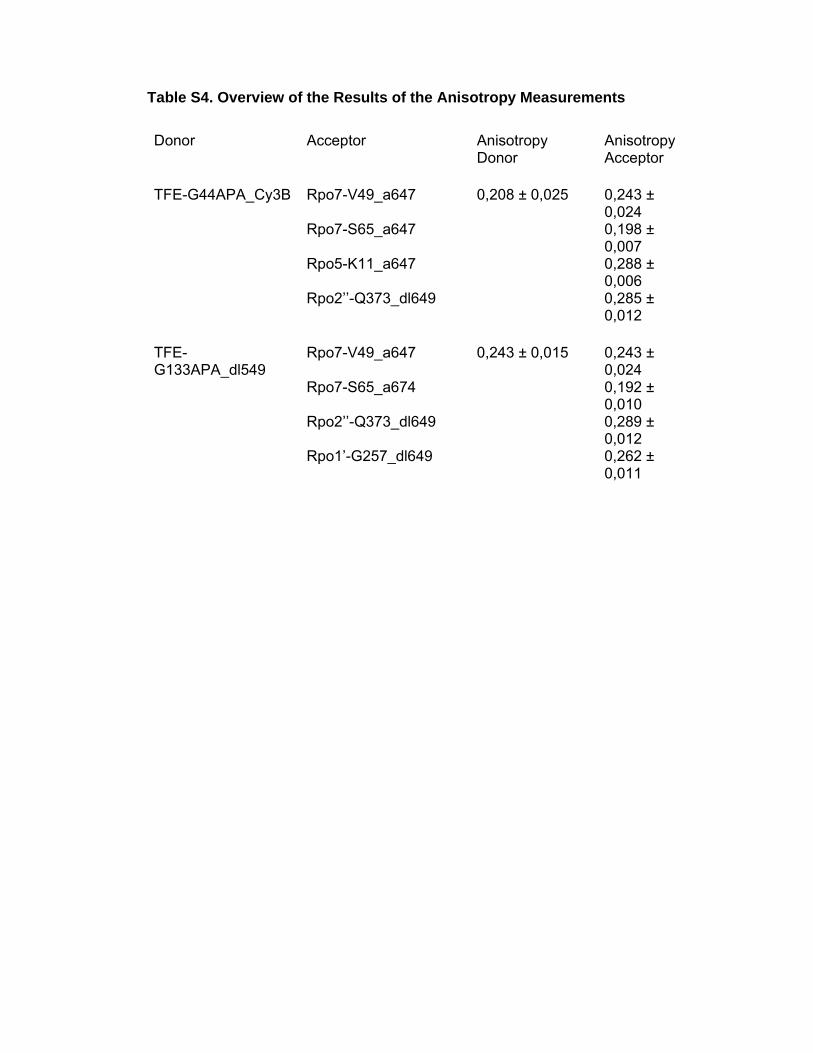
In order to account for uncertainties in the Förster distance due to orientation
effects we then measured the steady state fluorescence anisotropies of the
donor and acceptor dyes for all attachment sites (results shown in Table 3).
Assuming that there is no additional rotational movement beyond the time
scale of the fluorescence lifetime, Monte Carlo Simulations were performed in
order to calculate the probability densities of the Förster distances assuming
an isotropic distribution of the average dye molecule orientation (Muschielok
et al., 2008). For all donor-acceptor pairs the calculated probabilities were
fitted using a sum of 10 Gaussian distributions and used in the NPS analysis
as described previously (Muschielok et al., 2008).
Experimental setup for sp-FRET, data collection and analysis
All sp-FRET experiments were performed on a homebuilt prism-based total
internal reflection fluorescence microscope (TIRFM) described previously
(Andrecka et al., 2008). Briefly, a frequency-doubled Nd:YAG laser (532 nm,
Spectra-Physics) was used for the excitation of donor molecules and a He-Ne
laser (637 nm, Coherent) for the direct excitation of the acceptor molecules.
The fluorescence signal of donor and acceptor was combined spatially by the
use of a dichroic mirror. Fluorescence intensity was collected through a water-
immersion objective (Plan Apo 60X, NA 1,2, Nikon) and directed to an
EMCCD camera (iXon DU-897E-CS0-BV, Andor). PIC complexes were
immobilised onto the surface of a microfluidic chamber surface via PEG-
Biotin/Neutravidin/Biotin as described previously (Andrecka et al., 2008). All
measurements were recorded with an exposure time of 100 ms per frame for
the duration time of 40 s. The acquired data was analysed using custom-
written MATLAB software. We used a fully automated routine to find FRET
pairs using an intensity threshold for the acceptor signal during the FRET
measurement. The algorithm then calculates and subtracts the local
background and computes fluorescence trajectories (Andrecka et al., 2008).
For the calculation of the FRET efficiency of each individual FRET pair, we
used the following formula: ,IIIIE
DA
DA
⋅γ+⋅β−
= where D
'D
'AA
D
A
IIII
II
−−
=ΔΔ
=γ and 'D
'A
II
=β
IA and ID are the background corrected intensities from donor and acceptor
channels, and I and I´ are intensities before and after acceptor photobleaching
process, respectively. The parameters β and γ are experimental correction
factors, where β accounts for the leakage of the donor emission into the
acceptor channel, and γ includes the fluorescence quantum yields of the
fluorophores and the detection efficiencies of the two channels. We
determined the correction factors for all FRET pairs individually by time
averaging the intensities I and I´. In order to determine the γ-factor individually
for each FRET pair only data where acceptor photobleaching occurred prior to
donor photobleaching were used in the data analysis (Andrecka et al., 2008).
As a result no zero FRET peak is visible in the histograms. The resulting
histograms were computed either for every time point (frame-wise histogram)
or using the determined mean FRET efficiencies of every molecule (molecule-
wise histogram). The histograms were then fitted with one or more Gaussian
distributions and the mean FRET efficiency and its standard error were
determined from the fit (see Table 1 and 2). These results were then used for
further analysis with NPS (Muschielok et al., 2008).
Uncertainty in the position of dye molecules attached to known positions
Satellite dye molecules (SDMs) were attached to known positions within the
archaeal polymerase using flexible linkers. While the attachment point is
known from the x-ray structure of the archaeal polymerase of S. solfataricus
(pdb file: 2pmz) (Hirata et al., 2008), the precise location of the dye molecule
is not. For the NPS analysis we therefore calculated the volume that is
sterically accessible to the dye molecules, given the point of attachment, size
of the dye molecule and the linker length (Muschielok et al., 2008). To this
end, the SDMs were approximated by a sphere of diameter ddye and linked to
the protein complexes by flexible linkers of dimensions Llinker and dlinker (see
Table S3). We assume each SDM position within this accessible volume
equally probable and for calculation purposes approximate the resulting
probability density function by a sum of 10 Gaussian distributions. These
Gaussians are used in the NPS analysis to describe the uncertainty of the
SDM position (Muschielok et al., 2008) (see Figure S2).
Supplemental References Andrecka, J., Lewis, R., Bruckner, F., Lehmann, E., Cramer, P., and Michaelis, J. (2008). Single-molecule tracking of mRNA exiting from RNA polymerase II. Proc Natl Acad Sci U S A 105, 135-140. Chakraborty, A., Wang, D., Ebright, Y.W., and Ebright, R.H. (2010). Azide-specific labeling of biomolecules by Staudinger-Bertozzi ligation phosphine derivatives of fluorescent probes suitable for single-molecule fluorescence spectroscopy. Methods Enzymol 472, 19-30. Chen, H.T., Warfield, L., and Hahn, S. (2007). The positions of TFIIF and TFIIE in the RNA polymerase II transcription preinitiation complex. Nat Struct Mol Biol 14, 696-703. Chin, J.W., Santoro, S.W., Martin, A.B., King, D.S., Wang, L., and Schultz, P.G. (2002). Addition of p-azido-L-phenylalanine to the genetic code of Escherichia coli. J Am Chem Soc 124, 9026-9027. Grohmann, D., Hirtreiter, A., and Werner, F. (2009). RNAP subunits F/E (RPB4/7) are stably associated with archaeal RNA polymerase: using fluorescence anisotropy to monitor RNAP assembly in vitro. Biochem J 421, 339-343. Hirata, A., Klein, B.J., and Murakami, K.S. (2008). The X-ray crystal structure of RNA polymerase from Archaea. Nature 451, 851-854. Humphrey, W., Dalke, A., and Schulten, K. (1996). VMD: visual molecular dynamics. J Mol Graph 14, 33-38, 27-38. Kiick, K.L., Saxon, E., Tirrell, D.A., and Bertozzi, C.R. (2002). Incorporation of azides into recombinant proteins for chemoselective modification by the Staudinger ligation. Proc Natl Acad Sci U S A 99, 19-24. Littlefield, O., Korkhin, Y., and Sigler, P.B. (1999). The structural basis for the oriented assembly of a TBP/TFB/promoter complex. Proc Natl Acad Sci U S A 96, 13668-13673. Muschielok, A., Andrecka, J., Jawhari, A., Bruckner, F., Cramer, P., and Michaelis, J. (2008). A nano-positioning system for macromolecular structural analysis. Nat Methods 5, 965-971. Vamosi, G., Gohlke, C., and Clegg, R.M. (1996). Fluorescence characteristics of 5-carboxytetramethylrhodamine linked covalently to the 5' end of oligonucleotides: multiple conformers of single-stranded and double-stranded dye-DNA complexes. Biophys J 71, 972-994. Werner, F., and Weinzierl, R.O. (2002). A recombinant RNA polymerase II-like enzyme capable of promoter-specific transcription. Mol Cell 10, 635-646.