Page 1
New Technologies to Enhance Yield of
Crude Fractionation
Miguel Bagajewicz(+) , Clay Buie, Matt Heckendorn.
School of Chemical, Biological and Materials Engineering
The University of Oklahoma
100 E. Boyd St., T335
Norman, OK 73019
Keywords: Petroleum Fractionation
Page 2
Abstract
The objective of crude fractionation is to separate the incoming oil to a refinery into
valuable products, namely, gas oils, diesel, kerosene, jet fuel, naphtha, gasoline and
LPG. In this article, we review a recent patent where five technologies are presented to
increase the ability of separating the aforementioned valuable products using the same
energy expenditure, if not less than the current conventional distillation processes. The
results of computer simulation of the five designs are used to evaluate each design’s
performance.
Page 3
Introduction
In the past couple of decades, increased efficiency and productivity in the process
industry have been given increasing attention. With rising energy costs and
environmental concerns, novel methods for crude distillation have been sought by
petroleum refiners to extract as much profitable products from a barrel of crude as
possible without increasing the amount of energy needed. For the purposes of this
paper, energy cost will be reported as the minimum heating and cooling utility needed
to achieve the desired fractionation of crude oil into its products. Yield will be defined
as the actual flow rates of the products produced from crude fractionation. This paper
presents the results of five patent technologies running three different grades of crude
oil; namely light, intermediate and heavy crudes.
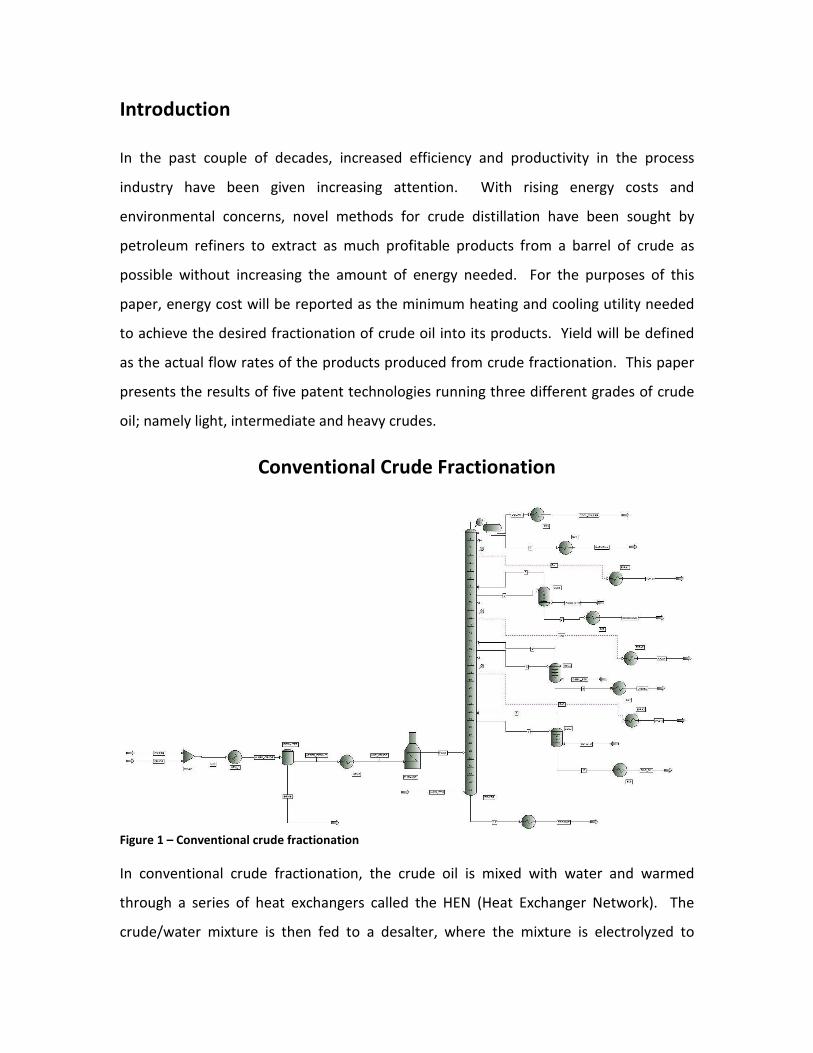
Conventional Crude Fractionation
Figure 1 – Conventional crude fractionation
In conventional crude fractionation, the crude oil is mixed with water and warmed
through a series of heat exchangers called the HEN (Heat Exchanger Network). The
crude/water mixture is then fed to a desalter, where the mixture is electrolyzed to
Page 4
remove the salt in crude that is harmful to downstream equipment. In this process,
most of the water is removed as saltwater brine and some water remains dispersed
within the crude oil. The crude oil is then sent to a second HEN, and then fed to a
furnace that heats the crude to no higher than 360 °C. The crude enters the column,
then the vapors and liquid separate upon entering the column, and the vapor rises and
cools and the liquid falls and is reheated by steam that is injected at the bottom tray.
This is called steam stripping. The different products, or cuts, are drawn off the tower at
differing heights and fed to the side strippers. The side strippers are injected with
steam to remove lighter components from the product cut. The hot cuts are cooled by
using their energy to warm up the crude via the HEN, and sent downstream.
Pumparounds are used on the column to reduce the condenser duty and also warm the
feed in the HEN. The following patented technologies aim to increase yield and
maintain, if not reduce, the minimum steam utility. The column operating procedures
are tabulated below on the next page.
Page 5
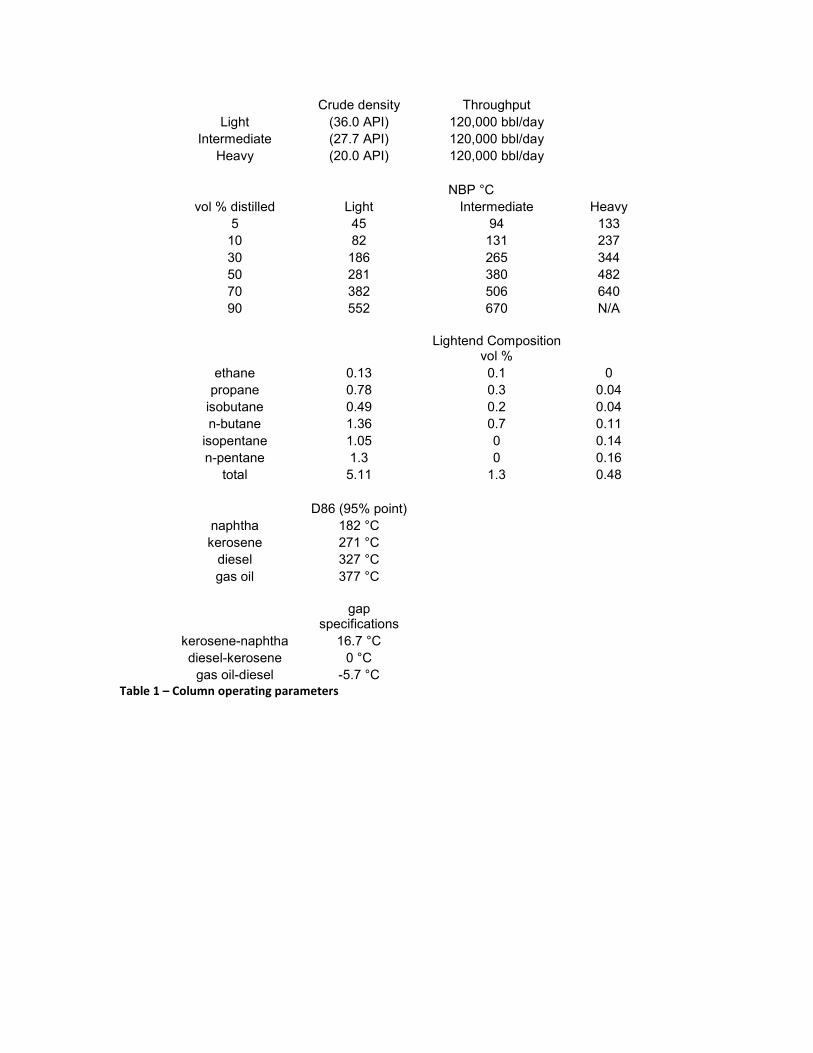
Crude density Throughput Light (36.0 API) 120,000 bbl/day
Intermediate (27.7 API) 120,000 bbl/day Heavy (20.0 API) 120,000 bbl/day
NBP °C
vol % distilled Light Intermediate Heavy 5 45 94 133
10 82 131 237 30 186 265 344 50 281 380 482 70 382 506 640 90 552 670 N/A
Lightend Composition
vol % ethane 0.13 0.1 0
propane 0.78 0.3 0.04 isobutane 0.49 0.2 0.04 n-butane 1.36 0.7 0.11
isopentane 1.05 0 0.14 n-pentane 1.3 0 0.16
total 5.11 1.3 0.48 D86 (95% point)
naphtha 182 °C kerosene 271 °C
diesel 327 °C gas oil 377 °C
gap
specifications kerosene-naphtha 16.7 °C diesel-kerosene 0 °C
gas oil-diesel -5.7 °C Table 1 – Column operating parameters
Page 6
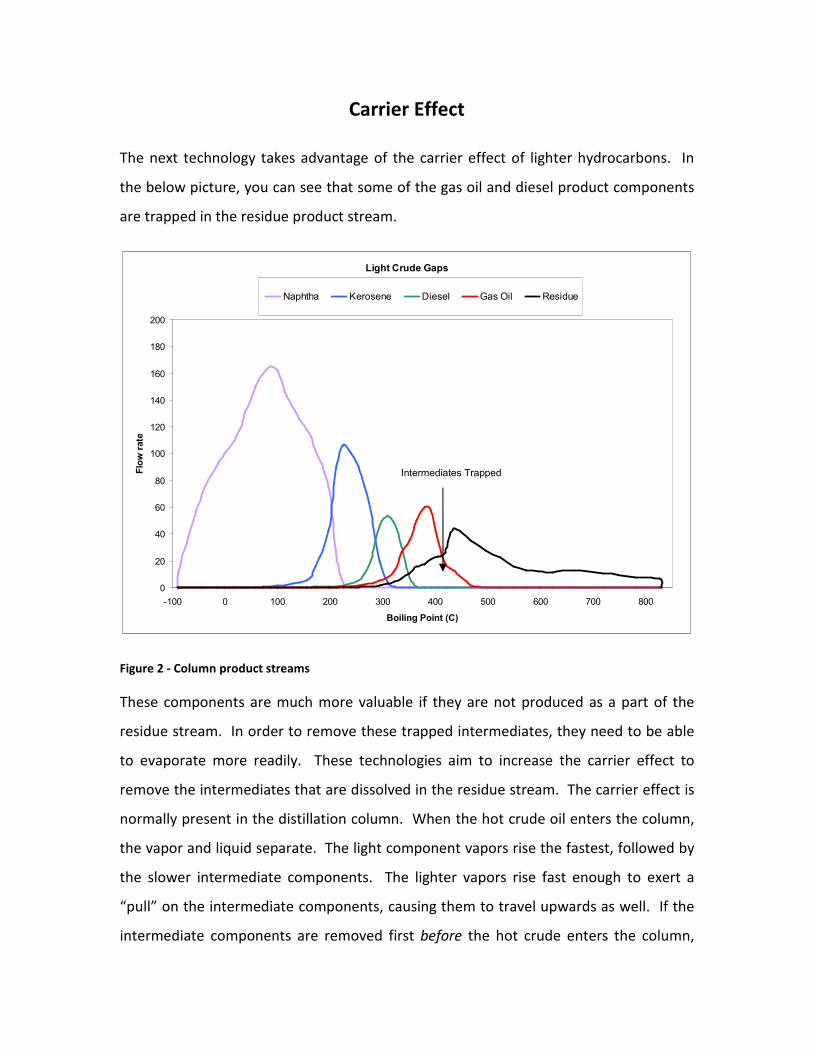
Carrier Effect
The next technology takes advantage of the carrier effect of lighter hydrocarbons. In
the below picture, you can see that some of the gas oil and diesel product components
are trapped in the residue product stream.
Figure 2 - Column product streams
These components are much more valuable if they are not produced as a part of the
residue stream. In order to remove these trapped intermediates, they need to be able
to evaporate more readily. These technologies aim to increase the carrier effect to
remove the intermediates that are dissolved in the residue stream. The carrier effect is
normally present in the distillation column. When the hot crude oil enters the column,
the vapor and liquid separate. The light component vapors rise the fastest, followed by
the slower intermediate components. The lighter vapors rise fast enough to exert a
“pull” on the intermediate components, causing them to travel upwards as well. If the
intermediate components are removed first before the hot crude enters the column,
Light Crude Gaps
0
20
40
60
80
100
120
140
160
180
200
-100 0 100 200 300 400 500 600 700 800
Boiling Point (C)
Flow rate
Naphtha Kerosene Diesel Gas Oil Residue
Intermediates Trapped
Page 7
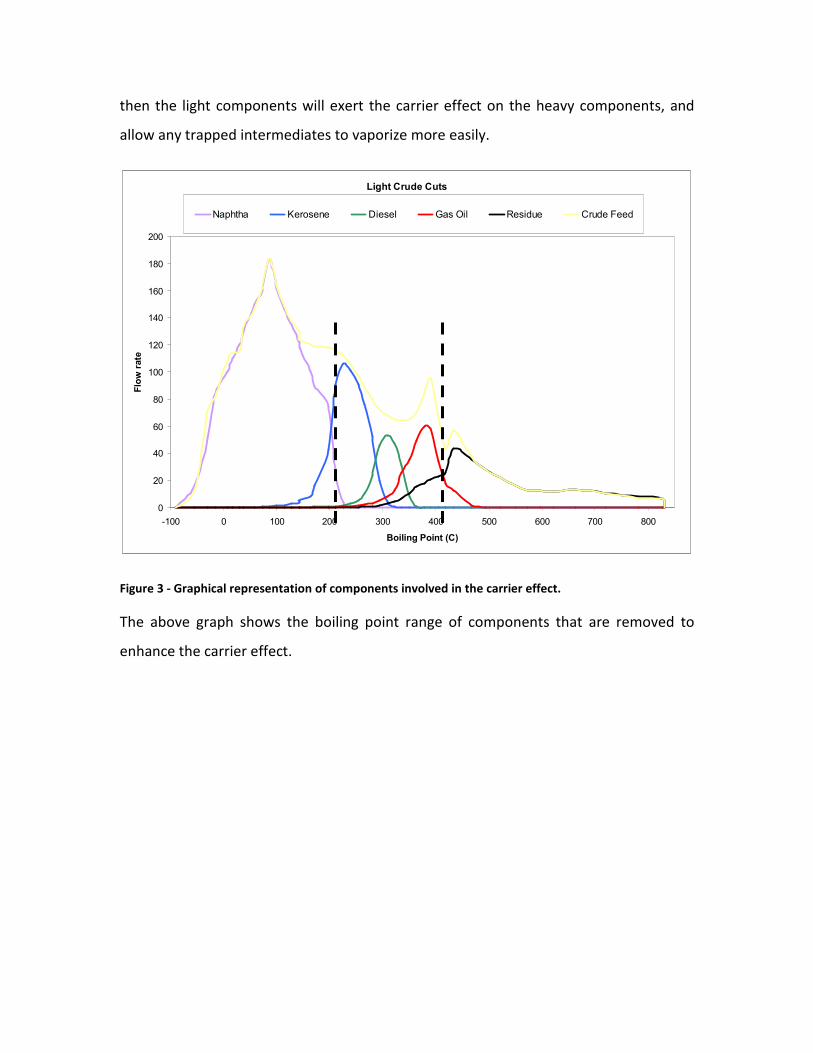
then the light components will exert the carrier effect on the heavy components, and
allow any trapped intermediates to vaporize more easily.
Figure 3 - Graphical representation of components involved in the carrier effect.
The above graph shows the boiling point range of components that are removed to
enhance the carrier effect.
Light Crude Cuts
0
20
40
60
80
100
120
140
160
180
200
-100 0 100 200 300 400 500 600 700 800
Boiling Point (C)
Flow rate
Naphtha Kerosene Diesel Gas Oil Residue Crude Feed
Page 8
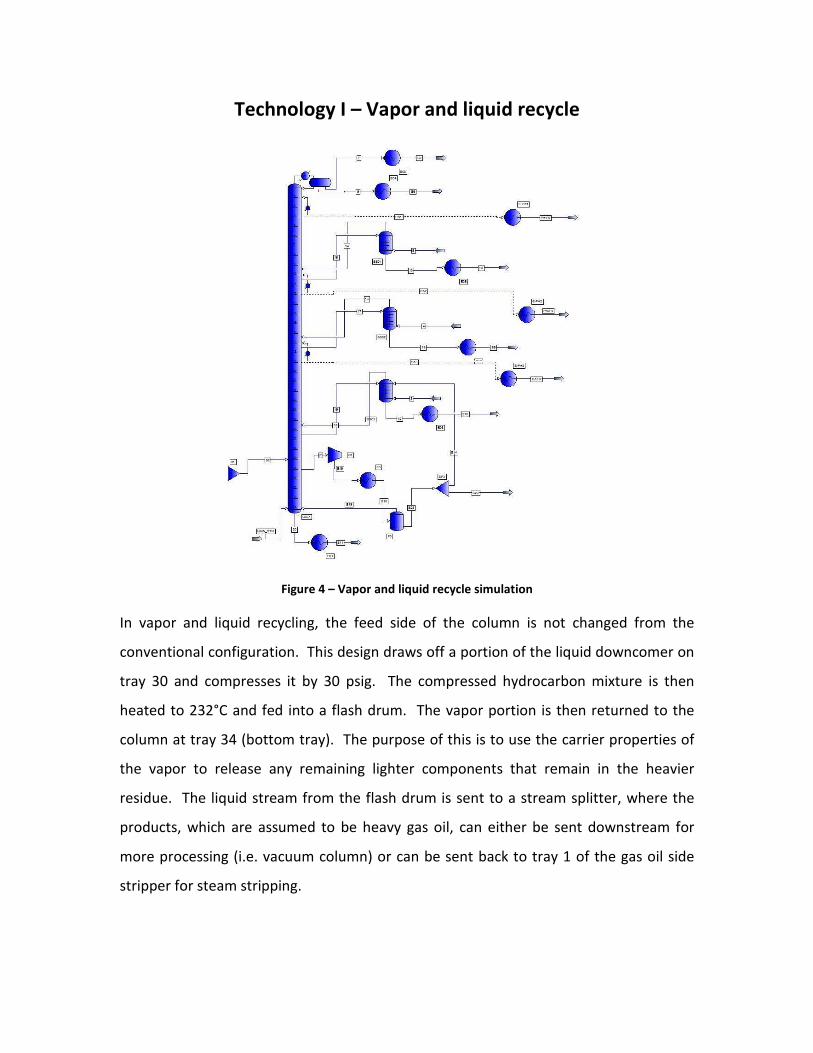
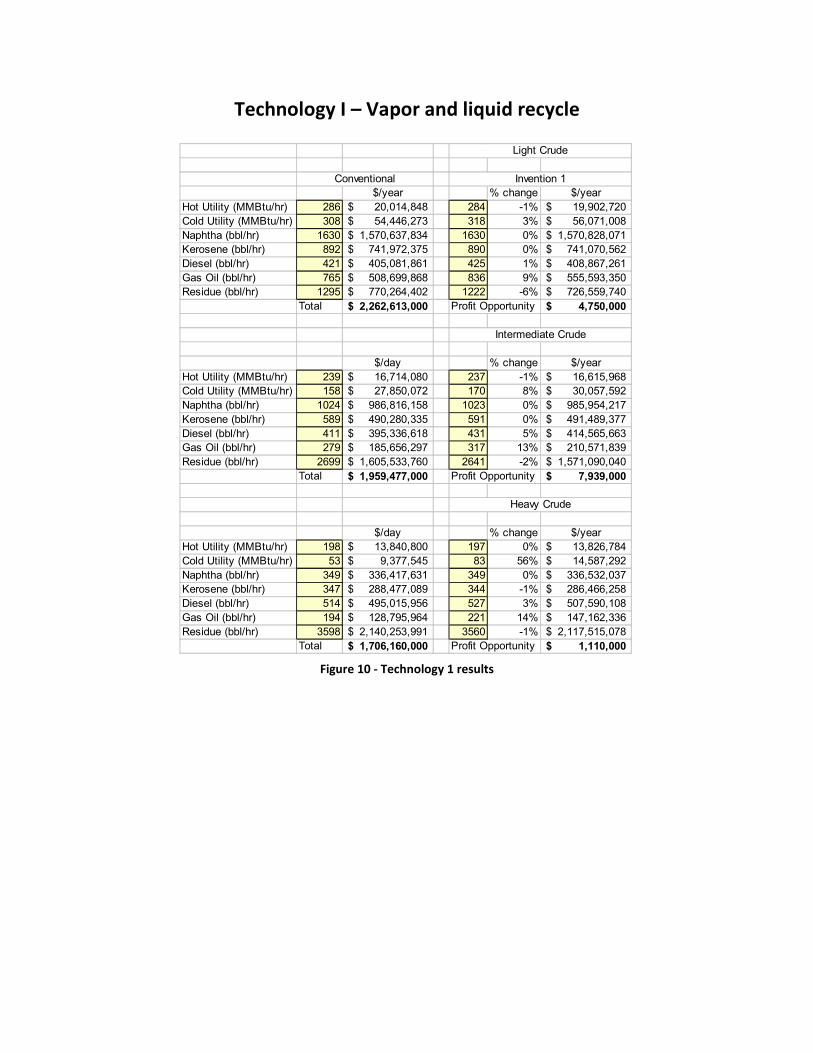
Technology I – Vapor and liquid recycle
Figure 4 – Vapor and liquid recycle simulation
In vapor and liquid recycling, the feed side of the column is not changed from the
conventional configuration. This design draws off a portion of the liquid downcomer on
tray 30 and compresses it by 30 psig. The compressed hydrocarbon mixture is then
heated to 232°C and fed into a flash drum. The vapor portion is then returned to the
column at tray 34 (bottom tray). The purpose of this is to use the carrier properties of
the vapor to release any remaining lighter components that remain in the heavier
residue. The liquid stream from the flash drum is sent to a stream splitter, where the
products, which are assumed to be heavy gas oil, can either be sent downstream for
more processing (i.e. vacuum column) or can be sent back to tray 1 of the gas oil side
stripper for steam stripping.
Page 9
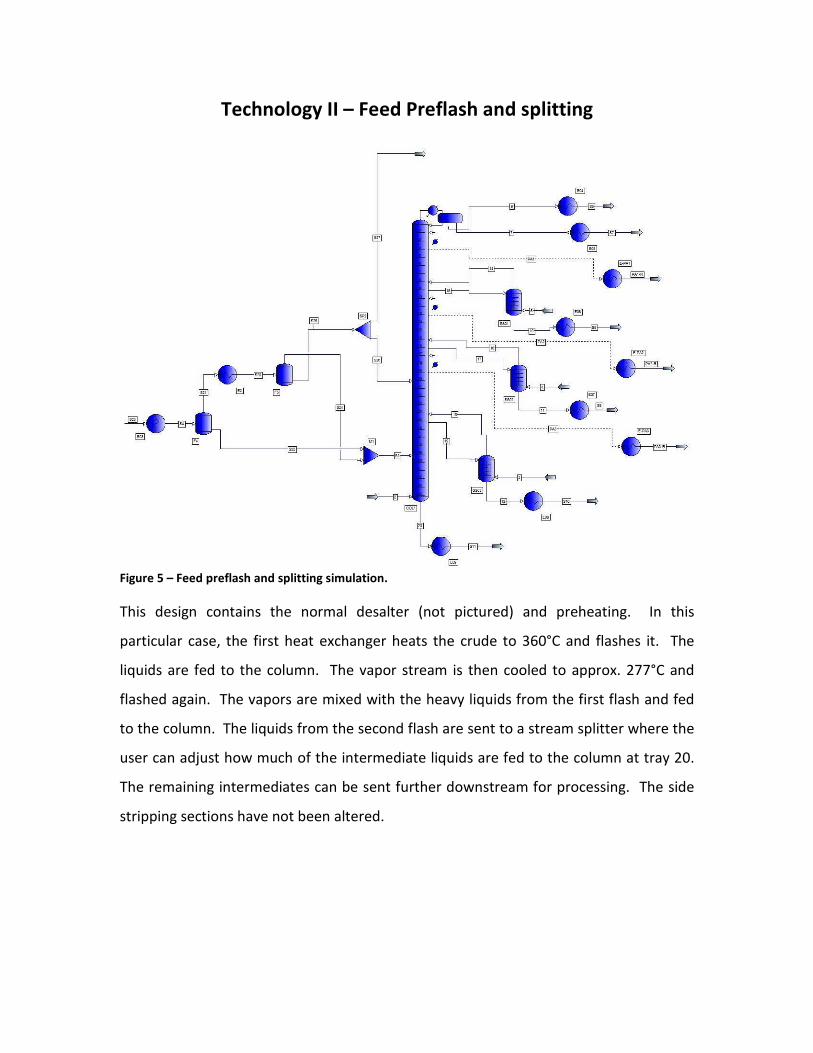
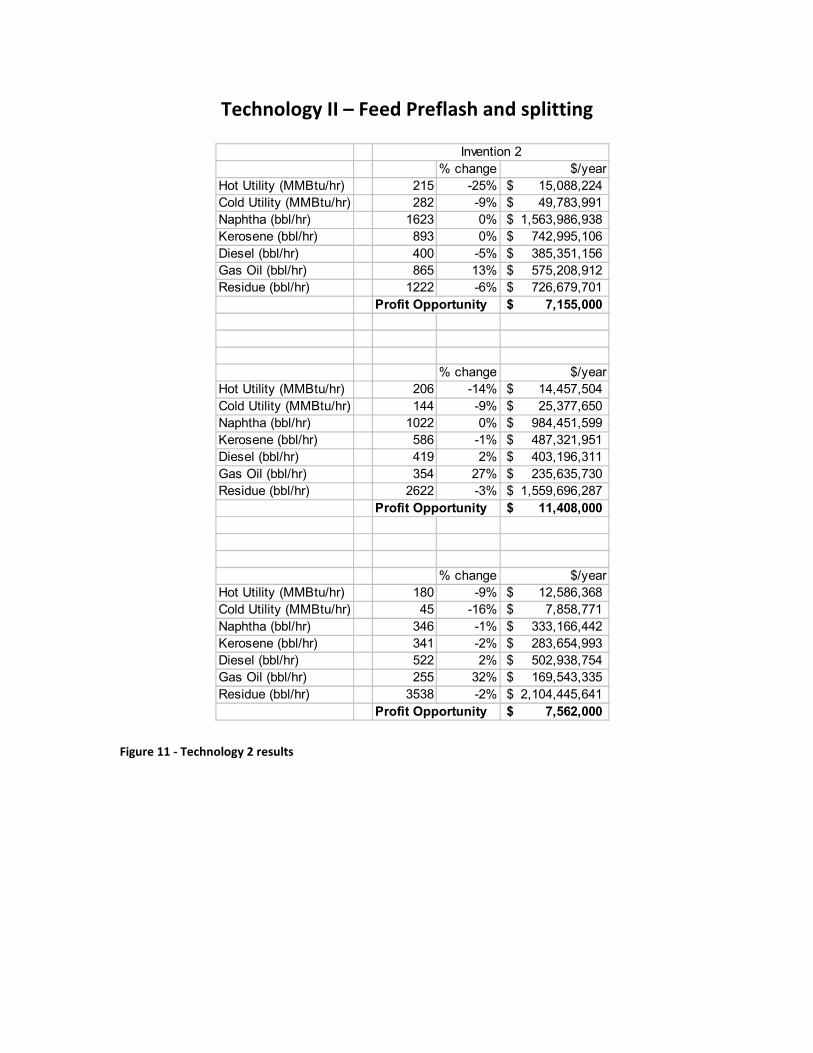
Technology II – Feed Preflash and splitting
Figure 5 – Feed preflash and splitting simulation.
This design contains the normal desalter (not pictured) and preheating. In this
particular case, the first heat exchanger heats the crude to 360°C and flashes it. The
liquids are fed to the column. The vapor stream is then cooled to approx. 277°C and
flashed again. The vapors are mixed with the heavy liquids from the first flash and fed
to the column. The liquids from the second flash are sent to a stream splitter where the
user can adjust how much of the intermediate liquids are fed to the column at tray 20.
The remaining intermediates can be sent further downstream for processing. The side
stripping sections have not been altered.
Page 10
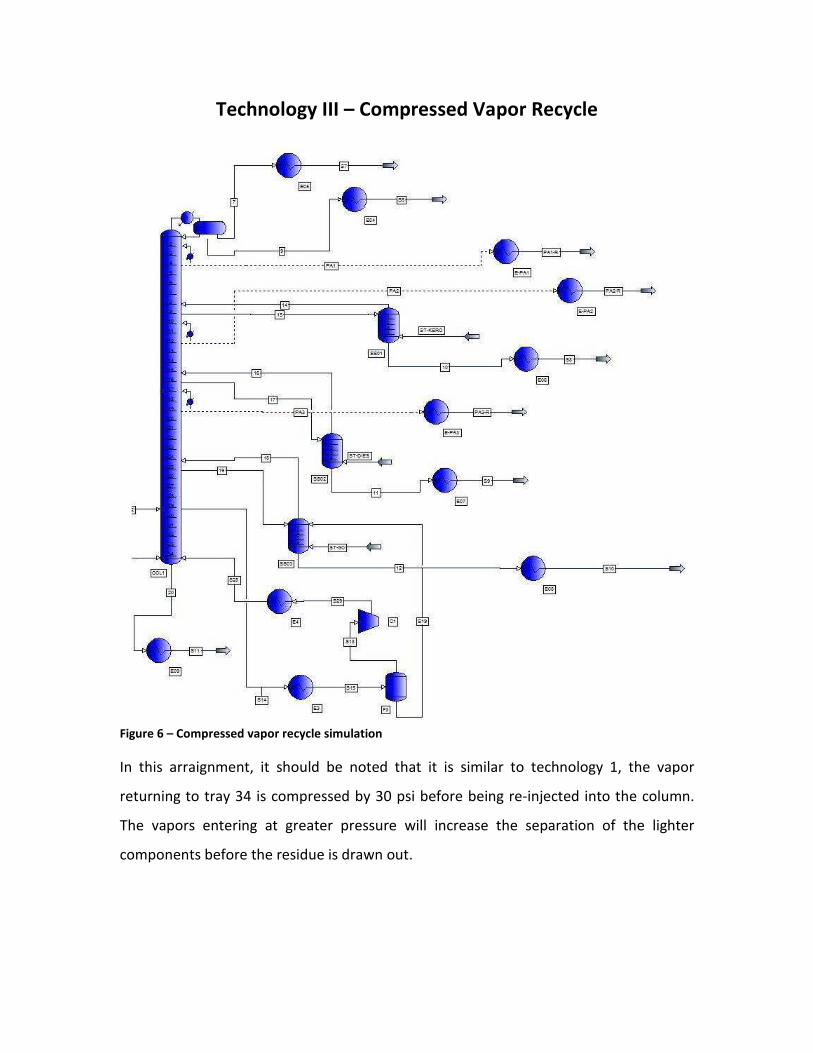
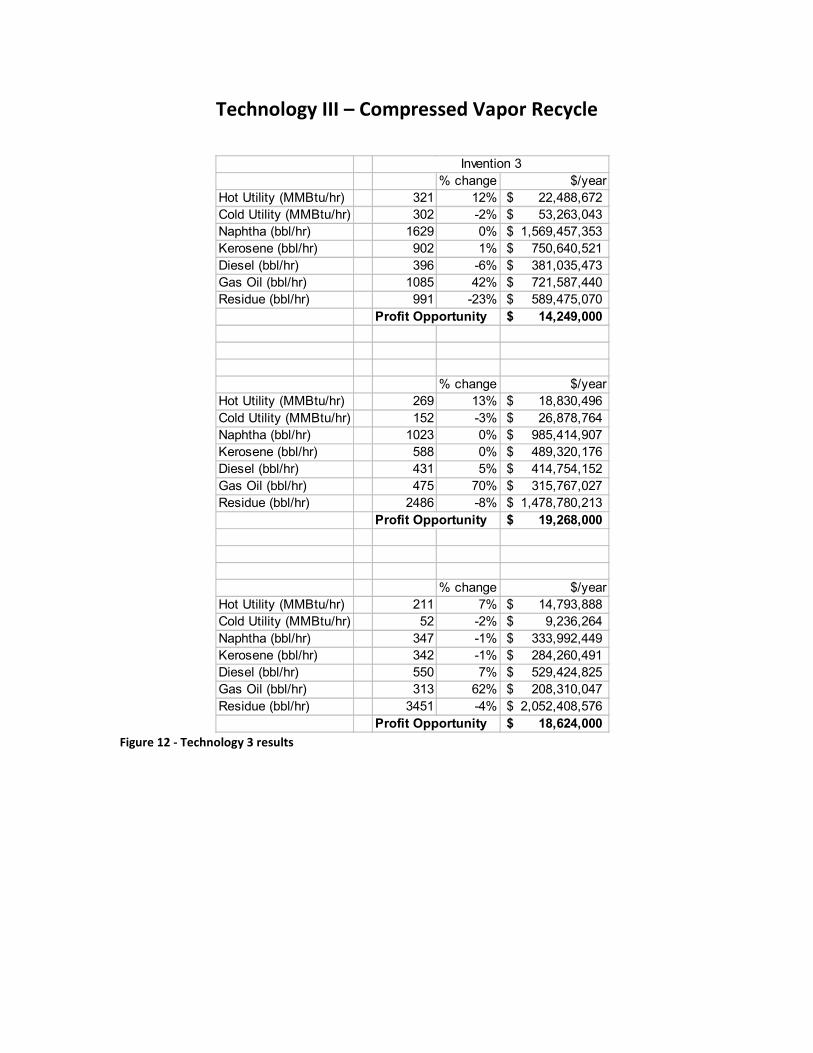
Technology III – Compressed Vapor Recycle
Figure 6 – Compressed vapor recycle simulation
In this arraignment, it should be noted that it is similar to technology 1, the vapor
returning to tray 34 is compressed by 30 psi before being re-injected into the column.
The vapors entering at greater pressure will increase the separation of the lighter
components before the residue is drawn out.
Page 11
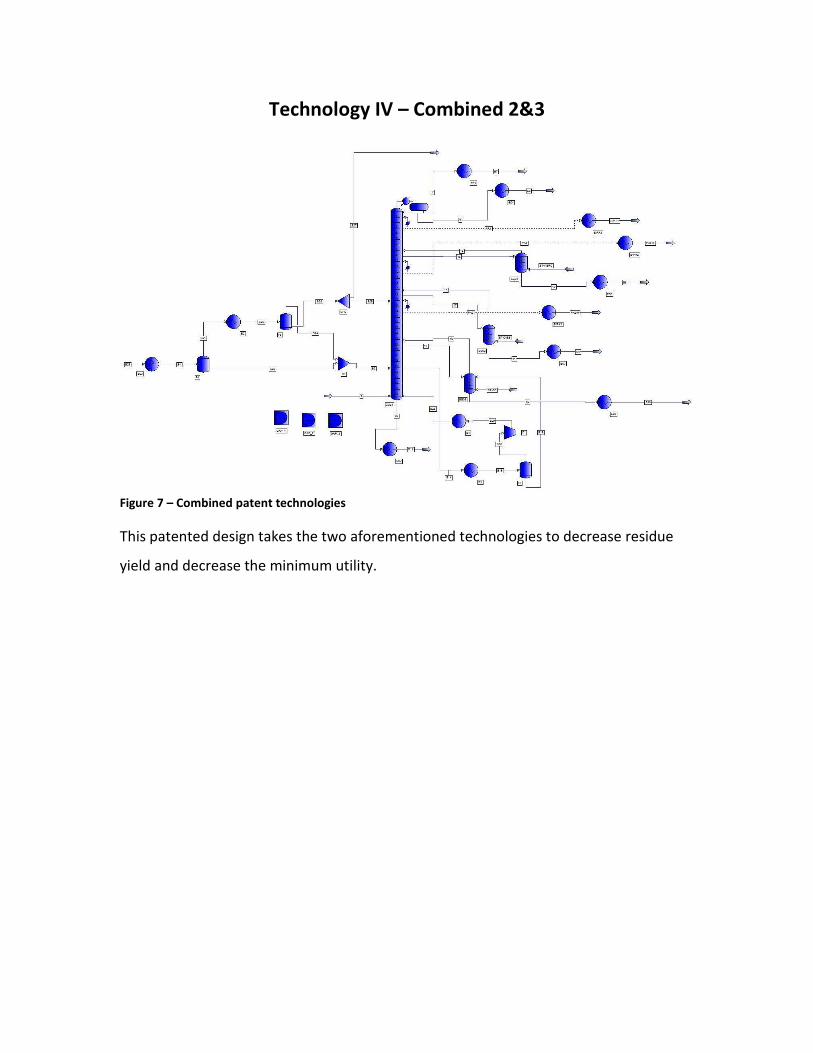
Technology IV – Combined 2&3
Figure 7 – Combined patent technologies
This patented design takes the two aforementioned technologies to decrease residue
yield and decrease the minimum utility.
Page 12
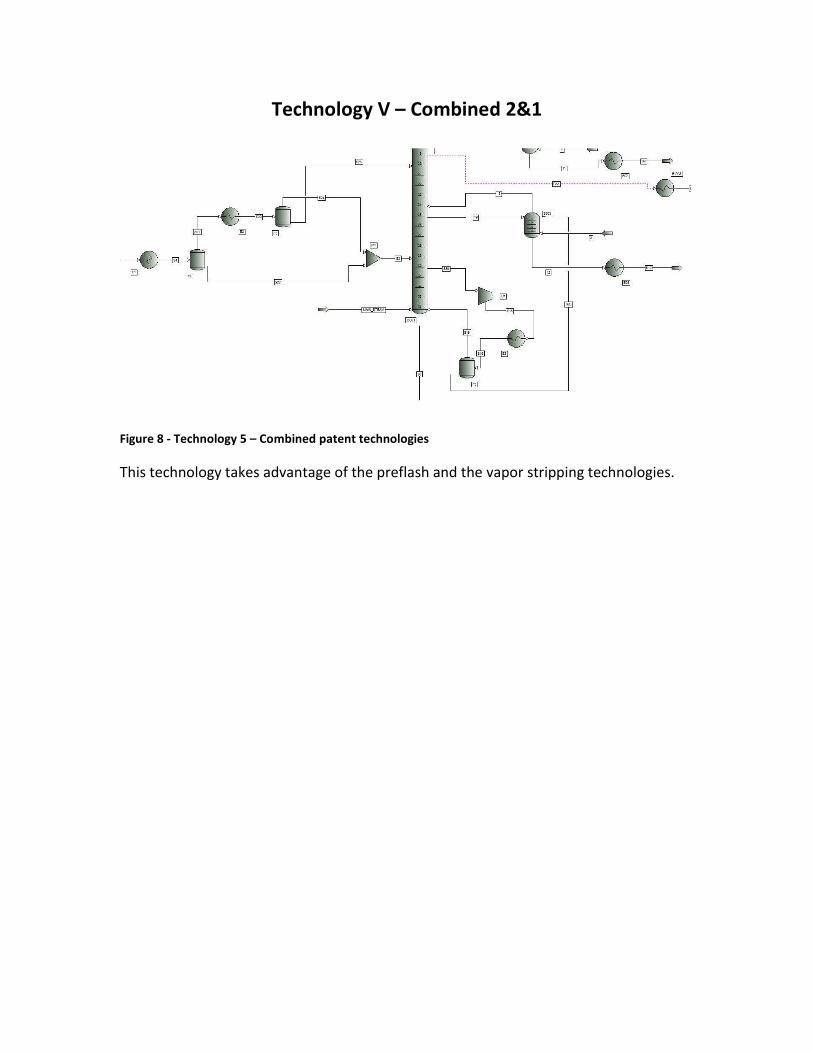
Technology V – Combined 2&1
Figure 8 - Technology 5 – Combined patent technologies
This technology takes advantage of the preflash and the vapor stripping technologies.
Page 13
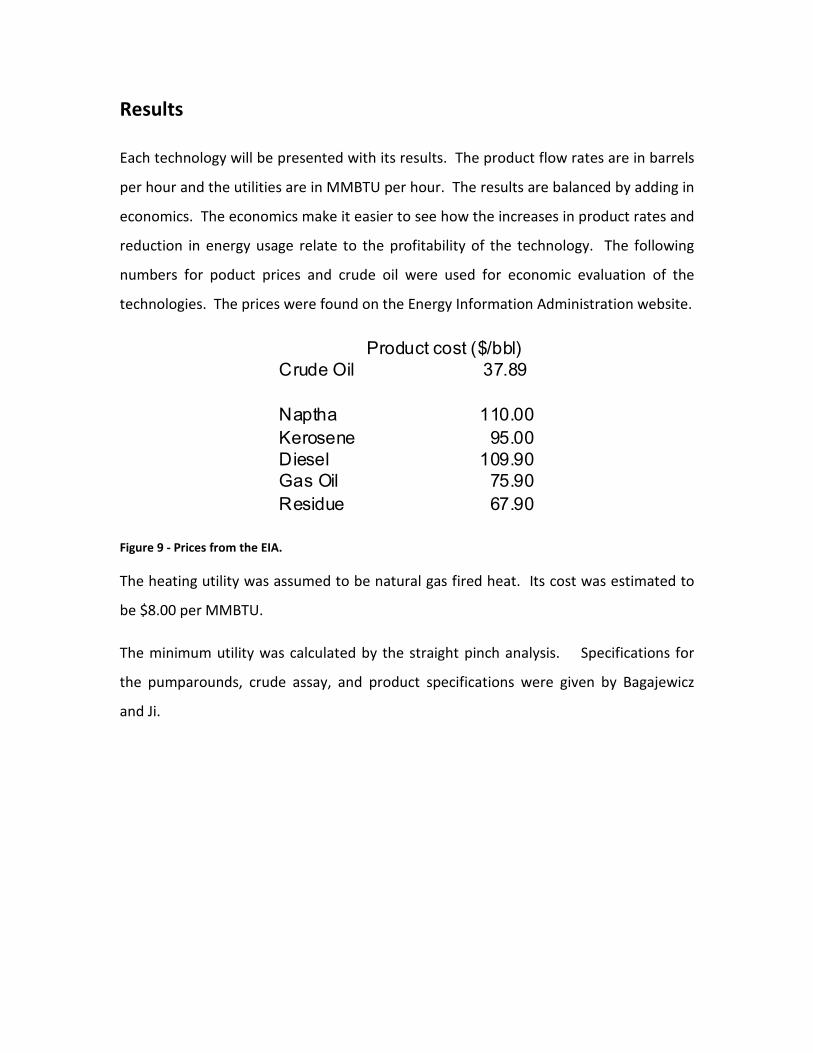
Results
Each technology will be presented with its results. The product flow rates are in barrels
per hour and the utilities are in MMBTU per hour. The results are balanced by adding in
economics. The economics make it easier to see how the increases in product rates and
reduction in energy usage relate to the profitability of the technology. The following
numbers for poduct prices and crude oil were used for economic evaluation of the
technologies. The prices were found on the Energy Information Administration website.
Figure 9 - Prices from the EIA.
The heating utility was assumed to be natural gas fired heat. Its cost was estimated to
be $8.00 per MMBTU.
The minimum utility was calculated by the straight pinch analysis. Specifications for
the pumparounds, crude assay, and product specifications were given by Bagajewicz
and Ji.
Product cost ($/bbl)Crude Oil 37.89
Naptha 110.00Kerosene 95.00Diesel 109.90Gas Oil 75.90Residue 67.90
Page 14
Technology I – Vapor and liquid recycle
Figure 10 - Technology 1 results
$/year % change $/yearHot Utility (MMBtu/hr) 286 20,014,848$ 284 -1% 19,902,720$ Cold Utility (MMBtu/hr) 308 54,446,273$ 318 3% 56,071,008$ Naphtha (bbl/hr) 1630 1,570,637,834$ 1630 0% 1,570,828,071$ Kerosene (bbl/hr) 892 741,972,375$ 890 0% 741,070,562$ Diesel (bbl/hr) 421 405,081,861$ 425 1% 408,867,261$ Gas Oil (bbl/hr) 765 508,699,868$ 836 9% 555,593,350$ Residue (bbl/hr) 1295 770,264,402$ 1222 -6% 726,559,740$
Total 2,262,613,000$ Profit Opportunity 4,750,000$
$/day % change $/yearHot Utility (MMBtu/hr) 239 16,714,080$ 237 -1% 16,615,968$ Cold Utility (MMBtu/hr) 158 27,850,072$ 170 8% 30,057,592$ Naphtha (bbl/hr) 1024 986,816,158$ 1023 0% 985,954,217$ Kerosene (bbl/hr) 589 490,280,335$ 591 0% 491,489,377$ Diesel (bbl/hr) 411 395,336,618$ 431 5% 414,565,663$ Gas Oil (bbl/hr) 279 185,656,297$ 317 13% 210,571,839$ Residue (bbl/hr) 2699 1,605,533,760$ 2641 -2% 1,571,090,040$
Total 1,959,477,000$ Profit Opportunity 7,939,000$
$/day % change $/yearHot Utility (MMBtu/hr) 198 13,840,800$ 197 0% 13,826,784$ Cold Utility (MMBtu/hr) 53 9,377,545$ 83 56% 14,587,292$ Naphtha (bbl/hr) 349 336,417,631$ 349 0% 336,532,037$ Kerosene (bbl/hr) 347 288,477,089$ 344 -1% 286,466,258$ Diesel (bbl/hr) 514 495,015,956$ 527 3% 507,590,108$ Gas Oil (bbl/hr) 194 128,795,964$ 221 14% 147,162,336$ Residue (bbl/hr) 3598 2,140,253,991$ 3560 -1% 2,117,515,078$
Total 1,706,160,000$ Profit Opportunity 1,110,000$
Light Crude
Intermediate Crude
Heavy Crude
Conventional Invention 1
Page 15
Technology II – Feed Preflash and splitting
Figure 11 - Technology 2 results
% change $/yearHot Utility (MMBtu/hr) 215 -25% 15,088,224$ Cold Utility (MMBtu/hr) 282 -9% 49,783,991$ Naphtha (bbl/hr) 1623 0% 1,563,986,938$ Kerosene (bbl/hr) 893 0% 742,995,106$ Diesel (bbl/hr) 400 -5% 385,351,156$ Gas Oil (bbl/hr) 865 13% 575,208,912$ Residue (bbl/hr) 1222 -6% 726,679,701$
Profit Opportunity 7,155,000$
% change $/yearHot Utility (MMBtu/hr) 206 -14% 14,457,504$ Cold Utility (MMBtu/hr) 144 -9% 25,377,650$ Naphtha (bbl/hr) 1022 0% 984,451,599$ Kerosene (bbl/hr) 586 -1% 487,321,951$ Diesel (bbl/hr) 419 2% 403,196,311$ Gas Oil (bbl/hr) 354 27% 235,635,730$ Residue (bbl/hr) 2622 -3% 1,559,696,287$
Profit Opportunity 11,408,000$
% change $/yearHot Utility (MMBtu/hr) 180 -9% 12,586,368$ Cold Utility (MMBtu/hr) 45 -16% 7,858,771$ Naphtha (bbl/hr) 346 -1% 333,166,442$ Kerosene (bbl/hr) 341 -2% 283,654,993$ Diesel (bbl/hr) 522 2% 502,938,754$ Gas Oil (bbl/hr) 255 32% 169,543,335$ Residue (bbl/hr) 3538 -2% 2,104,445,641$
Profit Opportunity 7,562,000$
Invention 2
Page 16
Technology III – Compressed Vapor Recycle
Figure 12 - Technology 3 results
% change $/yearHot Utility (MMBtu/hr) 321 12% 22,488,672$ Cold Utility (MMBtu/hr) 302 -2% 53,263,043$ Naphtha (bbl/hr) 1629 0% 1,569,457,353$ Kerosene (bbl/hr) 902 1% 750,640,521$ Diesel (bbl/hr) 396 -6% 381,035,473$ Gas Oil (bbl/hr) 1085 42% 721,587,440$ Residue (bbl/hr) 991 -23% 589,475,070$
Profit Opportunity 14,249,000$
% change $/yearHot Utility (MMBtu/hr) 269 13% 18,830,496$ Cold Utility (MMBtu/hr) 152 -3% 26,878,764$ Naphtha (bbl/hr) 1023 0% 985,414,907$ Kerosene (bbl/hr) 588 0% 489,320,176$ Diesel (bbl/hr) 431 5% 414,754,152$ Gas Oil (bbl/hr) 475 70% 315,767,027$ Residue (bbl/hr) 2486 -8% 1,478,780,213$
Profit Opportunity 19,268,000$
% change $/yearHot Utility (MMBtu/hr) 211 7% 14,793,888$ Cold Utility (MMBtu/hr) 52 -2% 9,236,264$ Naphtha (bbl/hr) 347 -1% 333,992,449$ Kerosene (bbl/hr) 342 -1% 284,260,491$ Diesel (bbl/hr) 550 7% 529,424,825$ Gas Oil (bbl/hr) 313 62% 208,310,047$ Residue (bbl/hr) 3451 -4% 2,052,408,576$
Profit Opportunity 18,624,000$
Invention 3
Page 17
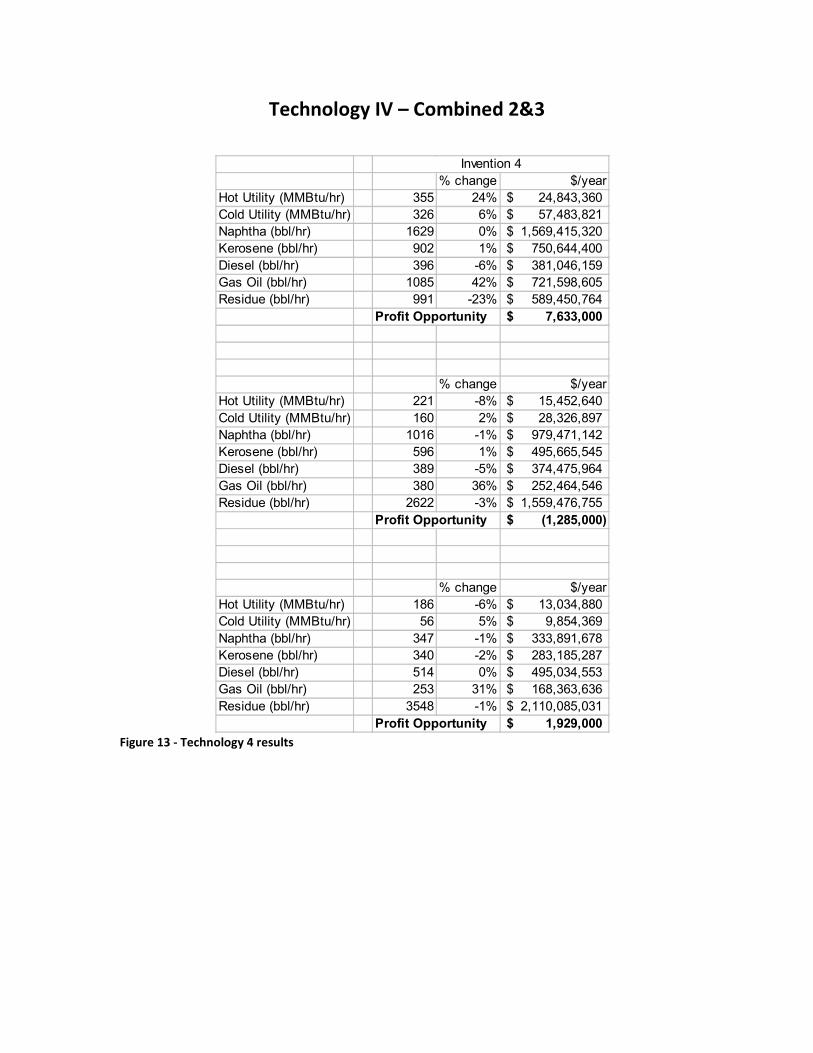
Technology IV – Combined 2&3
Figure 13 - Technology 4 results
% change $/yearHot Utility (MMBtu/hr) 355 24% 24,843,360$ Cold Utility (MMBtu/hr) 326 6% 57,483,821$ Naphtha (bbl/hr) 1629 0% 1,569,415,320$ Kerosene (bbl/hr) 902 1% 750,644,400$ Diesel (bbl/hr) 396 -6% 381,046,159$ Gas Oil (bbl/hr) 1085 42% 721,598,605$ Residue (bbl/hr) 991 -23% 589,450,764$
Profit Opportunity 7,633,000$
% change $/yearHot Utility (MMBtu/hr) 221 -8% 15,452,640$ Cold Utility (MMBtu/hr) 160 2% 28,326,897$ Naphtha (bbl/hr) 1016 -1% 979,471,142$ Kerosene (bbl/hr) 596 1% 495,665,545$ Diesel (bbl/hr) 389 -5% 374,475,964$ Gas Oil (bbl/hr) 380 36% 252,464,546$ Residue (bbl/hr) 2622 -3% 1,559,476,755$
Profit Opportunity (1,285,000)$
% change $/yearHot Utility (MMBtu/hr) 186 -6% 13,034,880$ Cold Utility (MMBtu/hr) 56 5% 9,854,369$ Naphtha (bbl/hr) 347 -1% 333,891,678$ Kerosene (bbl/hr) 340 -2% 283,185,287$ Diesel (bbl/hr) 514 0% 495,034,553$ Gas Oil (bbl/hr) 253 31% 168,363,636$ Residue (bbl/hr) 3548 -1% 2,110,085,031$
Profit Opportunity 1,929,000$
Invention 4
Page 18
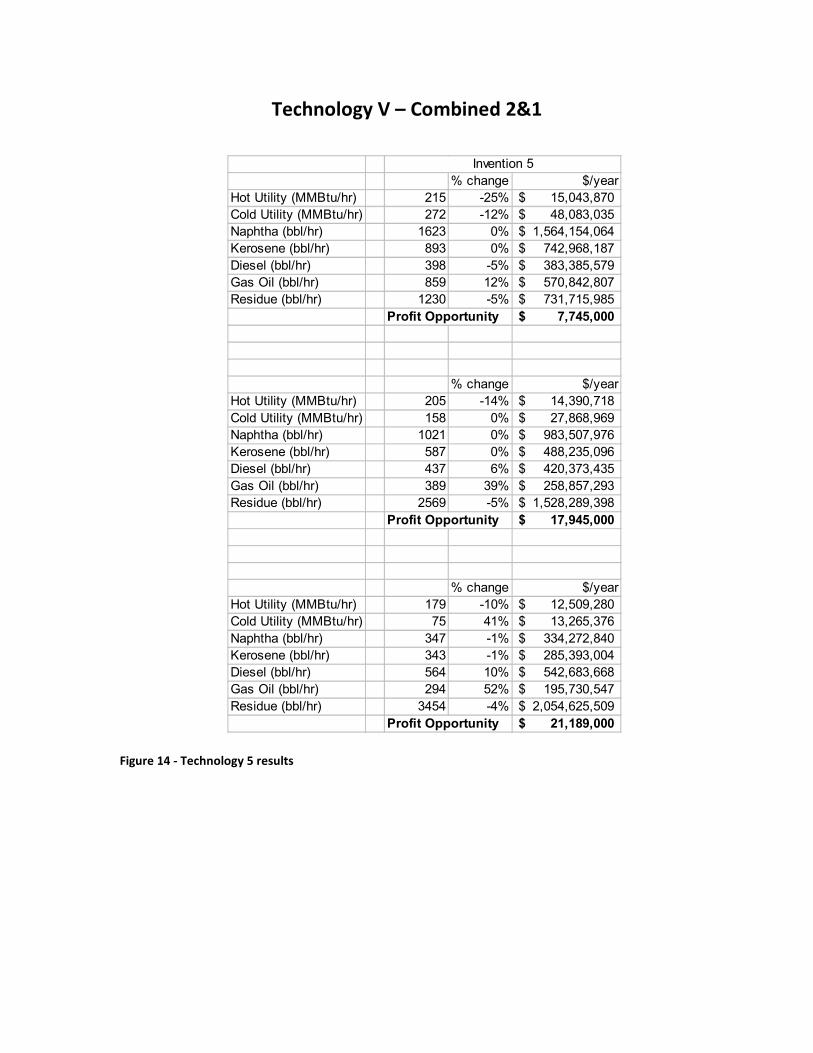
Technology V – Combined 2&1
Figure 14 - Technology 5 results
% change $/yearHot Utility (MMBtu/hr) 215 -25% 15,043,870$ Cold Utility (MMBtu/hr) 272 -12% 48,083,035$ Naphtha (bbl/hr) 1623 0% 1,564,154,064$ Kerosene (bbl/hr) 893 0% 742,968,187$ Diesel (bbl/hr) 398 -5% 383,385,579$ Gas Oil (bbl/hr) 859 12% 570,842,807$ Residue (bbl/hr) 1230 -5% 731,715,985$
Profit Opportunity 7,745,000$
% change $/yearHot Utility (MMBtu/hr) 205 -14% 14,390,718$ Cold Utility (MMBtu/hr) 158 0% 27,868,969$ Naphtha (bbl/hr) 1021 0% 983,507,976$ Kerosene (bbl/hr) 587 0% 488,235,096$ Diesel (bbl/hr) 437 6% 420,373,435$ Gas Oil (bbl/hr) 389 39% 258,857,293$ Residue (bbl/hr) 2569 -5% 1,528,289,398$
Profit Opportunity 17,945,000$
% change $/yearHot Utility (MMBtu/hr) 179 -10% 12,509,280$ Cold Utility (MMBtu/hr) 75 41% 13,265,376$ Naphtha (bbl/hr) 347 -1% 334,272,840$ Kerosene (bbl/hr) 343 -1% 285,393,004$ Diesel (bbl/hr) 564 10% 542,683,668$ Gas Oil (bbl/hr) 294 52% 195,730,547$ Residue (bbl/hr) 3454 -4% 2,054,625,509$
Profit Opportunity 21,189,000$
Invention 5
Page 19
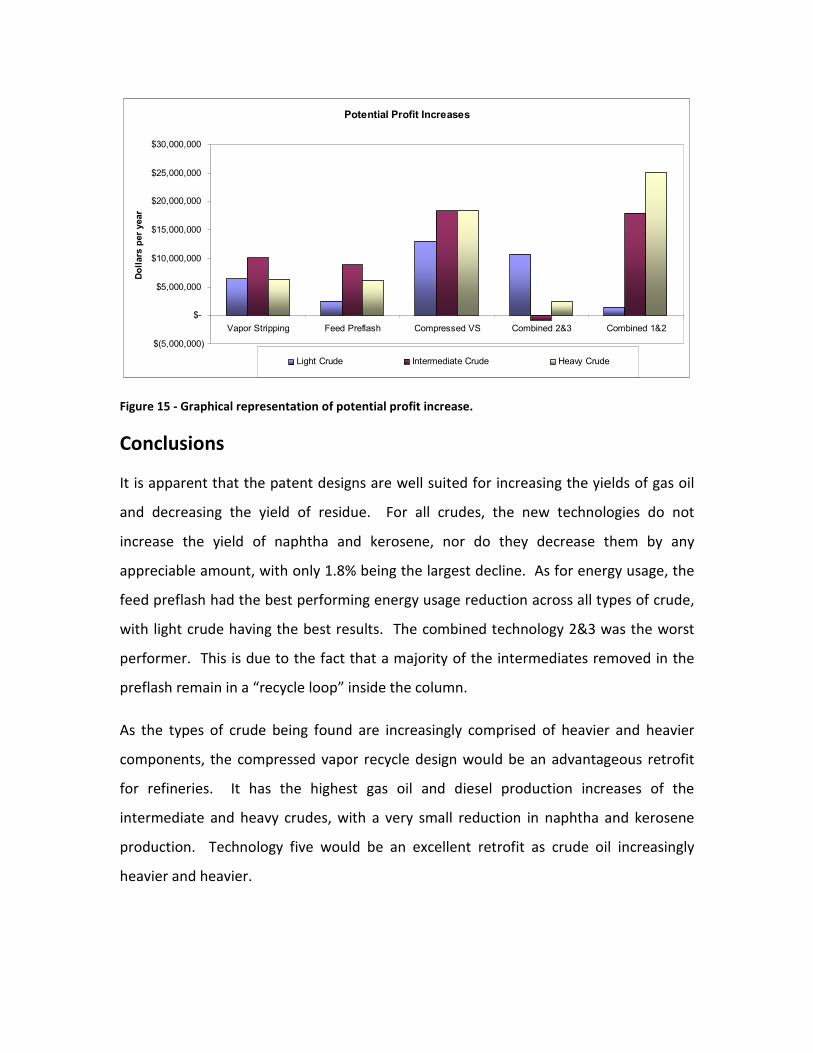
Figure 15 - Graphical representation of potential profit increase.
Conclusions
It is apparent that the patent designs are well suited for increasing the yields of gas oil
and decreasing the yield of residue. For all crudes, the new technologies do not
increase the yield of naphtha and kerosene, nor do they decrease them by any
appreciable amount, with only 1.8% being the largest decline. As for energy usage, the
feed preflash had the best performing energy usage reduction across all types of crude,
with light crude having the best results. The combined technology 2&3 was the worst
performer. This is due to the fact that a majority of the intermediates removed in the
preflash remain in a “recycle loop” inside the column.
As the types of crude being found are increasingly comprised of heavier and heavier
components, the compressed vapor recycle design would be an advantageous retrofit
for refineries. It has the highest gas oil and diesel production increases of the
intermediate and heavy crudes, with a very small reduction in naphtha and kerosene
production. Technology five would be an excellent retrofit as crude oil increasingly
heavier and heavier.
Potential Profit Increases
$(5,000,000)
$-
$5,000,000
$10,000,000
$15,000,000
$20,000,000
$25,000,000
$30,000,000
Vapor Stripping Feed Preflash Compressed VS Combined 2&3 Combined 1&2
Dollars per year
Light Crude Intermediate Crude Heavy Crude
Page 20
References
Bagajewicz, Miguel J. and Ji, Shuncheng. “Rigorous Procedure for the Design of
Conventional Atmospheric Crude Fractionation Units. Part I: Targeting”
United States Patent No. 7172686.
Energy Information Administration