47
New York State Dairy Statistics 2016 Annual Summary Andrew M. Cuomo Richard A. Ball Governor Commissioner Division of Milk Control and Dairy Services

New York State Dairy Statistics
2016
Annual Summary
Andrew M. Cuomo Richard A. Ball
Governor Commissioner
Division of Milk Control and Dairy Services

NUMBER OF MILK PLANTS BY TYPE & REGION JUNE 2016 P = PASTEURIZING M = MANUFACTURING
ORLEANS MONROE
ERIE
WAYNE
GENESEE
WYOMING LIVINGSTON
ONTARIO SENECA
CAYUGA YATES
CHAUTAUQUA ALLEGANY STEUBEN
SULLIVAN
CATTARAUGUS
SCHUYLERTOMPKINS
CHEMUNGTIOGA
OSWEGO
ONONDAGA
CORTLAND
BROOME
CHENANGO
JEFFERSON
LEWIS
FRANKLIN CLINTON
ESSEX
ST LAWRENCE
ONEIDA
HAMILTON
WARREN
FULTON SARATOGA
W A S H I N G T O N
MONTGOMERY
SCHENECTADY
OTSEGO SCHOHARIE
ALBANY
RENSSELAER
DELAWARE COLUMBIA
ULSTER DUTCHESS
PUTNAM
ORANGE
ROCKLAND
WESTCHESTER
BRONX NEW YORK
RICHMONDKINGS
QUEENSNASSAU
SUFFOLK
GREENE
NORTHERN P - 0 M - 9
EASTERN P - 10 M - 17
METRO NY P - 3 M - 23
WESTERN P - 8 M - 17
NIAGARA
MADISON
H E R K I M E R
CENTRAL P - 7 M - 17

NEW YORK STATE
DAIRY STATISTICS
NEW YORK STATE DEPARTMENT OF AGRICULTURE AND MARKETS
COMPILED AND ISSUED BY
DIVISION OF MILK CONTROL AND DAIRY SERVICES
JENNIFER TRODDEN, DEPUTY COMMISSIONER CASEY MCCUE, DIRECTOR
DAN MCCARTHY, PROGRAM MANAGER DAIRY SERVICES
PREPARED BY RESEARCH AND INFORMATION STAFF
DAVID DELCOGLIANO PROGRAM RESEARCH SPECIALIST II
STATE OF NEW YORK
DEPARTMENT OF AGRICULTURE AND MARKETS DIVISION OF MILK CONTROL AND DAIRY SERVICES
10B AIRLINE DRIVE ALBANY NY 12235

FOREWORD Statistical records of the New York State dairy industry have been published, in various forms, since 1892. From 1892 to 1917, tables of dairy statistics were published in annual reports of the Dairy Commission and of the Department of Agriculture and in separate bulletins prepared at irregular intervals. From 1918 to 1972, printed bulletins were regularly published entitled "Statistics Relative to the Dairy Industry in New York State". From 1973 until 1978 the bulletins were published under the title "New York Dairy Statistics". Beginning with the 1979 annual bulletin, the title has been modified slightly to "New York State Dairy Statistics". The 2016 Annual Summary follows the organizational format that was implemented in 1979. The report is divided into seven sections beginning with "General Dairy Statistics" which presents an overview of some of the major characteristics of the dairy industry in New York State. The remaining six sections deal in more detail with specific areas including receipts of milk and dairy products, payments to dairy farmers, fluid milk sales and manufactured dairy products. A great deal of the data presented in this bulletin is obtained from the monthly reports filed by milk handlers and processors operating an Article 21 license in New York State. These reports furnish an accounting of dairy receipts and utilization of milk and milk products together with related information, particularly payments and prices received by farmers. Market order statistics are obtained from reports published by the various orders. The cooperation of the many individuals, milk dealers, cooperative associations and public agencies, who have provided data and other assistance in the preparation of this publication, is gratefully acknowledged.
ii

TABLE OF CONTENTS
Page FOREWORD ii SECTION I - GENERAL DAIRY STATISTICS ................................................................................................................................... 1 Table 1 - Number of Cows, Production per Cow and Total Milk Production, New York State, 2006-2016 .................................. 2 Table 2 - Number of Dairy Farmers, Gross Farm Income and Average Gross Income per Farmer, New York State, 2006-2016 ......................................................................................................................................... 2 Table 3 Number of Dairy Cows, by County, New York State, January 1, 2013, 2014, 2015 2016 & 2017 .................................................................................................................................... 3 Table 4 - Milk Marketed, Payments Received by Farmers and Number of New York State Dairy Farmers, by Month, 2016 ............................................................................................................................................................ 4 Table 5 - Disposition of Milk Produced on Farms in New York State, 2012-2016 ....................................................................... 4 Table 6 - Number of New York Dairy Farms and Total Pounds of Milk Pooled by Market Orders, by County, May 2016 ........... 5 Table 7 - Number of Dairy Plants in New York State, by County and Type, June 2014, 2015 and 2016 .................................... 6 Table 8 - Number of Dairy Plants in New York State, by Type, 2005-2016 ................................................................................. 7 Table 9 - Utilization of Milk and Other Dairy Products at New York State Dairy Plants, 2006-2016 ............................................ 8 SECTION II - RECEIPTS AT NEW YORK PLANTS ......................................................................................................................... 9 Table 10 - Receipts of Milk and Milk Products at New York State Dairy Plants, by Month, 2016 ................................................ 10 Table 11 - Average Component Tests of Milk Produced by New York State Dairy Farmers, by Month, 2008-2016 ................................................................................................................................................................. 11 Table 12 - Number of Farmers and Receipts of Milk from Farmers and Plant Operators' Own Herds at New York State Dairy Plants, by Month, 2016 ........................................................................................................... 12 Table 13 - Number of Farmers and Receipts of Milk from Farmers and Plant Operators' Own Herds at New York State Dairy Plants, 2006-2016 ................................................................................................................... 12 Table 14 - Number of New York State Dairy Farmers Shipping Milk Directly from Farms to Out-of-State Plants and Pounds of Milk Shipped, by Month, 2016 ............................................................................................................ 13 Table 15 - Average number of New York State Dairy Farmers Shipping Milk Directly From Farms to Out-of-State Plants and Pounds of Milk Shipped Annually, 2006-2016 ..................................................................... 13 SECTION III - PAYMENTS TO NEW YORK DAIRY FARMERS ..................................................................................................... 14 Table 16 - Payments for Milk to New York State Dairy Farmers, by Month, 2016 ...................................................................... 15 Table 17 - Payments for Milk to New York State Dairy Farmers, 2006-2016 .............................................................................. 15 Table 18 - Prices paid to New York State Dairy Farmers, by Month, 2016 ................................................................................. 16 Table 19 - Prices paid to New York State Dairy Farmers, 2006-2016 ......................................................................................... 16 SECTION IV - FLUID MILK SALES ................................................................................................................................................. 17 Table 20 - Sales of Packaged Fluid Milk Products by New York Plants in New York State, by Month, 2016 ......................... 18-19 Table 21 - Sales of Packaged Fluid Milk Products by New York Plants in New York State, 2006-2016 ................................ 18-19 Table 22 - Total Packaged Fluid Milk Products Sold by New York Dairy Plants, 2016 ............................................................... 20 Table 23 - Total Sales of Packaged Fluid Milk Products in New York State, 2016 ..................................................................... 20 Table 24 - Annual Per Capita Sales of Fluid Milk Products in New York State, 2006-2016 ........................................................ 21 Table 25 - Total Sales of Packaged Fluid Milk Products in New York State, 2006-2016 ............................................................ 22 SECTION V - MANUFACTURED DAIRY PRODUCTS ................................................................................................................... 23 Table 26 - Number of Dairy Plants Manufacturing Specified Dairy Products in New York State, by Region and County, 2016 ...................................................................................................................................... 24 Table 27 - Dairy Products Manufactured in New York State Dairy Plants, by Month, 2016 ................................................... 25-29 Table 28 - Dairy Products Manufactured in New York State Dairy Plants, 2006-2016 ........................................................... 25-29 Table 29 - Selected Dairy Products Manufactured in New York State Dairy Plants, by Region, 2016 ........................................ 30 Table 30 - Milk, Cream, and Skim Used in Dairy Products Manufactured in New York State, by Region, 2016 ......................... 30 Table 31 - Milk and Milk Product Used in Dairy Products Manufactured in New York State, by Product, 2016 .......................... 31 Table 32 - Selected Dairy Products Manufactured in New York State Compared to Total United States Production, 2015-2016 ............................................................................................................................................... 32
iii

Page SECTION VI - OTHER DISPOSITION ........................................................................................................................................... 33 Table 33 - Utilization of Milk and Other Dairy Products at New York State Dairy Plants, by Month, 2016 .................................. 34 Table 34 - Utilization of Milk, Other Dairy Products and Butterfat at New York State Dairy Plants, 2016 ................................... 35 SECTION VII - MARKET ORDER STATISTICS ............................................................................................................................. 36 Table 35 - Utilization of Milk Received from Producers under the Northeast Federal Milk Marketing Order, by Class and Month, 2016 ......................................................................................................................................... 37 Table 36 - Utilization of Milk Received from Producers under the Federal Milk Marketing Order, by Class and Year, 2006-2016 ........................................................................................................................................................ 37 Table 37 - Class and Uniform Prices under the Northeast Federal Milk Marketing Order, by Month, 2015 and 2016 ................ 38 Table 38 - Uniform Price under the Federal Milk Marketing Order, 2006-2016 ........................................................................... 38 Table 39 - Producer Component Prices and Average Test of Producer Receipts under the Northeast Federal Milk Marketing Order, by Month, 2016 ....................................................................................................................... 39 Table 40 - Utilization of Milk Received from Producers under the Western New York Milk Marketing Order, by Class and Month, 2015 and 2016 ......................................................................................................................... 40 Table 41 - Class and Uniform Prices under the Western New York Milk Marketing Order, by Month, 2015 and 2016 ............... 40 CHARTS Figure 1 - Total Milk Production and Annual Average Production per Cow, New York State, 2006-2016 .................................... 1 Figure 2 - Number of Dairy Plants in New York State, by Type, June 2009-2016 ........................................................................ 7 Figure 3 - Number of Farmers Delivering Milk to New York Plants, 2006-2016 ........................................................................... 9 Figure 4 - Average Gross Price Paid to New York State Dairy Farmers for All Milk, 2006-2016 ................................................ 14 Figure 5 - Sales of Fluid Milk Products by New York Milk Plants in New York State, 2011-2016 ............................................... 17 Figure 6 - Annual Per Capita Sales of Fluid Milk Products in New York State, 2006-2016 ........................................................ 21 Figure 7 - Total Sales of Packaged Fluid Milk Products in New York State, 2006-2016 ............................................................ 22 Figure 8 - Cheese Manufactured in New York State Dairy Plants, 2011-2016 ........................................................................... 23 Figure 9 - Percent Total Milk, Cream, and Skim Used in Dairy Products Manufactured in New York State, by Region, 2016 ......................................................................................................................................................... 30 Figure 10 - Percentage Utilization of Milk and Milk Products at New York State Dairy Plants, 2016…………………………..……33 Figure 11 - Utilization of Milk Received From Producers under the Federal Milk Marketing Order, by Class 2007-2016 ................................................................................................................................................................. 36 Figure 12 - Producer Component Prices under the Northeast Federal Milk Marketing Order, by Month, 2016 ............................ 39
iv
In an effort to reduce the cost of printing
Electronic versions of this publication are
available on the Department’s web site at
http://www.agriculture.ny.gov

-1-
S E C T I O N I
G E N E R A L D A I R Y S T A T I S T I C S
FIGURE 1. TOTAL MILK PRODUCTION AND ANNUAL AVERAGE PRODUCTION PER COW,NEW YORK STATE, 2006 - 2016
0
5
10
15
20
25
30
MIL
K P
RO
DU
CT
ION
Production Per Cow (Thousand lbs.) Total Production (Billion lbs.)
-2-
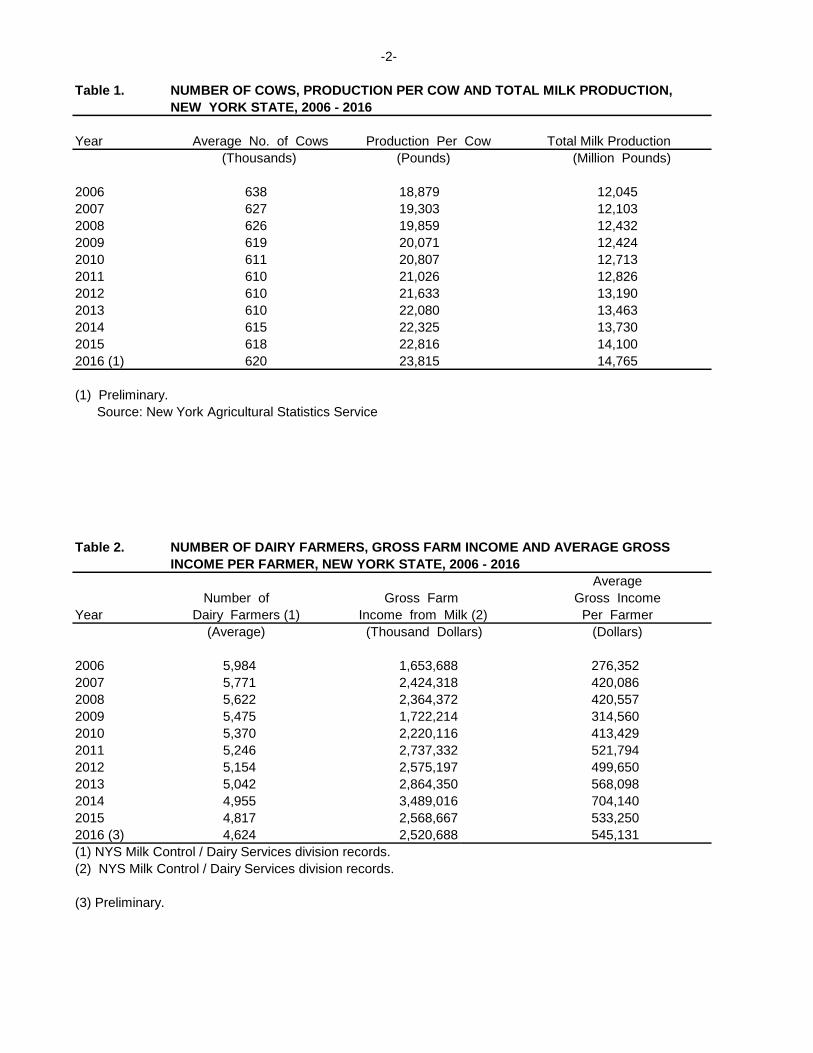
Table 1. NUMBER OF COWS, PRODUCTION PER COW AND TOTAL MILK PRODUCTION,
NEW YORK STATE, 2006 - 2016
Year Average No. of Cows Production Per Cow Total Milk Production
(Thousands) (Pounds) (Million Pounds)
2006 638 18,879 12,045
2007 627 19,303 12,103
2008 626 19,859 12,432
2009 619 20,071 12,424
2010 611 20,807 12,713
2011 610 21,026 12,826
2012 610 21,633 13,190
2013 610 22,080 13,463
2014 615 22,325 13,730
2015 618 22,816 14,100
2016 (1) 620 23,815 14,765
(1) Preliminary.
Source: New York Agricultural Statistics Service
Table 2. NUMBER OF DAIRY FARMERS, GROSS FARM INCOME AND AVERAGE GROSS
INCOME PER FARMER, NEW YORK STATE, 2006 - 2016
Average
Number of Gross Farm Gross Income
Year Dairy Farmers (1) Income from Milk (2) Per Farmer
(Average) (Thousand Dollars) (Dollars)
2006 5,984 1,653,688 276,352
2007 5,771 2,424,318 420,086
2008 5,622 2,364,372 420,557
2009 5,475 1,722,214 314,560
2010 5,370 2,220,116 413,429
2011 5,246 2,737,332 521,794
2012 5,154 2,575,197 499,650
2013 5,042 2,864,350 568,098
2014 4,955 3,489,016 704,140
2015 4,817 2,568,667 533,250
2016 (3) 4,624 2,520,688 545,131
(1) NYS Milk Control / Dairy Services division records.
(2) NYS Milk Control / Dairy Services division records.
(3) Preliminary.

-3-
Table 3. NUMBER OF DAIRY COWSBY COUNTY, NEW YORK STATE, JANUARY 1, 2013, 2014, 2015, 2016 & 2017
County Number of Cows2013 2014 2015 2016 2017
ALBANY 1,400 1,400 1,400 1,400 1,400ALLEGANY 8,300 8,400 8,400 8,500 8,500BROOME 4,900 5,000 5,000 5,100 5,100CATTARAUGUS 15,400 15,500 15,500 15,600 15,600CAYUGA 34,500 34,500 34,500 35,000 35,000CHAUTAUQUA 19,200 19,500 19,500 19,700 19,700CHEMUNG 1,900 1,900 1,900 1,900 1,900CHENANGO 12,100 12,200 12,200 12,300 12,300CLINTON 18,000 17,900 17,900 18,100 18,100COLUMBIA 5,500 5,500 5,500 5,600 5,600CORTLAND 10,300 10,400 10,400 10,500 10,500DELAWARE 8,500 8,600 8,600 8,700 8,700DUTCHESS 2,200 2,200 2,200 2,200 2,200ERIE 13,200 13,300 13,300 13,400 13,400ESSEX 1,600 1,600 1,600 1,600 1,600FRANKLIN 15,100 15,200 15,200 15,300 15,300FULTON 1,500 1,600 1,600 1,600 1,600GENESEE 29,000 29,000 29,000 29,500 29,500GREENE 600 600 600 600 600HERKIMER 13,100 13,200 13,200 13,300 13,300JEFFERSON 28,500 28,500 28,500 28,500 28,500LEWIS 27,000 27,500 27,500 27,500 27,500LIVINGSTON 22,000 22,000 22,000 22,000 22,000
MADISON 20,000 20,500 20,500 20,500 20,500MONROE 1,700 1,700 1,700 1,700 1,700MONTGOMERY 13,600 13,700 13,700 13,800 13,800NIAGARA 9,800 9,800 9,800 9,900 9,900ONEIDA 16,200 16,300 16,300 16,400 16,400ONONDAGA 19,000 19,300 19,300 19,500 19,500
ONTARIO 19,500 19,700 19,700 19,900 19,900ORANGE 3,700 3,800 3,800 3,800 3,800ORLEANS 2,300 2,300 2,300 2,300 2,300OSWEGO 2,300 2,300 2,300 2,300 2,300OTHER COUNTIES 200 100 100 100 100OTSEGO 10,500 10,600 10,600 10,700 10,700
RENSSELAER 4,100 4,100 4,100 4,100 4,100ROCKLAND (D) (D) (D) (D) (D)SARATOGA 8,300 8,400 8,400 8,500 8,500SCHENECTADY 300 300 300 300 300SCHOHARIE 5,300 5,300 5,300 5,400 5,400SCHUYLER 6,600 6,600 6,600 6,700 6,700SENECA 8,600 8,600 8,600 8,700 8,700ST LAWRENCE 33,500 34,000 34,000 34,500 34,500STEUBEN 21,000 21,000 21,000 21,000 21,000SUFFOLK (D) (D) (D) (D) (D)SULLIVAN 1,500 1,500 1,500 1,500 1,500TIOGA 6,400 6,500 6,500 6,600 6,600TOMPKINS 9,100 9,200 9,200 9,300 9,300
ULSTER 400 400 400 400 400
WARREN (D) (D) (D) (D) (D)
WASHINGTON 22,000 22,500 22,500 22,500 22,500
WAYNE 8,200 8,300 8,300 8,400 8,400
WESTCHESTER (D) 0 0 0 0
WYOMING 46,500 47,000 47,000 47,500 47,500
YATES 15,600 15,700 15,700 15,800 15,800
TOTAL 610,000 615,000 615,000 620,000 620,000
(D) Included in Other Counties
Source: New York Agricultural Statistics Service.

-4-
Table 4. MILK MARKETED, PAYMENTS RECEIVED BY FARMERS AND NUMBER OF NEW YORK STATEDAIRY FARMERS, BY MONTH, 2016
Pounds of Milk Marketed Plant Operators' Milk For Total Number of
Month Own Herds Payment Total Payments Dairy Farmers (Thousand Pounds) (Thous. $)
January 2,216 1,203,713 1,205,929 207,134 4,698February 2,424 1,134,912 1,137,336 193,512 4,684March 2,467 1,226,735 1,229,202 200,659 4,684April 2,381 1,208,170 1,210,551 197,774 4,666May 2,674 1,280,245 1,282,919 205,450 4,644June 2,472 1,239,023 1,241,496 198,413 4,638July 2,367 1,261,066 1,263,433 214,896 4,613August 2,706 1,239,012 1,241,718 218,465 4,625September 2,608 1,196,831 1,199,438 216,328 4,601October 2,690 1,220,038 1,222,728 215,534 4,572November 2,434 1,175,312 1,177,746 212,842 4,547December 2,349 1,221,332 1,223,681 239,681 4,518
Total / Avg 29,788 14,606,390 14,636,178 2,520,688 4,624
Table 5. DISPOSITION OF MILK PRODUCED ON FARMS IN NEW YORK STATE, 2012 - 2016
2012 2013 2014 2015 2016(Million Pounds)
Used on Farms: Fed to Calves: 30 35 40 45 50 Consumed as Fluid Milk, Cream & Butter 2 2 2 2 2Total Used on Farms 32 37 42 47 52
Total Sold by Farmers(2) 13,158 13,426 13,691 14,053 14,713Total Produced on Farms 13,190 13,463 13,733 14,100 14,765
Used on Farms 0.2 0.3 0.3 0.3 0.4Total Produced on Farms (3) 100.0 100.0 100.0 100.0 100.0
(1) Preliminary.(2) Includes milk sold by farmers at wholesale, milk sold by licensed producer-dealers and milk sold by farmers not requiring a milk dealer's license from the Division of Milk Control and Dairy Services.(3) May not total due to rounding. Source: New York Agricultural Statistics Service.

-5-
Table 6. NUMBER OF NEW YORK DAIRY FARMS AND TOTAL POUNDS OF MILK POOLEDBY MARKET ORDERS, BY COUNTY, MAY 2016 (1)
County Number of Farms Total Milk Marketed Milk Marketed Per Farm
May-16 May-16 May-15 (Thousand lbs) (Thousand lbs)
Albany 11 2,872 261Allegany 87 9,341 107Broome 34 13,331 392Cattaraugus 210 35,025 167Cayuga 92 93,678 1,018
Chatauqua 155 33,268 215Chemung 20 2,637 132Chenango 158 19,310 122Clinton 93 35,918 386Columbia 13 6,490 499
Cortland 96 24,695 257Delaware 98 12,135 124Dutchess 13 3,530 272Erie 87 27,066 311Essex 12 1,276 106
Franklin 122 30,223 248Fulton 12 1,600 133Genesee 68 62,963 926Greene 16 1,330 83Herkimer 137 23,939 175
Jefferson 168 60,421 360Lewis 179 51,610 288Livingston 62 57,520 928Madison 168 33,864 202Monroe 9 7,257 806
Montgomery 219 33,969 155Niagara 25 17,594 704Oneida 210 43,178 206Onondaga 71 50,797 715Ontario 102 49,193 482
Orange 42 6,125 146Orleans 21 4,143 197Oswego 34 5,482 161Otsego 153 16,277 106Rensselaer 43 22,920 533
St. Lawrence 316 69,408 220Saratoga 23 16,596 722Schenectady 6 637 106Schoharie 53 9,529 180Schuyler 14 14,884 1,063
Seneca 103 14,755 143Steuben 168 36,252 216Sullivan 21 2,064 98Tioga 64 11,641 182Tompkins 40 19,024 476
Ulster 4 407 102Washington 115 30,359 264Wayne 48 19,182 400Wyoming 143 100,730 704Yates 255 22,485 88Other Counties (2) 7 5,103 729
TOTAL / AVG 4420 1,274,032 288(1) 2015 data was collected from the Federal Milk Marketing Orders 1, 33 and the Western NY Milk Marketing Order and from Division records.
(2) Counties with fewer than 3 producers are restricted and have been consolidated into the "Other Counties" category.

-6-
Table 7. NUMBER OF DAIRY PLANTS IN NEW YORK STATE, BY COUNTY AND TYPE,JUNE 2014, 2015 and 2016
County (1) Pasteurizing Manufacturing Total2014 2015 2016 2014 2015 2016 2014 2015 2016
Albany 2 2 2 0 0 0 2 2 2Allegany 0 0 0 2 2 2 2 2 2Broome 0 0 0 0 0 1 0 0 1Cattaraugus 0 0 0 1 1 0 1 1 0Cayuga 1 1 1 2 2 2 3 3 3
Chautauqua 0 0 0 1 1 2 1 1 2Chenango 0 0 0 2 2 2 2 2 2Columbia 2 1 1 3 2 2 5 3 3Cortland 0 0 0 1 1 2 1 1 2Delaware 2 2 2 3 3 3 5 5 5
Dutchess 0 0 0 2 2 2 2 2 2Erie 3 3 3 4 4 4 7 7 7Franklin 0 0 0 2 2 2 2 2 2Fulton 0 0 0 3 3 3 3 3 3Genesee 0 1 1 4 4 4 4 5 5Greene 0 0 0 0 0 1 0 0 1
Herkimer 1 1 1 0 0 0 1 1 1Jefferson 0 0 0 2 2 3 2 2 3Lewis 0 0 0 2 2 2 2 2 2Madison 1 1 1 4 3 3 5 4 4Monroe 2 2 2 0 0 0 2 2 2
Montgomery 1 0 0 1 1 1 2 1 1Nassau 0 0 0 2 2 3 2 2 3Niagara 1 1 1 0 0 0 1 1 1Oneida 1 1 1 3 3 4 4 4 5Onondaga 2 2 2 1 1 1 3 3 3
Orange 0 0 0 1 1 2 1 1 2Otsego 0 0 0 1 1 1 1 1 1Rensselaer 1 1 1 0 0 0 1 1 1Rockland 1 1 1 0 0 0 1 1 1St Lawrence 0 0 0 2 2 2 2 2 2Saratoga 1 1 1 0 0 0 1 1 1
Schenectady 0 0 0 1 1 1 1 1 1Schoharie 0 0 0 1 1 1 1 1 1Schuyler 0 0 0 1 1 1 1 1 1Seneca 1 1 1 1 1 1 2 2 2Steuben 0 0 0 3 3 3 3 3 3Suffolk 1 1 1 2 2 2 5 3 3
Sullivan 1 1 1 1 1 1 2 2 2Tompkins 1 1 1 2 1 1 3 2 2Ulster 1 1 1 0 0 0 1 1 1Washington 1 1 1 2 2 1 3 3 2Yates 0 0 0 1 1 1 1 1 1Upst NY Total (2) 28 27 27 64 61 67 93 95 91Kings 0 0 0 5 4 4 5 5 4New York County 0 0 0 3 3 4 2 3 3Queens 1 1 1 7 6 8 8 7 9N.Y.C. Total 1 1 1 15 13 16 16 14 17
GRAND TOTAL 29 28 28 79 74 83 108 102 111
(1) Counties not shown do not have plants operating at this time.
(2) Includes Nassau and Suffolk Counties. Source: Division of Milk Control and Dairy Services.
-7-
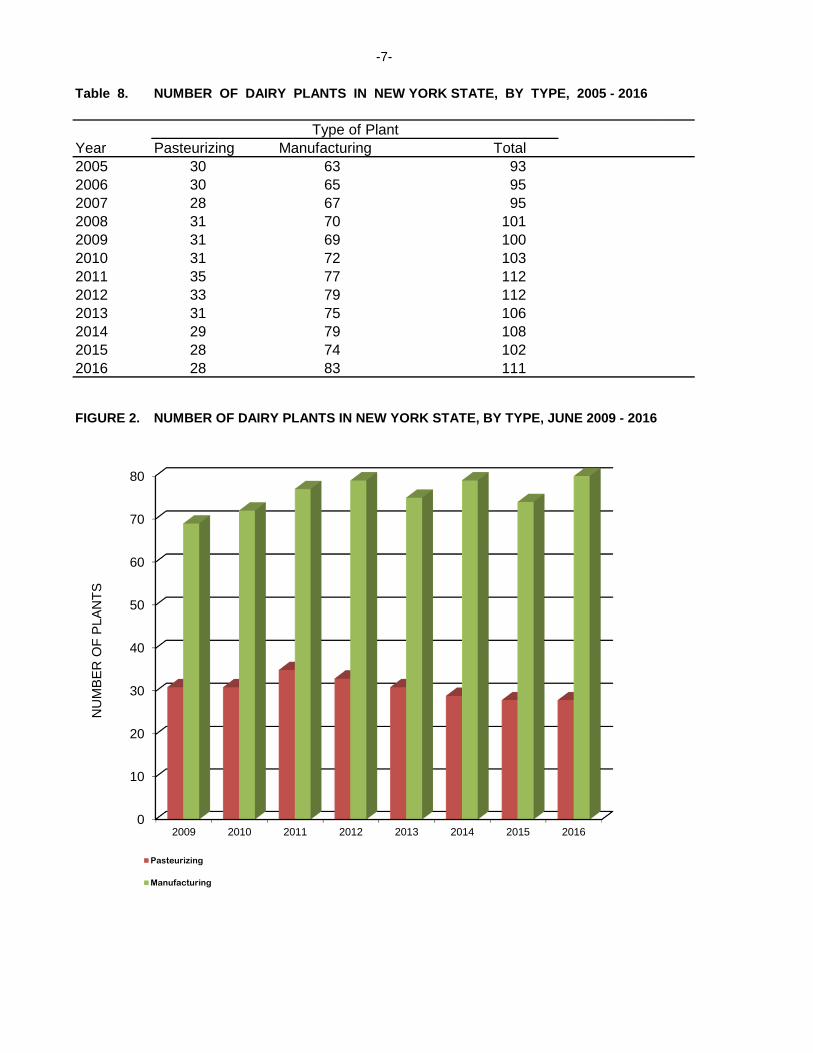
Table 8. NUMBER OF DAIRY PLANTS IN NEW YORK STATE, BY TYPE, 2005 - 2016
Type of PlantYear Pasteurizing Manufacturing Total2005 30 63 932006 30 65 952007 28 67 952008 31 70 1012009 31 69 1002010 31 72 1032011 35 77 1122012 33 79 1122013 31 75 1062014 29 79 1082015 28 74 1022016 28 83 111
FIGURE 2. NUMBER OF DAIRY PLANTS IN NEW YORK STATE, BY TYPE, JUNE 2009 - 2016
0
10
20
30
40
50
60
70
80
2009 2010 2011 2012 2013 2014 2015 2016
NU
MB
ER
OF
PLA
NT
S
Pasteurizing
Manufacturing

-8-
Table 9. UTILIZATION OF MILK AND OTHER DAIRY PRODUCTS AT
NEW YORK STATE DAIRY PLANTS, 2006 - 2016 (1)
Used for Sold Frozen Desserts
Fluid Mfg. in for Mfg. Food Proc.
Year Sales (2) NY Plants Out-of-State and Other (3) Total(Thousand Pounds)
2006 3,558,391 8,179,541 112,348 1,155,383 13,005,664
2007 3,502,732 8,419,698 135,422 1,280,710 13,338,562
2008 3,395,894 8,437,043 139,368 1,242,007 13,214,312
2009 3,380,809 8,698,406 134,271 1,383,787 13,597,273
2010 3,385,736 9,265,779 139,741 1,577,324 14,368,580
2011 3,389,348 9,863,846 166,897 1,904,961 15,325,052
2012 3,255,006 10,654,384 170,230 2,298,875 16,378,495
2013 3,153,530 10,869,353 217,785 2,673,940 16,914,608
2014 3,289,971 10,787,618 313,165 2,420,432 16,811,186
2015 3,241,910 11,364,075 345,210 2,289,382 17,240,577
2016 3,194,482 11,468,216 422,839 2,476,269 17,561,807
(1) Other dairy products include condensed and powdered skim, buttermilk, whey, WPC, whey cream, and other miscellaneous ingredients. Dried and condensed products are reported on a fluid equivalent basis. See Table 33 for monthly breakdown for current year.(2) Includes New York and out-of-state route sales of packaged fluid milk products and out-of-state shipments of bulk milk and packaged fluid milk products.(3) Includes both New York and out-of-state sales for use in Frozen Desserts, Food Processing, Animal Feed, Energy use and also includes dumped milk and dumped whey.

-9-
S E C T I O N I I
R E C E I P T S A T N E W Y O R K P L A N T S
FIGURE 3. NUMBER OF FARMERS DELIVERING MILK TO NEW YORK PLANTS 2006 - 2016
Note: Includes out-of-state farmers delivering to NYS plants.
3.400
3.500
3.600
3.700
3.800
3.900
4.000
4.100
4.200
4.300
4.400
4.500
2006 2007 2008 2009 2010 2011 2012 2013 2014 2015 2016
NUMBER OF FARMERS DELIVERING MILK TO NEW YORK STATE PLANTS
-10-
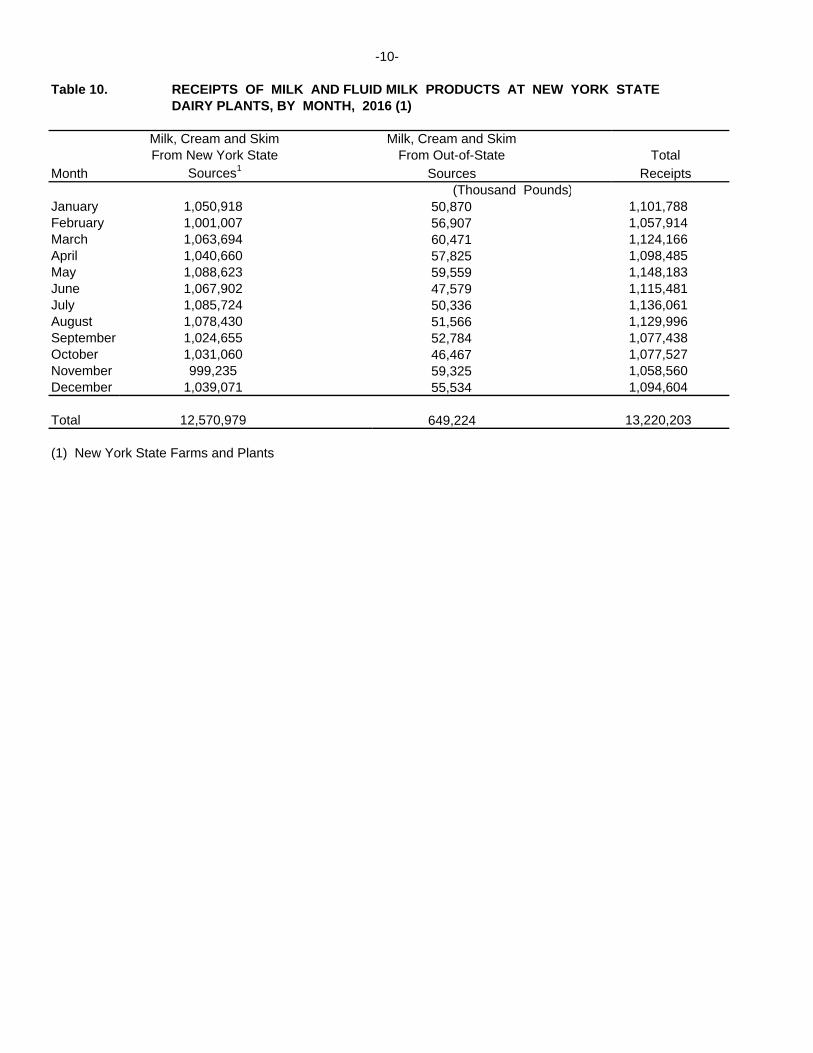
Table 10. RECEIPTS OF MILK AND FLUID MILK PRODUCTS AT NEW YORK STATEDAIRY PLANTS, BY MONTH, 2016 (1)
Milk, Cream and Skim Milk, Cream and SkimFrom New York State From Out-of-State Total
Month Sources1 Sources Receipts (Thousand Pounds)January 1,050,918 50,870 1,101,788 February 1,001,007 56,907 1,057,914 March 1,063,694 60,471 1,124,166 April 1,040,660 57,825 1,098,485 May 1,088,623 59,559 1,148,183 June 1,067,902 47,579 1,115,481 July 1,085,724 50,336 1,136,061 August 1,078,430 51,566 1,129,996 September 1,024,655 52,784 1,077,438 October 1,031,060 46,467 1,077,527 November 999,235 59,325 1,058,560 December 1,039,071 55,534 1,094,604
Total 12,570,979 649,224 13,220,203
(1) New York State Farms and Plants

-11-
Table 11. AVERAGE COMPONENT TESTS OF MILK PRODUCED BY NEW YORK STATEDAIRY FARMERS, BY MONTH, 2008 - 2016 (1)
Year Jan Feb Mar Apr May Jun Jul Aug Sep Oct Nov Dec Avg (2)Percent
Butterfat
2008 3.76 3.74 3.76 3.72 3.68 3.58 3.56 3.60 3.68 3.78 3.80 3.79 3.70
2009 3.78 3.76 3.73 3.69 3.65 3.62 3.59 3.59 3.65 3.76 3.75 3.76 3.69
2010 3.75 3.73 3.70 3.67 3.62 3.56 3.54 3.55 3.63 3.74 3.80 3.82 3.68
2011 3.79 3.78 3.76 3.73 3.66 3.58 3.56 3.57 3.65 3.72 3.78 3.79 3.70
2012 3.78 3.77 3.73 3.72 3.67 3.59 3.57 3.60 3.67 3.78 3.84 3.84 3.71
2013 3.83 3.83 3.81 3.78 3.71 3.67 3.62 3.68 3.74 3.82 3.91 3.91 3.78
2014 3.90 3.88 3.86 3.79 3.72 3.67 3.65 3.71 3.74 3.82 3.90 3.90 3.80
2015 3.91 3.93 3.89 3.81 3.73 3.68 3.68 3.59 3.71 3.84 3.86 3.85 3.79
2016 3.88 3.89 3.87 3.85 3.78 3.69 3.67 3.65 3.70 3.82 3.90 3.94 3.80Protein2011 3.12 3.15 3.09 3.05 3.02 2.99 2.96 2.99 3.05 3.12 3.13 3.12 3.062012 3.11 3.08 3.05 3.06 3.02 2.98 2.95 2.97 3.06 3.13 3.17 3.15 3.062013 3.13 3.13 3.11 3.16 3.04 3.00 2.96 3.02 3.07 3.15 3.19 3.18 3.102014 3.14 3.13 3.13 3.07 3.03 3.00 2.97 3.01 3.07 3.11 3.16 3.13 3.082015 3.13 3.14 3.11 3.07 3.02 2.99 2.98 3.07 3.03 3.15 3.17 3.15 3.082016 3.16 3.14 3.11 3.11 3.08 3.02 2.99 3.00 3.08 3.16 3.17 3.18 3.10Other Solids2011 5.73 5.73 5.74 5.75 5.75 5.72 5.71 5.70 5.72 5.72 5.71 5.72 5.722012 5.75 5.74 5.75 5.75 5.75 5.76 5.75 5.75 5.72 5.73 5.73 5.73 5.742013 5.74 5.74 5.74 5.75 5.77 5.73 5.72 5.73 5.72 5.70 5.70 5.70 5.732014 5.71 5.72 5.73 5.74 5.75 5.74 5.77 5.76 5.74 5.74 5.72 5.74 5.742015 5.73 5.74 5.73 5.75 5.77 5.76 5.75 5.77 5.81 5.74 5.73 5.74 5.752016 5.74 5.75 5.76 5.76 5.76 5.76 5.76 5.73 5.71 5.73 5.76 5.75 5.75 (1) Does not include receipts from plant operators' own herds. (2) Simple average.

-12-
Table 12. NUMBER OF FARMERS AND RECEIPTS OF MILK FROM FARMERS AND PLANTOPERATORS' OWN HERDS AT NEW YORK STATE DAIRY PLANTS, BY MONTH, 2016
Number of Farmers Farmer Milk Shipped Delivering Milk to NY Plants
Month In-State Out-of-State Total (Thousand Pounds)
January 3,736 84 3,820February 3,767 105 3,872March 3,693 86 3,779April 3,671 90 3,761May 3,626 94 3,720June 3,645 111 3,756July 3,643 96 3,739August 3,688 101 3,789September 3,667 105 3,772October 3,622 103 3,725November 3,513 93 3,606December 3,542 103 3,645
Total/Average 3,651 98 3,749
Table 13. NUMBER OF FARMERS AND RECEIPTS OF MILK FROM FARMERS AND PLANTOPERATORS' OWN HERDS AT NEW YORK STATE DAIRY PLANTS, 2006 - 2016
Number of Farmers Farmer Milk Shipped Delivering Milk to NY Plants
Year In-State Out-of-State Total (Number in June) (Thousand Pounds)
2006 4,164 78 4,2422007 4,197 168 4,3652008 3,946 107 4,0532009 3,905 114 4,0192010 3,913 108 4,0212011 4,010 100 4,1102012 3,945 107 4,0522013 3,869 97 3,9662014 3,843 85 3,9282015 3,761 76 3,8372016 3,645 111 3,756
972,172
ToNew York State Plants
977,328 927,529 989,303
8,615,410
1,022,001 994,406
1,011,523 1,001,990 960,973 974,029 943,217 968,459
11,742,930
ToNew York State Plants
11,252,434
8,804,4178,834,896
11,742,930
9,039,3909,571,2589,885,340
10,257,68010,652,67410,768,791

-13-
Table 14. NUMBER OF NEW YORK STATE DAIRY FARMERS SHIPPING MILK DIRECTLY FROM FARMS TO OUT-OF-STATE PLANTS AND POUNDS OF MILK SHIPPED, BY MONTH, 2016
Shipping To New England Shipping To Other States Total No. of Lbs. of No. of Lbs. of No. of Lbs. of
Month Farmers Milk Farmers Milk Farmers Milk (Thous. Lbs) (Thous. Lbs) (Thous. Lbs)
January 507 120,909 455 114,885 962 235,793 February 479 108,349 438 108,648 917 216,997 March 497 123,449 494 125,251 991 248,700 April 497 113,170 498 127,260 995 240,430 May 509 131,672 509 137,884 1,018 269,556 June 472 117,013 521 138,856 993 255,869 July 462 117,425 508 142,425 970 259,850 August 430 113,570 507 134,028 937 247,598 September 418 109,629 516 135,549 934 245,178 October 441 116,846 509 139,697 950 256,543 November 485 126,268 549 139,772 1,034 266,040 December 502 134,183 474 129,397 976 263,581
Total/Avg 475 1,432,483 498 1,573,653 973 3,006,136
Table 15. NUMBER OF NEW YORK STATE DAIRY FARMERS SHIPPING MILK IN JUNE DIRECTLY FROMFARMS TO OUT-OF-STATE PLANTS AND POUNDS OF MILK SHIPPED ANNUALLY, 2006- 2016
Shipping To New England Shipping To Other States Total No. of Lbs. of No. of Lbs. of No. of Lbs. of
Year Farmers Milk Farmers Milk Farmers Milk (Avg) (Thous. Lbs) (Avg) (Thous. Lbs) (Avg) (Thous. Lbs)
2006 831 1,505,095 998 1,900,631 1,829 3,405,7262007 777 1,558,123 848 1,673,323 1,625 3,231,4462008 819 1,606,802 878 1,936,016 1,697 3,542,8182009 694 1,387,024 896 1,934,935 1,590 3,321,9592010 585 1,234,856 891 1,899,191 1,476 3,134,0472011 591 1,283,442 641 1,673,766 1,232 2,957,2082012 633 1,458,446 551 1,488,850 1,183 2,947,2962013 555 1,319,954 529 1,521,342 1,084 2,841,2962014 629 1,534,946 464 1,436,350 1,092 2,971,2962015 595 1,559,351 436 1,260,605 1,030 2,819,9562016 475 1,432,483 498 1,573,653 973 3,006,136

-14-
S E C T I O N I I I
P A Y M E N T S T O N E W Y O R K
D A I R Y F A R M E R S
FIGURE 4. AVERAGE GROSS PRICE PAID TO NEW YORK STATE DAIRY FARMERSFOR ALL MILK, 2006 - 2016
$11
$13
$15
$17
$19
$21
$23
$25
$27
2006 2007 2008 2009 2010 2011 2012 2013 2014 2015 2016
PR
ICE
P
ER
H
UN
DR
ED
WE
IGH
T
Gross Price Paid For All Milk
(Annual Average)

-15-
Table 16. PAYMENTS FOR MILK TO NEW YORK STATE DAIRY FARMERS, BY MONTH, 2016 (1) Payments for Milk Based on Multiple Components
Producer Price Total Butterfat Protein Other Solids Differential Special Payments
Month Value Value Value Value Premiums (2) For All Milk (3) (Thousand Dollars)
January 104,903 67,169 2,493 12,459 12,047 207,134 February 102,522 60,502 3,132 9,604 11,366 193,512 March 101,697 71,313 3,440 4,068 12,092 200,659 April 101,363 67,557 3,457 7,176 11,880 197,774 May 107,047 57,034 3,833 16,219 11,957 205,450 June 107,098 53,732 4,358 12,813 11,487 198,413 July 116,861 70,088 5,463 2,760 11,242 214,896 August 109,349 93,017 6,084 -8,640 10,115 218,465 September 99,291 91,868 7,289 -612 9,896 216,328 October 92,060 85,258 9,086 7,997 10,864 215,534 November 93,716 101,670 11,506 -13,407 10,631 212,842 December 109,058 100,844 14,004 -5,818 11,161 239,681
Total 1,244,965 920,052 74,145 44,619 134,737 2,520,688
(1) The figures in this table represent payments to all New York dairy farmers including those that ship their milk to other states.(2) Includes such premiums as quality, protein, volume and base competitive plus cooperative dividends.(3) Includes payments made on flat rate basis.
Table 17. PAYMENTS FOR MILK TO NEW YORK STATE DAIRY FARMERS, 2006 - 2016 (1) (Thousand Dollars)
Payments for Milk Based on Multiple Components
Producer Price Total Butterfat Protein Other Solids Differential Special Payments
Value Value Value Value Premiums (2) For All Milk (3)2006 580,478 748,450 119,641 109,001 78,859 1,653,688 2007 636,255 1,264,096 288,134 126,724 90,302 2,424,318 2008 705,713 1,441,156 44,488 62,359 106,967 2,364,372 2009 565,175 817,889 46,986 118,513 132,920 1,722,214 2010 848,512 875,882 130,668 222,996 117,222 2,220,116 2011 999,587 1,135,342 250,853 197,379 124,125 2,737,332 2012 824,342 1,197,361 302,966 59,697 146,540 2,575,197 2013 824,992 1,337,191 304,167 193,196 142,553 2,864,350 2014 1,196,093 1,548,370 357,359 152,863 124,689 3,489,016 2015 1,179,201 920,584 146,536 81,324 134,015 2,568,667 2016 1,244,965 920,052 74,145 44,619 134,737 2,520,688
(1) through (3) : See footnotes in Table 16.

-16-
Table 18. PRICES PAID TO NEW YORK STATE DAIRY FARMERS, BY MONTH, 2016 (1)
Payments for Milk Based on Multiple Components Avg. Gross Producer Price Price Paid
Butterfat Protein Other Solids Differential Special for allMonth Value Value Value Value Premiums (2) Milk (3)
Dollars Per 100 lbs
January 8.956 5.735 0.213 1.064 1.001 $17.208February 9.260 5.465 0.283 0.867 1.001 $17.051March 8.527 5.979 0.288 0.341 0.986 $16.357April 8.608 5.737 0.294 0.609 0.983 $16.370May 8.646 4.607 0.310 1.310 0.934 $16.048June 8.902 4.466 0.362 1.065 0.927 $16.014July 9.531 5.716 0.446 0.225 0.891 $17.041August 9.080 7.724 0.505 -0.717 0.816 $17.632September 8.543 7.904 0.627 -0.053 0.827 $18.075October 7.838 7.259 0.774 0.681 0.890 $17.666November 8.214 8.912 1.008 -1.175 0.905 $18.109December 9.237 8.541 1.186 -0.493 0.914 $19.625Average (4) 8.781 6.489 0.523 0.315 0.922 17.257
(1) through (3) : See footnotes in Table 16.(4) Weighted average.
Table 19. PRICES PAID TO NEW YORK STATE DAIRY FARMERS, 2006 - 2016(1)
(Dollars Per 100 Lbs.)
Payments for Milk Based on Multiple Components Avg. Gross
Producer Price Price Paid Butterfat Protein Other Solids Differential Special for all
Value Value Value Value Premiums (2) Milk (3)2006 4.894 6.311 1.009 0.919 0.665 13.8502007 5.363 10.654 2.429 1.068 0.756 20.2902008 5.791 11.827 0.365 0.512 0.878 19.2802009 4.659 6.743 0.387 0.977 1.210 14.0392010 6.799 7.018 1.047 1.787 0.930 17.6102011 7.952 9.031 1.995 1.570 0.975 21.5112012 6.399 9.294 2.352 0.463 1.119 19.6692013 6.288 10.192 2.318 1.472 1.065 21.4072014 9.006 11.658 2.691 1.151 0.914 25.5722015 8.680 6.776 1.079 0.599 0.960 18.3492016 8.781 6.489 0.523 0.315 0.922 17.257
(1) through (3) : See footnotes in Table 16.

-17-
S E C T I O N I V
F L U I D M I L K S A L E S
FIGURE 5. SALES OF FLUID MILK PRODUCTS BY NEW YORK MILK PLANTS IN NEW YORK STATE, 2011 - 2016
0
10
20
30
40
50
60
2011 2012 2013 2014 2015 2016
PE
RC
EN
TA
GE
OF
TO
TA
L S
AL
ES
Wholemilk LFM/Skm Flavored Crm/Half & Half

-18-
Table 20. SALES OF PACKAGED FLUID MILK PRODUCTS BY NEW YORK PLANTSIN NEW YORK STATE, BY MONTH, 2016
FlavoredLowfat Skim Flavored Milk
Month Whole Milk(1) Milk(2) Milk Milk(3) Drinks(4) Buttermilk (Thousand Pounds)
January 51,343 59,243 18,427 1,022 9,838 534February 48,617 55,486 17,617 1,187 8,900 600March 50,509 57,549 18,569 1,239 10,581 819April 50,129 55,379 18,863 1,102 9,284 591May 50,665 56,392 18,023 1,141 10,368 695June 48,263 52,021 17,399 1,087 7,029 688July 48,505 50,471 15,172 1,460 4,224 646August 49,333 51,778 15,342 1,722 4,068 701September 46,493 54,457 17,212 1,994 9,593 663October 41,566 48,697 14,929 1,910 6,718 769November 43,934 49,882 14,698 1,358 6,351 985December 46,141 52,008 15,099 1,135 6,179 787
Total (5) 575,498 643,362 201,350 16,358 93,133 8,479 (1) Includes standardized milk - minimum butterfat content 3.25%. (2) Includes 1% and 2% lowfat milk. (3) 3.0% butterfat or more. (4) 2.0% butterfat or less. (5) Numbers may not total due to rounding.
Table 21. SALES OF PACKAGED FLUID MILK PRODUCTS BY NEW YORK PLANTSIN NEW YORK STATE, 2006 - 2016
FlavoredLowfat Skim Flavored Milk
Year Whole Milk(1) Milk(2) Milk Milk(3) Drinks(4) Buttermilk (Thousand Pounds)
2006 804,515 891,948 367,121 17,119 140,378 9,8502007 762,210 897,325 370,957 15,593 134,342 9,8802008 696,730 918,337 372,302 12,639 132,557 8,3152009 657,223 887,244 354,276 11,221 134,194 7,5792010 637,468 843,781 328,067 11,268 132,377 7,5542011 626,344 839,402 331,338 10,436 123,225 8,0282012 584,132 794,685 307,051 10,531 108,539 8,2902013 557,617 728,190 261,468 11,099 101,375 8,4462014 617,092 726,162 243,832 11,769 99,751 8,7602015 605,162 719,641 221,116 12,237 100,426 9,5892016 575,498 643,362 201,350 16,358 93,133 8,479 (1) Includes standardized milk - minimum butterfat content 3.25%. (2) Includes 1% and 2% lowfat milk. (3) 3.0% butterfat or more. (4) 2.0% butterfat or less.

-19-
Table 20. SALES OF PACKAGED FLUID MILK PRODUCTS BY NEW YORK PLANTS (con't) IN NEW YORK STATE, BY MONTH, 2016
Total Excluding Half Total Total Misc. Fluid Cream and and Cream and Fluid Milk
Month Products(1) Half & Half Cream (2) Half Half & Half Products (Thousand Pounds)
January 2,569 142,977 3,955 5,231 9,186 152,163February 2,308 134,716 4,130 5,488 9,619 144,334March 2,113 141,379 4,892 5,158 10,050 151,429April 2,025 137,372 3,298 5,175 8,472 145,844May 1,113 138,397 4,522 6,252 10,775 149,172June 2,071 128,557 4,286 6,109 10,394 138,952July 1,120 121,597 4,174 5,785 9,959 131,556August 729 123,674 4,246 5,828 10,074 133,748September 613 131,025 3,913 5,155 9,068 140,094October 943 115,531 4,492 5,792 10,284 125,815November 1,289 118,498 5,168 6,361 11,528 130,026December 1,311 122,660 5,104 6,280 11,384 134,043
Total (3) 18,204 1,556,383 52,179 68,614 120,793 1,677,177 (1) Includes miscellaneous products such as eggnog, fatfree half&half, dietary products or shake drinks.(2) Includes Light Cream, Light Whipping Cream and Heavy Cream.(3) Numbers may not total due to rounding.
Table 21. SALES OF PACKAGED FLUID MILK PRODUCTS BY NEW YORK PLANTS (con't) IN NEW YORK STATE, 2006 - 2016
Total Excluding Half Total Total Misc. Fluid Cream and and Cream and Fluid Milk
Year Products(1) Half & Half Cream(2) Half Half & Half Products(Thousand Pounds)
2006 5,253 2,236,184 28,122 64,731 92,854 2,329,037 2007 5,197 2,195,503 21,463 53,019 74,482 2,269,985 2008 6,058 2,146,938 26,220 67,684 93,904 2,240,842 2009 4,310 2,056,047 27,216 58,785 86,000 2,142,048 2010 4,771 1,965,286 23,600 56,726 80,325 2,045,611 2011 6,994 1,945,768 25,376 53,790 79,166 2,024,934 2012 8,949 1,822,177 25,820 48,637 74,457 1,896,634 2013 8,648 1,676,844 42,902 56,693 99,596 1,776,440 2014 9,066 1,716,432 58,220 67,431 125,651 1,842,083 2015 5,820 1,673,991 63,162 80,932 144,094 1,818,085 2016 18,204 1,556,383 52,179 68,614 120,793 1,677,177 (1) Includes miscellaneous products such as eggnog, fatfree half&half, dietary products or shake drinks.(2) Includes Light Cream, Light Whipping Cream and Heavy Cream.(3) Previously included in Flavored Milk Drinks, Cream and Half & Half.

-20-
Table 22. TOTAL PACKAGED FLUID MILK PRODUCTS SOLD BY NEW YORK DAIRYPLANTS, 2016 (1)
Product Product Weight Butterfat Butterfat Test (Thousand Pounds) Percent
Whole Milk (2) 926,727 30,442 3.28Lowfat Milk (3) 1,102,572 16,652 1.51Skim Milk 387,602 482 0.12Flavored Milk 17,629 623 3.53Flavored Milk Drinks 116,018 688 0.59Buttermilk 19,096 223 1.17Half and Half 237,167 25,087 10.58Light Cream 36,907 6,692 18.13Light Whipping Cream 2,436 747 30.67Heavy Cream 129,596 48,370 37.32Miscellaneous (4) 37,098 1,084 2.92
Total/Average 3,012,848 131,088 4.35
(1) Includes route sales in other states.(2) Includes standardized milk - minimum butterfat content 3.25%.(3) Includes milk with 1% and 2% butterfat.(4) Includes miscellaneous products such as eggnog, fatfree half&half, dietary products or shake drinks.
Table 23. TOTAL SALES OF PACKAGED FLUID MILK PRODUCTS IN NEW YORK STATE, 2016
Sales by Sales by New York State Out-of-State Total Sales in
Product Milk Plants Milk Dealers New York State (Thousand Pounds)
Whole Milk (1) 575,498 578,493 1,153,991Lowfat Milk (2) 643,362 528,381 1,171,743Skim Milk 201,350 150,124 351,474Flavored Milk 16,358 11,530 27,888Flavored Milk Drinks 93,133 69,866 162,999Buttermilk 8,479 4,357 12,835Half and Half 68,614 80,371 148,986Light Cream 19,440 22,403 41,843Light Whipping Cream 212 1,150 1,361Heavy Cream 32,528 27,842 60,370Miscellaneous (3) 18,204 18,911 37,115
Total (4) 1,677,177 1,493,428 3,170,605
(1) Includes standardized milk - minimum butterfat content 3.25%. (2) Includes milk with 1% and 2% butterfat. (3) Includes miscellaneous products such as eggnog, fatfree half&half, dietary products or shake drinks. (4) Numbers may not add due to rounding.

-21-
Table 24. ANNUAL PER CAPITA SALES OF FLUID MILK PRODUCTS IN NEW YORK STATE2006 - 2016 (1)
Flv. Mlk/DrkWhole Lowfat Skim Buttermilk Cream
Year Population(2) Milk (3) Milk(4) Milk & Misc. Half & Half TotalPounds Per Capita
2006 19,367,028 68.5 66.0 28.2 12.0 10.8 185.52007 19,429,316 65.8 67.6 29.0 12.0 10.0 184.42008 19,490,297 61.7 69.1 29.0 12.0 11.0 182.72009 19,541,453 58.4 69.0 28.9 12.0 10.8 179.12010 19,378,102 57.9 69.1 28.2 12.7 10.9 178.72011 19,465,197 58.0 68.1 28.1 12.5 11.3 178.12012 19,570,261 57.8 68.2 27.5 11.8 12.3 177.62013 19,651,127 56.7 64.8 24.5 12.6 14.1 172.62014 19,746,227 55.9 62.4 21.8 11.9 13.6 165.62015 19,795,791 55.6 61.1 19.2 11.3 14.2 161.42016 19,745,289 58.4 59.3 17.8 12.2 12.8 160.6
(1) Total fluid sales are shown in Table 23.(2) Source: United States Department of Commerce, Bureau of Census.
(3) Includes standardized milk - minimum butterfat content 3.25% (4) Includes milk with 1% and 2% butterfat.
FIGURE 6. ANNUAL PER CAPITA SALES OF FLUID MILK PRODUCTS IN NEW YORKSTATE, 2006 - 2016
NOTE: Total includes Milk, Lowfat, Skim, Flavored Milk/Drink, Buttermilk, Cream, Half & Half and Misc.
0
20
40
60
80
100
120
140
160
180
200
2006 2007 2008 2009 2010 2011 2012 2013 2014 2015 2016
PO
UN
DS
P
ER
C
AP
ITA
Whole Milk
Lowfat Milk
Skim Milk
Total
-22-
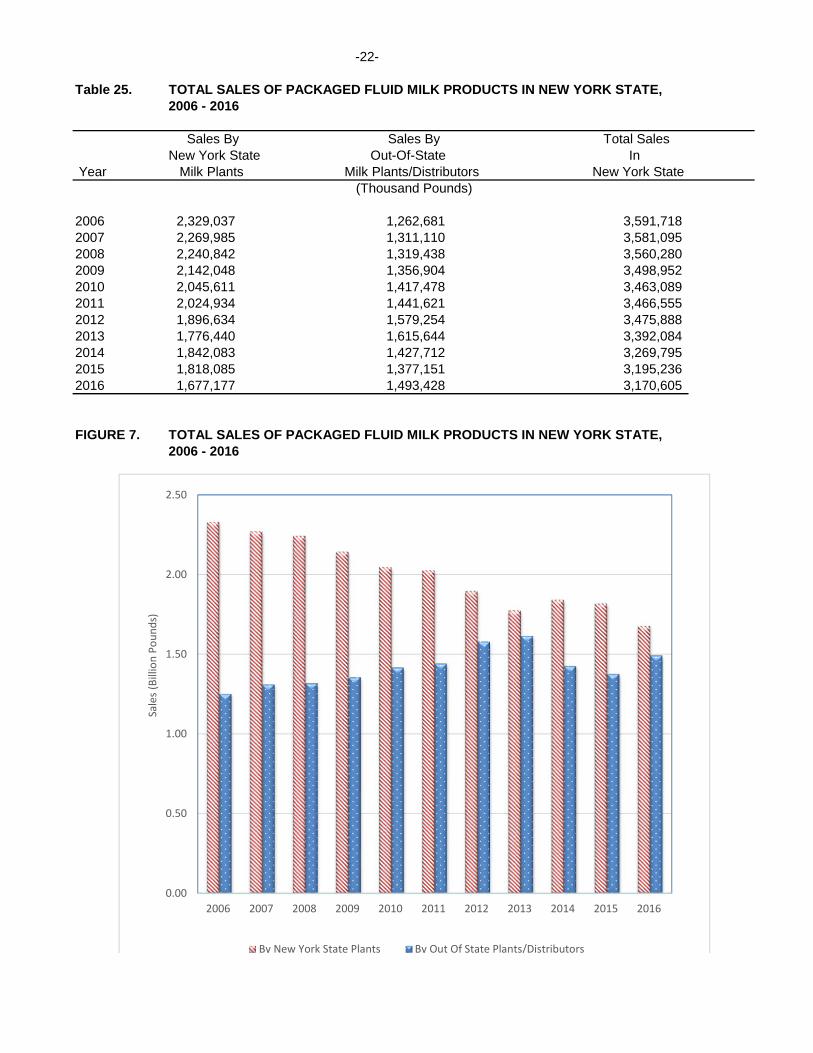
Table 25. TOTAL SALES OF PACKAGED FLUID MILK PRODUCTS IN NEW YORK STATE,2006 - 2016
Sales By Sales By Total SalesNew York State Out-Of-State In
Year Milk Plants Milk Plants/Distributors New York State(Thousand Pounds)
2006 2,329,037 1,262,681 3,591,718 2007 2,269,985 1,311,110 3,581,095 2008 2,240,842 1,319,438 3,560,280 2009 2,142,048 1,356,904 3,498,952 2010 2,045,611 1,417,478 3,463,089 2011 2,024,934 1,441,621 3,466,555 2012 1,896,634 1,579,254 3,475,888 2013 1,776,440 1,615,644 3,392,084 2014 1,842,083 1,427,712 3,269,795 2015 1,818,085 1,377,151 3,195,236 2016 1,677,177 1,493,428 3,170,605
FIGURE 7. TOTAL SALES OF PACKAGED FLUID MILK PRODUCTS IN NEW YORK STATE,2006 - 2016
0.00
0.50
1.00
1.50
2.00
2.50
2006 2007 2008 2009 2010 2011 2012 2013 2014 2015 2016
Sales (Billion Pounds)
By New York State Plants By Out Of State Plants/Distributors

-23-
S E C T I O N V
M A N U F A C T U R E D D A I R Y P R O D U C T S
FIGURE 8. CHEESE MANUFACTURED IN NEW YORK STATE DAIRY PLANTS, 2011 - 2016
0
60
120
180
240
300
360
420
PR
OD
UC
TIO
N (
mill
ion
po
un
ds)
Italian Cottage Cream Cheese American Other

-24-
Table 26. NUMBER OF DAIRY PLANTS MANUFACTURING SPECIFIED DAIRY PRODUCTS INNEW YORK STATE, BY REGION AND COUNTY, 2016 (1)
Region Condensedand American Italian Cottage Other Milk All Dry Cultured
County (2) Butter Cheese(3) Cheese Cheese(4) Cheese(5) Products Products Products
NORTHERN REGION Franklin 0 2 0 0 2 0 0 0 Jefferson 0 1 0 1 1 1 1 1 Lewis 0 1 0 0 1 1 0 0 St. Lawrence 0 0 1 0 0 0 0 1 Total Region 0 4 1 1 4 2 1 2
WESTERN REGION Allegany 0 0 1 1 1 0 1 1 Cattaraugus 0 0 1 0 0 0 0 0 Chautauqua 0 0 1 0 0 0 0 0 Erie 0 0 1 1 0 0 1 1 Genesee 2 1 0 0 1 1 1 1 Monroe 1 0 0 0 0 0 0 0 Seneca 0 1 0 0 1 0 0 2 Steuben 0 1 2 1 1 0 1 1 Yates 0 0 0 0 0 0 0 1 Total Region 3 3 6 3 4 1 4 7
CENTRAL REGION Broome 0 0 0 0 1 0 0 1 Cayuga 1 1 0 1 1 1 1 0 Chenango 0 0 0 0 0 0 0 2 Cortland 0 0 0 0 1 0 0 1 Madison 1 0 0 0 2 0 0 1 Oneida 1 2 0 1 1 0 0 2 Onondaga 0 1 1 0 1 0 0 1 Schuyler 0 1 0 0 1 0 1 0 Tompkins 0 1 0 0 1 0 0 2 Total Region 3 6 1 2 9 1 2 10
EASTERN REGION Columbia 1 1 1 1 1 0 0 2 Delaware 0 0 0 1 2 1 0 1 Dutchess 0 0 0 0 2 0 0 0 Fulton 0 0 0 0 1 0 0 1 Montgomery 0 1 0 0 0 0 0 0 Otesego 0 0 0 0 1 0 0 0 Schenectady 0 0 1 0 0 0 0 0 Schoharie 1 0 0 0 0 0 0 1 Sullivan 0 1 1 1 1 0 0 1 Ulster 0 0 0 0 0 0 0 1 Washington 0 0 0 0 1 0 0 0 Total Region 2 3 3 3 9 1 0 7
METRO NY REGION Kings 0 0 0 0 1 0 0 1 Nassau 0 0 0 0 1 0 0 0 Orange 0 0 0 0 1 0 0 1 Queens 0 0 0 0 2 0 0 3 Rockland 1 0 1 1 1 0 0 1 Suffolk 0 1 0 0 2 0 0 1 New York City 0 0 0 0 1 0 0 1 Total Region 1 1 1 1 9 0 0 8GRAND TOTAL 9 17 12 10 35 5 7 34(1) Includes plants that are classified as pasteurizing plants but also produce some manufactured products.(2) Counties not shown do not have plants producing specified products at this time. Chart on inside front cover shows counties in each region.(3) Includes Cheddar, Colby, Washed Curd, Stirred Curd, Monterey Jack.(4) Includes Baker's Cheese
(5) Includes Swiss, Farmers, Brick, Spanish, Feta, Muenster, Cream Cheese , Neufchatel, Mexican and other soft cheeses.

-25-
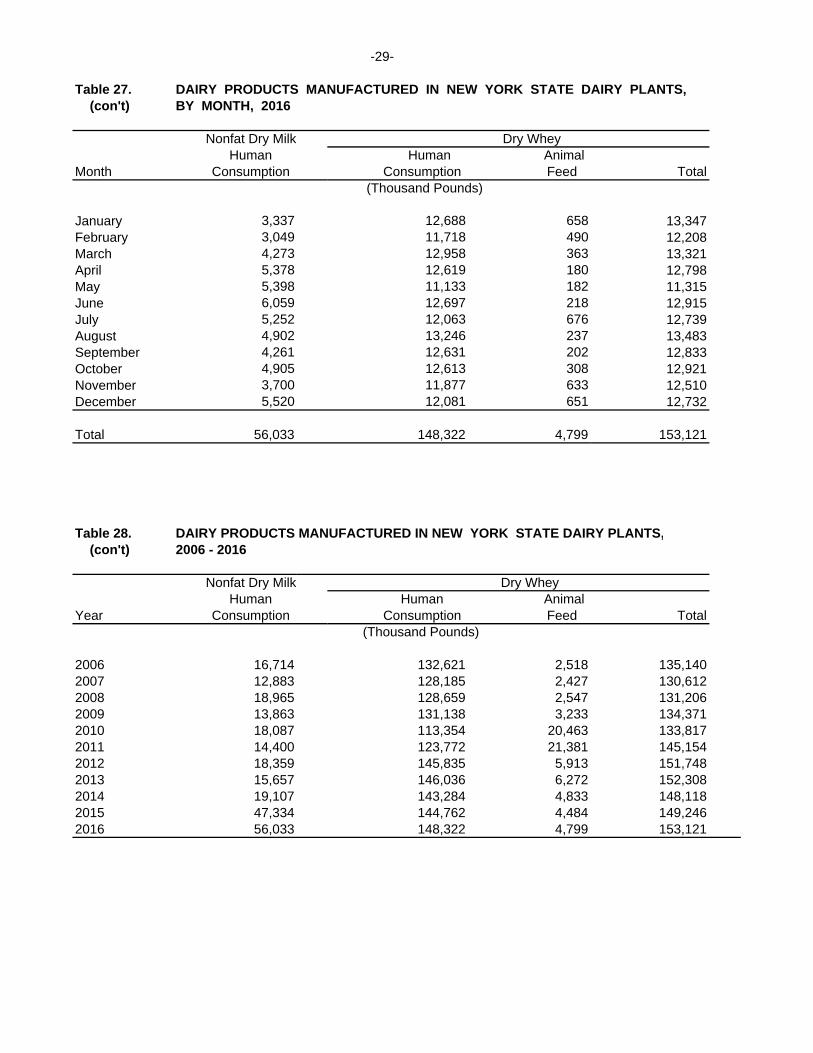
Table 27. DAIRY PRODUCTS MANUFACTURED IN NEW YORK STATE DAIRY PLANTS,BY MONTH, 2016
Whole Milk American Cheese Washed Total Cream
Month Cheddar Curd (1) American Cheese(Thousand Pounds)
January 10,934 237 11,171 23,587February 10,056 189 10,245 22,596March 10,729 100 10,829 21,335April 10,654 156 10,810 19,607May 10,727 248 10,975 16,931June 10,533 178 10,711 23,347July 10,442 105 10,547 20,070August 10,119 140 10,259 27,490September 9,664 133 9,797 25,031October 10,185 163 10,348 25,867November 10,390 72 10,462 28,934December 10,770 214 10,984 25,275
Total 125,203 1,935 127,137 280,070
(1) Includes Colby and Monterey Jack.
Table 28. DAIRY PRODUCTS MANUFACTURED IN NEW YORK STATE DAIRY PLANTS,2006 - 2016
Whole Milk American Cheese Washed Total Cream
Year Cheddar Curd (1) American Cheese(Thousand Pounds)
2006 65,698 1,229 66,927 222,785 2007 68,378 1,138 69,516 246,142 2008 69,368 1,109 70,477 226,985 2009 64,033 1,010 65,043 242,796 2010 94,697 1,089 95,786 236,929 2011 101,712 1,164 102,876 205,243 2012 103,476 1,258 104,734 231,908 2013 116,563 1,413 117,976 252,352 2014 126,636 1,125 127,760 250,153 2015 127,899 1,926 129,826 273,453 2016 125,203 1,935 127,137 280,070
(1) Includes Colby and Monterey Jack.

-26-
Table 27. DAIRY PRODUCTS MANUFACTURED IN NEW YORK STATE DAIRY PLANTS, (con't) BY MONTH, 2016
Italian Cheese Total Other Cheese
Month Mozzarella Ricotta(1) Other (2) Italian Varieties (3)(Thousand Pounds)
January 16,369 8,951 4,604 29,924 3,099February 15,255 9,947 4,515 29,717 3,232March 16,186 9,911 5,183 31,280 3,986April 14,872 6,436 4,918 26,226 3,263May 14,188 7,270 5,191 26,648 3,946June 15,580 7,224 5,432 28,236 3,674July 15,993 6,454 4,918 27,366 3,456August 14,825 9,407 5,270 29,503 4,323September 15,383 10,229 4,822 30,433 4,255October 15,560 10,632 5,011 31,203 4,003November 15,051 11,010 5,617 31,678 3,648December 17,024 9,661 4,639 31,325 3,314
Total (4) 186,286 107,132 60,120 353,538 44,200
(1) Includes Ricotone. (2) Includes Provolone, Romano and other hard & soft Italian varieties. (3) Includes Swiss, Farmers, Spanish, Feta, Mexican, Brick, Muenster, Neufchatel and other miscellaneous varieties. (4) Totals may not add due to rounding.
Table 28. DAIRY PRODUCTS MANUFACTURED IN NEW YORK STATE DAIRY PLANTS, (con't) 2006 - 2016
Italian CheeseTotal Other Cheese
Year Mozzarella Ricotta (1) Other (2) Italian Varieties (3)(Thousand Pounds)
2006 189,059 141,544 50,720 381,323 33,797 2007 198,618 139,597 52,499 390,714 34,418 2008 201,384 129,585 54,222 385,191 32,508 2009 205,275 134,780 51,841 391,896 42,782 2010 197,171 123,657 46,893 367,721 46,132 2011 192,145 126,714 47,459 366,318 57,440 2012 194,413 116,124 53,621 364,158 51,830 2013 195,217 107,457 55,008 357,682 41,123 2014 196,882 107,580 55,890 360,351 40,638 2015 189,949 103,016 58,554 351,520 40,468 2016 186,286 107,132 60,120 353,538 44,200 (1) Includes Ricotone. (2) Includes Provolone, Romano and other hard & soft Italian varieties. (3) Includes Swiss, Farmers, Spanish, Feta, Mexican, Brick, Muenster, Neufchatel and other miscellaneous varieties.

-27-
Table 27. DAIRY PRODUCTS MANUFACTURED IN NEW YORK STATE DAIRY PLANTS, (con't) BY MONTH, 2016
Total Cheese Cottage Cheese Except Plain Cottage Creamed Lowfat Total Total
Month Cottage(1) and Curd(2) Cottage Cottage Cottage(1&3) Cheese(1)(Thousand Pounds)
January 67,781 9,487 6,647 8,883 15,531 83,312February 65,790 9,461 7,028 8,222 15,250 81,040March 67,430 10,922 7,446 9,801 17,247 84,677April 59,905 9,444 7,218 8,155 15,373 75,278May 58,501 10,331 7,626 9,237 16,863 75,364June 65,969 9,896 7,406 8,760 16,166 82,134July 61,439 9,458 7,031 8,395 15,426 76,865August 71,574 10,035 7,153 9,293 16,446 88,020September 69,517 9,765 7,136 8,180 15,315 84,832October 71,421 9,355 6,667 8,212 14,879 86,300November 74,723 8,769 10,643 7,650 18,293 93,016December 70,897 9,356 6,921 8,067 14,988 85,885
Total (1) 804,946 116,280 88,923 102,855 191,777 996,723 (1) Totals may not add due to rounding.(2) Includes Baker's Cheese(3) Total cottage excludes plain cottage and curd.
Table 28. DAIRY PRODUCTS MANUFACTURED IN NEW YORK STATE DAIRY PLANTS, (con't) 2006 - 2016
Total Cheese Cottage CheeseExcept Plain Cottage Creamed Lowfat Total Total
Year Cottage(1) and Curd (2) Cottage Cottage Cottage(1&3) Cheese(1)(Thousand Pounds)
2006 704,831 108,530 62,316 118,853 181,168 886,000 2007 740,790 108,883 60,587 122,291 182,878 923,668 2008 715,161 101,524 59,043 108,517 167,560 882,722 2009 742,517 121,995 74,102 118,987 193,089 935,605 2010 746,568 119,403 72,708 118,285 190,993 937,561 2011 731,877 116,329 78,339 113,102 191,441 923,318 2012 752,630 118,105 81,804 109,646 191,450 944,080 2013 769,133 119,322 82,383 113,739 196,122 965,255 2014 778,904 109,318 79,904 103,060 182,965 961,868 2015 795,267 113,410 82,454 103,238 185,692 980,958 2016 804,946 116,280 88,923 102,855 191,777 996,723 (1) Totals may not add due to rounding.(2) Includes Baker's Cheese(3) Total cottage excludes plain cottage and curd.

-28-
Table 27. DAIRY PRODUCTS MANUFACTURED IN NEW YORK STATE DAIRY PLANTS, (con't) BY MONTH, 2016
Condensed CondensedMonth Butter Sour Cream Yogurt Egg Nog Whole Milk Skim Milk
(Thousand Pounds)
January 2,982 20,989 53,522 41 29 9,708 February 2,559 21,911 50,711 35 53 10,227 March 2,518 23,744 58,488 32 10,666 April 2,936 19,583 54,391 28 12,134 May 2,688 23,685 56,758 29 14,169 June 2,165 23,947 56,113 25 10,377 July 1,504 21,321 55,898 33 12,237 August 1,730 23,156 65,826 30 10,037 September 1,793 22,348 60,482 37 9,856 October 2,220 24,716 56,085 475 7,733 November 1,584 26,273 51,656 938 9,518 December 2,808 26,744 56,595 1,209 8,030
Total 27,488 278,417 676,525 2,913 83 124,691
Table 28. DAIRY PRODUCTS MANUFACTURED IN NEW YORK STATE DAIRY PLANTS, (con't) 2006 - 2016
Condensed CondensedButter Sour Cream Yogurt Egg Nog Whole Milk Skim Milk
(Thousand Pounds)
2006 16,033 262,434 237,331 1,214 7,402 60,7762007 15,388 256,967 233,844 1,156 7,088 89,9132008 18,812 241,718 229,755 1,261 6,873 74,9242009 16,234 268,792 266,697 1,395 4,440 59,4342010 16,133 251,547 369,458 3,555 13,809 62,7512011 16,174 272,891 553,681 3,981 1,699 62,0322012 18,412 270,045 695,345 1,794 1,423 73,0512013 21,089 282,361 742,551 2,100 338 72,0852014 21,366 276,686 651,320 2,245 1,388 87,6042015 24,480 267,031 667,723 1,815 1,435 105,5552016 27,488 278,417 676,525 2,913 83 124,691
-29-
Table 27. DAIRY PRODUCTS MANUFACTURED IN NEW YORK STATE DAIRY PLANTS, (con't) BY MONTH, 2016
Nonfat Dry Milk Dry WheyHuman Human Animal
Month Consumption Consumption Feed Total (Thousand Pounds)
January 3,337 12,688 658 13,347February 3,049 11,718 490 12,208March 4,273 12,958 363 13,321April 5,378 12,619 180 12,798May 5,398 11,133 182 11,315June 6,059 12,697 218 12,915July 5,252 12,063 676 12,739August 4,902 13,246 237 13,483September 4,261 12,631 202 12,833October 4,905 12,613 308 12,921November 3,700 11,877 633 12,510December 5,520 12,081 651 12,732
Total 56,033 148,322 4,799 153,121
Table 28. DAIRY PRODUCTS MANUFACTURED IN NEW YORK STATE DAIRY PLANTS, (con't) 2006 - 2016
Nonfat Dry Milk Dry WheyHuman Human Animal
Year Consumption Consumption Feed Total (Thousand Pounds)
2006 16,714 132,621 2,518 135,1402007 12,883 128,185 2,427 130,6122008 18,965 128,659 2,547 131,2062009 13,863 131,138 3,233 134,3712010 18,087 113,354 20,463 133,8172011 14,400 123,772 21,381 145,1542012 18,359 145,835 5,913 151,7482013 15,657 146,036 6,272 152,3082014 19,107 143,284 4,833 148,1182015 47,334 144,762 4,484 149,2462016 56,033 148,322 4,799 153,121
-30-
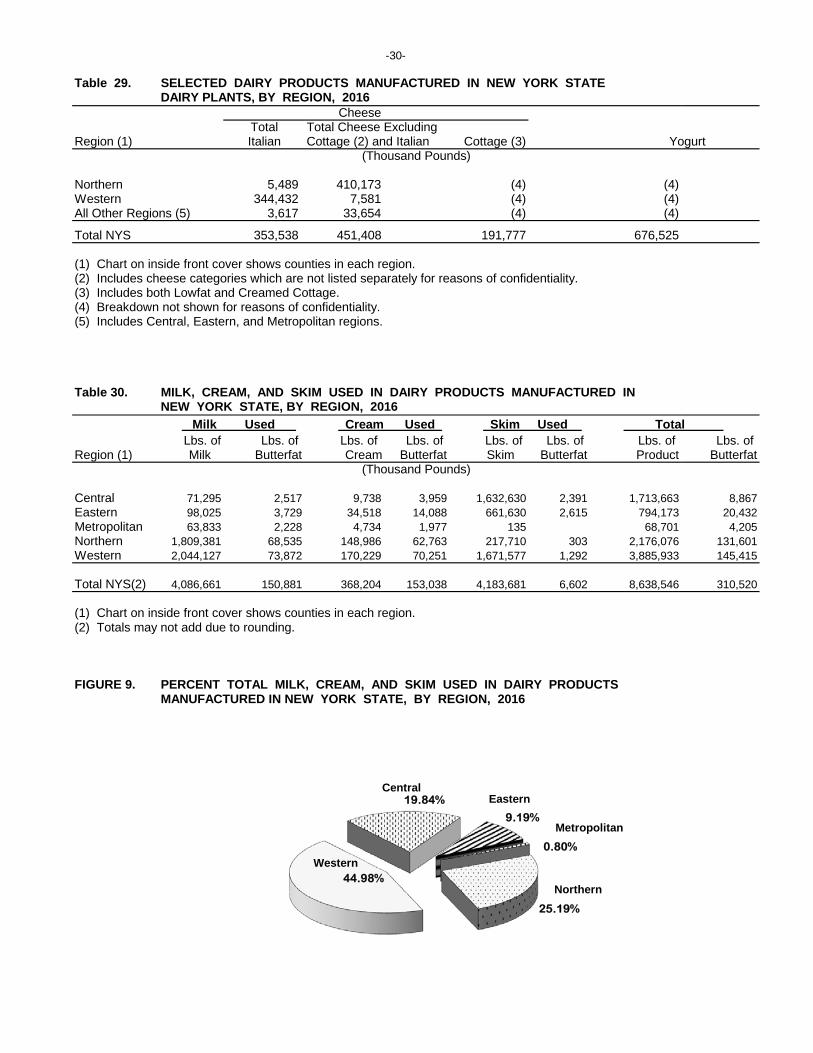
Table 29. SELECTED DAIRY PRODUCTS MANUFACTURED IN NEW YORK STATE DAIRY PLANTS, BY REGION, 2016
CheeseTotal Total Cheese Excluding
Region (1) Italian Cottage (2) and Italian Cottage (3) Yogurt(Thousand Pounds)
Northern 5,489 410,173 (4) (4)Western 344,432 7,581 (4) (4)All Other Regions (5) 3,617 33,654 (4) (4)
Total NYS 353,538 451,408 191,777 676,525
(1) Chart on inside front cover shows counties in each region.(2) Includes cheese categories which are not listed separately for reasons of confidentiality.(3) Includes both Lowfat and Creamed Cottage.(4) Breakdown not shown for reasons of confidentiality.(5) Includes Central, Eastern, and Metropolitan regions.
Table 30. MILK, CREAM, AND SKIM USED IN DAIRY PRODUCTS MANUFACTURED IN NEW YORK STATE, BY REGION, 2016
Milk Used Cream Used Skim Used Total Lbs. of Lbs. of Lbs. of Lbs. of Lbs. of Lbs. of Lbs. of Lbs. of
Region (1) Milk Butterfat Cream Butterfat Skim Butterfat Product Butterfat(Thousand Pounds)
Central 71,295 2,517 9,738 3,959 1,632,630 2,391 1,713,663 8,867Eastern 98,025 3,729 34,518 14,088 661,630 2,615 794,173 20,432Metropolitan 63,833 2,228 4,734 1,977 135 68,701 4,205Northern 1,809,381 68,535 148,986 62,763 217,710 303 2,176,076 131,601Western 2,044,127 73,872 170,229 70,251 1,671,577 1,292 3,885,933 145,415
Total NYS(2) 4,086,661 150,881 368,204 153,038 4,183,681 6,602 8,638,546 310,520
(1) Chart on inside front cover shows counties in each region.(2) Totals may not add due to rounding.
FIGURE 9. PERCENT TOTAL MILK, CREAM, AND SKIM USED IN DAIRY PRODUCTS MANUFACTURED IN NEW YORK STATE, BY REGION, 2016
19.84%
9.19%
0.80%
25.19%
44.98%Northern
Metropolitan
Eastern
Western
Central

Table 31. MILK AND MILK PRODUCTS USED IN DAIRY PRODUCTS MANUFACTURED IN NEW YORK STATE, BY PRODUCT, 2016Milk Used Cream Used Skim Used Total Milk, Cream, Skim Other Dairy Ingred. (1)
Lbs. of Lbs. of Lbs. of Lbs. of Lbs. of Lbs. of Lbs. of Lbs. of Lbs. of Lbs. ofProduct Milk Butterfat Cream Butterfat Skim Butterfat Product Butterfat Product Butterfat
(Thousand Pounds)Butter 46 2 54,273 22,111 0 0 54,319 22,113 208 83
Cheese American Cheddar 1,225,280 46,175 0 0 0 0 1,225,280 46,175 0 0 Washed Curd & Colby 17,508 620 (~) (~) 0 0 17,508 620 0 0 Italian Mozzarella (2) 1,300,505 46,738 5,399 2,259 234,423 85 1,540,327 49,082 206,426 438 Ricotta & Ricotone 98,959 3,753 14,006 5,865 6,013 3 118,978 9,621 248,064 2,045 Other Italian (3) 438,660 16,184 1,879 792 59,422 19 499,962 16,995 71,031 71 Cream Cheese 421,695 16,162 134,330 57,055 45,219,137 168,848 601,244 73,386 31,354 8,395 Other Cheese (4) 229,259 8,392 1,452 595 24,646 25 255,358 9,012 48,307 3 Cottage Cheese Curd (5) 78 3 0 0 649,488 603 649,566 606 8,989 6 Creamed 6,192 234 9,209 3,775 1,263 1 16,664 4,010 13,381 8 Lowfat 3,355 133 2,960 1,210 6,242 4 12,557 1,348 11,644 7Total Cheese 3,741,492 138,395 169,236 71,552 1,026,717 909 4,937,444 210,856 639,196 10,973
Dry Products
-31
-
Nonfat Dry Milk 0 0 0 0 584,873 724 584,873 724 0 0 Other Dry Products (6) 0 0 0 0 15,043 20 15,043 20 1,981,769 510
Condensed & Evaporated Plain Cond Whl Milk 262 11 0 0 0 0 262 11 0 0 Plain Cond Skm Milk 0 0 0 0 485,955 314 485,955 314 0 0 Other Cond Prods (7) 120,072 4,535 122 50 14,706 19 134,900 4,604 16,694 126
Sour Cream 90,090 3,438 104,236 42,751 73,307 73 267,633 46,262 41,097 31
Yogurt (2) 72,583 2,524 4,034 1,665 1,599,604 4,325 1,676,222 8,514 46,203 33
Egg Nog 1,890 108 355 136 416 (~) 2,662 244 782 (~)
Frozen Desserts 28,993 1,091 15,087 6,036 1,506 1 45,585 7,128 50,662 176
Miscellaneous Products (8) 31,233 778 20,861 8,736 381,554 216 433,647 9,729 53,060 263
TOTAL (9) 4,086,661 150,881 368,204 153,038 4,183,681 6,601 8,638,546 310,520 2,829,670 12,195(1) Includes condensed and powdered skim, buttermilk, whey, whey cream, Dried and condensed products are reported on a fluid equivalent basis. (2) The milk used includes lowfat milk used to manufacture a lowfat product in this catagory. (3) Includes Provolone, Romano and other Italian varieties.(4) Includes Swiss, Farmers, Brick, Spanish cheese, Feta, Muenster, Neufchatel, Mexican and other miscellaneous varieties. (5) Includes Cottage cheese curd and Bakers cheese.(6) Includes NFDM for animal consumption, whole milk powder, buttermilk powder, whey powder and dry products blend. (7) Includes condensed buttermilk, condensed whey, sweetened condensed milk and evaporated milk. (8) Includes whipped topping, Whey Protein and Milk Protein Concentrate, Enery Drinks, Baking Products and other miscellaneous dairy products. (9) Totals may not add due to rounding. (~) Less than 500 lbs.

Table 32. SELECTED DAIRY PRODUCTS MANUFACTURED IN NEW YORK STATE COMPARED TO TOTAL UNITED STATES PRODUCTION,2015-2016
Total Cheese American Cream Creamed Lowfat (Excluding
Yogurt Type (1) Cheese(2) Cottage Cottage Italian Cottage)(Thousand Pounds)
2016
Total Pounds Manufactured 676,525 127,137 280,070 88,923 102,855 353,538 804,946 in New York State (3)
Total Pounds Manufactured 4,455,819 4,756,200 908,960 329,444 367,815 5,292,643 12,157,697 in United States (4)
N.Y.S. Percentage of 15.2 2.7 30.8 27.0 28.0 6.7 6.6 U.S. Production
2015
-32-
Total Pounds Manufactured 667,723 129,826 273,453 82,656 109,834 351,031 801,436 in New York State (3)
Total Pounds Manufactured 4,742,087 4,694,886 876,285 317,528 364,614 5,088,755 11,838,425 in United States (4)
N.Y.S. Percentage of 14.1 2.8 31.2 26.0 30.1 6.9 6.8 U.S. Production
(1) Includes Cheddar, Colby, Washed Curd, Stirred Curd, Monterey Jack. (2) Includes Neufchatel(3) Based on NYS Milk Control / Dairy Services division records(4) USDA "Dairy Products" 2015 and 2016 Summary, April 2016 and 2017

S E C T I O N V I
O T H E R D I S P O S I T I O N
FIGURE 10. PERCENTAGE UTILIZATION OF MILK AND OTHER MILK PRODUCTS AT NEW YORKSTATE DAIRY PLANTS , 2016 (See Table 33)
-33-
9.6%
8.6%
65.3%
0.9%13.2%
2.4%
NYS Manufacturing
Not Utilized
Out-of-State Mfg.
NYS Fluid
Out-of-State Fluid
Frozen Dessert & Food Processing

Table 33. UTILIZATION OF MILK AND OTHER DAIRY PRODUCTS AT NEW YORK STATE DAIRY PLANTS, BY MONTH, 2016 (1)
Sold For Use In (2) Packaged Used For Out-of-State Fluid Route Sales Mfg. In Shipments For Frozen Food Whey Milk
Month In-State Out-of-State NY Plants Fluid Use (3) Mfg. Use Desserts Processing Not Utilized Not Utilized Total
Jan 152,163 108,855 931,291 12,317 41,534 10,013 4,423 1,522 1,449,020
Feb 144,334 107,231 907,740 18,801 34,267 9,808 4,484 1,352 1,406,280
Mar 151,429 113,403 969,687 14,082 33,183 10,689 4,296 1,189 1,494,145
Apr 145,844 107,960 930,246 10,030 43,296 10,812 3,988 6,001 1,441,483
May 149,180 111,217 961,817 15,158 46,565 12,062 5,784 7,339 1,506,682
Jun 138,952 109,177 985,225 13,784 38,581 14,560 4,068 8,066 1,505,472
-34-
Jul 131,556 103,584 984,101 19,346 33,439 10,351 3,388 4,871 1,484,413
Aug 133,748 112,655 1,020,909 18,134 32,654 9,208 4,801 1,438 1,547,400
Sep 140,094 107,203 958,055 12,253 30,218 8,272 3,870 988 1,464,918
Oct 125,815 114,262 949,303 17,242 29,465 6,013 3,627 752 1,422,990
Nov 130,026 123,922 916,956 16,244 33,929 8,281 2,976 916 1,398,417
Dec 134,043 116,204 952,888 14,236 25,708 6,336 3,632 5,372 1,440,587
Total(4) 1,677,185 1,335,672 11,468,216 181,626 422,839 116,405 49,337 2,270,720 39,805 17,561,806 (1) Other dairy products include condensed and powdered skim, buttermilk; whey and whey cream, and other miscellaneous ingredients. Dried and condensed products are reported on a fluid equivalent basis. See Table 9 for last ten years.(2) Includes both New York and Out-of-State.(3) Includes bulk milk and shipments of packaged fluid milk products.(4) Totals may not add due to rounding.
(Thousand Pounds)
176,512
165,167
182,168
186,903
178,264
196,186
183,306
197,560
193,058
193,776
213,853
203,967

-35-
TABLE 34. UTILIZATION OF MILK, OTHER DAIRY PRODUCTS AND BUTTERFAT AT NEW YORK STATE DAIRY PLANTS, 2016 (1)
Product Butterfat Butterfat
Disposition Weight Weight Test
(Thousand Pounds) (Percent)
Fluid use (2)
Whole milk, lowfat milk, skim milk, 2,723,050 54,849 2.01
flavored milk/drinks, buttermilk and misc.
Cream; Half and Half 471,433 94,284 20.00
Total Fluid Use 3,194,482 149,133 4.67
Used for Manufacturing in NY Plants 11,468,216 322,716 2.81
Sold for Other Manufacturing
Out-of-State Manufacturing 422,839 31,403 7.43
Frozen Desserts (3) 116,405 19,870 17.07
Food Processing (3) 49,337 4,070 8.25
Animal Feed, Storage cream
and Dumped milk (3) 2,310,526 741 0.03
Total Sold for Other Manufacturing 2,899,107 56,084 1.93
Total Disposition 17,561,806 527,933 3.01
(1) Other dairy products include condensed and powdered skim, buttermilk, whey, wpc, whey cream, and other
miscellaneous ingredients. Dried and condensed products are reported on a fluid equivalent basis. (2) Includes in-state and out-of-state route sales of packaged fluid milk products and out-of-state shipments of bulk milk for fluid use and packaged fluid milk products.(3) Includes both New York and out-of-state.

-36-
S E C T I O N VII M A R K E T O R D E R S T A T I S T I C S
FIGURE 11. UTILIZATION OF MILK RECEIVED FROM PRODUCERS UNDER THE FEDERAL MILK MARKETING ORDER, BY CLASS, 2007 - 2016
0
2
4
6
8
10
12
2007 2008 2009 2010 2011 2012 2013 2014 2015 2016
Uti
lizat
ion
(B
illio
n P
ou
nd
s)
Northeast Marketing Order
Class I Class II Class III Class IV

-37-
Table 35. UTILIZATION OF MILK RECEIVED FROM PRODUCERS UNDER THE NORTHEAST FEDERAL MILK MARKETING ORDER, BY CLASS AND MONTH, 2016
Class Class Class Class Month I II III IV Total
(Thousand Pounds)
January 761,433 535,335 548,642 407,675 2,253,085 February 725,857 526,985 523,330 361,555 2,137,728 March 761,896 576,827 545,382 420,980 2,305,085 April 725,155 552,946 545,367 442,481 2,265,949 May 736,478 582,245 621,618 432,429 2,372,771 June 680,956 559,383 624,495 398,277 2,263,110 July 673,939 577,070 592,716 457,088 2,300,814 August 711,621 585,212 592,810 355,033 2,244,677 September 754,289 542,178 567,738 312,470 2,176,675 October 758,498 539,364 567,758 379,502 2,245,123 November 752,916 486,670 571,593 363,410 2,174,589 December 784,957 487,905 572,103 422,559 2,267,525
Total 8,827,997 6,552,120 6,873,552 4,753,459 27,007,129
Source: Federal Milk Order 1, Northeast Marketing Area, Annual Statistical Bulletin.NOTE: Columns may not total due to rounding.
Table 36. UTILIZATION OF MILK RECEIVED FROM PRODUCERS UNDER THE FEDERALMILK MARKETING ORDER, BY CLASS AND YEAR, 2006 - 2016
Total Class Class Class Year Order Class I II III Class IV Total
(Thousand Pounds)2006 Northeast - Federal Order 1 10,544,490 4,476,355 5,074,743 2,581,396 22,676,983 2007 Northeast - Federal Order 1 10,495,810 4,724,047 5,637,991 2,179,609 23,037,457 2008 Northeast - Federal Order 1 10,384,795 4,655,202 5,323,117 3,530,886 23,894,000 2009 Northeast - Federal Order 1 10,267,839 4,747,365 5,530,730 2,948,809 23,494,743 2010 Northeast - Federal Order 1 10,386,459 5,181,479 5,950,721 2,814,821 24,333,481 2011 Northeast - Federal Order 1 10,074,945 5,723,009 6,096,458 2,462,864 24,357,275 2012 Northeast - Federal Order 1 9,801,897 6,410,421 5,848,340 2,634,422 24,695,080 2013 Northeast - Federal Order 1 9,507,925 6,578,702 6,449,455 2,883,810 25,419,892 2014 Northeast - Federal Order 1 9,122,941 6,247,012 6,659,098 3,764,051 25,793,101 2015 Northeast - Federal Order 1 8,943,417 6,322,362 6,219,056 4,553,904 26,038,739 2016 Northeast - Federal Order 1 8,827,997 6,552,120 6,873,552 4,753,459 27,007,129
Source: Federal Milk Order 1, Northeast Marketing Area, Annual Statistical Bulletin for 2005-2015.
-38-
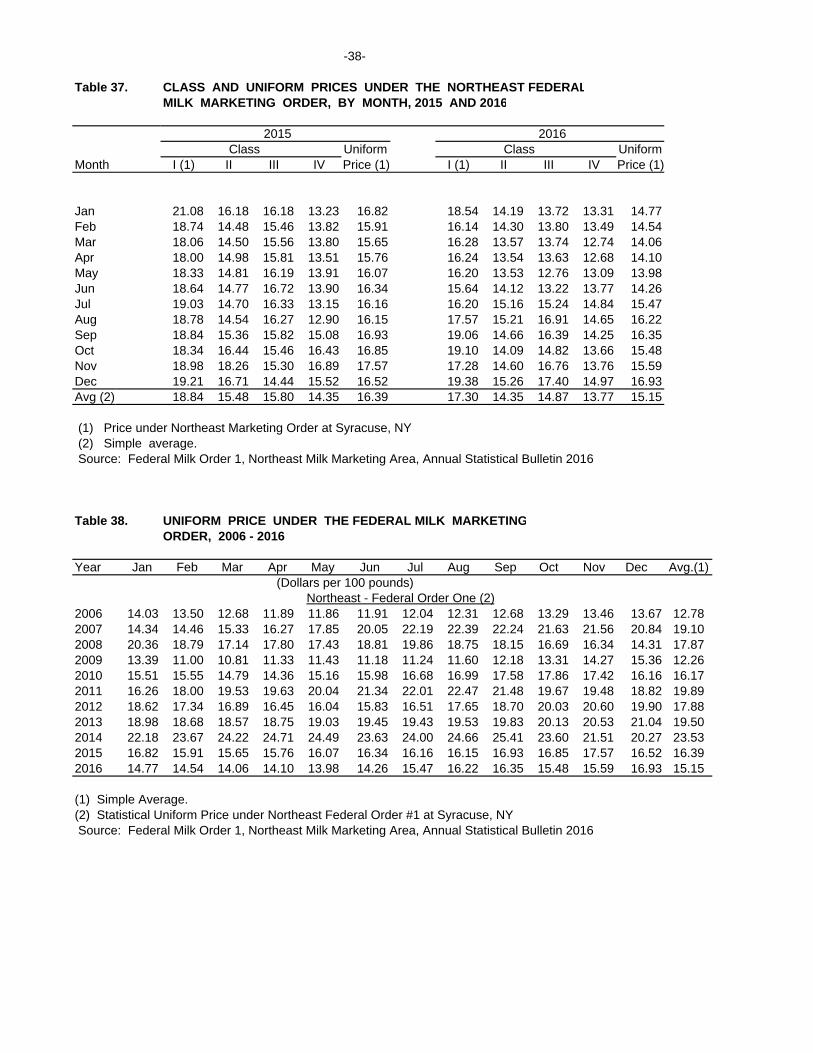
Table 37. CLASS AND UNIFORM PRICES UNDER THE NORTHEAST FEDERALMILK MARKETING ORDER, BY MONTH, 2015 AND 2016
2015 2016 Class Uniform Class Uniform
Month I (1) II III IV Price (1) I (1) II III IV Price (1)
Jan 21.08 16.18 16.18 13.23 16.82 18.54 14.19 13.72 13.31 14.77Feb 18.74 14.48 15.46 13.82 15.91 16.14 14.30 13.80 13.49 14.54Mar 18.06 14.50 15.56 13.80 15.65 16.28 13.57 13.74 12.74 14.06Apr 18.00 14.98 15.81 13.51 15.76 16.24 13.54 13.63 12.68 14.10May 18.33 14.81 16.19 13.91 16.07 16.20 13.53 12.76 13.09 13.98Jun 18.64 14.77 16.72 13.90 16.34 15.64 14.12 13.22 13.77 14.26Jul 19.03 14.70 16.33 13.15 16.16 16.20 15.16 15.24 14.84 15.47Aug 18.78 14.54 16.27 12.90 16.15 17.57 15.21 16.91 14.65 16.22Sep 18.84 15.36 15.82 15.08 16.93 19.06 14.66 16.39 14.25 16.35Oct 18.34 16.44 15.46 16.43 16.85 19.10 14.09 14.82 13.66 15.48Nov 18.98 18.26 15.30 16.89 17.57 17.28 14.60 16.76 13.76 15.59Dec 19.21 16.71 14.44 15.52 16.52 19.38 15.26 17.40 14.97 16.93Avg (2) 18.84 15.48 15.80 14.35 16.39 17.30 14.35 14.87 13.77 15.15
(1) Price under Northeast Marketing Order at Syracuse, NY (2) Simple average. Source: Federal Milk Order 1, Northeast Milk Marketing Area, Annual Statistical Bulletin 2016
Table 38. UNIFORM PRICE UNDER THE FEDERAL MILK MARKETINGORDER, 2006 - 2016
Year Jan Feb Mar Apr May Jun Jul Aug Sep Oct Nov Dec Avg.(1)(Dollars per 100 pounds)
Northeast - Federal Order One (2)2006 14.03 13.50 12.68 11.89 11.86 11.91 12.04 12.31 12.68 13.29 13.46 13.67 12.782007 14.34 14.46 15.33 16.27 17.85 20.05 22.19 22.39 22.24 21.63 21.56 20.84 19.102008 20.36 18.79 17.14 17.80 17.43 18.81 19.86 18.75 18.15 16.69 16.34 14.31 17.872009 13.39 11.00 10.81 11.33 11.43 11.18 11.24 11.60 12.18 13.31 14.27 15.36 12.262010 15.51 15.55 14.79 14.36 15.16 15.98 16.68 16.99 17.58 17.86 17.42 16.16 16.172011 16.26 18.00 19.53 19.63 20.04 21.34 22.01 22.47 21.48 19.67 19.48 18.82 19.892012 18.62 17.34 16.89 16.45 16.04 15.83 16.51 17.65 18.70 20.03 20.60 19.90 17.882013 18.98 18.68 18.57 18.75 19.03 19.45 19.43 19.53 19.83 20.13 20.53 21.04 19.502014 22.18 23.67 24.22 24.71 24.49 23.63 24.00 24.66 25.41 23.60 21.51 20.27 23.532015 16.82 15.91 15.65 15.76 16.07 16.34 16.16 16.15 16.93 16.85 17.57 16.52 16.392016 14.77 14.54 14.06 14.10 13.98 14.26 15.47 16.22 16.35 15.48 15.59 16.93 15.15
(1) Simple Average.(2) Statistical Uniform Price under Northeast Federal Order #1 at Syracuse, NY Source: Federal Milk Order 1, Northeast Milk Marketing Area, Annual Statistical Bulletin 2016
-39-
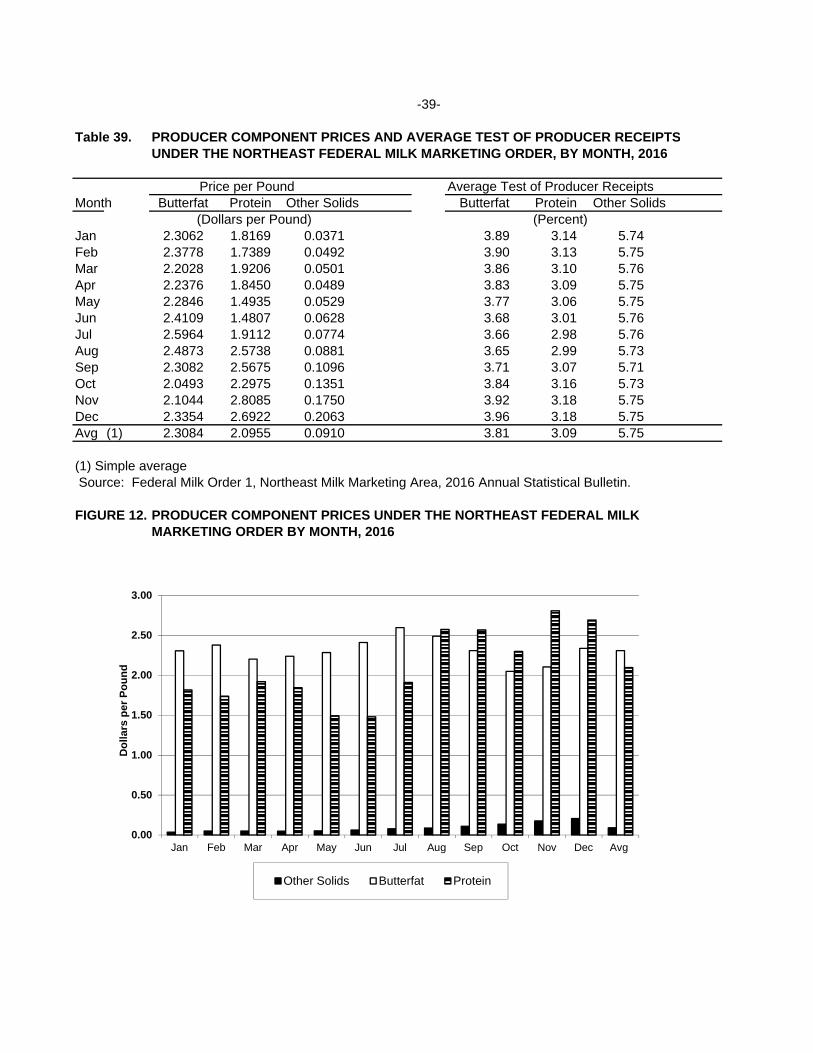
Table 39. PRODUCER COMPONENT PRICES AND AVERAGE TEST OF PRODUCER RECEIPTSUNDER THE NORTHEAST FEDERAL MILK MARKETING ORDER, BY MONTH, 2016
Price per Pound Average Test of Producer ReceiptsMonth Butterfat Protein Other Solids Butterfat Protein Other Solids
(Dollars per Pound) (Percent)Jan 2.3062 1.8169 0.0371 3.89 3.14 5.74Feb 2.3778 1.7389 0.0492 3.90 3.13 5.75Mar 2.2028 1.9206 0.0501 3.86 3.10 5.76Apr 2.2376 1.8450 0.0489 3.83 3.09 5.75May 2.2846 1.4935 0.0529 3.77 3.06 5.75Jun 2.4109 1.4807 0.0628 3.68 3.01 5.76Jul 2.5964 1.9112 0.0774 3.66 2.98 5.76Aug 2.4873 2.5738 0.0881 3.65 2.99 5.73Sep 2.3082 2.5675 0.1096 3.71 3.07 5.71Oct 2.0493 2.2975 0.1351 3.84 3.16 5.73Nov 2.1044 2.8085 0.1750 3.92 3.18 5.75Dec 2.3354 2.6922 0.2063 3.96 3.18 5.75Avg (1) 2.3084 2.0955 0.0910 3.81 3.09 5.75
(1) Simple average Source: Federal Milk Order 1, Northeast Milk Marketing Area, 2016 Annual Statistical Bulletin.
FIGURE 12. PRODUCER COMPONENT PRICES UNDER THE NORTHEAST FEDERAL MILK MARKETING ORDER BY MONTH, 2016
0.00
0.50
1.00
1.50
2.00
2.50
3.00
Jan Feb Mar Apr May Jun Jul Aug Sep Oct Nov Dec Avg
Do
llars
per
Po
un
d
Other Solids Butterfat Protein

-40-
Table 40. UTILIZATION OF MILK RECEIVED FROM PRODUCERS UNDER THE WESTERN NEW YORKMILK MARKETING ORDER, BY CLASS AND MONTH, 2015 AND 2016.
2015 2016Month Class I Class II Class III Class IV Total Class I Class II Class III Class IV Total
(1000 Pounds)January 15,739 13,521 1,937 858 32,055 14,730 11,231 909 1,774 28,644 February 13,757 11,246 3,841 354 29,198 13,527 13,059 212 1 26,799 March 14,862 11,654 6,050 55 32,621 14,010 14,587 569 232 29,398 April 13,950 12,655 5,041 667 32,313 14,257 11,780 1,614 1,138 28,789 May 14,121 11,505 6,606 1,757 33,989 14,211 14,865 969 761 30,806 June 13,807 12,817 6,241 1 32,866 12,450 16,619 1,300 160 30,529 July 13,078 10,764 5,280 404 29,526 12,518 14,661 1,680 1,107 29,966 August 12,599 10,274 5,091 1,352 29,316 13,030 12,972 1,989 12 28,003 September 12,271 9,382 5,515 84 27,252 12,131 10,077 2,206 1,443 25,857 October 13,851 10,698 2,176 26,725 12,679 12,039 1,875 9 26,602 November 14,042 9,083 1,140 1,917 26,182 11,657 10,759 1,748 1,324 25,488 December 14,702 11,383 1,441 27,526 14,791 11,763 1,941 988 29,483
Total 166,779 134,982 50,359 7,449 359,569 159,991 154,412 17,012 8,949 340,364
Source: WNY Milk Marketing Area, Announcement of Uniform Price.~ Less than 500 pounds
Table 41. CLASS AND UNIFORM PRICES (1) UNDER THE WESTERN NEW YORK MILK MARKETINGORDER, BY MONTH, 2015 AND 2016.
2015 2016Month Class I Class II Class III Class IV Uniform Price Class I Class II Class III Class IV Uniform Price
(Dollars Per 100 Pounds)
January 20.93 16.64 16.43 13.70 17.80 18.86 14.69 13.50 13.83 15.64February 18.81 14.96 15.60 14.31 16.85 16.03 14.82 13.55 14.01 15.44March 18.01 14.97 15.70 14.28 16.37 16.42 14.08 13.60 13.25 14.82April 17.92 15.46 15.93 14.00 16.52 15.90 14.05 13.46 13.19 14.85May 18.25 15.30 16.23 14.40 16.80 15.84 14.04 12.51 13.60 14.83June 18.50 15.26 16.78 14.39 17.10 15.81 14.63 12.91 14.29 15.15July 18.86 15.19 16.36 13.64 17.07 16.51 15.67 14.91 15.35 16.16August 18.58 15.05 16.22 13.41 16.89 17.75 15.72 16.74 15.16 16.69September 18.64 15.89 15.41 15.60 17.71 18.67 15.16 16.30 14.75 16.70October 17.89 16.97 14.93 16.95 17.45 18.82 14.59 14.81 14.16 16.11November 19.30 18.78 14.55 17.43 19.23 17.06 15.10 16.82 14.26 15.80December 19.53 17.23 13.85 16.05 17.89 19.25 15.76 17.34 15.46 17.46
Average (2) 18.77 15.98 15.67 14.85 17.29 17.24 14.86 14.70 14.28 15.80
(1) Price as announced for milk testing 3.5 percent butterfat for Monroe County, New York(2) Class prices are simple averages. Uniform prices are weighted average. Source: WNY Milk Marketing Area, Announcement of Uniform Price.


