112
New Zealand Health Information Service – 2001 New Zealand Drug Statistics

New Zealand Health Information Service – 2001
New ZealandDrug Statistics

Copyright
No part of this work may be reproduced, stored in a retrieval system, or transmitted,in any form or by any means, electronic, mechanical, photocopying, recording, orotherwise, without the prior written permission of the Ministry of Health.
Disclaimer
The Ministry of Health gives no indemnity as to the correctness of the informationor data supplied. The Ministry of Health shall not be liable for any loss or damagearising directly or indirectly from the supply of this publication.
Acknowledgements
Editorial committee:
Stuart Sheppard — New Zealand Health Information Service,
Paul Marriott-Lloyd — Ministry of Health
Sally Casswell — Alcohol and Public Health Research Unit
Catherine Coates — New Zealand Police
Sally Jackman — New Zealand Drug Foundation
Michael Webb — Alcohol Advisory Council of New Zealand
Judy Paulin — Ministry of Justice
The editorial committee would like to sincerely thank all those organisations andindividuals who contributed information, comments, and support in the productionof this publication.
Special thanks to the following organisations:
Alcohol Advisory Council
Alcohol and Public Health Research Unit
Land Transport Safety Authority
Ministry of Justice
New Zealand Drug Foundation
New Zealand Police
Sports Drug Agency
Water Safety New Zealand
Published with the permission of the Director-General of Health
© 2001 Ministry of Health, PO Box 5013, Wellington, New Zealand
ISBN 0-478-26164-0 (printed version)ISBN 0-478-26165-9 (Internet version)

Contents
Foreword 5
Introduction 6
Comparability 6
Ethnicity 7
Process 8
AlcoholKey facts 9
Alcohol production/quantities 10
Alcohol use 12
Mâori use of alcohol 17
Pacific peoples’ use of alcohol 18
Alcohol-related problems 19
Alcohol-related problems for Mâori 20
Alcohol-related problems for Pacific peoples 21
Community concerns about alcohol use 22
Alcohol and offending 23
Alcohol-related mortality 31
Alcohol-related hospitalisations 39
TobaccoKey facts 42
New Zealand’s tobacco control programme 1985–98 43
Tobacco use 46
Youth smoking 52
Tobacco-related mortality 52
Tobacco taxation and price 54
Attitudes and beliefs concerning second-hand smoke 55
CannabisKey facts 61
Marijuana supply 62
Marijuana use 62
Marijuana-related problems 67
Marijuana-related problems for Mâori 68
Community concerns about marijuana use 69
Cannabis and crime 69
Cannabis-related mortality 76
Cannabis-related hospitalisations 77

4 New Zealand Drug Statistics
Other illicit drugsKey facts 80
Illicit drugs and crime 81
Opiate use 86
Opiate-related mortality 87
Opiate-related hospitalisations 88
Hallucinogen use 91
Halucinogen-related mortality 92
Hallucinogen-related hospitalisations 92
Stimulant use 94
Stimulant-related mortality 95
Stimulant-related hospitalisations 95
Other drugsKey facts 96
Depressant use 97
Community concerns about illicit drugs and solvents 98
Depressant-related mortality 98
Depressant-related hospitalisations 100
Steroids and sports drugs 103
Explanatory notesRates 105
Tobacco use 105
Alcohol and drug use and effects 106
Drugs and crime 107
Mortality information 108
Hospitalisation information 109
Contact details 110

New Zealand Drug Statistics 5
Foreword
The Government is committed to an evidence-based approach to tackling drug-relatedharm in New Zealand under the framework of the New Zealand Health Strategy and theNational Drug Policy. The overall goal is to improve the health and welfare of NewZealanders.
Central to this goal is the need for a monitoring regime to chart progress towards keyoutcome targets. This publication pulls together information from a myriad of datasources into one volume, providing a snapshot of drug use, abuse and harm in NewZealand. Readers should not be surprised to find that this report does not include all datasources, nor indeed to find that there are some gaps in information. The simple factremains that we are unable to fully answer all the questions we have relating to drugs.Work needs to be done to establish data sources in some areas, in particular drug useduring pregnancy and the role of drug use in workplace accidents. However, this is thefirst published report in this country for many years to try and provide a broad view ofthe drug situation.
The Editorial Committee for this publication was made up of representatives from theMinistries of Health and Justice, the New Zealand Health Information Service, theAlcohol and Public Health Research Unit, the Alcohol Advisory Council of New Zealandand the New Zealand Police. Their efforts are to be commended.
Jim FraserChief AnalystNew Zealand Health Information Service
6 New Zealand Drug Statistics
Introduction
The purpose of this publication is to gather in one place a diverse range of statisticsrelating to drugs and drug use in New Zealand. The primary focus is on those drugs thatare used recreationally or due to dependence.
This publication does not contain information on policy nor does it contain anyoverriding analysis of the drug situation in New Zealand. This was outside the scope ofthis publication, which was to present various statistics for the reader to reach their ownconclusions.
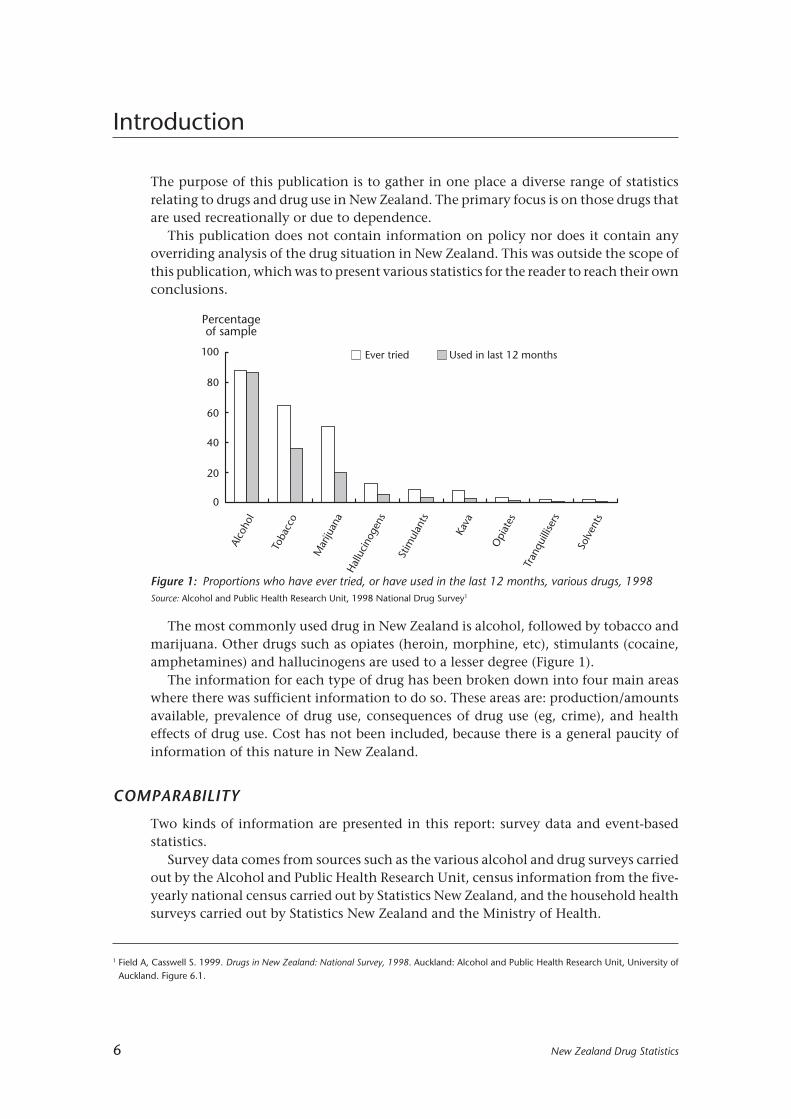
The most commonly used drug in New Zealand is alcohol, followed by tobacco andmarijuana. Other drugs such as opiates (heroin, morphine, etc), stimulants (cocaine,amphetamines) and hallucinogens are used to a lesser degree (Figure 1).
The information for each type of drug has been broken down into four main areaswhere there was sufficient information to do so. These areas are: production/amountsavailable, prevalence of drug use, consequences of drug use (eg, crime), and healtheffects of drug use. Cost has not been included, because there is a general paucity ofinformation of this nature in New Zealand.
COMPARABILITY
Two kinds of information are presented in this report: survey data and event-basedstatistics.
Survey data comes from sources such as the various alcohol and drug surveys carriedout by the Alcohol and Public Health Research Unit, census information from the five-yearly national census carried out by Statistics New Zealand, and the household healthsurveys carried out by Statistics New Zealand and the Ministry of Health.
Alco
hol
Toba
cco
Mar
ijuan
aH
allu
cino
gens
Stim
ulan
ts
Kava
Opi
ates
Tran
quill
isers
Solv
ents
Ever tried Used in last 12 months
Percentageof sample
100
0
20
80
60
40
1 Field A, Casswell S. 1999. Drugs in New Zealand: National Survey, 1998. Auckland: Alcohol and Public Health Research Unit, University ofAuckland. Figure 6.1.
Figure 1: Proportions who have ever tried, or have used in the last 12 months, various drugs, 1998Source: Alcohol and Public Health Research Unit, 1998 National Drug Survey1

New Zealand Drug Statistics 7
Event-based statistics come from information collected and stored by variousorganisations, and are based on discrete events. Some examples of these are peoplehospitalised with drug-related diagnoses, people apprehended by the police, andconvictions for drug-related crimes.
All of these sources of information differ in the reasons for capturing the information,and differ in the methods they use to record, analyse, and disseminate the information.This means that many of the different types of information contained in this reportcannot be compared with each other.
In the case of surveys that are performed on a regular basis (eg, census, householdhealth surveys) changes in the wording of the questions can result in the statistics notbeing comparable. This is because although people are talking about the same generalsubject (eg, tobacco smoking) the actual question asked may be talking about differentspecifics (eg, just cigarettes or all tobacco products) and the available answers may alsobe providing quite different options to those available in previous surveys.
Event-based statistics also change over time as technology changes, as definitionschange, and as new kinds of information are captured.
One key area where information differs across most of the information sources is inthe area of ethnicity.
ETHNICITY
Comparison of ethnicity statistics between the different sources in this publication isnot possible, because of variations in definition and collection practices.
Ethnicity seems, at first glance, to be a relatively simple concept. However, bothsurvey and event-based systems for information collection need each and every variableto be defined so that consistent results are obtained. This applies to ethnicity as muchas any other variable, and the various possible definitions and collection practicesensure that it is not a simple concept.
Two methods of defining ancestry that have been used in the past are ethnicity basedupon ancestry, and ethnicity based upon self-identity.
Ancestry implies that ethnicity is hereditary and that a child’s ethnicity is dependentupon the ethnicity of the parents. The self-identity method asks for people to identifythe ethnic groups that they feel they belong to or identify with. These two definitionsare fundamentally different and are not comparable.
Further complications are added by the number of ethnic groups that can berecorded. Recording only one ethnic group requires people to decide which ethnic groupis most significant for them if they belong to more than one. Being able to recordmultiple ethnic groups allows for truer recording of ethnicity for each person. However,multiple ethnicities add significant complications for any analysis using ethnicity as avariable. This is because it is not usually possible or useful to allow for every possiblecombination of ethnicities when doing an analysis.
Multiple ethnic groups
Two common methods to get around the problems posed by multiple ethnic groups areto use a “sole ethnicity” basis and a “prioritised ethnicity” basis.
“Sole ethnicity” is essentially based upon a person recording only one ethnicity whengiven the option of recording more then one. For example, if a person has answered onlyMâori as their ethnicity then they will be tabulated under the Mâori category. A person

8 New Zealand Drug Statistics
answering both Mâori and Pâkehâ would be tabulated under an “other” category, orpossibly a “mixed” ethnicity category. This has the effect of presenting Mâori statisticsas lower than for the actual number of people who identified Mâori as an ethnic groupthey belonged to.
“Prioritised ethnicity” ranks the different ethnic groups in a predetermined order. Forexample, Mâori is the highest ranked ethnic group. This means that if a person claimedboth Mâori and European as their ethnic groups then analysis of the results woulddetermine this person to be Mâori. The effect of this is to maximise the statistics for thehighest-ranked group, and minimise them for the lowest-ranked group.
PROCESS
A number of governmental and non-governmental organisations that might havecollected drug-related statistics were asked if they were able to contribute to thispublication. An editorial committee was then formed, with members from the Ministryof Health, New Zealand Drug Foundation, Alcohol Advisory Council, Alcohol andPublic Health Research Unit, New Zealand Police, and Ministry of Justice. This committeeoversaw the concept scoping and design, and the collection and evaluation ofcontributions.
Not all the material received by the editorial committee has been included in the finalform of this publication. Some was deemed to be outside the scope, some was deemedto be statistically insignificant, and other information was excluded through lack ofspace.
New Zealand Drug Statistics 9
ALCOHOL
KEY FACTS
Use• The total volume of alcoholic beverages available for consumption decreased over the
1990–2000 period by 3 percent to 418.5 million litres in the year ending June 2000.However, the total volume of absolute alcohol available for consumption increasedby 1 percent, to 26.3 million litres, during this 10-year period.
• Alcoholic drinks have increased steadily in price over the 1990–2000 period, withannual increases ranging between 1 and 3 percent, and prices rising by a total of 22percent from June 1990 to June 2000. Over the same 10 years, there was 11 percentless absolute alcohol available per person aged 15 years and over. Overall, as alcoholincreased in price, alcohol available for consumption decreased.
• According to the 1995 National Alcohol Survey, 87 percent of people aged 14 to 65years had consumed alcohol in the previous 12 months. The survey also found that80 percent of Mâori (83 percent of men and 78 percent of women) had consumedalcohol in the previous 12 months. The annual Auckland Alcohol Survey showed thatin the 1990s, 59 percent of Pacific peoples had consumed alcohol in the past year.
• The most commonly reported consequence of one’s own drinking in the past 12months was a hangover (51 percent of men, 33 percent of women). Ten percent ofmales reported physical assault as a problem experienced due to other people’sdrinking. Eleven percent of women reported sexual harassment as a problemexperienced as the result of someone else’s drinking.
Crime• In 1998 there were 1876 prosecutions for offences under the Sale of Liquor Act.
Approximately 64 percent (1201) of these prosecutions resulted in a conviction.
• In 1998 there were 26 512 prosecutions for traffic offences involving alcohol.Approximately 91 percent (24 059) of these prosecutions resulted in a conviction.
Mortality• There were 142 deaths in 1997 where the underlying cause of death was an alcohol-
related condition. The age-standardised mortality rate due to alcohol-related conditionswas 3.3 per 100 000 population.
• Ten percent of deaths due to external causes (eg, falls, motor vehicle accidents,suicide) involved a positive blood alcohol concentration in the deceased.
• Eleven percent of female drivers and 21 percent of male drivers involved in fatal carcrashes over the 1996–98 period had alcohol involvement. Overall, drinking driverscontributed to 23 percent of all fatal motor vehicle accidents and 14 percent of allinjury motor vehicle accidents in the year ended December 1999.
• Alcohol was involved in 19 percent of all drownings over the period 1980–99.
Hospitalisations• There were 8551 publicly funded hospitalisations in 1998 where a diagnosis of an
alcohol-related condition or alcohol involvement was made. The age-standardisedhospitalisation rate was 198.1 per 100 000 population.
10 New Zealand Drug Statistics
ALCOHOL PRODUCTION / QUANTITIES
Alcohol available for consumption may be measured in terms of the volume of alcoholicbeverages available for consumption, or the volume of the alcohol content of alcoholicbeverages available for consumption (that is, absolute alcohol). For example, the volumeof table wine is multiplied by 0.11 in order to obtain the volume of absolute alcoholavailable for consumption in this particular type of beverage.
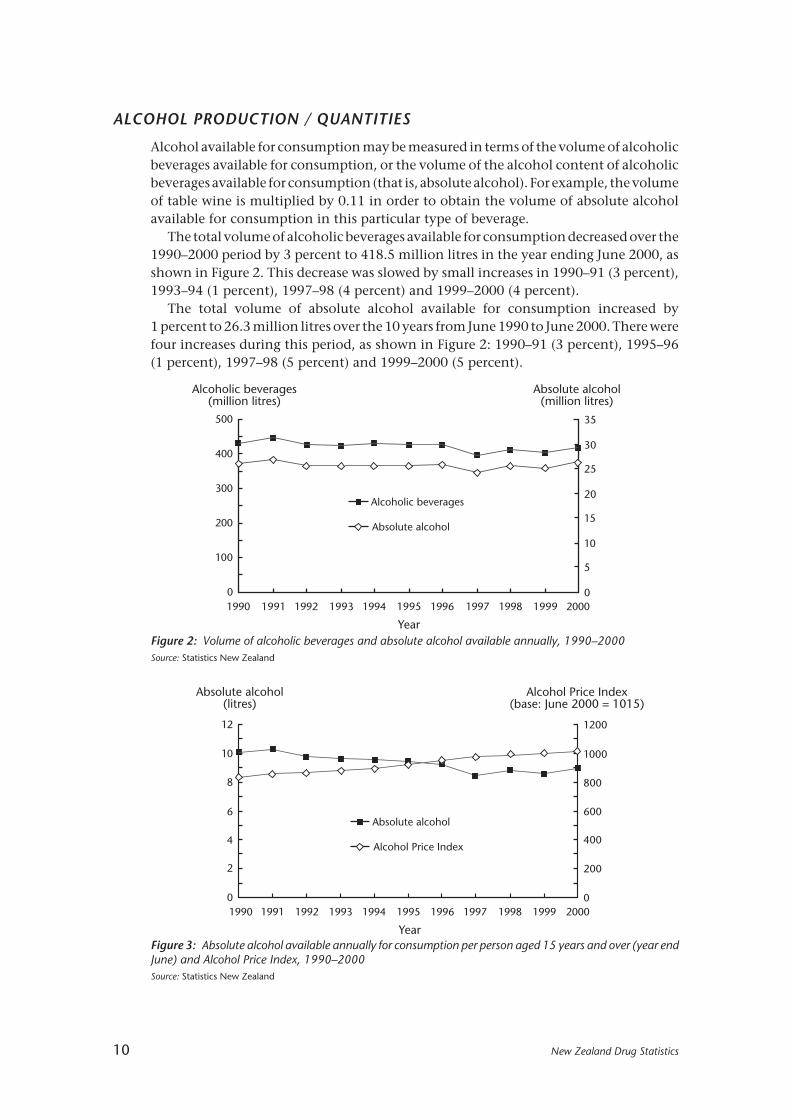
The total volume of alcoholic beverages available for consumption decreased over the1990–2000 period by 3 percent to 418.5 million litres in the year ending June 2000, asshown in Figure 2. This decrease was slowed by small increases in 1990–91 (3 percent),1993–94 (1 percent), 1997–98 (4 percent) and 1999–2000 (4 percent).
The total volume of absolute alcohol available for consumption increased by1 percent to 26.3 million litres over the 10 years from June 1990 to June 2000. There werefour increases during this period, as shown in Figure 2: 1990–91 (3 percent), 1995–96(1 percent), 1997–98 (5 percent) and 1999–2000 (5 percent).
Figure 2: Volume of alcoholic beverages and absolute alcohol available annually, 1990–2000Source: Statistics New Zealand
0
2
4
6
8
10
12
0
200
400
600
800
1000
1200
Alcohol Price Index(base: June 2000 = 1015)
1990 1992 1994 1996 1998 2000
Year
1991 1993 1995 1997 1999
Absolute alcohol
Alcohol Price Index
Absolute alcohol(litres)
Figure 3: Absolute alcohol available annually for consumption per person aged 15 years and over (year endJune) and Alcohol Price Index, 1990–2000Source: Statistics New Zealand
0
100
200
300
400
500
Alcoholic beverages(million litres)
0
5
10
15
20
25
30
35
Alcoholic beverages
Absolute alcohol
Absolute alcohol(million litres)
1990 1992 1994 1996 1998 2000
Year
1997 1999199519931991

New Zealand Drug Statistics 11
There was 11 percent less absolute alcohol available per person aged 15 years and overin the year ending June 2000 than in the year ending June 1990. The largest decrease,of 8 percent, was in the period from the year ending June 1996 to the year ending June1997. There were slight increases in absolute alcohol available annually per person inthe periods from June 1990 to June 1991 (2 percent), June 1997 to June 1998 (4 percent),and June 1999 to June 2000 (4 percent), as shown in Figure 3.
Alcoholic drinks have increased steadily in price over the 1990–2000 period by a totalof 22 percent. Alcoholic drink prices rose during every one of the 10 years from June 1990to June 2000, with year-on-year increases ranging between 1 and 3 percent, as shown inFigure 3. Although no precise correlation appears to exist, overall as alcohol increasedin price, the alcohol available for consumption decreased.
Consumption, price, and the Sale of Liquor Act 1989
Recent research has specified the impact of changes in the real price of alcoholicbeverages, and changes in the availability of wine on the consumption of alcohol in NewZealand.1
Amendments to the Sale of Liquor Act 1989 permitted the sale of wine by supermarkets(defined by size) and large grocery stores, but not smaller corner stores. This resulted ina sharp permanent increase in wine consumption in New Zealand. After controlling forthe effects of price changes and normal seasonal fluctuations in consumption, there wasan estimated 16 percent increase in the per capita volume of wine consumed in the threemonths after the legislative changes came into force.
The increased availability and consumption of wine did not affect the consumptionof beer, but it may have affected the consumption of spirits. There was an estimated 16.5percent decrease in the volume of spirits consumed per capita in the three months afterthe changes to the Sale of Liquor Act came into effect. This estimate again controls forthe effects of price changes and normal seasonal variations in consumption.
The effect of price on alcohol consumption has also been estimated. The followingfigures are estimates of the relationship between prices and consumption (elasticities)over the period 1984 to 1997, controlling for the impact of the amendments to the Saleof Liquor Act. Note that the estimation took into account seasonal changes and Sale ofLiquor Act changes as well as price.
• When the price of wine decreased 10 percent in real terms, wine consumptionincreased by 7 percent.
• When the price of beer increased 10 percent in real terms, beer consumptiondecreased by 10.2 percent.
• There was no clear trend in the real price of spirits, and spirits consumption in anycase appeared to be price inelastic.
• When the price of absolute alcohol increased by 10 percent in real terms, consumptiondecreased by 21 percent.2 This response is principally attributable to beer, since beeris the largest component in New Zealand’s alcohol consumption.
1 Zhang J F, Casswell S. 1999. The effects of real price and a change in the distribution system on alcohol consumption. Drug and Alcohol Review18: 371-378.
2 This elasticity is larger than the cited elasticities for wine and beer, because it is based on absolute alcohol, whereas the elasticities of wineand beer are based on the whole beverage.

12 New Zealand Drug Statistics
ALCOHOL USE
Prevalence of use
According to the 1995 National Alcohol Survey, 87 percent of people aged 14 to 65 yearshad consumed alcohol in the previous 12 months.1 There was little difference betweenthe sexes; the figure for men was 89 percent and for women it was 85 percent. Theaverage frequency of drinking was about every second day for men and about every thirdday for women.
There was a lower proportion of drinkers in the Northern region (excluding Aucklandurban area) than in the rest of the country (80 percent of men and women). Large cities,with the exception of Auckland, tended to have more drinkers than elsewhere (93percent of men and 89 percent of women).
Data on changes in drinking behaviour in the 1990s can be obtained from the annualAuckland Alcohol Survey.2 Among 20-to-65-year-olds, the proportion of drinkersremained fairly steady during the 1990s at between 85 and 88 percent. The proportionamong 14-to-19-year-olds, however, declined from 1990 to 1996, from 82 percent to 66percent. However, from 1996 to 1999, the proportion of 14-to-19-year-olds who weredrinkers rose again to 77 percent (Figure 4).
1 Wyllie A, Millard M, Zhang J F. 1996. Drinking in New Zealand: A National Survey, 1995. Auckland: Alcohol and Public Health Research Unit.2 Casswell S, Bhatta K. 2001. A Decade of Drinking: Ten Year Trends in Drinking Patterns. Auckland: Alcohol and Public Health Research Unit.
See also: Casswell S. 1999. Trends in Patterns of Youth Drinking and Implications for Policy. Paper presented at the 38th International Congresson Alcohol, Drugs and Other Dependencies, Vienna, August 1999.
Figure 4: Proportion of drinkers by age group, 1990–99Source: Alcohol and Public Health Research Unit
Typical quantity consumed
According to the 1995 National Alcohol Survey, the average quantity of alcoholconsumed on a typical drinking occasion was 51 mL of absolute alcohol (equivalent to
0
20
40
60
80
100
1990 1991 1992 1993 1994 1995 1996 1997 1998
Year
Percentageof sample
10
50
30
70
90
14–19
20–65
1999
New Zealand Drug Statistics 13
three cans of full-strength beer1). The average amount drunk per typical occasion was64 mL of absolute alcohol for men, and 39 mL of absolute alcohol for women.
Men accounted for about three-quarters of total alcohol consumption.
Frequency of drinking
According to the 1995 National Alcohol Survey, the average frequency of drinking wasfour times a week for men, and between two and three times a week for women.Frequency of drinking was greater at ages over 20 years than at ages younger than 20.
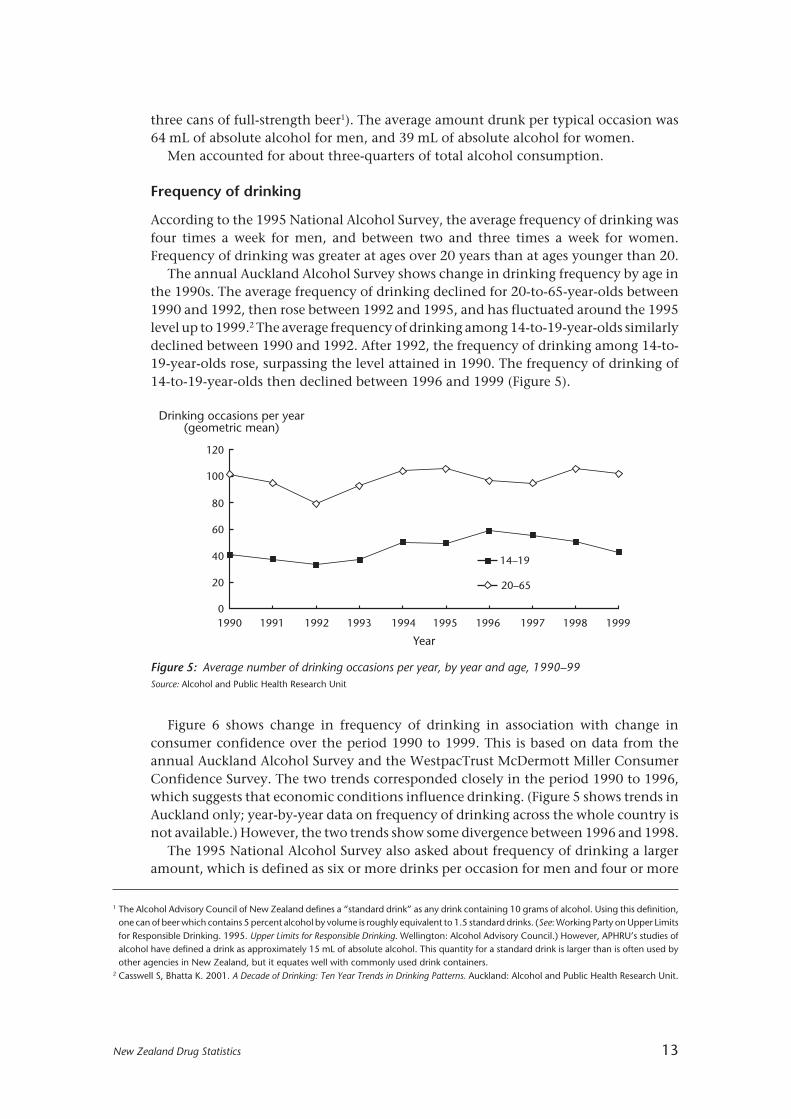
The annual Auckland Alcohol Survey shows change in drinking frequency by age inthe 1990s. The average frequency of drinking declined for 20-to-65-year-olds between1990 and 1992, then rose between 1992 and 1995, and has fluctuated around the 1995level up to 1999.2 The average frequency of drinking among 14-to-19-year-olds similarlydeclined between 1990 and 1992. After 1992, the frequency of drinking among 14-to-19-year-olds rose, surpassing the level attained in 1990. The frequency of drinking of14-to-19-year-olds then declined between 1996 and 1999 (Figure 5).
1 The Alcohol Advisory Council of New Zealand defines a “standard drink” as any drink containing 10 grams of alcohol. Using this definition,one can of beer which contains 5 percent alcohol by volume is roughly equivalent to 1.5 standard drinks. (See: Working Party on Upper Limitsfor Responsible Drinking. 1995. Upper Limits for Responsible Drinking. Wellington: Alcohol Advisory Council.) However, APHRU’s studies ofalcohol have defined a drink as approximately 15 mL of absolute alcohol. This quantity for a standard drink is larger than is often used byother agencies in New Zealand, but it equates well with commonly used drink containers.
2 Casswell S, Bhatta K. 2001. A Decade of Drinking: Ten Year Trends in Drinking Patterns. Auckland: Alcohol and Public Health Research Unit.
Figure 5: Average number of drinking occasions per year, by year and age, 1990–99Source: Alcohol and Public Health Research Unit
Figure 6 shows change in frequency of drinking in association with change inconsumer confidence over the period 1990 to 1999. This is based on data from theannual Auckland Alcohol Survey and the WestpacTrust McDermott Miller ConsumerConfidence Survey. The two trends corresponded closely in the period 1990 to 1996,which suggests that economic conditions influence drinking. (Figure 5 shows trends inAuckland only; year-by-year data on frequency of drinking across the whole country isnot available.) However, the two trends show some divergence between 1996 and 1998.
The 1995 National Alcohol Survey also asked about frequency of drinking a largeramount, which is defined as six or more drinks per occasion for men and four or more
1990 1991 1992 1993 1994 1995 1996 1997 1998
Year
Drinking occasions per year(geometric mean)
14–19
20–65
1999
120
100
80
0
40
60
20

14 New Zealand Drug Statistics
Male Female
14–15 16–17 18–19 20–24 25–29 30–39 40–49 50–65
Age
50
40
30
20
10
0
Percentage ofdrinkers
drinks per occasion for women. Twenty-one percent of all male drinkers stated that theyconsumed a larger amount at least once a week. This contrasted with women, of whomonly 8 percent consumed a larger amount at least once a week. Over 38 percent of menat ages 18 to 24 years consumed a larger amount on a weekly basis (Figure 7). Twentypercent of women of ages 16 to 24 years also drank these larger amounts on a weeklybasis. Thirteen percent of men and 4 percent of women also stated that they drankenough to feel drunk at least once a week.
Figure 6: Auckland consumer confidence and frequency of drinking, 1990–99Source: Economic Dept, WestpacTrust; Alcohol and Public Health Research Unit
Figure 7: Percentage drinking larger amounts at least weekly, by age group, 1995Source: Alcohol and Public Health Research Unit
Change in typical quantity consumed
The typical quantity consumed by young people rose in the 1990s. Figure 8 showschange in the quantities of absolute alcohol consumed on typical drinking occasions by14-to-19-year-olds and 20-to-65-year-olds, during the period 1990 to 1999.
Age group
50
100
150
25
50
75
100
150
0
Consumerconfidence
0
Consumer confidence
Drinking frequency
1990 1992 1994 1996 1998
Year
1997199519931991
125
Drinking occasions per year(geometric mean)
200
1999

New Zealand Drug Statistics 15
The typical amount consumed by 20-to-65-year-olds increased only slightly between1990 and 1999. The typical quantity consumed by 14-to-19-year-olds, however, rosemarkedly over the 1990–99 period, by about two drinks per typical occasion. Furtherdisaggregation of the younger age group reveals that most of this increase is attributableto 14-to-17-year-olds. People in this age group were drinking about three drinks pertypical occasion in 1990, and five drinks per typical occasion in 1998.
Figure 8: Typical quantities consumed, by age, 1990–99Source: Alcohol and Public Health Research Unit
Figure 9: Change in distribution of 14-to-19-year-olds, by number of drinks (including abstention) pertypical occasion, 1990–99Source: Alcohol and Public Health Research Unit
Figure 9 shows the change between 1990 and 1999 in the distribution of 14-to-19-year-olds by typical quantities consumed. At the beginning of the decade, 12 percent ofthis age group consumed six or more drinks on a typical occasion. In 1999, theproportion who drank six or more drinks was 25 percent. The proportion in this groupsteadily increased through the decade, although the proportion of abstainers has alsoincreased.
Percentage of14–19-year-olds
100
80
60
40
20
01990 1991 1992 1993 199619951994 1997 1998 1999
Abstainers 1–2 drinks 3–5 drinks 6+ drinks
Year
1990 1991 1992 1993 1994 1995 1996 1997 1998
Year
Millilitres ofabsolute alcohol
(geometric mean)
1999
75
14–19
20–65
25
0
50
16 New Zealand Drug Statistics
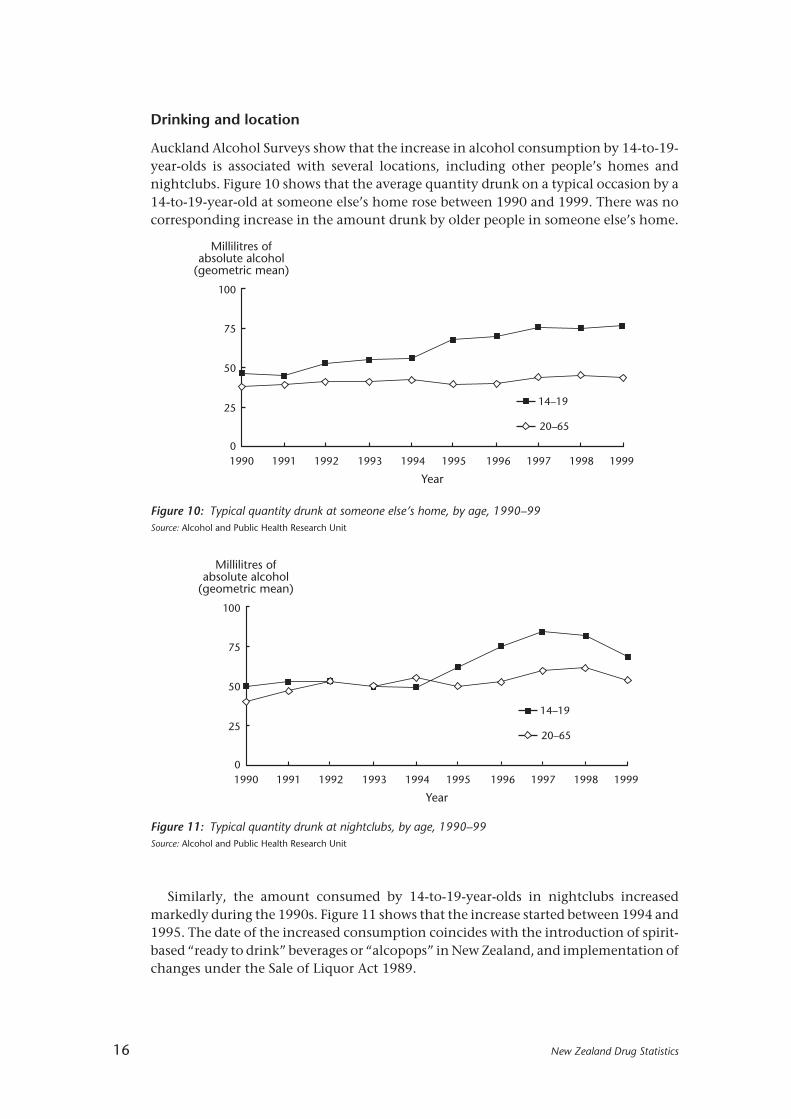
Drinking and location
Auckland Alcohol Surveys show that the increase in alcohol consumption by 14-to-19-year-olds is associated with several locations, including other people’s homes andnightclubs. Figure 10 shows that the average quantity drunk on a typical occasion by a14-to-19-year-old at someone else’s home rose between 1990 and 1999. There was nocorresponding increase in the amount drunk by older people in someone else’s home.
Figure 10: Typical quantity drunk at someone else’s home, by age, 1990–99Source: Alcohol and Public Health Research Unit
Figure 11: Typical quantity drunk at nightclubs, by age, 1990–99Source: Alcohol and Public Health Research Unit
Similarly, the amount consumed by 14-to-19-year-olds in nightclubs increasedmarkedly during the 1990s. Figure 11 shows that the increase started between 1994 and1995. The date of the increased consumption coincides with the introduction of spirit-based “ready to drink” beverages or “alcopops” in New Zealand, and implementation ofchanges under the Sale of Liquor Act 1989.
1990 1991 1992 1993 1994 1995 1996 1997 1998
Year
Millilitres ofabsolute alcohol
(geometric mean)
1999
75
14–19
20–65
25
0
50
100
1990 1991 1992 1993 1994 1995 1996 1997 1998
Year
Millilitres ofabsolute alcohol
(geometric mean)
1999
75
14–19
20–6525
0
50
100
New Zealand Drug Statistics 17
MÂORI USE OF ALCOHOL
Prevalence of use
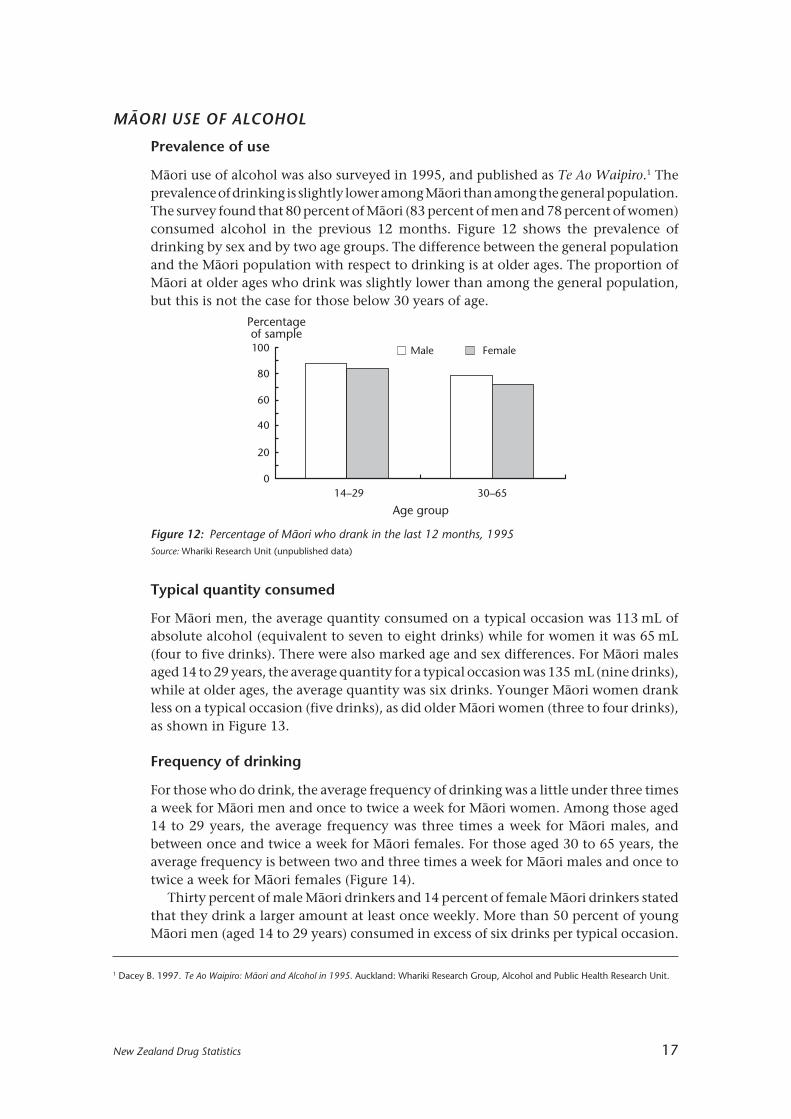
Mâori use of alcohol was also surveyed in 1995, and published as Te Ao Waipiro.1 Theprevalence of drinking is slightly lower among Mâori than among the general population.The survey found that 80 percent of Mâori (83 percent of men and 78 percent of women)consumed alcohol in the previous 12 months. Figure 12 shows the prevalence ofdrinking by sex and by two age groups. The difference between the general populationand the Mâori population with respect to drinking is at older ages. The proportion ofMâori at older ages who drink was slightly lower than among the general population,but this is not the case for those below 30 years of age.
Male Female
Percentageof sample100
80
60
40
20
014–29 30–65
Age group
Figure 12: Percentage of Mâori who drank in the last 12 months, 1995Source: Whariki Research Unit (unpublished data)
1 Dacey B. 1997. Te Ao Waipiro: Mâori and Alcohol in 1995. Auckland: Whariki Research Group, Alcohol and Public Health Research Unit.
Typical quantity consumed
For Mâori men, the average quantity consumed on a typical occasion was 113 mL ofabsolute alcohol (equivalent to seven to eight drinks) while for women it was 65 mL(four to five drinks). There were also marked age and sex differences. For Mâori malesaged 14 to 29 years, the average quantity for a typical occasion was 135 mL (nine drinks),while at older ages, the average quantity was six drinks. Younger Mâori women drankless on a typical occasion (five drinks), as did older Mâori women (three to four drinks),as shown in Figure 13.
Frequency of drinking
For those who do drink, the average frequency of drinking was a little under three timesa week for Mâori men and once to twice a week for Mâori women. Among those aged14 to 29 years, the average frequency was three times a week for Mâori males, andbetween once and twice a week for Mâori females. For those aged 30 to 65 years, theaverage frequency is between two and three times a week for Mâori males and once totwice a week for Mâori females (Figure 14).
Thirty percent of male Mâori drinkers and 14 percent of female Mâori drinkers statedthat they drink a larger amount at least once weekly. More than 50 percent of youngMâori men (aged 14 to 29 years) consumed in excess of six drinks per typical occasion.

18 New Zealand Drug Statistics
The survey also asked respondents how often they felt drunk. Seventy-nine percentof men and 59 percent of women drank enough to feel drunk at least once a year, and43 percent of men and 22 percent of women consumed this much at least once a month.
PACIFIC PEOPLES’ USE OF ALCOHOL
Prevalence of use
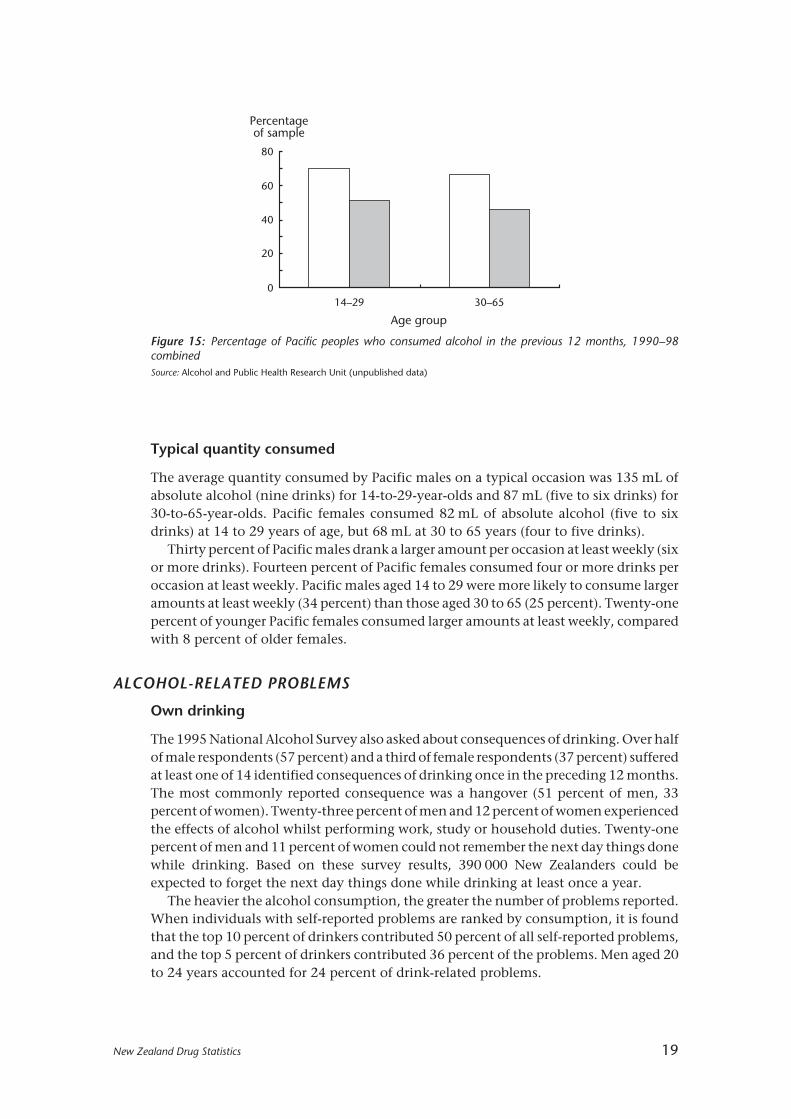
The annual Auckland Alcohol Survey showed that during the 1990s, 59 percent ofPacific peoples consumed alcohol. This makes the proportion of abstainers in Pacificpeoples communities high in comparison with the general population or the Mâoripopulation.
Figure 15 shows the percentage of Pacific peoples who drank alcohol in the 12 monthsprior to interview, by sex and age. Seventy percent of young men and 51 percent ofyoung women had consumed alcohol. The proportions of older Pacific men and womenwho had consumed alcohol were 66 and 46 percent respectively.
0
20
40
60
80
Days per year
14–29 30–65
Age group
Male Female
100
120
140
160
180
Figure 14: Frequency of drinking by Mâori, by age and sex, 1995Source: Whariki Research Unit (unpublished data)
Male Female
Millilitres ofabsolutealcohol
14–29 30–65
Age group
140
120
100
80
60
40
20
0
Figure 13: Amount consumed on a typical occasion by Mâori, by age and sex, 1995Source: Whariki Research Unit (unpublished data)
New Zealand Drug Statistics 19
Typical quantity consumed
The average quantity consumed by Pacific males on a typical occasion was 135 mL ofabsolute alcohol (nine drinks) for 14-to-29-year-olds and 87 mL (five to six drinks) for30-to-65-year-olds. Pacific females consumed 82 mL of absolute alcohol (five to sixdrinks) at 14 to 29 years of age, but 68 mL at 30 to 65 years (four to five drinks).
Thirty percent of Pacific males drank a larger amount per occasion at least weekly (sixor more drinks). Fourteen percent of Pacific females consumed four or more drinks peroccasion at least weekly. Pacific males aged 14 to 29 were more likely to consume largeramounts at least weekly (34 percent) than those aged 30 to 65 (25 percent). Twenty-onepercent of younger Pacific females consumed larger amounts at least weekly, comparedwith 8 percent of older females.
ALCOHOL-RELATED PROBLEMS
Own drinking
The 1995 National Alcohol Survey also asked about consequences of drinking. Over halfof male respondents (57 percent) and a third of female respondents (37 percent) sufferedat least one of 14 identified consequences of drinking once in the preceding 12 months.The most commonly reported consequence was a hangover (51 percent of men, 33percent of women). Twenty-three percent of men and 12 percent of women experiencedthe effects of alcohol whilst performing work, study or household duties. Twenty-onepercent of men and 11 percent of women could not remember the next day things donewhile drinking. Based on these survey results, 390 000 New Zealanders could beexpected to forget the next day things done while drinking at least once a year.
The heavier the alcohol consumption, the greater the number of problems reported.When individuals with self-reported problems are ranked by consumption, it is foundthat the top 10 percent of drinkers contributed 50 percent of all self-reported problems,and the top 5 percent of drinkers contributed 36 percent of the problems. Men aged 20to 24 years accounted for 24 percent of drink-related problems.
Figure 15: Percentage of Pacific peoples who consumed alcohol in the previous 12 months, 1990–98combinedSource: Alcohol and Public Health Research Unit (unpublished data)
0
20
40
60
80
Percentageof sample
14–29 30–65
Age group

20 New Zealand Drug Statistics
The younger ages have a higher average number of problems resulting from drinkingthan the older ages. At age 18 to 24 years, over half of males were reporting three or moreproblems, compared to less than 20 percent at ages above 30 years. Roughly a third offemales between ages 16 and 24 years also reported at least three problems.
Drinking by others
Respondents in the 1995 National Alcohol Survey were asked about four specificproblems caused by the drinking of others. Table 1 lists these four problems and showsthat the most frequently reported of these were physical assault and sexual harassment(about 7 percent for each problem after combining the two sexes).
Table 1: Problems experienced in the last 12 months as the result of someone else’s drinking,percentages by sex and ethnicity, 1995
Type of problem Males Females
Motor vehicle accident 3 1
Other type of accident causing3 2
injury or major damage
Physical assault 10 5
Sexual harassment 3 11
Sample size (n) 1969 2263
Source: Alcohol and Public Health Research Unit
ALCOHOL-RELATED PROBLEMS FOR MÂORI
Own drinking
Mâori men and women were asked whether they have experienced one or more of arange of specified consequences of their drinking. Almost two-thirds of Mâori men(65 percent) and a little under half of Mâori women (45 percent) confirmed that theyhad experienced at least one of the listed drinking-related problems.
The most common consequence reported was a hangover: 56 percent of Mâori menand 39 percent of Mâori women reported that this had occurred to them at least oncein the past year. Twenty-five percent of Mâori men and 12 percent of Mâori women alsoreported that they had had a hangover at least five times in the previous 12 months.
One-third of Mâori men (32 percent) and one in six Mâori women (17 percent) hadat least once in the previous 12 months awakened the next day unable to rememberactions while drinking. One-quarter of Mâori men (24 percent) and one in eight Mâoriwomen (13 percent) had got into a serious argument while drinking.
Drinking by others
Mâori respondents in the 1995 National Alcohol Survey were asked about four specificproblems caused by the drinking of others.
New Zealand Drug Statistics 21
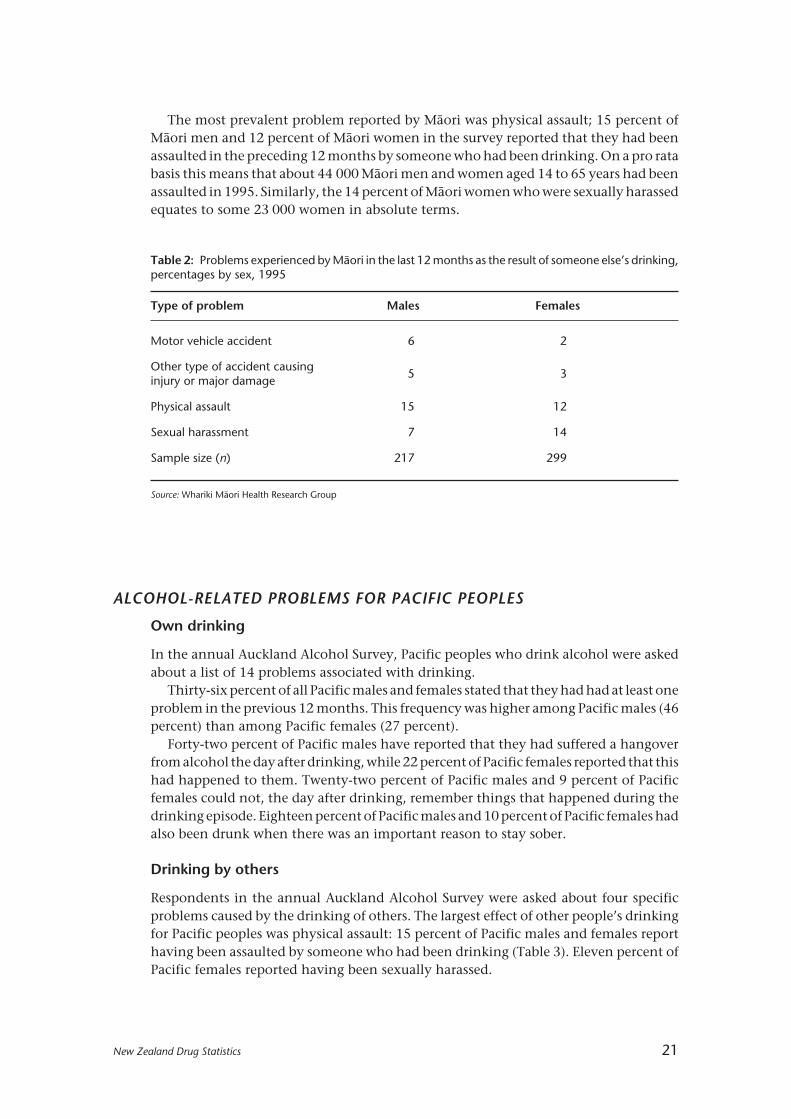
The most prevalent problem reported by Mâori was physical assault; 15 percent ofMâori men and 12 percent of Mâori women in the survey reported that they had beenassaulted in the preceding 12 months by someone who had been drinking. On a pro ratabasis this means that about 44 000 Mâori men and women aged 14 to 65 years had beenassaulted in 1995. Similarly, the 14 percent of Mâori women who were sexually harassedequates to some 23 000 women in absolute terms.
Table 2: Problems experienced by Mâori in the last 12 months as the result of someone else’s drinking,percentages by sex, 1995
Type of problem Males Females
Motor vehicle accident 6 2
Other type of accident causing5 3
injury or major damage
Physical assault 15 12
Sexual harassment 7 14
Sample size (n) 217 299
Source: Whariki Mâori Health Research Group
ALCOHOL-RELATED PROBLEMS FOR PACIFIC PEOPLES
Own drinking
In the annual Auckland Alcohol Survey, Pacific peoples who drink alcohol were askedabout a list of 14 problems associated with drinking.
Thirty-six percent of all Pacific males and females stated that they had had at least oneproblem in the previous 12 months. This frequency was higher among Pacific males (46percent) than among Pacific females (27 percent).
Forty-two percent of Pacific males have reported that they had suffered a hangoverfrom alcohol the day after drinking, while 22 percent of Pacific females reported that thishad happened to them. Twenty-two percent of Pacific males and 9 percent of Pacificfemales could not, the day after drinking, remember things that happened during thedrinking episode. Eighteen percent of Pacific males and 10 percent of Pacific females hadalso been drunk when there was an important reason to stay sober.
Drinking by others
Respondents in the annual Auckland Alcohol Survey were asked about four specificproblems caused by the drinking of others. The largest effect of other people’s drinkingfor Pacific peoples was physical assault: 15 percent of Pacific males and females reporthaving been assaulted by someone who had been drinking (Table 3). Eleven percent ofPacific females reported having been sexually harassed.
22 New Zealand Drug Statistics
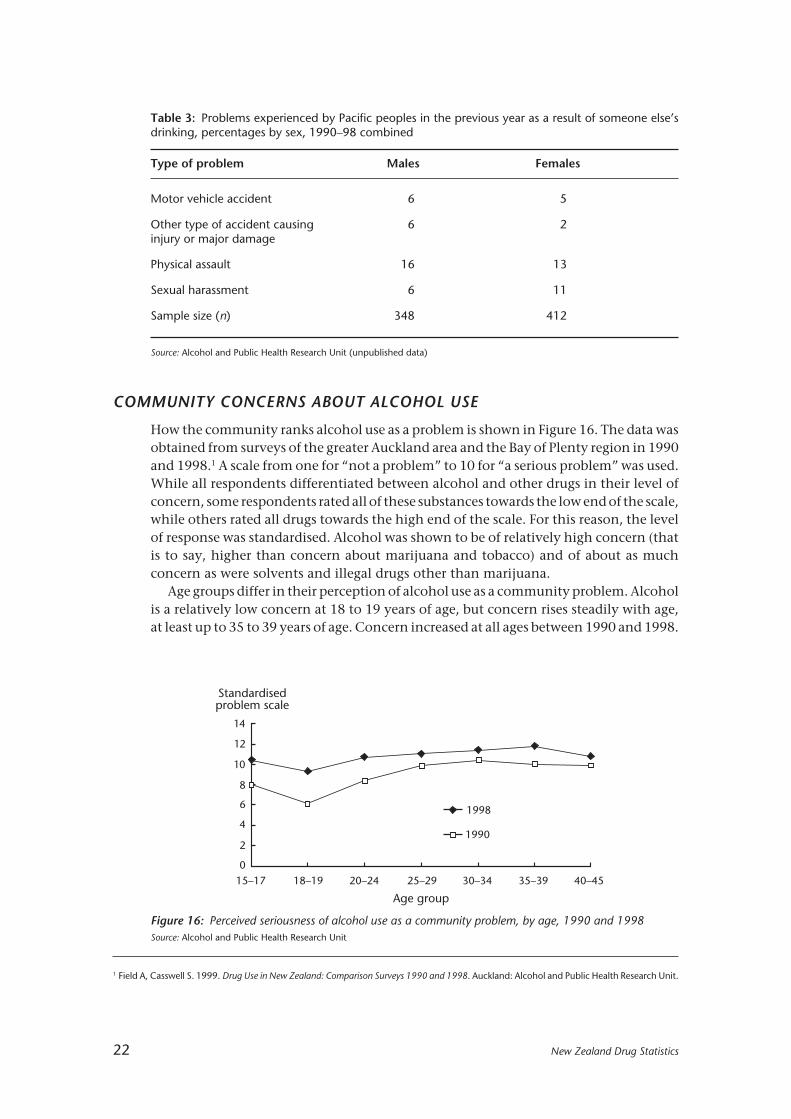
Table 3: Problems experienced by Pacific peoples in the previous year as a result of someone else’sdrinking, percentages by sex, 1990–98 combined
Type of problem Males Females
Motor vehicle accident 6 5
Other type of accident causing 6 2injury or major damage
Physical assault 16 13
Sexual harassment 6 11
Sample size (n) 348 412
Source: Alcohol and Public Health Research Unit (unpublished data)
COMMUNITY CONCERNS ABOUT ALCOHOL USE
How the community ranks alcohol use as a problem is shown in Figure 16. The data wasobtained from surveys of the greater Auckland area and the Bay of Plenty region in 1990and 1998.1 A scale from one for “not a problem” to 10 for “a serious problem” was used.While all respondents differentiated between alcohol and other drugs in their level ofconcern, some respondents rated all of these substances towards the low end of the scale,while others rated all drugs towards the high end of the scale. For this reason, the levelof response was standardised. Alcohol was shown to be of relatively high concern (thatis to say, higher than concern about marijuana and tobacco) and of about as muchconcern as were solvents and illegal drugs other than marijuana.
Age groups differ in their perception of alcohol use as a community problem. Alcoholis a relatively low concern at 18 to 19 years of age, but concern rises steadily with age,at least up to 35 to 39 years of age. Concern increased at all ages between 1990 and 1998.
15–17 18–19 20–24 25–29 30–34 35–39 40–45
Age group
0
2
4
6
8
10
12
14
1990
1998
Standardisedproblem scale
1 Field A, Casswell S. 1999. Drug Use in New Zealand: Comparison Surveys 1990 and 1998. Auckland: Alcohol and Public Health Research Unit.
Figure 16: Perceived seriousness of alcohol use as a community problem, by age, 1990 and 1998Source: Alcohol and Public Health Research Unit

New Zealand Drug Statistics 23
ALCOHOL AND OFFENDING
Information is not recorded for all crime on whether the offender was under theinfluence of alcohol when he or she committed the offence. However, some offences canbe identified as involving alcohol because they were either committed against the Saleof Liquor Act 1989, or they involved a specific offence where alcohol levels over a certainlimit are illegal in specified circumstances — such as driving a motor vehicle.
Sale of Liquor Act 1989
The Sale of Liquor Act 1989 is the main legislation dealing with issues surrounding thesale, purchase and consumption of alcohol. The primary objective of the Act is:
To establish a reasonable system of control over the sale and supply of liquor to thepublic with the aim of contributing to the reduction of liquor abuse, so far as that canbe achieved by legislative means.”
Following recent amendments, the Sale of Liquor Act restricts the sale of alcohol to thoseunder the age of 18, as well as to certain premises that are specially licensed to be ableto sell alcohol products on certain days and times. It is an offence to sell alcohol tounder-age purchasers or in breach of any other licence conditions or requirements.
Apprehensions under the Sale of Liquor Act
Apprehensions under the Sale of Liquor Act fluctuated between 1994 and 19991, witha low of 4421 in the year ended 31 December 1995 and a high of 5378 in the year ended1998 (Table 4). There were consistently over twice as many males apprehended asfemales.
Table 5 presents the age of those apprehended under the Sale of Liquor Act for thesix-year period between 1994 and 1999. The majority (at least 79 percent) of thoseapprehended were under 20 years; this was the minimum legal drinking age up until 1December 1999, when major amendments to the Sale of Liquor Act came into force.
“
Table 4: Apprehensions under Sale of Liquor Act 1989, by sex and year of apprehension, number andpercentages of total, 1994–99 (percentages in brackets)
1994 1995 1996 1997 1998 1999
Male: 3204 3111 3545 3270 3959 3317(68) (70) (70) (72) (74) (73)
Female: 1525 1310 1508 1275 1419 1250(32) (30) (30) (28) (26) (27)
Total: 4729 4421 5053 4545 5378 4567(100) (100) (100) (100) (100) (100)
Source: New Zealand Police
1 Amendments to the Sale of Liquor Act which took effect in December 1999 have resulted in a significant drop in the number of recorded“apprehensions” under the legislation in 2000, with a large number of offences now dealt with by means of infringement notices. This makesit difficult to draw meaningful direct comparisons between the pre-2000 data and post-2000 data. In future updates of this publication, dataon these infringement notices will also be presented.

24 New Zealand Drug Statistics
Prosecutions under the Sale of Liquor Act
There was a decrease in convictions under the Sale of Liquor Act between 1990 and 1992(Table 6), which some analysts have suggested is due largely to a decline in policeinvolvement in this area after the passage of the Sale of Liquor Act.1 Convictions underthe Sale of Liquor Act have been a little higher in number since 1993, but the 1998 figurewas still slightly lower than the figure in 1990.
Convictions under the Sale of Liquor Act
More males than females are convicted of offences under the Sale of Liquor Act(Table 7). The proportion of females convicted of these offences increased each yearfrom 1991 to 1994, before decreasing in 1995. In 1998 the proportion of femalesconvicted of these offences was slightly more than the equivalent proportion in 1990.
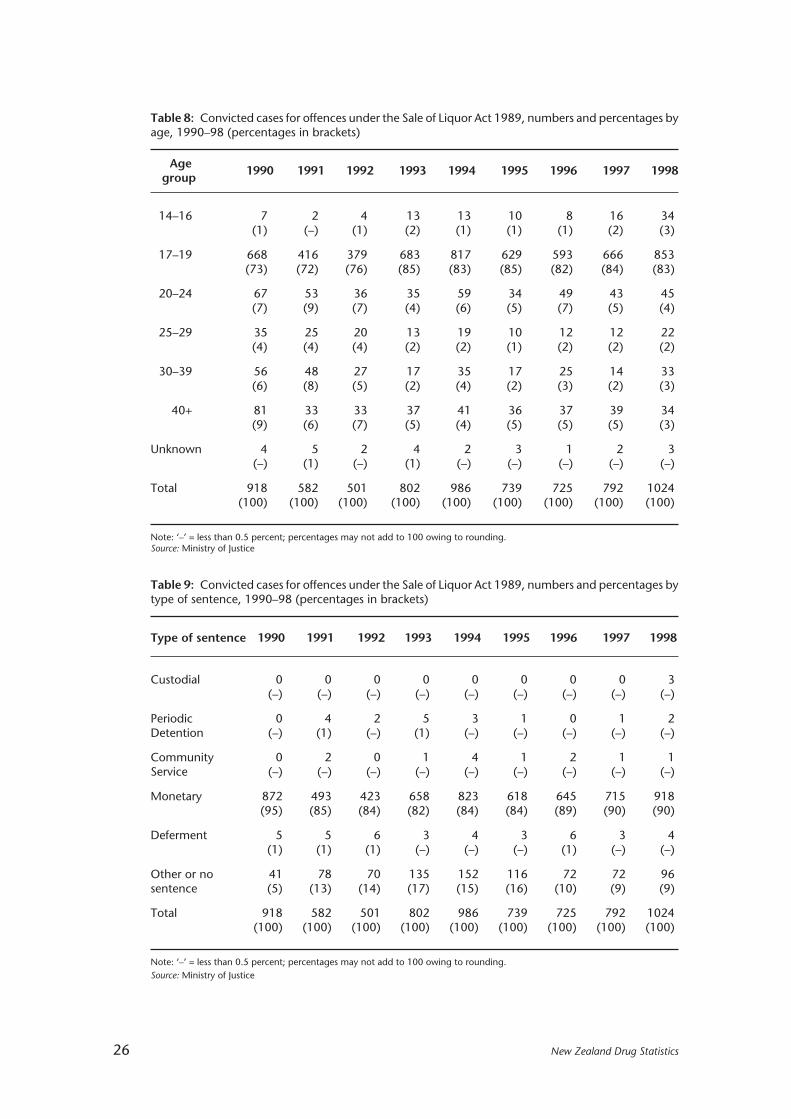
In 1998, 86 percent of convictions under the Sale of Liquor Act related to under-20-year-olds; while in 1990, 74 percent of those convicted of such offences were under 20(Table 8).
Table 5: Offender apprehensions under Sale of Liquor Act 1989, by age and year of apprehension,numbers and percentage of total, 1994–99 (percentages in brackets)
Age1994 1995 1996 1997 1998 1999group
10–14 126 110 108 91 116 130(3) (2) (2) (2) (2) (3)
15–19 3802 3704 4137 3495 4552 3781(80) (84) (82) (77) (85) (83)
20–24 180 121 196 141 164 136(4) (3) (4) (3) (3) (3)
25–29 114 74 138 142 130 125(2) (2) (3) (3) (2) (3)
30–34 101 79 108 140 82 93(2) (2) (2) (3) (2) (2)
35–39 89 102 81 132 92 105(2) (2) (2) (3) (2) (2)
40+ 317 229 285 404 242 197(7) (5) (6) (9) (4) (4)
Unknown 0 2 0 0 0 0(–) (–) (–) (–) (–) (–)
Total 4729 4421 5053 4545 5378 4567(100) (100) (100) (100) (100) (100)
Note: ‘–’ = less than 0.5 percent.Source: New Zealand Police
1 Statistics New Zealand. 1996. New Zealand Now: Crime. Wellington: Statistics New Zealand.

New Zealand Drug Statistics 25
Table 6: Outcomes of prosecutions for offences under the Sale of Liquor Act 1989, numbers andpercentages, 1990-98 (percentages in brackets)
Outcome ofprosecutions 1990 1991 1992 1993 1994 1995 1996 1997 1998
Convicted 1248 759 644 975 1163 940 932 960 1201(74) (59) (57) (63) (65) (63) (56) (59) (64)
Youth Court 14 11 4 4 1 6 6 2 7proved (1) (1) (–) (–) (–) (–) (–) (–) (–)
S19 Discharge1 55 70 74 124 206 127 116 129 134(3) (5) (7) (8) (12) (8) (7) (8) (7)
Not proved 362 453 402 441 422 431 618 550 534(22) (35) (36) (29) (24) (29) (37) (34) (29)
Total 1679 1293 1124 1544 1792 1504 1672 1641 1876(100) (100) (100) (100) (100) (100) (100) (100) (100)
Note: ‘–’ = less than 0.5 percentSource: Ministry of Justice
Table 7: Convicted cases for offences under the Sale of Liquor Act 1989, numbers and percentages bysex, 1990–98 (percentages in brackets)
1990 1991 1992 1993 1994 1995 1996 1997 1998
Male: 740 457 378 526 630 533 514 552 805(81) (79) (75) (66) (64) (72) (71) (70) (79)
Female: 173 120 121 272 355 203 211 238 216(19) (21) (24) (34) (36) (28) (29) (30) (21)
Unknown:* 5 5 2 4 1 3 0 2 3(1) (1) (–) (1) (–) (–) (–) (–) (–)
Total: 918 582 501 802 986 739 725 792 1024(100) (100) (100) (100) (100) (100) (100) (100) (100)
Note: ‘–’ = less than 0.5 percent.* Includes cases where the sex is recorded as a corporation.Source: Ministry of Justice
1 Section 19 of the Criminal Justice Act 1985 allows a person who is found or pleads guilty to be discharged without a conviction beingrecorded. Such a discharge is deemed to be an acquittal.
Most of those convicted of offences against the Sale of Liquor Act received a monetarypenalty (Table 9).
26 New Zealand Drug Statistics
Table 8: Convicted cases for offences under the Sale of Liquor Act 1989, numbers and percentages byage, 1990–98 (percentages in brackets)
Age1990 1991 1992 1993 1994 1995 1996 1997 1998group
14–16 7 2 4 13 13 10 8 16 34(1) (–) (1) (2) (1) (1) (1) (2) (3)
17–19 668 416 379 683 817 629 593 666 853(73) (72) (76) (85) (83) (85) (82) (84) (83)
20–24 67 53 36 35 59 34 49 43 45(7) (9) (7) (4) (6) (5) (7) (5) (4)
25–29 35 25 20 13 19 10 12 12 22(4) (4) (4) (2) (2) (1) (2) (2) (2)
30–39 56 48 27 17 35 17 25 14 33(6) (8) (5) (2) (4) (2) (3) (2) (3)
40+ 81 33 33 37 41 36 37 39 34(9) (6) (7) (5) (4) (5) (5) (5) (3)
Unknown 4 5 2 4 2 3 1 2 3(–) (1) (–) (1) (–) (–) (–) (–) (–)
Total 918 582 501 802 986 739 725 792 1024(100) (100) (100) (100) (100) (100) (100) (100) (100)
Note: ‘–’ = less than 0.5 percent; percentages may not add to 100 owing to rounding.Source: Ministry of Justice
Table 9: Convicted cases for offences under the Sale of Liquor Act 1989, numbers and percentages bytype of sentence, 1990–98 (percentages in brackets)
Type of sentence 1990 1991 1992 1993 1994 1995 1996 1997 1998
Custodial 0 0 0 0 0 0 0 0 3(–) (–) (–) (–) (–) (–) (–) (–) (–)
Periodic 0 4 2 5 3 1 0 1 2Detention (–) (1) (–) (1) (–) (–) (–) (–) (–)
Community 0 2 0 1 4 1 2 1 1Service (–) (–) (–) (–) (–) (–) (–) (–) (–)
Monetary 872 493 423 658 823 618 645 715 918(95) (85) (84) (82) (84) (84) (89) (90) (90)
Deferment 5 5 6 3 4 3 6 3 4(1) (1) (1) (–) (–) (–) (1) (–) (–)
Other or no 41 78 70 135 152 116 72 72 96sentence (5) (13) (14) (17) (15) (16) (10) (9) (9)
Total 918 582 501 802 986 739 725 792 1024(100) (100) (100) (100) (100) (100) (100) (100) (100)
Note: ‘–’ = less than 0.5 percent; percentages may not add to 100 owing to rounding.Source: Ministry of Justice

New Zealand Drug Statistics 27
Traffic offences involving alcohol
Another identifiable category of alcohol-related offending relates to traffic offences.These offences include driving causing death or injury where alcohol was involved, anddriving with an excess blood/breath alcohol (EBA) level — that is, “drink driving”.
Table 10: Prosecutions for traffic offences involving alcohol by type of offence, 1990–98
Type of offence 1990 1991 1992 1993 1994 1995 1996 1997 1998
Cause death1 151 114 77 42 36 55 44 28 26
Cause injury 257 311 276 220 224 237 223 172 199
Driving with26 923 31 576 27 304 25 057 23 473 26 411 26 548 26 204 26 287
EBA
Total 27 331 32 001 27 657 25 319 23 733 26 703 26 815 26 404 26 512
Source: Ministry of Justice
Prosecutions for traffic offences involving alcohol
The number of prosecutions for traffic offences involving alcohol increased between1990 and 1991, then decreased until 1994, before increasing again in 1995 andplateauing in recent years (Table 10). Overall, there has been a 3 percent decrease in thenumber of prosecutions for traffic offences involving alcohol from 1990 to 1998.
Almost all traffic prosecutions involving alcohol were for driving with EBA. Suchprosecutions accounted for 99 percent of all alcohol-related traffic offences in 1998. Thenumber of prosecutions for driving causing death where alcohol was involved hastended to fall throughout the 1990s (from 151 in 1990 to 26 in 1998), while the numberof prosecutions for driving causing injury where alcohol was involved has fluctuatedrather more (with 257 and 199 prosecutions in 1990 and 1998 respectively).
Aggregate information for all traffic offences involving alcohol is presented from thispoint onwards.
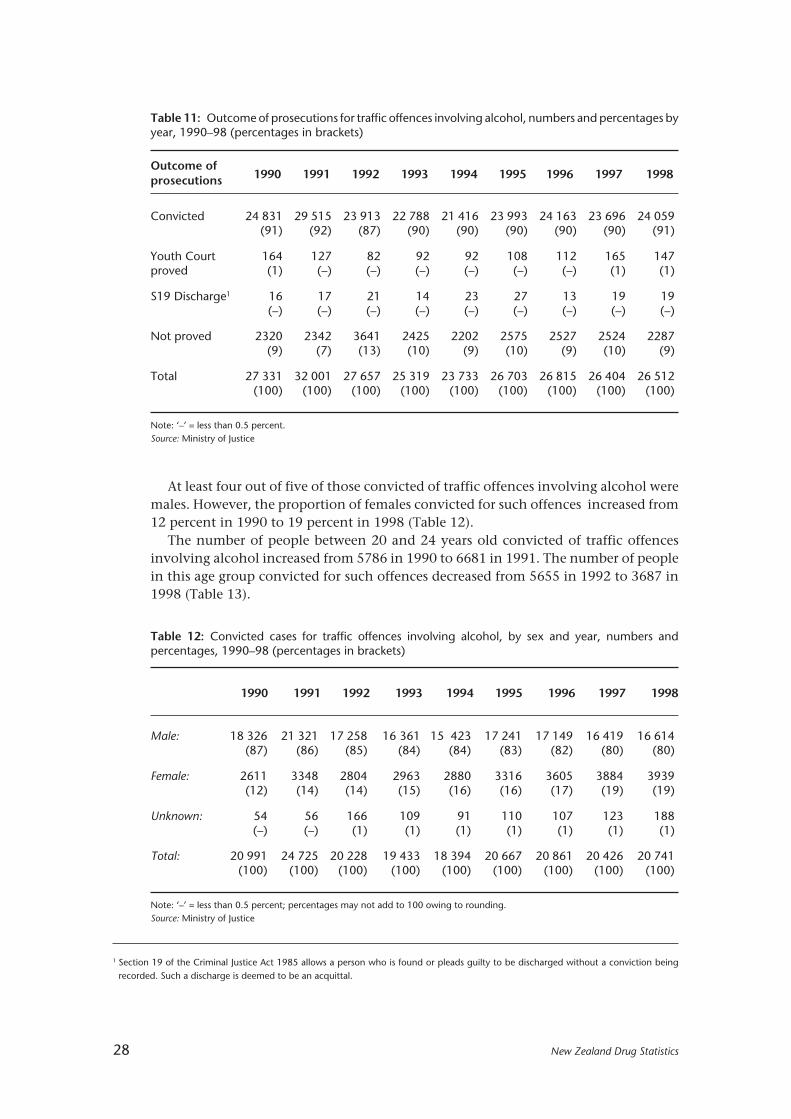
Since 1990, over 85 percent of prosecutions for traffic offences involving alcohol haveresulted in a conviction (Table 11).
Convictions for traffic offences involving alcohol
The following conviction information is based on the number of cases finalised eachyear. Because several charges may be combined into one case, the number of convictionsis more than the number of convicted cases given in Table 11.
Throughout the 1990s, conviction trends for traffic offences involving alcohol weresimilar to prosecution trends. The number of convictions for traffic offences involvingalcohol increased between 1990 and 1991, decreased until 1994, increased in 1995, andthen remained at a steady level to 1998, similar to the figure in 1990.
1 Driving offences causing death where the offender was charged with manslaughter rather than an offence under the Land Transport Act1998 are not included in these figures.
28 New Zealand Drug Statistics
At least four out of five of those convicted of traffic offences involving alcohol weremales. However, the proportion of females convicted for such offences increased from12 percent in 1990 to 19 percent in 1998 (Table 12).
The number of people between 20 and 24 years old convicted of traffic offencesinvolving alcohol increased from 5786 in 1990 to 6681 in 1991. The number of peoplein this age group convicted for such offences decreased from 5655 in 1992 to 3687 in1998 (Table 13).
Table 11: Outcome of prosecutions for traffic offences involving alcohol, numbers and percentages byyear, 1990–98 (percentages in brackets)
Outcome ofprosecutions 1990 1991 1992 1993 1994 1995 1996 1997 1998
Convicted 24 831 29 515 23 913 22 788 21 416 23 993 24 163 23 696 24 059(91) (92) (87) (90) (90) (90) (90) (90) (91)
Youth Court 164 127 82 92 92 108 112 165 147proved (1) (–) (–) (–) (–) (–) (–) (1) (1)
S19 Discharge1 16 17 21 14 23 27 13 19 19(–) (–) (–) (–) (–) (–) (–) (–) (–)
Not proved 2320 2342 3641 2425 2202 2575 2527 2524 2287(9) (7) (13) (10) (9) (10) (9) (10) (9)
Total 27 331 32 001 27 657 25 319 23 733 26 703 26 815 26 404 26 512(100) (100) (100) (100) (100) (100) (100) (100) (100)
Note: ‘–’ = less than 0.5 percent.Source: Ministry of Justice
Table 12: Convicted cases for traffic offences involving alcohol, by sex and year, numbers andpercentages, 1990–98 (percentages in brackets)
1990 1991 1992 1993 1994 1995 1996 1997 1998
Male: 18 326 21 321 17 258 16 361 15 423 17 241 17 149 16 419 16 614(87) (86) (85) (84) (84) (83) (82) (80) (80)
Female: 2611 3348 2804 2963 2880 3316 3605 3884 3939(12) (14) (14) (15) (16) (16) (17) (19) (19)
Unknown: 54 56 166 109 91 110 107 123 188(–) (–) (1) (1) (1) (1) (1) (1) (1)
Total: 20 991 24 725 20 228 19 433 18 394 20 667 20 861 20 426 20 741(100) (100) (100) (100) (100) (100) (100) (100) (100)
Note: ‘–’ = less than 0.5 percent; percentages may not add to 100 owing to rounding.Source: Ministry of Justice
1 Section 19 of the Criminal Justice Act 1985 allows a person who is found or pleads guilty to be discharged without a conviction beingrecorded. Such a discharge is deemed to be an acquittal.

New Zealand Drug Statistics 29
The number of convictions for traffic offences involving alcohol for those between30 and 39 years old increased from 4632 in 1990 to 5731 in 1991 but then decreased in1992 to almost the 1990 figure. Between 1995 and 1998 the number increased slightlyto just less than the number in 1991.
The number of those 40 years old and older who were convicted for traffic offencesinvolving alcohol showed a similar pattern to those between 30 and 39 years old,although the number in 1998 was greater than the number in 1991.
In 1990 and 1991 the age distribution of those convicted for traffic offences involvingalcohol was similar. However, as shown in Table 13, between 1995 and 1998 thedistribution changed. The proportion of those convicted for traffic offences involvingalcohol who were between 20 and 24 years old decreased from 24 percent in 1995 to18 percent in 1998. The proportion of those convicted for traffic offences involvingalcohol who were 40 years old or older increased from 18 percent in 1995 to 24 percentin 1998. In 1990 and 1991 those between 20 and 24 years old were the largest proportionof those convicted for traffic offences involving alcohol. However, between 1995 and1998 those between 30 and 39 years old were the largest proportion of those convictedfor traffic offences involving alcohol.
Table 13: Convicted cases for traffic offences involving alcohol, by age and year of conviction, 1990–98
Age 1990 1991 1992 1993 1994 1995 1996 1997 1998group
14–16 19 18 14 17 17 10 11 19 18(–) (–) (–) (–) (–) (–) (–) (–) (–)
17–19 2936 3189 2512 2649 2682 3051 2886 2732 2920(14) (13) (12) (14) (15) (15) (14) (13) (14)
20–24 5786 6681 5655 5147 4702 4872 4392 3887 3687(28) (27) (28) (27) (26) (24) (21) (19) (18)
25–29 4152 4692 3930 3702 3559 3888 3717 3710 3497(20) (19) (19) (19) (19) (19) (18) (18) (17)
30–39 4632 5731 4626 4809 4457 5139 5511 5593 5715(22) (23) (23) (25) (24) (25) (26) (27) (28)
40+ 3423 4365 3391 3049 2960 3683 4325 4468 4896(16) (18) (17) (16) (16) (18) (21) (22) (24)
Unknown 43 49 100 60 17 24 19 17 8(–) (–) (1) (–) (–) (–) (–) (–) (–)
Total 20 991 24 725 20 228 19 433 18 394 20 667 20 861 20 426 20 741(100) (100) (100) (100) (100) (100) (100) (100) (100)
Note: ‘–’ = less than 0.5 percent.Source: Ministry of Justice
Although the number of younger people convicted of traffic offences involvingalcohol has been decreasing in recent years, when compared to the population, youngerpeople convicted of such offences were still over-represented in 1998. In 1998, youngerpeople tended to be convicted for traffic offences involving alcohol at a higher rate thanother age groups. Nearly 18 per 1000 population aged between 17 and 19 years old wereconvicted of such offences (Table 14). However, the conviction rate for traffic offences

30 New Zealand Drug Statistics
involving alcohol tended to decrease with age until approximately three out of 1000 ofthose 40 years of age and older were convicted of such offences. Note that no rate hasbeen presented for 14-to-16-year-olds, as the majority of these cases that are processedare proven in a Youth Court setting, and so are not recorded as convictions.
Table 15: Convicted cases for traffic offences involving alcohol, type of sentence, numbers andpercentages by year, 1990–98 (percentages in brackets)
Type of sentence 1990 1991 1992 1993 1994 1995 1996 1997 1998
Custodial 428 468 441 519 397 453 569 626 606(2) (2) (2) (3) (2) (2) (3) (3) (3)
Periodic 3544 4339 3626 3652 3057 3126 3023 3062 3246Detention (17) (18) (18) (19) (17) (15) (15) (15) (16)
Community 90 110 147 137 89 82 79 35 26Programme (-) (-) (1) (1) (1) (-) (-) (-) (-)
Community 2042 3350 3596 3422 3078 2967 2667 2426 2697Service (10) (14) (18) (18) (17) (14) (13) (12) (13)
Supervision 315 299 289 447 451 523 575 572 531(2) (1) (1) (2) (3) (3) (3) (3) (3)
Monetary 14 346 15 823 11 770 10 921 11 024 13 224 13 683 13 455 13 364(68) (64) (58) (56) (60) (64) (66) (66) (64)
Driving 198 296 286 301 279 259 241 231 242Disqualification (1) (1) (1) (2) (2) (1) (1) (1) (1)
Deferment 0 7 10 5 2 0 2 1 3(–) (–) (–) (–) (–) (–) (–) (–) (–)
Other or no 28 33 63 29 17 33 22 18 26sentence (–) (–) (–) (–) (–) (–) (–) (–) (–)
Total 20 991 24 725 20 228 19 433 18 394 20 667 20 861 20 426 20 741(100) (100) (100) (100) (100) (100) (100) (100) (100)
Note: ‘–’ = less than 0.5 percent; percentages may not add to 100 owing to rounding.Source: Ministry of Justice
Table 14: Convictions for traffic offences involving alcohol, age-specific rate per 1000 population over17 years of age, by age group, 1998
Total 17–19 20–24 25–29 30–39 40+
5.5 17.9 13.8 12.3 9.5 3.3
Source: Ministry of Justice
Monetary penalties were most commonly imposed for traffic offences involvingalcohol, accounting for 64 percent of all sentences imposed for these offences in 1998.The community-based sentences of periodic detention and community service were thenext most commonly imposed sentences (Table 15).

New Zealand Drug Statistics 31
Each year between 2 and 3 percent of traffic offences involving alcohol resulted in acustodial sentence being imposed (Table 16). The average length of the custodialsentence varied between 3.8 months in 1990 and 2.6 months in 1997.
Table 16: Convicted cases for traffic offences involving alcohol, average length of custodial sentences(months), 1990–98
1990 1991 1992 1993 1994 1995 1996 1997 1998
Length of sentence (months) 3.8 2.8 3.2 3.2 3.2 2.9 2.9 2.6 2.8
Source: Ministry of Justice
Information from the biennial census of prison inmates1 shows that between 1 and3 percent of sentenced prison inmates were in prison for traffic offences involvingalcohol (Table 17).
Table 17: Number in prison for traffic offences involving alcohol, 1995, 1997 and 1999
Nov 1995 Nov 1997 Nov 1999
Number 37 92 136
Percentage of sentenced inmates 0.9 1.9 2.7
Source: Ministry of Justice / Department of Corrections
ALCOHOL-RELATED MORTALITY
Alcohol-related conditions
The conditions that are used to define alcohol-related conditions as the underlyingcause of death are alcoholic psychoses, alcohol dependence syndrome, nondependentalcohol use disorder, alcoholic cardiomyopathy, alcoholic gastritis, alcoholic liverdisease and poisoning by alcoholic beverages.
As presented in Figure 17, the male age-standardised mortality rate due to alcohol-related conditions has steadily declined from 6.6 per 100 000 population in 1990 to 4.8per 100 000 population in 1996. The female mortality rate due to alcohol-relatedconditions in 1990 (1.6 per 100 000 population) was less than one-quarter of the 1990male rate. The female rate dropped to a low during this period of 1.0 per 100 000population in 1992, before rising to 1.9 per 100 000 population in 1996.
Note that age-standardised rates presented from this point onwards are rates per100 000 population that are age-standardised to Segi’s world population.2
In terms of ethnicity, Mâori males and females had higher age-standardised mortalityrates due to alcohol-related conditions than non-Mâori males and females (Table 18).
1 Lash B. 1996. Census of Prison Inmates 1995. Wellington: Ministry of JusticeLash B. 1998. Census of Prison Inmates 1997. Wellington: Ministry of JusticeRich M. 2000. Census of Prison Inmates 1999. Wellington: Department of Corrections.
2 Waterhouse J, Muir C, Correa P, et al. 1982. Cancer Incidence in Five Continents IV. Scientific Publications no.42. Lyon: IARC.

32 New Zealand Drug Statistics
The Mâori male death rate of 14.2 per 100 000 population was over three times greaterthan the non-Mâori male rate of 4.1 per 100 000 population.
Mâori females had a mortality rate that was twice that of non-Mâori females (3.4 and1.7 per 100 000 population respectively).
It is important to note, however, that ethnic mortality rates for 1996 cannot becompared with earlier years because there were changes in the definition of ethnicity fordeath registrations in 1995. The rates presented here should therefore be taken asindicative only, owing to the relatively small numbers involved.
Table 18: Deaths due to alcohol-related conditions, numbers and rates by sex and ethnicity, 1996
Total Mâori Non-Mâori
No Rate No Rate No Rate
Male: 102 4.8 21 14.2 81 4.1
Female: 44 1.9 7 3.4 37 1.7
Total: 146 3.3 28 8.4 118 2.9
Source: New Zealand Health Information Service
Figure 17: Mortality rates for alcohol-related conditions, by sex, 1990–96Source: New Zealand Health Information Service
Male
Female
1990 1991 1992 1993 1994 1995 1996
Year
0
2
3
4
5
6
7
Rate per 100000population
1
Deaths due to external causes
The following information is sourced from the New Zealand Health Information Service,which maintains the New Zealand Mortality Registry. The records of all deaths registeredin 1990 to 1996 have been examined for instances where the underlying cause of deathwas an external cause and where the deceased was recorded as having alcohol in theirblood at the time of the injury or poisoning that led to their death. The recording ofpresence of alcohol is sourced from post-mortems, coroners’ findings, police reports andother relevant information sources.
New Zealand Drug Statistics 33
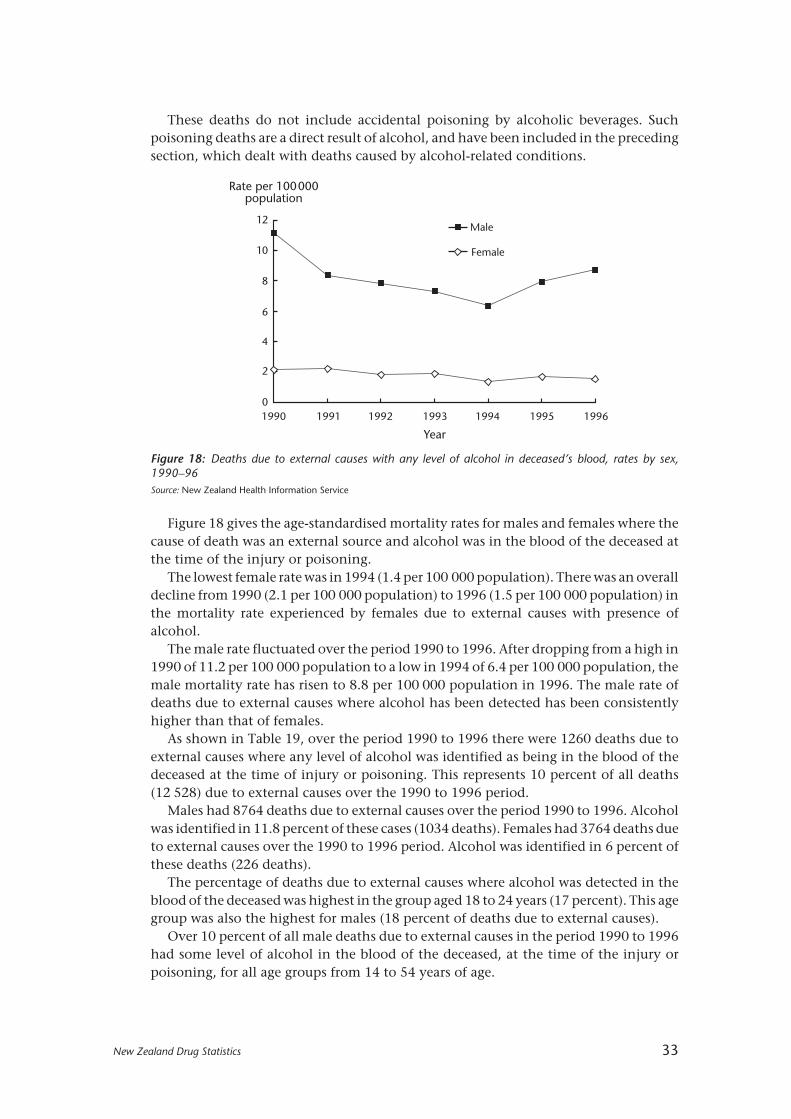
These deaths do not include accidental poisoning by alcoholic beverages. Suchpoisoning deaths are a direct result of alcohol, and have been included in the precedingsection, which dealt with deaths caused by alcohol-related conditions.
Figure 18: Deaths due to external causes with any level of alcohol in deceased’s blood, rates by sex,1990–96Source: New Zealand Health Information Service
Male
Female
1990 1991 1992 1993 1994 1995 1996
Year
0
2
4
6
8
10
12
Rate per 100000population
Figure 18 gives the age-standardised mortality rates for males and females where thecause of death was an external source and alcohol was in the blood of the deceased atthe time of the injury or poisoning.
The lowest female rate was in 1994 (1.4 per 100 000 population). There was an overalldecline from 1990 (2.1 per 100 000 population) to 1996 (1.5 per 100 000 population) inthe mortality rate experienced by females due to external causes with presence ofalcohol.
The male rate fluctuated over the period 1990 to 1996. After dropping from a high in1990 of 11.2 per 100 000 population to a low in 1994 of 6.4 per 100 000 population, themale mortality rate has risen to 8.8 per 100 000 population in 1996. The male rate ofdeaths due to external causes where alcohol has been detected has been consistentlyhigher than that of females.
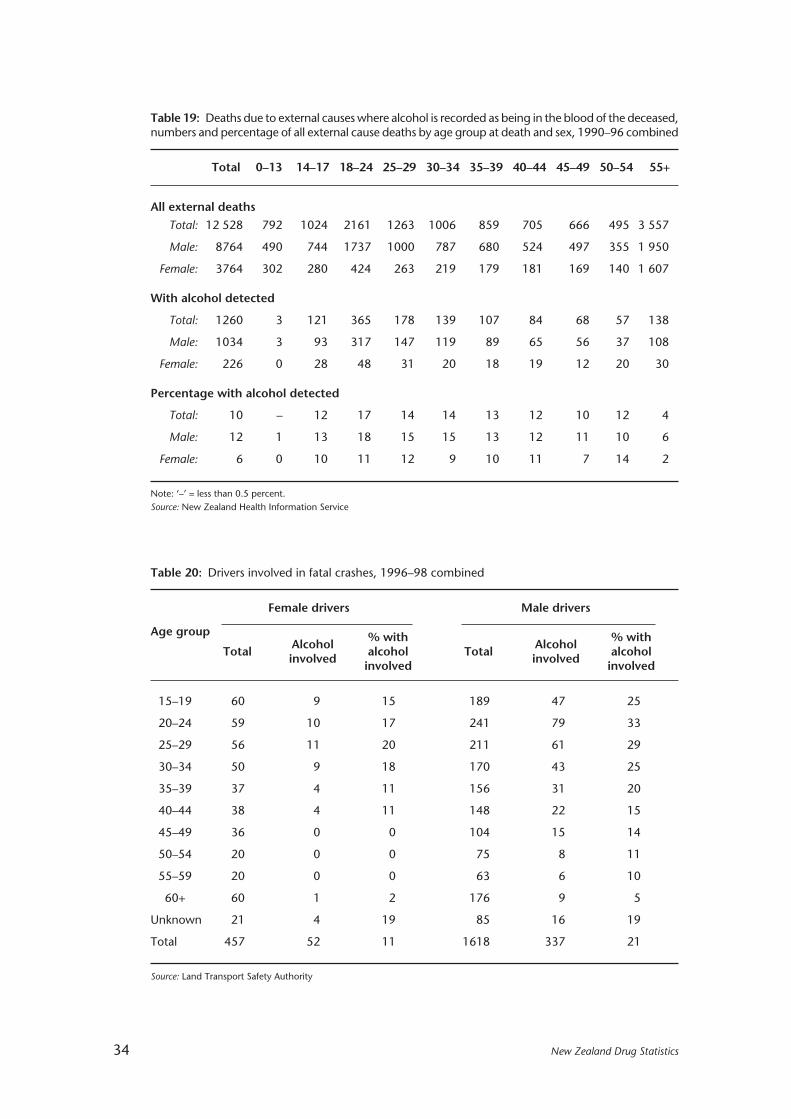
As shown in Table 19, over the period 1990 to 1996 there were 1260 deaths due toexternal causes where any level of alcohol was identified as being in the blood of thedeceased at the time of injury or poisoning. This represents 10 percent of all deaths(12 528) due to external causes over the 1990 to 1996 period.
Males had 8764 deaths due to external causes over the period 1990 to 1996. Alcoholwas identified in 11.8 percent of these cases (1034 deaths). Females had 3764 deaths dueto external causes over the 1990 to 1996 period. Alcohol was identified in 6 percent ofthese deaths (226 deaths).
The percentage of deaths due to external causes where alcohol was detected in theblood of the deceased was highest in the group aged 18 to 24 years (17 percent). This agegroup was also the highest for males (18 percent of deaths due to external causes).
Over 10 percent of all male deaths due to external causes in the period 1990 to 1996had some level of alcohol in the blood of the deceased, at the time of the injury orpoisoning, for all age groups from 14 to 54 years of age.
34 New Zealand Drug Statistics
Table 19: Deaths due to external causes where alcohol is recorded as being in the blood of the deceased,numbers and percentage of all external cause deaths by age group at death and sex, 1990–96 combined
Total 0–13 14–17 18–24 25–29 30–34 35–39 40–44 45–49 50–54 55+
All external deaths
Total: 12 528 792 1024 2161 1263 1006 859 705 666 495 3 557
Male: 8764 490 744 1737 1000 787 680 524 497 355 1 950
Female: 3764 302 280 424 263 219 179 181 169 140 1 607
With alcohol detected
Total: 1260 3 121 365 178 139 107 84 68 57 138
Male: 1034 3 93 317 147 119 89 65 56 37 108
Female: 226 0 28 48 31 20 18 19 12 20 30
Percentage with alcohol detected
Total: 10 – 12 17 14 14 13 12 10 12 4
Male: 12 1 13 18 15 15 13 12 11 10 6
Female: 6 0 10 11 12 9 10 11 7 14 2
Note: ‘–’ = less than 0.5 percent.Source: New Zealand Health Information Service
Table 20: Drivers involved in fatal crashes, 1996–98 combined
Female drivers Male drivers
Age groupAlcohol % with Alcohol % with
Total involved alcohol Total involved alcoholinvolved involved
15–19 60 9 15 189 47 25
20–24 59 10 17 241 79 33
25–29 56 11 20 211 61 29
30–34 50 9 18 170 43 25
35–39 37 4 11 156 31 20
40–44 38 4 11 148 22 15
45–49 36 0 0 104 15 14
50–54 20 0 0 75 8 11
55–59 20 0 0 63 6 10
60+ 60 1 2 176 9 5
Unknown 21 4 19 85 16 19
Total 457 52 11 1618 337 21
Source: Land Transport Safety Authority

New Zealand Drug Statistics 35
The female age group that had the highest percentage of external cause deaths in1990–96 with any level of alcohol in the blood was the 50-to-54-year-old age group(contributing 14 percent of all external cause deaths).
Alcohol and road crashes
Table 20 shows that there were 457 female drivers involved in fatal crashes over theperiod 1996 to 1998. Fifty-two (11 percent) of these drivers were affected by alcohol.There were more than three times as many male drivers involved in fatal car crashes(1618) as female drivers. Twenty-one percent of these drivers (337) were affected byalcohol.
Males aged 20 to 24 years were the group with the highest number of drivers involvedin fatal car crashes (241) and the highest number of alcohol-affected drivers involved infatal car crashes (79). One-third of all drivers involved in fatal car crashes in this agegroup were affected by alcohol. This is the highest proportion out of all the age groups,irrespective of sex.
Table 21: Crashes and casualties from crashes where driver alcohol was a contributing factor, numbersand percentages of total fatal or injury crashes, 1980–99
Crashes Casualties
Year Fatal crashes Injury crashes Deaths Injuries
No % No % No % No %
1980 192 36 1954 19 217 36 3681 23
1981 199 34 2005 20 241 36 3687 24
1982 232 39 2049 19 267 40 3841 24
1983 205 36 2140 20 241 37 3818 23
1984 222 36 2248 19 249 37 3874 22
1985 238 36 2493 19 274 37 4418 23
1986 266 41 2575 20 328 43 4520 24
1987 271 39 2595 21 329 41 4498 24
1988 266 43 2500 21 318 44 4246 25
1989 264 41 2364 21 321 42 3969 24
1990 268 42 2716 22 318 44 4531 26
1991 225 41 2424 21 269 41 3935 24
1992 221 41 2282 21 273 42 3672 23
1993 185 36 1906 18 227 38 3042 20
1994 190 38 2044 18 225 39 3300 20
1995 162 32 2118 18 200 34 3421 20
1996 129 28 1652 16 148 29 2664 18
1997 127 27 1389 16 147 27 2317 17
1998 118 27 1347 16 142 28 2233 18
1999 100 23 1146 14 122 24 1904 16
Source: Land Transport Safety Authority

36 New Zealand Drug Statistics
The highest proportion of female drivers involved in fatal car crashes who wereaffected by alcohol was the group aged 25 to 29 years (20 percent). This was also the agegroup with the highest number of drivers affected by alcohol of all the female age groups(11 drivers), although the age group with the highest number of drivers involved in fatalcar crashes was the 15-to-19-year-old age group (60 drivers).
Table 21 contains information on the number of fatal and injury road crashes wheredriver alcohol was a contributing factor during the 1980s and 1990s.
The number of fatal crashes where driver alcohol was a contributing factor fell by48 percent between 1980 (192 fatal motor vehicle accidents [MVAs]) and 1999 (100 fatalMVAs). The number of fatal MVAs where driver alcohol was a contributing factor peakedin 1987 (271 fatal MVAs). Between 1987 and 1999 there was a drop of 63 percent in fatalMVAs contributed to by driver alcohol. There was also a drop in the proportion of fatalMVAs where driver alcohol was a contributing factor, from 36 percent of all fatal MVAsin 1980 to 23 percent in 1999.
The number of actual deaths as a result of MVAs where driver alcohol was acontributing factor fell by 43 percent between 1980 and 1999. The number of deathsresulting from driver alcohol MVAs peaked in 1987 at 329, with a resultant fall of 63percent to 1999. However, the ratio of deaths to fatal MVAs rose between 1980 (1.1deaths per driver-alcohol MVA) and 1999 (1.2 deaths per driver-alcohol MVA).
The number of MVAs resulting in injury where driver alcohol was a contributingfactor fell 41 percent between 1980 and 1999 (1954 and 1146 injury MVAs respectively).The number of injury MVAs where driver alcohol was a contributing factor peaked in1990 (2716 injury MVAs) and there has since been a drop of 58 percent to 1999.
The actual number of injuries resulting from motor vehicle accidents where driveralcohol was a contributory factor has fallen from 3681 in 1980 to 1904 in 1999, a declineof 48 percent. The number of injuries resulting from driver alcohol MVAs peaked in 1990at 4531. There has been a drop in injuries since 1990 of 58 percent. The ratio of injuriessuffered to injury MVAs has also fallen from 1.9 injuries per driver-alcohol MVA in 1980to 1.6 injuries per driver-alcohol MVA in 1999.
Alcohol and drowning
The Injury Prevention Research Centre of the University of Auckland has carried out aretrospective study of the role of alcohol in drownings in the Auckland region between1988 and 1997.1
The study found that, of those aged 15 to 64 years who drowned and had had theirblood alcohol level tested, 40 percent had a positive blood alcohol level, and 31 percenthad a blood alcohol level over 80 mg/100 mL (the legal limit for adults operating a motorvehicle).
An examination of boating-related drownings yielded similar findings. Of those aged 15to 64 years for whom blood alcohol could be reliably measured, 40 percent had positiveblood alcohol levels, and 24 percent had concentrations that were over 100 mg/100 mL.
Based on these findings, although the raw numbers involved in drownings are fewerin relative terms, the role of alcohol in water-related fatalities appears to be at least asimportant as the role that alcohol plays in deaths on the roads.
Water Safety New Zealand maintains a database of all drownings in New Zealand.
1 Smith G S, et al. 1999. The Role of Alcohol in Drowning and Boating Deaths in the Auckland Region: An Updated Report to the Alcohol AdvisoryCouncil. Injury Prevention Research Centre Report Series, No 44. Auckland: Injury Prevention Research Centre.
New Zealand Drug Statistics 37
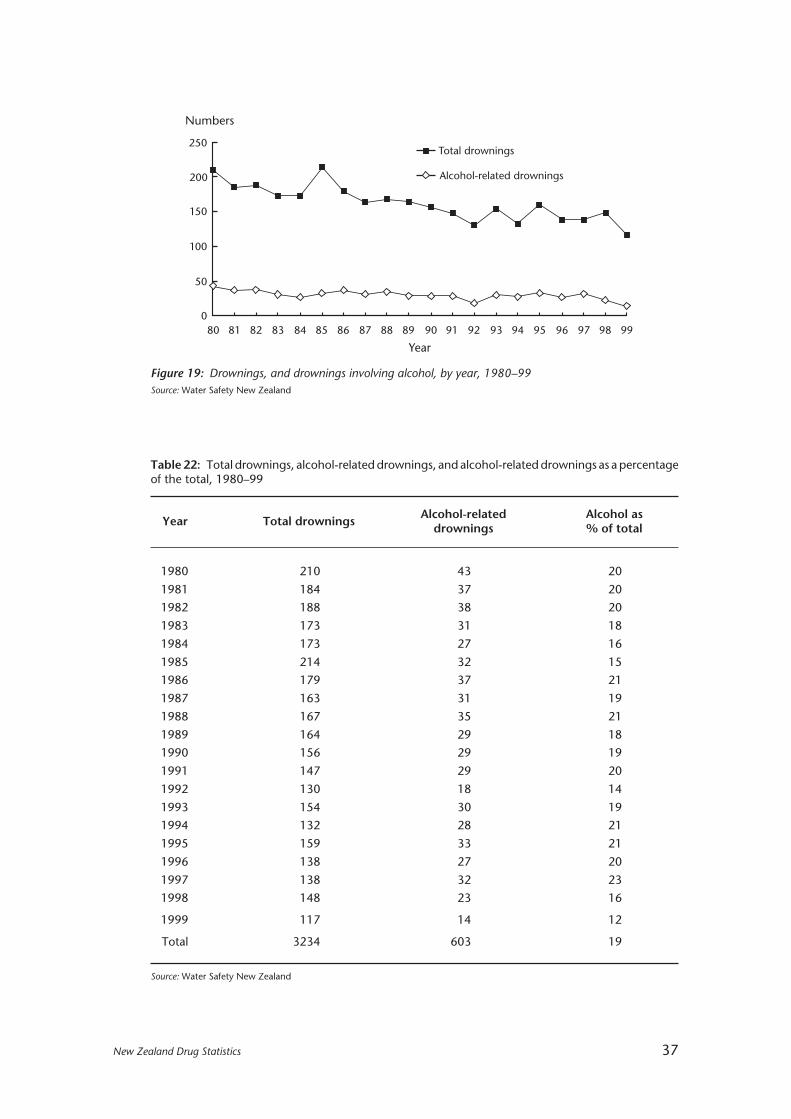
Table 22: Total drownings, alcohol-related drownings, and alcohol-related drownings as a percentageof the total, 1980–99
Year Total drownings Alcohol-related Alcohol asdrownings % of total
1980 210 43 20
1981 184 37 20
1982 188 38 20
1983 173 31 18
1984 173 27 16
1985 214 32 15
1986 179 37 21
1987 163 31 19
1988 167 35 21
1989 164 29 18
1990 156 29 19
1991 147 29 20
1992 130 18 14
1993 154 30 19
1994 132 28 21
1995 159 33 21
1996 138 27 20
1997 138 32 23
1998 148 23 16
1999 117 14 12
Total 3234 603 19
Source: Water Safety New Zealand
Figure 19: Drownings, and drownings involving alcohol, by year, 1980–99Source: Water Safety New Zealand
80 81 82 83 84 85 86 87 88 89 90 91 92 93 94 95 96 97 98 99
Total drownings
Alcohol-related drownings
250
200
150
100
50
0
Numbers
Year
38 New Zealand Drug Statistics
This database was established in 1993, and all records before 1993 were enteredretrospectively, using data from coroners’ reports. Information is gathered from newspaperclippings and police notification reports that are then confirmed by coroners’ reports.The statistics for alcohol-related drownings include only cases where alcohol was aknown factor. Note that approximately 68 percent of all drownings are not tested forblood alcohol concentration. In these cases, a zero figure for blood alcohol is entered.
The total numbers of drownings have reduced over the past 20 years, and the sametrend is evident for alcohol-related drownings (Figure 19 and Table 22). Between 1980and 1999, alcohol was known to be involved in 603 drowning deaths in New Zealand.This represents 19 percent of the total number of drownings for that period.
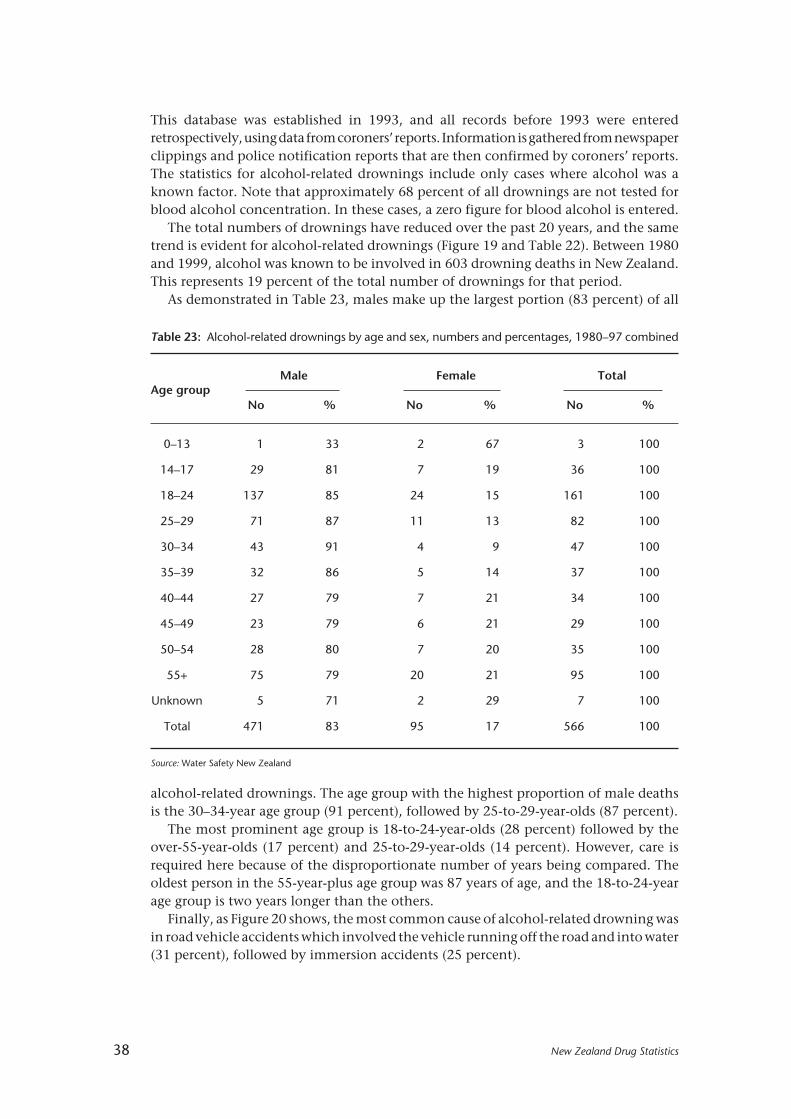
As demonstrated in Table 23, males make up the largest portion (83 percent) of all
Table 23: Alcohol-related drownings by age and sex, numbers and percentages, 1980–97 combined
Male Female TotalAge group
No % No % No %
0–13 1 33 2 67 3 100
14–17 29 81 7 19 36 100
18–24 137 85 24 15 161 100
25–29 71 87 11 13 82 100
30–34 43 91 4 9 47 100
35–39 32 86 5 14 37 100
40–44 27 79 7 21 34 100
45–49 23 79 6 21 29 100
50–54 28 80 7 20 35 100
55+ 75 79 20 21 95 100
Unknown 5 71 2 29 7 100
Total 471 83 95 17 566 100
Source: Water Safety New Zealand
alcohol-related drownings. The age group with the highest proportion of male deathsis the 30–34-year age group (91 percent), followed by 25-to-29-year-olds (87 percent).
The most prominent age group is 18-to-24-year-olds (28 percent) followed by theover-55-year-olds (17 percent) and 25-to-29-year-olds (14 percent). However, care isrequired here because of the disproportionate number of years being compared. Theoldest person in the 55-year-plus age group was 87 years of age, and the 18-to-24-yearage group is two years longer than the others.
Finally, as Figure 20 shows, the most common cause of alcohol-related drowning wasin road vehicle accidents which involved the vehicle running off the road and into water(31 percent), followed by immersion accidents (25 percent).
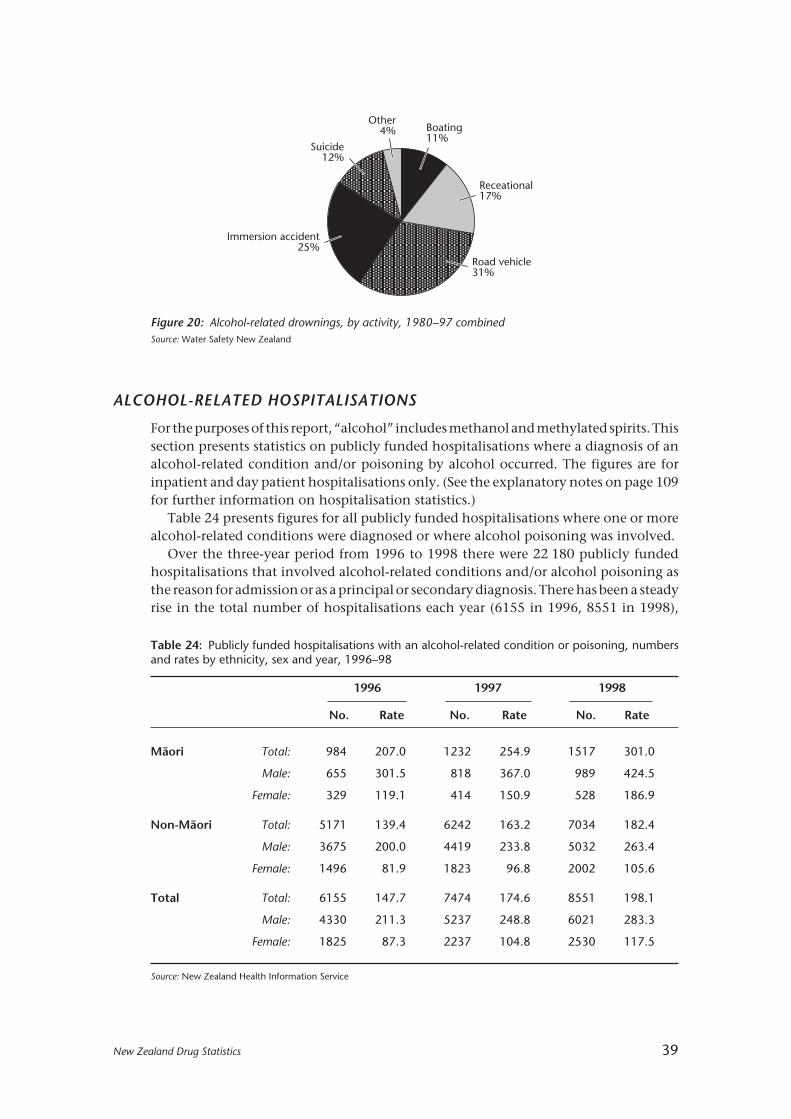
New Zealand Drug Statistics 39
ALCOHOL-RELATED HOSPITALISATIONS
For the purposes of this report, “alcohol” includes methanol and methylated spirits. Thissection presents statistics on publicly funded hospitalisations where a diagnosis of analcohol-related condition and/or poisoning by alcohol occurred. The figures are forinpatient and day patient hospitalisations only. (See the explanatory notes on page 109for further information on hospitalisation statistics.)
Table 24 presents figures for all publicly funded hospitalisations where one or morealcohol-related conditions were diagnosed or where alcohol poisoning was involved.
Over the three-year period from 1996 to 1998 there were 22 180 publicly fundedhospitalisations that involved alcohol-related conditions and/or alcohol poisoning asthe reason for admission or as a principal or secondary diagnosis. There has been a steadyrise in the total number of hospitalisations each year (6155 in 1996, 8551 in 1998),
Table 24: Publicly funded hospitalisations with an alcohol-related condition or poisoning, numbersand rates by ethnicity, sex and year, 1996–98
1996 1997 1998
No. Rate No. Rate No. Rate
Mâori Total: 984 207.0 1232 254.9 1517 301.0
Male: 655 301.5 818 367.0 989 424.5
Female: 329 119.1 414 150.9 528 186.9
Non-Mâori Total: 5171 139.4 6242 163.2 7034 182.4
Male: 3675 200.0 4419 233.8 5032 263.4
Female: 1496 81.9 1823 96.8 2002 105.6
Total Total: 6155 147.7 7474 174.6 8551 198.1
Male: 4330 211.3 5237 248.8 6021 283.3
Female: 1825 87.3 2237 104.8 2530 117.5
Source: New Zealand Health Information Service
Figure 20: Alcohol-related drownings, by activity, 1980–97 combinedSource: Water Safety New Zealand
Boating11%
Receational17%
Road vehicle31%
Immersion accident25%
Suicide12%
Other4%
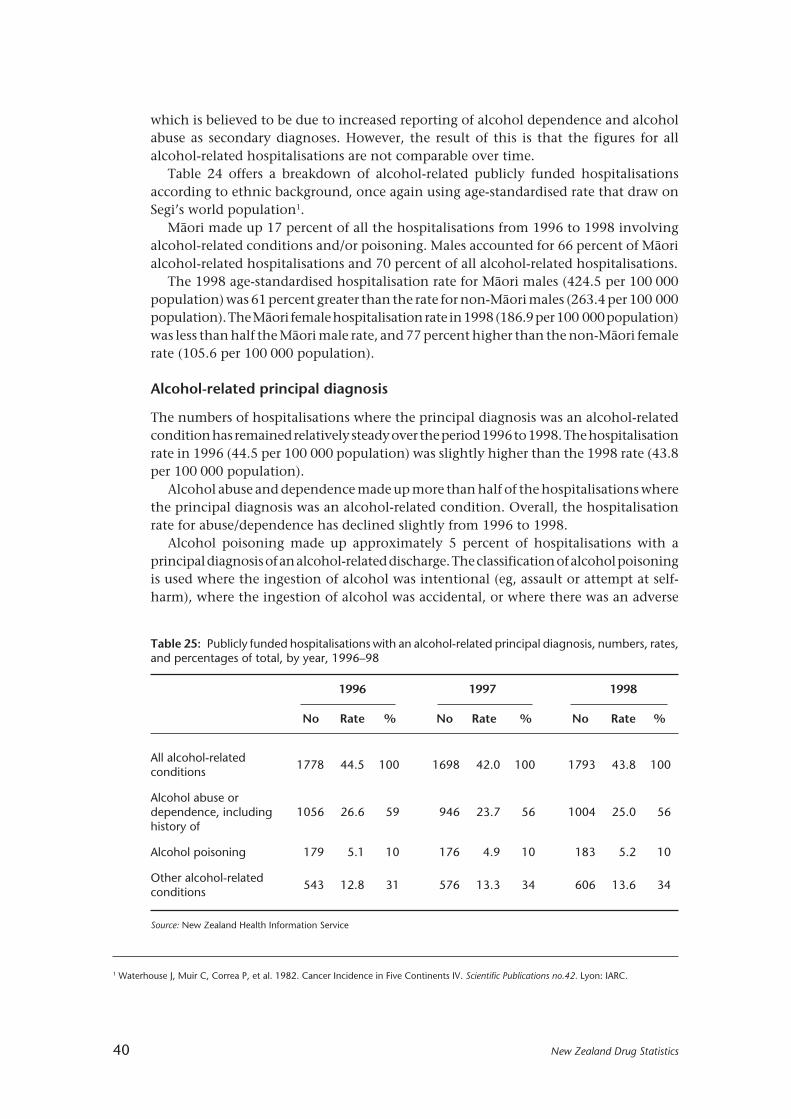
40 New Zealand Drug Statistics
which is believed to be due to increased reporting of alcohol dependence and alcoholabuse as secondary diagnoses. However, the result of this is that the figures for allalcohol-related hospitalisations are not comparable over time.
Table 24 offers a breakdown of alcohol-related publicly funded hospitalisationsaccording to ethnic background, once again using age-standardised rate that draw onSegi’s world population1.
Mâori made up 17 percent of all the hospitalisations from 1996 to 1998 involvingalcohol-related conditions and/or poisoning. Males accounted for 66 percent of Mâorialcohol-related hospitalisations and 70 percent of all alcohol-related hospitalisations.
The 1998 age-standardised hospitalisation rate for Mâori males (424.5 per 100 000population) was 61 percent greater than the rate for non-Mâori males (263.4 per 100 000population). The Mâori female hospitalisation rate in 1998 (186.9 per 100 000 population)was less than half the Mâori male rate, and 77 percent higher than the non-Mâori femalerate (105.6 per 100 000 population).
Alcohol-related principal diagnosis
The numbers of hospitalisations where the principal diagnosis was an alcohol-relatedcondition has remained relatively steady over the period 1996 to 1998. The hospitalisationrate in 1996 (44.5 per 100 000 population) was slightly higher than the 1998 rate (43.8per 100 000 population).
Alcohol abuse and dependence made up more than half of the hospitalisations wherethe principal diagnosis was an alcohol-related condition. Overall, the hospitalisationrate for abuse/dependence has declined slightly from 1996 to 1998.
Alcohol poisoning made up approximately 5 percent of hospitalisations with aprincipal diagnosis of an alcohol-related discharge. The classification of alcohol poisoningis used where the ingestion of alcohol was intentional (eg, assault or attempt at self-harm), where the ingestion of alcohol was accidental, or where there was an adverse
Table 25: Publicly funded hospitalisations with an alcohol-related principal diagnosis, numbers, rates,and percentages of total, by year, 1996–98
1996 1997 1998
No Rate % No Rate % No Rate %
All alcohol-relatedconditions
1778 44.5 100 1698 42.0 100 1793 43.8 100
Alcohol abuse ordependence, including 1056 26.6 59 946 23.7 56 1004 25.0 56history of
Alcohol poisoning 179 5.1 10 176 4.9 10 183 5.2 10
Other alcohol-relatedconditions
543 12.8 31 576 13.3 34 606 13.6 34
Source: New Zealand Health Information Service
1 Waterhouse J, Muir C, Correa P, et al. 1982. Cancer Incidence in Five Continents IV. Scientific Publications no.42. Lyon: IARC.

New Zealand Drug Statistics 41
Table 26: Publicly funded hospitalisations involving alcohol poisoning, by circumstance of poisoning,numbers and rates, 1996–98
1996 1997 1998
No Rate No Rate No Rate
All external causes involvingalcohol poisoning*
387 10.8 427 11.4 404 10.6
Accidental poisoning by alcohol(alcoholic beverages, other ethyl 203 6.0 219 6.0 216 6.0alcohol, methyl alcohol)
Alcohol causing adverse effectsin therapeutic use
2 – 4 – 2 –
Suicide and self-inflicted poisoningby alcohol
168 4.5 202 5.1 184 4.6
Poisoning by alcohol, undeterminedwhether accidentally or purposefully 19 – 12 – 5 –inflicted
Note: ‘–’ = rates less than 1 per 100 000 population.
* May not equal sum of totals by cause as more than one external cause code can be recorded per event.
Source: New Zealand Health Information Service
effect from recreational use of alcohol. Instances of overdosing after particularly heavydrinking episodes are classified as alcohol abuse or dependence.
“Other conditions” includes alcohol-related conditions such as alcoholic psychoses,alcoholic liver disease, alcohol-induced pancreatitis, and alcoholic gastritis. There hasbeen a rise in the hospitalisation rate for conditions such as these, and they have alsoincreased as a proportion of hospitalisations with alcohol-related principal diagnoses.
Alcohol poisoning
Hospitals are not always able to provide clear or full descriptions of the circumstancesof injury or poisoning, and alcohol involvement may not always be mentioned. Thefigures given here should be regarded as conservative counts and be treated as indicativeonly.
Table 26 shows the number of hospitalisations in 1996, 1997 and 1998 where anexternal cause of injury code specified that poisoning by alcohol was involved. Thesecodes are not clinical diagnoses, but they describe the circumstances of the poisoning.
The most common circumstance was accidental poisoning by alcohol. The age-standardised hospitalisation rate of 6.0 per 100 000 population remained unchangedover the period 1996 to 1998. The second most common circumstance of alcoholpoisoning was suicide and self-inflicted injury. Another drug or substance was alsoinvolved in most of these cases.

42 New Zealand Drug Statistics
Tobacco
KEY FACTS
Use
• There was a 20 percent decrease in cigarette equivalents released for consumptionbetween 1989 and 1999. Over this time loose tobacco increased as a proportion oftotal cigarette equivalents released for consumption, from 11 percent in 1989 to19 percent in 1999.
• Between September 1989 and May 2000, the price of a packet of 20 cigarettes increasedfrom $4.10 to $8.50.
• There was a 30 percent decrease in cigarette equivalents released per adult (aged 15years and over) between 1989 and 1999.
• Approximately one in four adults (26 percent) were cigarette smokers according to the1999 A C Nielsen survey undertaken for the Ministry of Health. Smoking by males(26 percent) and females (25 percent) was relatively similar, although smoking bywomen aged 15 to 24 is higher than for males of the same age.
• An Action on Smoking and Health (ASH) national survey of fourth form schoolstudents has reported regular (daily or weekly) smoking prevalence figures for 1992,1997, 1998 and 1999 at 18, 25, 24, and 23 percent respectively for girls, and 16, 18,19 and 19 percent respectively for boys.1
Mortality
• In 1990, 4500 deaths in New Zealand were attributed to tobacco smoking, accountingfor 18 percent of all deaths. In 1996, approximately 4700 deaths were attributed totobacco smoking, accounting for 17 percent of all deaths.
• There are about 388 deaths attributable to second-hand smoke (“passive smoking”)in New Zealand each year according to a report prepared for the Ministry of Healthin September 2000.2 This represents an additional 8 percent over and above deathsdue to direct smoking. The estimated figure of 388 deaths per year attributable tosecond-hand smoke represents about three-quarters of the number of people killedeach year on the roads in New Zealand in recent years.
Attitudes
• A number of studies have been undertaken in New Zealand, by the National ResearchBureau among others, into people’s beliefs about the health effects of second-handsmoke, and their attitudes towards second-hand smoke. These studies show agenerally high acceptance of the need for controls on smoking in public places andworkplaces and that a large percentage of the public find exposure to second-handsmoke to be bothersome.
1 Scragg R, Laugesen M. Cigarette smoking by 4th form students (1992, 1997–99). In press.2 Woodward A, Laugeson M. 2000. Deaths in New Zealand Attributable to Second Hand Smoke. Unpublished report to New Zealand Ministry
of Health.
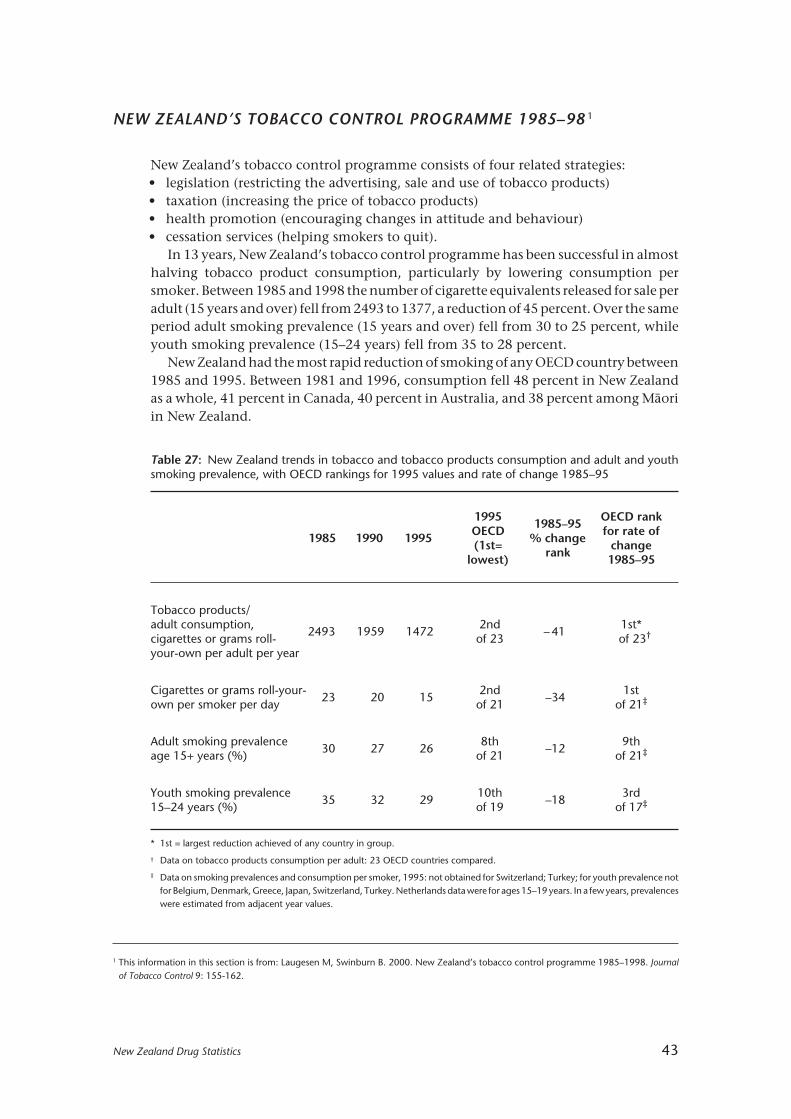
New Zealand Drug Statistics 43
NEW ZEALAND’S TOBACCO CONTROL PROGRAMME 1985–98 1
New Zealand’s tobacco control programme consists of four related strategies:• legislation (restricting the advertising, sale and use of tobacco products)• taxation (increasing the price of tobacco products)• health promotion (encouraging changes in attitude and behaviour)• cessation services (helping smokers to quit).
In 13 years, New Zealand’s tobacco control programme has been successful in almosthalving tobacco product consumption, particularly by lowering consumption persmoker. Between 1985 and 1998 the number of cigarette equivalents released for sale peradult (15 years and over) fell from 2493 to 1377, a reduction of 45 percent. Over the sameperiod adult smoking prevalence (15 years and over) fell from 30 to 25 percent, whileyouth smoking prevalence (15–24 years) fell from 35 to 28 percent.
New Zealand had the most rapid reduction of smoking of any OECD country between1985 and 1995. Between 1981 and 1996, consumption fell 48 percent in New Zealandas a whole, 41 percent in Canada, 40 percent in Australia, and 38 percent among Mâoriin New Zealand.
1 This information in this section is from: Laugesen M, Swinburn B. 2000. New Zealand’s tobacco control programme 1985–1998. Journalof Tobacco Control 9: 155-162.
Table 27: New Zealand trends in tobacco and tobacco products consumption and adult and youthsmoking prevalence, with OECD rankings for 1995 values and rate of change 1985–95
1995 1985–95 OECD rank
1985 1990 1995 OECD % change for rate of(1st= rank change
lowest) 1985–95
Tobacco products/adult consumption,
2493 1959 14722nd
– 411st*
cigarettes or grams roll- of 23 of 23†
your-own per adult per year
Cigarettes or grams roll-your- 2nd 1stown per smoker per day
23 20 15of 21
–34of 21‡
Adult smoking prevalence 8th 9thage 15+ years (%)
30 27 26of 21
–12of 21‡
Youth smoking prevalence 10th 3rd15–24 years (%)
35 32 29of 19
–18of 17‡
* 1st = largest reduction achieved of any country in group.
† Data on tobacco products consumption per adult: 23 OECD countries compared.
‡ Data on smoking prevalences and consumption per smoker, 1995: not obtained for Switzerland; Turkey; for youth prevalence notfor Belgium, Denmark, Greece, Japan, Switzerland, Turkey. Netherlands data were for ages 15–19 years. In a few years, prevalenceswere estimated from adjacent year values.
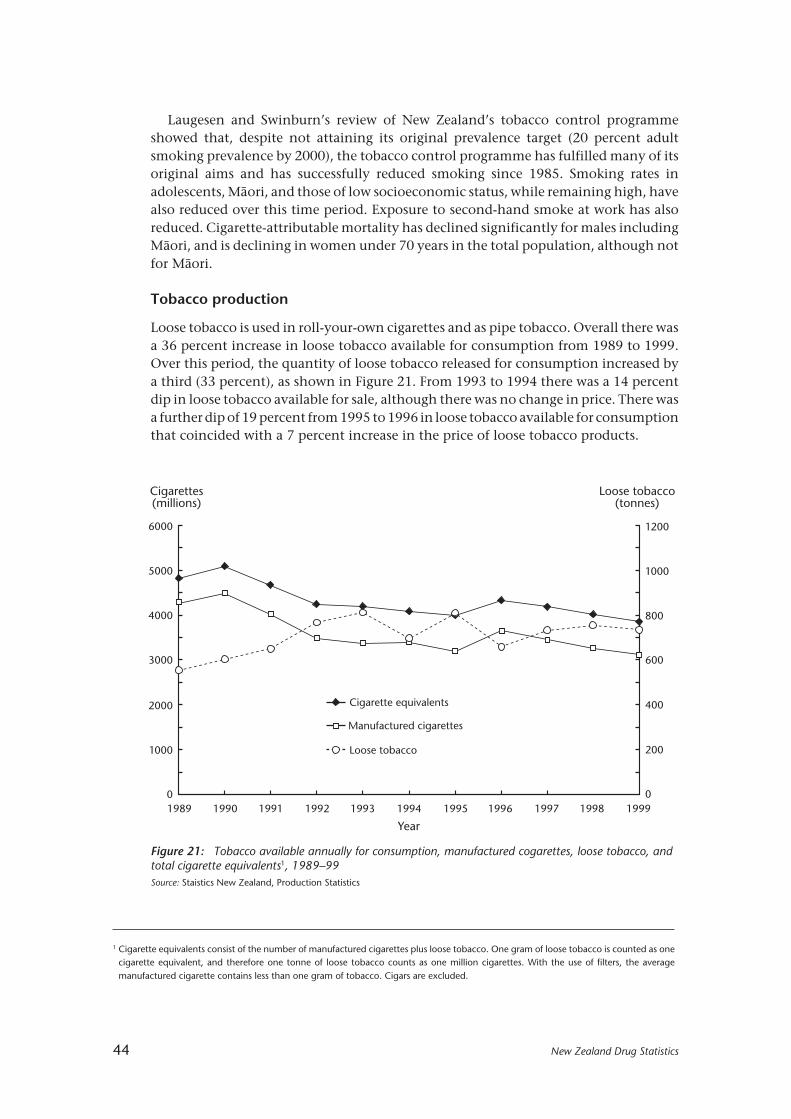
44 New Zealand Drug Statistics
Laugesen and Swinburn’s review of New Zealand’s tobacco control programmeshowed that, despite not attaining its original prevalence target (20 percent adultsmoking prevalence by 2000), the tobacco control programme has fulfilled many of itsoriginal aims and has successfully reduced smoking since 1985. Smoking rates inadolescents, Mâori, and those of low socioeconomic status, while remaining high, havealso reduced over this time period. Exposure to second-hand smoke at work has alsoreduced. Cigarette-attributable mortality has declined significantly for males includingMâori, and is declining in women under 70 years in the total population, although notfor Mâori.
Tobacco production
Loose tobacco is used in roll-your-own cigarettes and as pipe tobacco. Overall there wasa 36 percent increase in loose tobacco available for consumption from 1989 to 1999.Over this period, the quantity of loose tobacco released for consumption increased bya third (33 percent), as shown in Figure 21. From 1993 to 1994 there was a 14 percentdip in loose tobacco available for sale, although there was no change in price. There wasa further dip of 19 percent from 1995 to 1996 in loose tobacco available for consumptionthat coincided with a 7 percent increase in the price of loose tobacco products.
6000
5000
4000
3000
2000
1000
0
200
400
600
800
1000
1200
0
Cigarettes(millions)
Loose tobacco(tonnes)
1989 1990 1991 1992 1993 1994 1995 1996 1997 1998
Year
Manufactured cigarettes
Cigarette equivalents
Loose tobacco
1999
Figure 21: Tobacco available annually for consumption, manufactured cogarettes, loose tobacco, andtotal cigarette equivalents1, 1989–99Source: Staistics New Zealand, Production Statistics
1 Cigarette equivalents consist of the number of manufactured cigarettes plus loose tobacco. One gram of loose tobacco is counted as onecigarette equivalent, and therefore one tonne of loose tobacco counts as one million cigarettes. With the use of filters, the averagemanufactured cigarette contains less than one gram of tobacco. Cigars are excluded.

New Zealand Drug Statistics 45
Table 28: Tobacco products released for consumption in New Zealand, 1970–99
Tobacco products releasedNumber of cigarette equivalents†
released per adult aged 15+ years
Loose ManufacturedLoose Manufactured
Year tobacco cigarettes Total(tonnes*) (millions)
tobacco cigarettes
1970 1024 4952 534 2581 3114
1971 965 5118 493 2615 3108
1972 934 5405 468 2705 3173
1973 853 5526 416 2697 3113
1974 782 5769 371 2740 3112
1975 749 6229 347 2885 3232
1976 702 6230 319 2835 3154
1977 666 6346 300 2857 3157
1978 610 6268 272 2794 3066
1979 575 6130 255 2715 2970
1980 548 5991 239 2617 2856
1981 553 6168 239 2666 2905
1982 539 6112 230 2603 2832
1983 546 6089 228 2541 2769
1984 534 6236 219 2560 2779
1985 493 5654 200 2293 2493
1986 501 5223 202 2102 2304
1987 511 5361 203 2125 2327
1988 552 5355 217 2101 2317
1989 554 4270 216 1662 1877
1990 602 4489 233 1738 1971
1991 652 4014 243 1495 1738
1992 768 3466 283 1277 1560
1993 810 3381 295 1232 1527
1994 694 3396 249 1221 1470
1995 808 3338 287 1187 1474
1996 658 3660 230 1280 1511
1997 733 3449 253 1191 1444
1998 757 3263 259 1118 1377
1999 736 3119 251 1062 1312
* One tonne is 1000 kg (one million grams)† One cigarette equivalent equals one manufactured cigarette or one gram of loose tobacco
Source: Statistics New Zealand
Notes:
1. Cigarette equivalents per adult for 1991–99 are calculated using resident population estimates and projectionsobtained from Statistics New Zealand in 2000. These estimates and projections include New Zealand residentstemporarily overseas and are adjusted for census undercount. Projections are based on assumptions of mediumfertility, mortality and migration.
2. Calculations of cigarette equivalents are based on excise data on manufactured cigarettes and loose tobaccoreleased for sale. Loose tobacco is mainly cigarette tobacco but includes a small amount of pipe tobacco. Cigarsare not included.
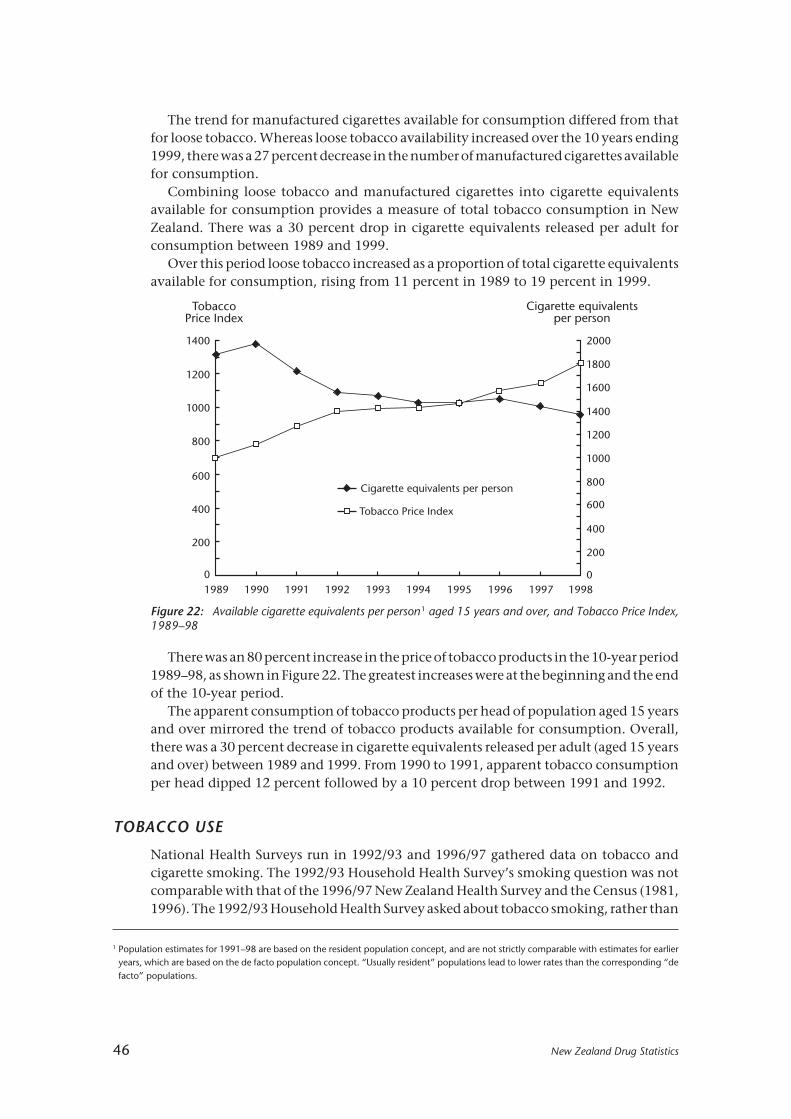
46 New Zealand Drug Statistics
The trend for manufactured cigarettes available for consumption differed from thatfor loose tobacco. Whereas loose tobacco availability increased over the 10 years ending1999, there was a 27 percent decrease in the number of manufactured cigarettes availablefor consumption.
Combining loose tobacco and manufactured cigarettes into cigarette equivalentsavailable for consumption provides a measure of total tobacco consumption in NewZealand. There was a 30 percent drop in cigarette equivalents released per adult forconsumption between 1989 and 1999.
Over this period loose tobacco increased as a proportion of total cigarette equivalentsavailable for consumption, rising from 11 percent in 1989 to 19 percent in 1999.
Figure 22: Available cigarette equivalents per person1 aged 15 years and over, and Tobacco Price Index,1989–98
1400
0
200
400
600
800
1000
1200
2000
0
200
400
600
800
1000
1200
1400
1600
1800
TobaccoPrice Index
Cigarette equivalentsper person
Tobacco Price Index
Cigarette equivalents per person
1989 1990 1991 1992 1993 1994 1995 1996 1997 1998
1 Population estimates for 1991–98 are based on the resident population concept, and are not strictly comparable with estimates for earlieryears, which are based on the de facto population concept. “Usually resident” populations lead to lower rates than the corresponding “defacto” populations.
There was an 80 percent increase in the price of tobacco products in the 10-year period1989–98, as shown in Figure 22. The greatest increases were at the beginning and the endof the 10-year period.
The apparent consumption of tobacco products per head of population aged 15 yearsand over mirrored the trend of tobacco products available for consumption. Overall,there was a 30 percent decrease in cigarette equivalents released per adult (aged 15 yearsand over) between 1989 and 1999. From 1990 to 1991, apparent tobacco consumptionper head dipped 12 percent followed by a 10 percent drop between 1991 and 1992.
TOBACCO USE
National Health Surveys run in 1992/93 and 1996/97 gathered data on tobacco andcigarette smoking. The 1992/93 Household Health Survey’s smoking question was notcomparable with that of the 1996/97 New Zealand Health Survey and the Census (1981,1996). The 1992/93 Household Health Survey asked about tobacco smoking, rather than
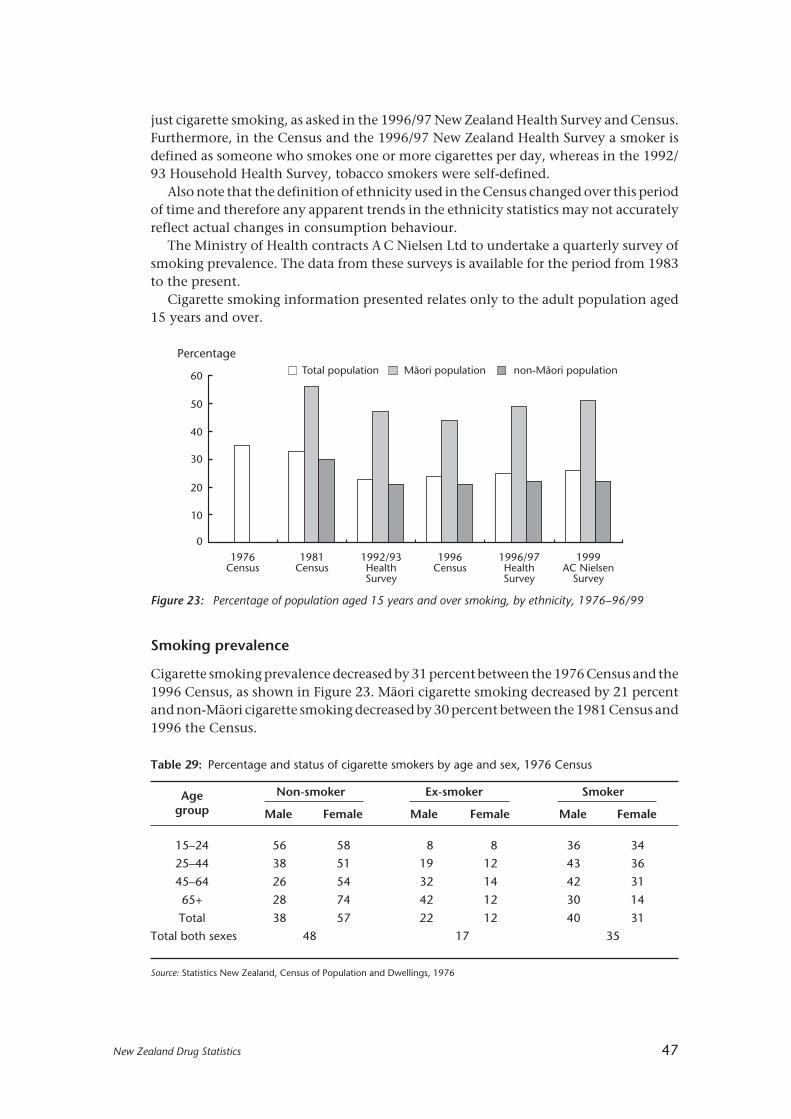
New Zealand Drug Statistics 47
just cigarette smoking, as asked in the 1996/97 New Zealand Health Survey and Census.Furthermore, in the Census and the 1996/97 New Zealand Health Survey a smoker isdefined as someone who smokes one or more cigarettes per day, whereas in the 1992/93 Household Health Survey, tobacco smokers were self-defined.
Also note that the definition of ethnicity used in the Census changed over this periodof time and therefore any apparent trends in the ethnicity statistics may not accuratelyreflect actual changes in consumption behaviour.
The Ministry of Health contracts A C Nielsen Ltd to undertake a quarterly survey ofsmoking prevalence. The data from these surveys is available for the period from 1983to the present.
Cigarette smoking information presented relates only to the adult population aged15 years and over.
60
50
40
30
20
10
0
Percentage
1976Census
1981Census
1992/93HealthSurvey
Total population non-Mâori populationMâori population
1996Census
1996/97HealthSurvey
1999AC Nielsen
Survey
Figure 23: Percentage of population aged 15 years and over smoking, by ethnicity, 1976–96/99
Smoking prevalence
Cigarette smoking prevalence decreased by 31 percent between the 1976 Census and the1996 Census, as shown in Figure 23. Mâori cigarette smoking decreased by 21 percentand non-Mâori cigarette smoking decreased by 30 percent between the 1981 Census and1996 the Census.
Table 29: Percentage and status of cigarette smokers by age and sex, 1976 Census
Age Non-smoker Ex-smoker Smoker
group Male Female Male Female Male Female
15–24 56 58 8 8 36 34
25–44 38 51 19 12 43 36
45–64 26 54 32 14 42 31
65+ 28 74 42 12 30 14
Total 38 57 22 12 40 31
Total both sexes 48 17 35
Source: Statistics New Zealand, Census of Population and Dwellings, 1976
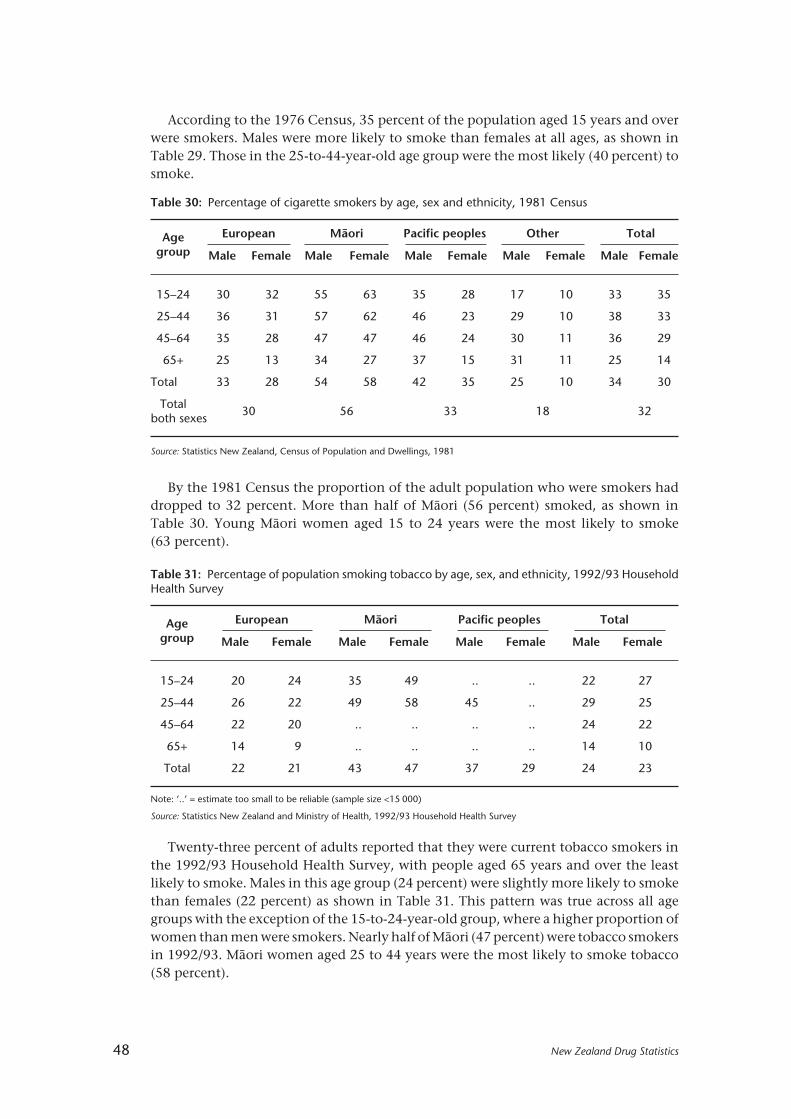
48 New Zealand Drug Statistics
According to the 1976 Census, 35 percent of the population aged 15 years and overwere smokers. Males were more likely to smoke than females at all ages, as shown inTable 29. Those in the 25-to-44-year-old age group were the most likely (40 percent) tosmoke.
Table 30: Percentage of cigarette smokers by age, sex and ethnicity, 1981 Census
Age European Mâori Pacific peoples Other Total
group Male Female Male Female Male Female Male Female Male Female
15–24 30 32 55 63 35 28 17 10 33 35
25–44 36 31 57 62 46 23 29 10 38 33
45–64 35 28 47 47 46 24 30 11 36 29
65+ 25 13 34 27 37 15 31 11 25 14
Total 33 28 54 58 42 35 25 10 34 30
Total30 56 33 18 32
both sexes
Source: Statistics New Zealand, Census of Population and Dwellings, 1981
Table 31: Percentage of population smoking tobacco by age, sex, and ethnicity, 1992/93 HouseholdHealth Survey
Age European Mâori Pacific peoples Total
group Male Female Male Female Male Female Male Female
15–24 20 24 35 49 .. .. 22 27
25–44 26 22 49 58 45 .. 29 25
45–64 22 20 .. .. .. .. 24 22
65+ 14 9 .. .. .. .. 14 10
Total 22 21 43 47 37 29 24 23
Note: ‘..’ = estimate too small to be reliable (sample size <15 000)
Source: Statistics New Zealand and Ministry of Health, 1992/93 Household Health Survey
By the 1981 Census the proportion of the adult population who were smokers haddropped to 32 percent. More than half of Mâori (56 percent) smoked, as shown inTable 30. Young Mâori women aged 15 to 24 years were the most likely to smoke(63 percent).
Twenty-three percent of adults reported that they were current tobacco smokers inthe 1992/93 Household Health Survey, with people aged 65 years and over the leastlikely to smoke. Males in this age group (24 percent) were slightly more likely to smokethan females (22 percent) as shown in Table 31. This pattern was true across all agegroups with the exception of the 15-to-24-year-old group, where a higher proportion ofwomen than men were smokers. Nearly half of Mâori (47 percent) were tobacco smokersin 1992/93. Mâori women aged 25 to 44 years were the most likely to smoke tobacco(58 percent).

New Zealand Drug Statistics 49
One in four adults (24 percent) were cigarette smokers according to the 1996/97 NewZealand Health Survey. As with the 1992/93 Health Survey, males (27 percent) weremore likely to smoke tobacco than females (23 percent). A greater percentage of peoplereported that they were ex-cigarette smokers in the 1996/97 survey (25 percent) than inthe 1992/93 survey (19 percent).
Cigarette smoking in 1996/97 was higher than in 1992/93 for 15-to-44-year-olds.Table 32 shows that Mâori women aged 25 to 44 years continued to have the highestsmoking prevalence rate (58 percent) in 1996/97.
Table 32: Percentage of population smoking tobacco by age, sex and ethnicity, 1996/97 HouseholdHealth Survey
Age European Mâori Pacific peoples Total
group Male Female Male Female Male Female Male Female
15–24 25 27 38 56 19 19 25 29
25–44 31 25 53 58 34 26 33 28
45–64 21 19 34 41 47 14 22 20
65+ 15 9 35 22 49 9 16 10
Total 25 21 44 53 35 21 27 23
Total23 49 28 25
both sexes
Source: Statistics New Zealand and Ministry of Health, 1996/97 Household Health Survey
Table 33: Percentage of cigarette smokers by age, sex and ethnicity, 1996 Census
Age European Mâori Pacific peoples Asian Other Total
group M F M F M F M F M F M F
15–24 24 25 37 47 27 24 13 5 18 14 26 28
25–44 27 25 45 53 40 29 23 5 30 16 30 28
45–64 21 18 36 40 37 19 18 4 23 16 23 20
65+ 12 9 21 19 24 11 16 5 16 11 12 9
Total 22 20 40 47 35 25 19 5 26 15 25 23
Totalboth 21 44 30 11 21 24sexes
Source: Statistics New Zealand, Census of Population and Dwellings, 1996
The 1996 Census recorded a drop from the 1981 Census in the proportion of the adultpopulation who were smokers, to 24 percent. Mâori smoking rates dropped 12 percentagepoints to 44 percent. Amongst Mâori women aged 15 to 24 the smoking rate dropped16 percentage points to 47 percent, as shown in Table 33. This finding differs markedlyfrom the 1996/97 New Zealand Health Survey, which found that 56 percent of Mâoriwomen aged 15 to 24 years smoked.

50 New Zealand Drug Statistics
The 1996 Census showed that high-income adults were less likely to smoke thanthose with middle and low incomes, as shown in Table 34.
Current prevalence and trends
While there was an appreciable decline in smoking prevalence during the 1980s,smoking prevalence has decreased only slightly in the 1990s (approximately 2 percentagepoints from 1990 to 1999). In 1999, smoking prevalence in those aged 15 years and overwas 26 percent. One in two Mâori, around one in three Pacific peoples, and around onein four of European and other ethnic groups were cigarette smokers in 1999.
Prevalence between 1985 and 2000
While cigarette smoking prevalence for all ages combined has declined by 5 percentagepoints over the last 16 years, there has been little improvement for those younger than35 years of age. For ages 15 to 24 years, smoking prevalence initially decreased, but from1992 the prevalence fluctuated without any clear trend. For this youngest age group,smoking is more common among females than males. In 2000, prevalence in femaleswas 31 percent, and in males 28 percent.
For ages 25 to 34 years, smoking prevalence fluctuated without any clear trend. Thisage group has tended to have the highest smoking prevalence (closely followed by15-to-24-year-olds), with 35 percent of males and 37 percent of females being smokersin 2000. Smokers now aged 25 to 34 years would probably have started to smoke in theearly 1980s, when cigarettes were more affordable than at present.
Among those aged 35 to 54 years, smoking prevalence fell by 4 percentage points forboth males and females. For men aged 55 years and over, smoking prevalence fell by12 percentage points, and for women by 6 percentage points.
Prevalence between 1976 and 2000
Cigarette smoking prevalence between 1976 and 2000 has declined overall by 30percent. However, there has been little decline in smoking prevalence for women underthe age of 25 years (Table 35).
Table 34: Percentage of cigarette smokers by personal income group, 1996
Income group Smoker Ex-smokerNever smoked
Totalregularly
Loss – $10,000 23 18 59 100
$10,001 – $20,000 26 24 50 100
$20,001 – $30,000 27 22 51 100
$30,001 – $50,000 21 25 54 100
$50,001+ 14 28 58 100
Total 24 22 54 100
Source: Statistics New Zealand, Census of Population and Dwellings, 1996

New Zealand Drug Statistics 51
Tab
le 3
5:Pe
rcen
tage
pre
vale
nce
of c
igar
ette
sm
okin
g in
New
Zea
land
, 197
6–20
00
Year
1976
1981
1983
1984
1985
1986
1987
1988
1989
1990
1991
1992
1993
1994
1995
1996
1997
1998
1999
2000
Mal
es
15–2
4 ye
ars
3533
3435
3131
3227
2830
2825
2828
2527
2727
3028
25–3
4 ye
ars
4338
3839
3532
3438
3032
3534
3536
3533
3034
3335
35–5
4 ye
ars
4438
3735
3129
3431
2830
2729
3030
2926
2828
2727
55+
year
s35
3029
2724
2422
2020
1818
1819
1719
1916
1616
12
Tota
l mal
es40
3535
3430
2931
2927
2827
2728
2827
2626
2626
25
Fem
ales 15
–24
year
s34
3540
4040
3736
3937
3433
3330
3433
3635
3033
31
25–3
4 ye
ars
3834
3534
3434
3535
3332
3036
3433
3635
3631
3237
35–5
4 ye
ars
3532
3129
2932
2628
2528
2427
2625
2526
2626
2625
55+
year
s21
1921
2219
2119
1616
1616
1416
1614
1314
1213
13
Tota
l fem
ales
3229
3131
3031
2829
2727
2627
2626
2626
2724
2525
Bo
th s
exes
Mâo
ri58
56-
--
--
--
5150
5254
5251
4951
4951
49
Paci
fic p
eop
les
3533
--
--
--
-32
3033
33
3434
3234
3330
31
Euro
pea
n/O
ther
--
--
--
--
-25
2424
2424
2423
2322
2222
Tota
l pop
ulat
ion
3632
3332
3030
3029
2728
2627
2727
2726
2625
2625
(15+
yea
rs)
Sour
ce: 1
976
and
1981
Cen
sus
of P
opul
atio
n an
d D
wel
lings
, Dep
artm
ent
of S
tatis
tics;
198
3–99
AC
Nie
lsen
(N
Z)
Ltd
(fo
rmer
ly O
TR S
pec
trum
Res
earc
h)
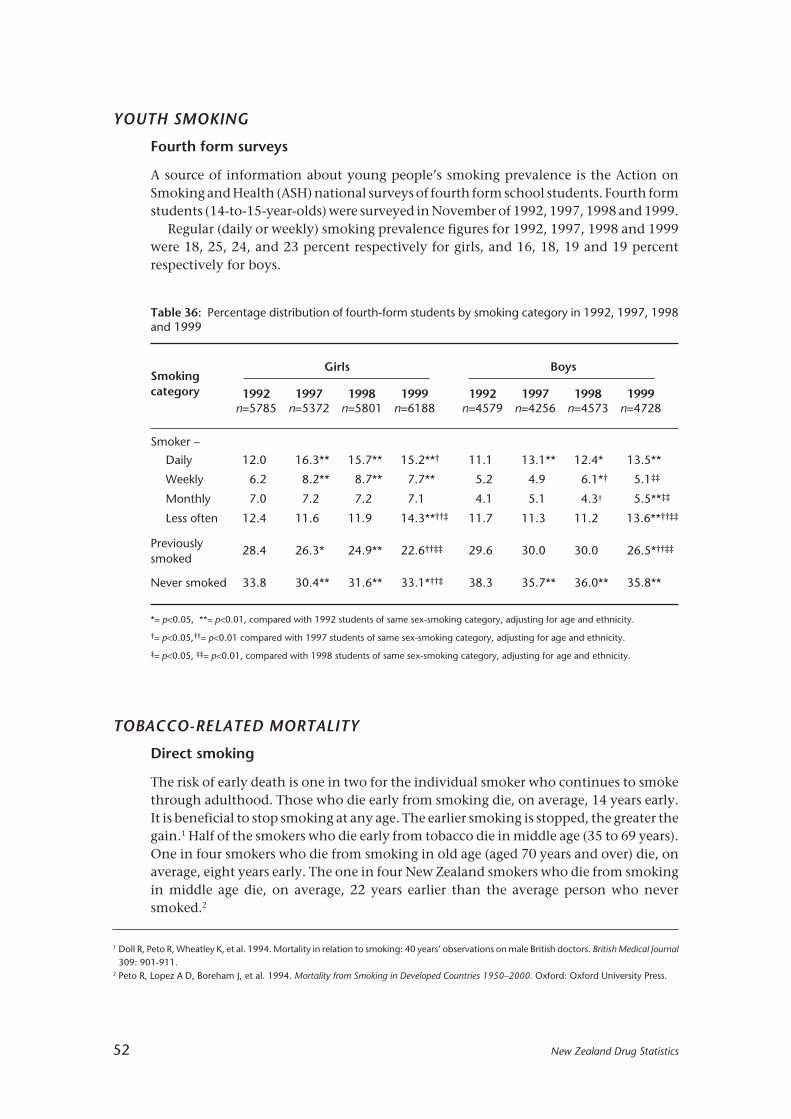
52 New Zealand Drug Statistics
Table 36: Percentage distribution of fourth-form students by smoking category in 1992, 1997, 1998and 1999
SmokingGirls Boys
category 1992 1997 1998 1999 1992 1997 1998 1999n=5785 n=5372 n=5801 n=6188 n=4579 n=4256 n=4573 n=4728
Smoker –
Daily 12.0 16.3** 15.7** 15.2**† 11.1 13.1** 12.4* 13.5**
Weekly 6.2 8.2** 8.7** 7.7** 5.2 4.9 6.1*† 5.1‡‡
Monthly 7.0 7.2 7.2 7.1 4.1 5.1 4.3† 5.5**‡‡
Less often 12.4 11.6 11.9 14.3**††‡ 11.7 11.3 11.2 13.6**††‡‡
Previously28.4 26.3* 24.9** 22.6††‡‡ 29.6 30.0 30.0 26.5*††‡‡
smoked
Never smoked 33.8 30.4** 31.6** 33.1*††‡ 38.3 35.7** 36.0** 35.8**
*= p<0.05, **= p<0.01, compared with 1992 students of same sex-smoking category, adjusting for age and ethnicity.
†= p<0.05,††= p<0.01 compared with 1997 students of same sex-smoking category, adjusting for age and ethnicity.
‡= p<0.05, ‡‡= p<0.01, compared with 1998 students of same sex-smoking category, adjusting for age and ethnicity.
YOUTH SMOKING
Fourth form surveys
A source of information about young people’s smoking prevalence is the Action onSmoking and Health (ASH) national surveys of fourth form school students. Fourth formstudents (14-to-15-year-olds) were surveyed in November of 1992, 1997, 1998 and 1999.
Regular (daily or weekly) smoking prevalence figures for 1992, 1997, 1998 and 1999were 18, 25, 24, and 23 percent respectively for girls, and 16, 18, 19 and 19 percentrespectively for boys.
TOBACCO-RELATED MORTALITY
Direct smoking
The risk of early death is one in two for the individual smoker who continues to smokethrough adulthood. Those who die early from smoking die, on average, 14 years early.It is beneficial to stop smoking at any age. The earlier smoking is stopped, the greater thegain.1 Half of the smokers who die early from tobacco die in middle age (35 to 69 years).One in four smokers who die from smoking in old age (aged 70 years and over) die, onaverage, eight years early. The one in four New Zealand smokers who die from smokingin middle age die, on average, 22 years earlier than the average person who neversmoked.2
1 Doll R, Peto R, Wheatley K, et al. 1994. Mortality in relation to smoking: 40 years’ observations on male British doctors. British Medical Journal309: 901-911.
2 Peto R, Lopez A D, Boreham J, et al. 1994. Mortality from Smoking in Developed Countries 1950–2000. Oxford: Oxford University Press.

New Zealand Drug Statistics 53
In 1990, 4500 deaths in New Zealand were attributed to tobacco smoking, accountingfor 18 percent of all deaths.1 In 1996, approximately 4700 deaths were attributed totobacco smoking, accounting for 17 percent of all deaths.
Eleven percent of all female deaths and 22 percent of all male deaths were attributedto tobacco smoking in 1990. For both men and women, nearly half of these deathsoccurred in middle age (35 to 69 years).1 Deaths attributable to tobacco smoking forfemales increased from 1400 deaths per year in 1990 to 1800 in 1996. For males, adecrease in tobacco-attributed deaths was observed over the same period.
After a population takes up tobacco smoking it takes 30 to 40 years before tobaccodeath rates reach their maximum. After smoking declines there is a 10-year lag beforedeath rates begin to decline.2 The tobacco death rate follows the trend of the lungcancer rate, which continues to decline for men. However, the lung cancer rate has notyet declined for women.3
Table 37: Mortality, whether cigarette smoking attributable or not, in New Zealand in middle age (age35 to 69 years), 1975 to 1996, annual rates per 1000 persons, age standardised
Death rates per 1000* 1985–96change
1975 1985 1990 1995 1996 (%)
Male, cigarette attributable 4.57 3.67 2.89 2.41 2.31 –37
Male, all other mortality 9.48 8.21 7.16 6.57 6.53 –21
Female, cigarette attributable 1.01 1.35 1.33 1.28 1.21 –10
Female, all other mortality 6.50 5.42 5.01 4.45 4.34 –20
* mean of seven age specific rates, age 35 to 69 years
Source: Laugesen M, Swinburn B. 2000. New Zealand’s tobacco control programme 1985–1998. Journal of Tobacco Control 9:155-162.
1 Peto R, Lopez A D, Boreham J, et al. 1994. Mortality from Smoking in Developed Countries 1950–2000. Oxford: Oxford University Press.2 Lopez A D, Collishaw N E, Piha P. 1994. A descriptive model of the cigarette epidemic in developed countries. Journal of Tobacco Control 3:
242-247.3 Ministry of Health. 2000. Mortality and Demographic Data 1997. Wellington: New Zealand Health Information Service, Ministry of Health.4 Woodward A, Laugesen M. 2000. Deaths in New Zealand Attributable to Second Hand Smoke. Report to the New Zealand Ministry of Health,
September 2000. (Available at www.moh.govt.nz.)
Deaths in New Zealand attributable to second-hand smoke
There are about 388 deaths attributable to second-hand smoke (“passive smoking”) inNew Zealand each year according to a report prepared for the Ministry of Health inSeptember 2000.4 This figure represents an additional 8 percent over and above deathsper year due to direct smoking and is about three-quarters of the number of people whohave been killed each year on the roads in New Zealand in recent years. However, thereare many uncertainties associated with this calculation. The authors of the reportexplored the effect of varying the assumptions on which the estimate is based, and onthis basis suggest a plausible range of 180 to 621 deaths per year. Extrapolations fromother national estimates of deaths attributable to second-hand smoke overlap thisrange.

54 New Zealand Drug Statistics
The greatest risk of exposure to second-hand smoke occurs at work and in the home— accountable for an estimated 145 deaths and 193 deaths respectively. It is alsoestimated that 50 of the 109 Sudden Infant Death Syndrome (SIDS) deaths recorded in1996 were attributable to second-hand smoke.
TOBACCO TAXATION AND PRICE
New Zealand’s excise on tobacco products is indexed to the consumer price index (CPI)and adjusted annually to keep the real price of tobacco relatively consistent over time.Goods and Services Tax (GST) of 12.5 percent also applies on top of the final price. Inaddition to the CPI adjustments, there have been periodic tax increases as well, mostrecently in 1995, 1998 and 2000.
Tax take and costs associated with tobacco smoking
In the year to June 2000 the tax revenue earned from the excise duty on tobacco productswas $821 million, excluding GST.1
The cost from tobacco use to New Zealand publicly funded personal healthcareservices in 1987 was estimated at $202 million in 1992 dollars, or $222 million in 2000dollars.2
The cost of tobacco products use to New Zealand in 1988 was estimated at $1.9 billionin 1992 dollars, without counting passive smoking costs. Illness care costs, loss ofearnings of the deceased, and an estimate of the value of the life of the prematurelydeceased were included, but not grief and suffering or the cost of fires.2
Recent tax increases
In December 1995, the excise on roll-your-own tobacco, cigars and pipe tobacco wasequalised (on a weight-for-weight basis) with the excise on manufactured cigarettes.Equalising the tax meant a 37.5 percent increase in the excise on tobacco products otherthan manufactured cigarettes. After the December 1995 increase, manufactured cigaretteconsumption increased 5 percent, while loose tobacco consumption fell by 17 percent.Total consumption remained almost unchanged.
Table 38: Summary of estimated number of deaths attributable to second-hand smoke (includesstroke deaths before age 75, otherwise deaths at any age)
Work Home Total
Heart disease 98.4 144.8 243.3
Stroke 43.0 44.7 87.7
SIDS – 50 50
Lung cancer 3.5 3.7 7.2
All causes 388.2
1 Source: The Treasury2 Tobacco Products: The Public Health Commission’s Advice to the Minister of Health 1993–1994.

New Zealand Drug Statistics 55
In May 1998 there was an increase in the excise on tobacco products equating to a 10percent increase in the price of all tobacco products (56 cents per packet of 20 cigarettes).As a result, loose tobacco consumption increased by 2 percent and manufacturedcigarette consumption decreased by 8 percent. Total consumption decreased byapproximately 6 percent overall.
The excise in tobacco products was raised again in May 2000, increasing the price oftobacco by approximately 14 percent (one dollar per pack of 20 cigarettes). It is too earlyto judge the long-term effect that this excise increase will have on tobacco consumption.
ATTITUDES AND BELIEFS CONCERNING SECOND-HAND SMOKE
A number of studies have been undertaken in New Zealand, by the National ResearchBureau, among others, into beliefs about the health effects associated with second-handsmoke, and people’s attitudes to second-hand smoke. Second-hand smoke is alsovariously referred to as “environmental tobacco smoke”’ or “passive smoking”.
This publication selectively presents data from four National Research Bureau (NRB)reports of telephone surveys of the public. These documents contain a wealth ofinformation and people interested in this subject are referred to them (available from theNational Drug Policy web site at www.ndp.govt.nz).
• NRB, 1989. Social Research Report: Heart Health Behaviour of Adult New Zealanders.Prepared for the Health Department, November 1989. (unpublished report)
• NRB. 1991. Social Research Report: Monitor of Heart Health Behaviour of Adult NewZealanders (Second Reading). Prepared for the Health Department, November 1991.(unpublished report)
• NRB. 1996. Environmental Tobacco Smoke Study. Prepared for the Ministry of Health,July 1996. (unpublished report)
• NRB. 1999. Attitudes Toward Environmental Tobacco Smoke. (unpublished report).
All surveys were of people aged 15 and above. The sample sizes for the studies were: 2698(1999), 2020 (1996), 2000 (1991), and 2300 (1989). Key results from these surveys arepresented below.
Beliefs about the health effects of second-hand smoke
In 1989 and 1991, people were asked whether they agreed or disagreed with thestatement: “The health of non-smokers can be damaged by other people’s tobacco smoke.”
The results (see Table 39) show that between 1989 and 1991 there was little changein the total agreeing with this statement (strongly agree and agree combined). Bothsmokers and non-smokers who supported the statement were more likely to agreestrongly with it in 1991 than they were in 1989.
Attitudes to other people’s smoking
In 1996 and 1999, people who were surveyed were asked their reaction to passivesmoking. The questions were phrased slightly differently, but give an indication ofattitudes over time. In both studies, respondents were asked to classify their reaction tosomeone smoking cigarettes near them. In 1996, 68 percent of respondents reportedthat they found other people’s smoking bothersome to some degree. In 1999, 72 percentof respondents found other people’s smoking bothersome (Table 40).

56 New Zealand Drug Statistics
Table 39: Results from National Research Bureau survey question: “The health of non-smokers can bedamaged by other people’s tobacco smoke”
1989 1991(%) (%)
Strongly agree 36 55
Agree 48 31
Neither agree, nor disagree 6 4
Disagree 5 5
Strongly disagree 1 2
Don’t know 4 3
Smokers agreeing 66 74
Former smokers agreeing 84 82
Non-smokers agreeing 91 93
Table 40: Results from National Research Bureau survey questions on attitudes to other people’ssmoke
1996 study (%) 1999 study (%)n = 855 n = 2698
Enjoyable on the whole: 1 Enjoyable on the whole: 4
Slightly enjoyable: 3
Did not bother 31 Neither enjoyable nor bothersome 21
Bothered slightly 32 Slightly bothersome: 24
Bothered a lot 36 Bothersome on the whole 48
Table 41: Results from 1989 National Research Bureau survey question: “Smoking should not be allowed
in public places”
(%)
Total agreeing 80
Males agreeing 78
Females agreeing 81
Mâori agreeing 65
Pacific peoples agreeing 69
People of European descent agreeing 82
Smokers agreeing 60
Former smokers agreeing 78
Non-smokers agreeing 89

New Zealand Drug Statistics 57
In 1996, the NRB asked people the degree to which they were worried about breathingother people’s smoke. The results show that almost half of adults (46 percent) whoresponded were not worried about breathing other people’s cigarette smoke. Fifty-fourpercent were quite worried or very worried.
The NRB surveys included questions asking whether smoking should be restricted inpublic places. Unfortunately, the findings are not comparable in many cases asquestions have been variously phrased, perhaps to measure public opinion on issues ofconcern or interest at the time.
For example, in 1989 people were asked if they agreed or disagreed with thestatement: “Smoking should not be allowed in enclosed public places.” This related to thethen current debate over proposed legislation restricting smoking in workplaces andpublic places (the Smoke-free Environments Act 1990). The results (Table 41) show thata majority of people supported restrictions on smoking in enclosed public areas.
However, the 1999 survey looked at specific venues and asked whether peoplesupported smoking in certain public places. The findings are presented in Table 42.
Table 43: Results from 1989 National Research Bureau survey questions on support for new law
(%)
Support 80
Oppose 12
Don’t know 8
Non-smokers supporting 87
Former smokers supporting 78
Current smokers supporting 63
Table 42: Results from 1999 National Research Bureau survey question: “Do you think that, in general,smoking should be allowed in the following places?”
(%)
Enclosed shopping centres and malls 13
Housie halls 19
Sporting clubs 32
Nightclubs 50
Open sports stadiums 55
Views on smoking in workplaces
In 1989, the NRB asked: “A new law is proposed which would require places of employmentto provide smoke-free working conditions for non-smokers. That is, any smoking which tookplace would have to be in specially designated areas away from non-smokers. Would yousupport or oppose such a law?” The results are shown in Table 43.
In 1999, the NRB asked people whether they agreed with certain statements. Thestatements, and the level of agreement with these, are provided in Table 44.

58 New Zealand Drug Statistics
Table 44: Results from 1999 National Research Bureau survey on level of agreement with certainstatements
StronglyAgree
No feelingDisagree
Stronglyagree either way disagree(%)
(%)(%)
(%)(%)
People should be allowedto smoke wherever they like 2 5 2 45 46at work
All workplaces should be24 35 5 32 4
entirely smokefree
Smoking should not beallowed in any workplacewhere non-smokers have to
31 47 5 15 2
work
Smoking should be allowedin a workplace if everyone in 6 56 4 25 9that area agrees
The only place smoking shouldbe allowed is in designated, 23 64 2 8 3ventilated rooms or areas
Exposure to second-hand smoke in the workplace
The 1989, 1991 and 1996 reports all presented various questions relating to actualexposure to second-hand smoke in workplaces. Three questions, asked at each survey,sought to identify how many people were exposed to other people’s smoke during teabreaks, lunch breaks and actual working times. The questions asked people to report thenumber of people smoking cigarettes into the air around them at these times.
Table 45 presents the data indicating the proportion of workers who were exposed toother people’s smoking (smoking by one or more people) in their workplaces in thosesituations.
Table 45: Results from National Research Bureau survey questions on exposure to other people’s smoking
1989 1991 1996(%) (%) (%)
Exposed during tea breaks 53 39 36
Exposed during lunch breaks 48 36 36
Exposed during actual working hours 31 21 19
Table 45 illustrates that between 1989 and 1991 there was a significant drop in theproportion of people exposed to other people’s smoking at work. The Smoke-freeEnvironments Act 1990 had banned smoking in shared office situations and some otherlimited situations. However, there has been little change in the situation since 1991 (the1990 Act did not really address smoking in workplaces other than offices — for example,factories, hospitality venues, and other “blue-collar” workplaces).
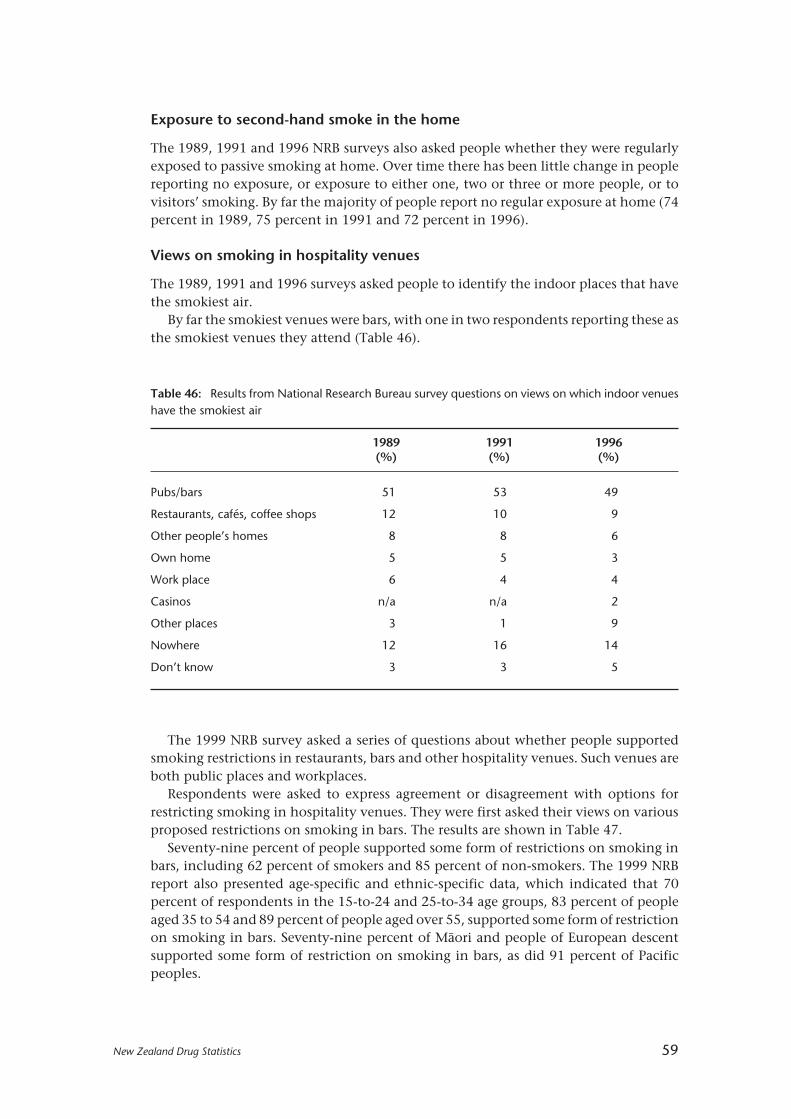
New Zealand Drug Statistics 59
Table 46: Results from National Research Bureau survey questions on views on which indoor venueshave the smokiest air
1989 1991 1996(%) (%) (%)
Pubs/bars 51 53 49
Restaurants, cafés, coffee shops 12 10 9
Other people’s homes 8 8 6
Own home 5 5 3
Work place 6 4 4
Casinos n/a n/a 2
Other places 3 1 9
Nowhere 12 16 14
Don’t know 3 3 5
Exposure to second-hand smoke in the home
The 1989, 1991 and 1996 NRB surveys also asked people whether they were regularlyexposed to passive smoking at home. Over time there has been little change in peoplereporting no exposure, or exposure to either one, two or three or more people, or tovisitors’ smoking. By far the majority of people report no regular exposure at home (74percent in 1989, 75 percent in 1991 and 72 percent in 1996).
Views on smoking in hospitality venues
The 1989, 1991 and 1996 surveys asked people to identify the indoor places that havethe smokiest air.
By far the smokiest venues were bars, with one in two respondents reporting these asthe smokiest venues they attend (Table 46).
The 1999 NRB survey asked a series of questions about whether people supportedsmoking restrictions in restaurants, bars and other hospitality venues. Such venues areboth public places and workplaces.
Respondents were asked to express agreement or disagreement with options forrestricting smoking in hospitality venues. They were first asked their views on variousproposed restrictions on smoking in bars. The results are shown in Table 47.
Seventy-nine percent of people supported some form of restrictions on smoking inbars, including 62 percent of smokers and 85 percent of non-smokers. The 1999 NRBreport also presented age-specific and ethnic-specific data, which indicated that 70percent of respondents in the 15-to-24 and 25-to-34 age groups, 83 percent of peopleaged 35 to 54 and 89 percent of people aged over 55, supported some form of restrictionon smoking in bars. Seventy-nine percent of Mâori and people of European descentsupported some form of restriction on smoking in bars, as did 91 percent of Pacificpeoples.

60 New Zealand Drug Statistics
Table 47: Results from 1999 National Research Bureau survey questions on preferences for smokingrestrictions in bars: “Do you think that bars should …?”
TotalCurrent Current
(%)non-smokers smokers
(%) (%)
Have no restrictions on smoking at all 19 13 36
Have 50 percent of floor area non-smoking 28 26 34
Have smoking only in separate rooms sosmoke can’t drift into non-smoking areas 41 46 26
Have no smoking allowed at all 10 13 2
No opinion 2 2 2
Table 48: Results from 1999 National Research Bureau survey questions on preferences for smokingrestrictions in eating places: “Do you think that restaurants, cafés and food halls should …?”
Total Current Current
(%) non-smokers smokers(%) (%)
Have no restrictions on smoking at all 3 2 4
Have 50 percent of floor area non-smoking 23 19 39
Have smoking only in separate rooms sosmoke can’t drift into non-smoking areas 39 40 36
Have no smoking allowed at all 35 39 20
No opinion – – 1
A similar question was asked in relation to smoking restrictions in restaurants, cafésand food halls. The results are shown in Table 48.
The Smoke-free Environments Act 1990 currently provides for a minimum of 50percent of seating in eating places to be designated as smoke-free. Thus, having separaterooms for smoking, or having no smoking permitted at all can be considered “stricter”requirements than are currently in place. On this basis, the above table shows that 74percent of people (including 79 percent of non-smokers and 56 percent of smokers)support stricter controls on smoking in restaurants, cafes and food halls.
The NRB report also presents ethnic-specific and age-specific data. The reportindicates that 71 percent of people aged 15 to 24, 65 percent of people aged 25 to 34, 78percent of people aged 35 to 54 and 83 percent of people aged over 55 support strictercontrols on smoking in such venues. Sixty-nine percent of Mâori, 74 percent of peopleof European descent and 76 percent of Pacific peoples support stricter controls.

New Zealand Drug Statistics 61
Cannabis
KEY FACTS
Use
• Marijuana is the third most popular recreational drug in New Zealand after alcoholand tobacco (excluding caffeine).
• In the 1998 National Drugs Survey, 43 percent of males and 27 percent of females aged18 to 24 years had used marijuana in the preceding 12 months. Most of those whostated that they had tried marijuana had been introduced to the drug at between 14and 18 years of age.
Crime
• About 70 percent of prosecutions (18 720 prosecutions) for offences involvingcannabis resulted in a conviction (13 120 convictions) in 1998. Approximately85 percent of convictions for cannabis offences each year are of males.
• In 1998 the largest number of convictions were for those between 30 and 39 years old(30 percent of all convicted cases). The age group with the second highest proportionwas those aged 20 to 24 years, with 24 percent of all convicted cases.
Mortality
• There were seven deaths over the period 1990–96 where a cannabis-related conditionsuch as drug abuse or dependence was the underlying cause of death.
Hospitalisations
• There were 2722 cannabis-related hospitalisations over the period from 1996 to 1998.There were 4.5 publicly funded hospitalisations per 100 000 population in 1998where a diagnosis of a cannabis-related condition or poisoning was recorded.

62 New Zealand Drug Statistics
MARIJUANA1 SUPPLY
Marijuana is an illegal drug, and is supplied through informal networks. The 1998National Drug Survey asked questions about supply of marijuana, and found that 42percent of users had obtained all of their marijuana by being given it, only8 percent had obtained theirs exclusively by purchase, and 1 percent grew all of theirown. The remainder (49 percent) had obtained their supply by a combination of gift,purchase, or growing their own, in varying proportions.
Many current users of marijuana do not actively pursue acquisition of the drug. Forty-five percent of current marijuana users stated that they had never tried to maintain someon hand. A further 17 percent of users stated that they rarely tried to obtain marijuana.Fourteen percent of users had, however, always or at least most of the time tried to keepsome marijuana on hand.
Mâori
The 1998 report on Mâori drug use, Te Ao Taru Kino2, found that most Mâori marijuanausers do not keep supplies of the drug. Of those who had used marijuana in the previous12 months, 42 percent had never tried to maintain a supply, and 15 percent rarely keptsome on hand. Only 12 percent of current Mâori marijuana users always or at least mostof the time kept a supply of marijuana. In addition, about one-third (36 percent) statedthat they had obtained all of their marijuana without payment.
MARIJUANA USE
Marijuana is the third most popular drug in New Zealand after alcohol and tobacco (seeFigure 1, page 6).
Prevalence of marijuana use
The use of marijuana was surveyed in the Regional Drug Surveys of 1990 and 1998. In1998, 21 percent of the sample (26 percent of males, 16 percent of females) had usedmarijuana in the preceding 12 months. The proportions by age of those who had usedmarijuana in the previous 12 months are shown in Figure 24, for both 1990 and 1998.The highest prevalence of use in both years was between ages 18 and 24. In 1998,43 percent of the males and 27 percent of the females in this age group reported havingused marijuana in the previous 12 months. The prevalence fell steadily with age; at age35 to 39 years, less than 20 percent of men and less than 10 percent of women reportedthat they had used marijuana in the previous 12 months. Between 1990 and 1998 therewas little increase in use among males. Use by females increased by 5 percentage points;most of this increase occurred at younger ages.
The percentage of those who had ever tried marijuana was higher than those who hadused marijuana in the past 12 months. Proportions of males and females who had evertried marijuana are shown in Figure 25 by age. In the 1998 National Drug Survey,50 percent (56 percent of males, 44 percent of females) had tried marijuana at some time
1 Note that marijuana is one preparation of cannabis. Other preparations include hashish and hash oil, and these are not included in this sectionon supply.
2 Dacey B, Moewaka Barnes H. 2000. Te Ao Taru Kino: Drug Use Amongst Mâori in 1998. Auckland: Whariki Mâori Health Research Group,University of Auckland.

New Zealand Drug Statistics 63
in their lives. One-third of 15-to-17-year-old males and one-quarter of 15-to-17-year-oldfemales reported trying marijuana at some time. Almost two-thirds (65 percent) of malesand 50 percent of females at ages 18 to 34 years had tried marijuana at some time. Theproportion was less at ages older than 34 years. Between 1990 and 1998 in the RegionalSurveys, the proportion of males reporting having ever used marijuana increased by4 percentage points, and the proportion of females who had ever used marijuanaincreased by 12 percentage points.
Male 1998
Female 1990 Female 1998
Male 1990
15–17 18–19 20–24 25–29 30–34 35–39 40–45
50
40
30
20
10
0
Age group
Percentageof sample
Figure 24: Percentage reporting having used marijuana in the last 12 months, by sex and age group, 1990and 1998Source: Alcohol and Public Health Research Unit, 1990 and 1998 Regional Drug Surveys1
Figure 25: Percentage who have ever tried marijuana, by sex and age group, 1998Source: Alcohol and Public Health Research Unit, 1998 National Drug Survey 2
1 Field A, Casswell S. 1999. Drug use in New Zealand: Comparison Surveys 1990 and 1998. Auckland: Alcohol and Public Health Research Unit,University of Auckland. Figure 3.3.
2 Field A, Casswell S. 1999. Drug use in New Zealand: National Survey 1998. Auckland: Alcohol and Public Health Research Unit, University ofAuckland. Figure 3.2.
15–17 25–29 35–3930–34
Age group
40–4518–19
Percentageof sample
80
60
40
20
0
Male Female
20–24

64 New Zealand Drug Statistics
Of those who stated that they had tried marijuana, most had been introduced to thedrug between ages 14 and 18 years. Figure 26 shows the cumulative percentage of thosewho had ever tried marijuana, by single years of age up to 26 years, as found in the 1990and 1998 regional surveys. Of the 1990 respondents who indicated they had ever triedmarijuana, 13 percent had tried it by age 14 years, 69 percent by age 18 years, and 91percent by 24 years. By the time of the 1998 survey, 20 percent of respondents had beenintroduced to marijuana by age 14 years, 80 percent by age 18 years, and 97 percent byage 24 years.
Figure 26: Age at which marijuana was first tried, by those who had ever tried marijuana, 1990 and 1998Source: Alcohol and Public Health Research Unit, 1990 and 1998 Regional Drug Surveys1
Mâori prevalence of marijuana use
The 1998 survey on Mâori and drugs published in Te Ao Taru Kino 2 reports that 60percent of Mâori in 1998 (68 percent of males, 53 percent of females) had triedmarijuana. In the 12 months prior to the survey, 26 percent of Mâori (32 percent of malesand 21 percent of females) had used marijuana.
Typical quantity consumed
Taking into account respondents’ reports on the size of groups of marijuana smokers,the average user smoked 80 percent of a joint on a typical occasion. Figure 27 showsaverage consumption by age in 1998. The average amount smoked was less among olderpeople. At age 15 to 17 years, average consumption was 97 percent of a joint. At ages 35to 39 years and 40 to 45 years, a little over half a joint was smoked on a typical occasion.
The amount smoked on a typical occasion by Mâori was 90 percent of a whole joint.
1 Field A, Casswell S. 1999. Drug Use in New Zealand: Comparison Surveys 1990 and 1998. Auckland: Alcohol and Public Health Research Unit,University of Auckland. Figure 3.4.
2 Dacey B, Moewaka Barnes H. 2000. Te Ao Taru Kino: Drug Use Amongst Mâori in 1998. Auckland: Whariki Mâori Health Research Group,University of Auckland.
19981990
11 12 13 14 15 16 17 18 19 20 21 22 23 24 25 26
Age of first use
Cumulativepercentage
100
80
60
40
20
0

New Zealand Drug Statistics 65
Frequency of smoking
The percentage of people who reported having used marijuana in the previous week wasless than the percentage that had used marijuana at some time in the preceding 12months. Slightly under 5 percent of males and females had smoked marijuana once ormore in the previous week. One percent had smoked every day in the preceding week(Figure 28).
0.2
1.0
0.8
0.6
0.4
0.015–17 20–24 25–29 35–3930–34
Age group
Average numberof joints
40–4518–19
Figure 27: Average number of joints smoked on a typical occasion, by age, people who had used marijuanain the last 12 months, 1998Source: Alcohol and Public Health Research Unit, 1990 and 1998 Regional Drug Surveys1
Male Female
35
30
25
15
10
5
0
20
Percentageof sample
1 perday
3–6per
week
2 perweek
1 perweek
40–49peryear
20–39peryear
10–19peryear
6–9peryear
3–5peryear
1–2peryear
None
Frequency of smoking (number of times)
Figure 28: Frequency of smoking marijuana in the previous 12 months, by sex, 1998Source: Alcohol and Public Health Research Unit, 1990 and 1998 Regional Drug Surveys2
1 Field A, Casswell S. 1999. Drug use in New Zealand: Comparison Surveys 1990 and 1998. Auckland: Alcohol and Public Health Research Unit,University of Auckland. Figure 3.6.
2 Field A, Casswell S. 1999. Drug use in New Zealand: National Survey 1998. Auckland: Alcohol and Public Health Research Unit, University ofAuckland. Figure 3.6.

66 New Zealand Drug Statistics
There was a small group of more frequent users, defined as smoking marijuana 10 ormore times in the preceding 30 days. They constituted 6 percent of those who had evertried marijuana, or 3 percent of the total population. This level of use was most commonfor males is the 18-to-19-year-old age group and females in the 20-to-24-year-old agegroup (Table 49).
Cannabis use and location
The 1998 National Drugs Survey also revealed that marijuana was most commonlysmoked at home. Almost two-thirds (62 percent) of those who had used marijuana inthe preceding 12 months smoked “all” or “most” of their marijuana in their own orsomeone else’s home. About a quarter (24 percent) had smoked “some” of their cannabisin a public place. Eleven percent stated that they had done “some” driving under theinfluence of marijuana, while 3 percent stated that they had done “all” or “most” of theirdriving under the influence of marijuana (Table 50).
Table 49: Percentage reporting using marijuana on 10 or more occasions in the last 30 days, by sexand age group, 1998
Percentage of total sample
15–17 18–19 20–24 25–29 30–34 35–39 40–45
Male: 2 11 8 4 6 2 2
Female: 0 2 5 1 2 1 1
Source: Alcohol and Public Health Research Unit, National Drug Survey 19981
1 Field A, Casswell S. 1999. Drug Use in New Zealand: Comparison Surveys 1990 and 1998. Auckland: Alcohol and Public Health Research Unit,University of Auckland. Figure 3.6.
2 Field A, Casswell S. 1999. Drug use in New Zealand: National Survey 1998. Auckland: Alcohol and Public Health Research Unit, University ofAuckland. Figures 4.1, 4.2.
Table 50: Distribution of individuals by level of marijuana use at four locations, percentage of smokersin previous 12 months, 1998
Amount smoked Homes Public places Driving Work
All 32 6 1 0
Most 30 12 2 0
Some 13 24 11 2
Hardly any 11 16 19 2
None 14 42 67 95
Total 100 100 100 100
Note: Percentages may not add to 100 due to roundingSource: Alcohol and Public Health Research Unit, National Drugs Survey 19982
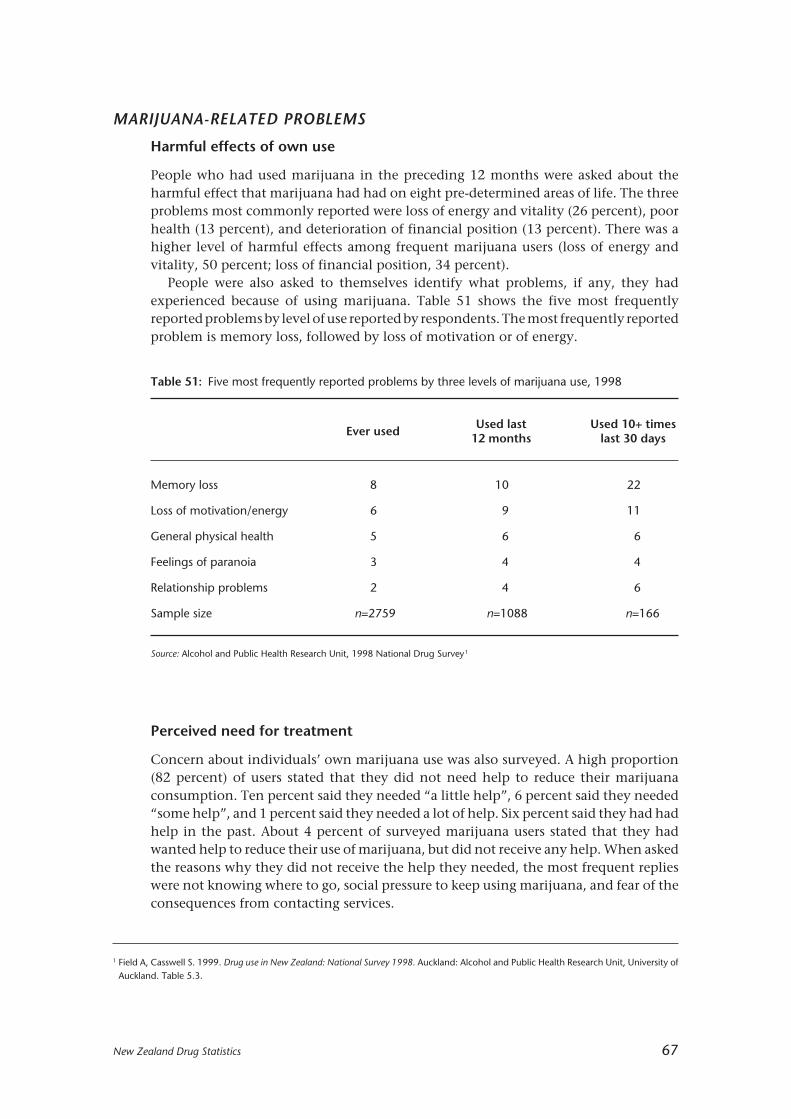
New Zealand Drug Statistics 67
MARIJUANA-RELATED PROBLEMS
Harmful effects of own use
People who had used marijuana in the preceding 12 months were asked about theharmful effect that marijuana had had on eight pre-determined areas of life. The threeproblems most commonly reported were loss of energy and vitality (26 percent), poorhealth (13 percent), and deterioration of financial position (13 percent). There was ahigher level of harmful effects among frequent marijuana users (loss of energy andvitality, 50 percent; loss of financial position, 34 percent).
People were also asked to themselves identify what problems, if any, they hadexperienced because of using marijuana. Table 51 shows the five most frequentlyreported problems by level of use reported by respondents. The most frequently reportedproblem is memory loss, followed by loss of motivation or of energy.
Table 51: Five most frequently reported problems by three levels of marijuana use, 1998
Ever usedUsed last Used 10+ times
12 months last 30 days
Memory loss 8 10 22
Loss of motivation/energy 6 9 11
General physical health 5 6 6
Feelings of paranoia 3 4 4
Relationship problems 2 4 6
Sample size n=2759 n=1088 n=166
Source: Alcohol and Public Health Research Unit, 1998 National Drug Survey1
Perceived need for treatment
Concern about individuals’ own marijuana use was also surveyed. A high proportion(82 percent) of users stated that they did not need help to reduce their marijuanaconsumption. Ten percent said they needed “a little help”, 6 percent said they needed“some help”, and 1 percent said they needed a lot of help. Six percent said they had hadhelp in the past. About 4 percent of surveyed marijuana users stated that they hadwanted help to reduce their use of marijuana, but did not receive any help. When askedthe reasons why they did not receive the help they needed, the most frequent replieswere not knowing where to go, social pressure to keep using marijuana, and fear of theconsequences from contacting services.
1 Field A, Casswell S. 1999. Drug use in New Zealand: National Survey 1998. Auckland: Alcohol and Public Health Research Unit, University ofAuckland. Table 5.3.
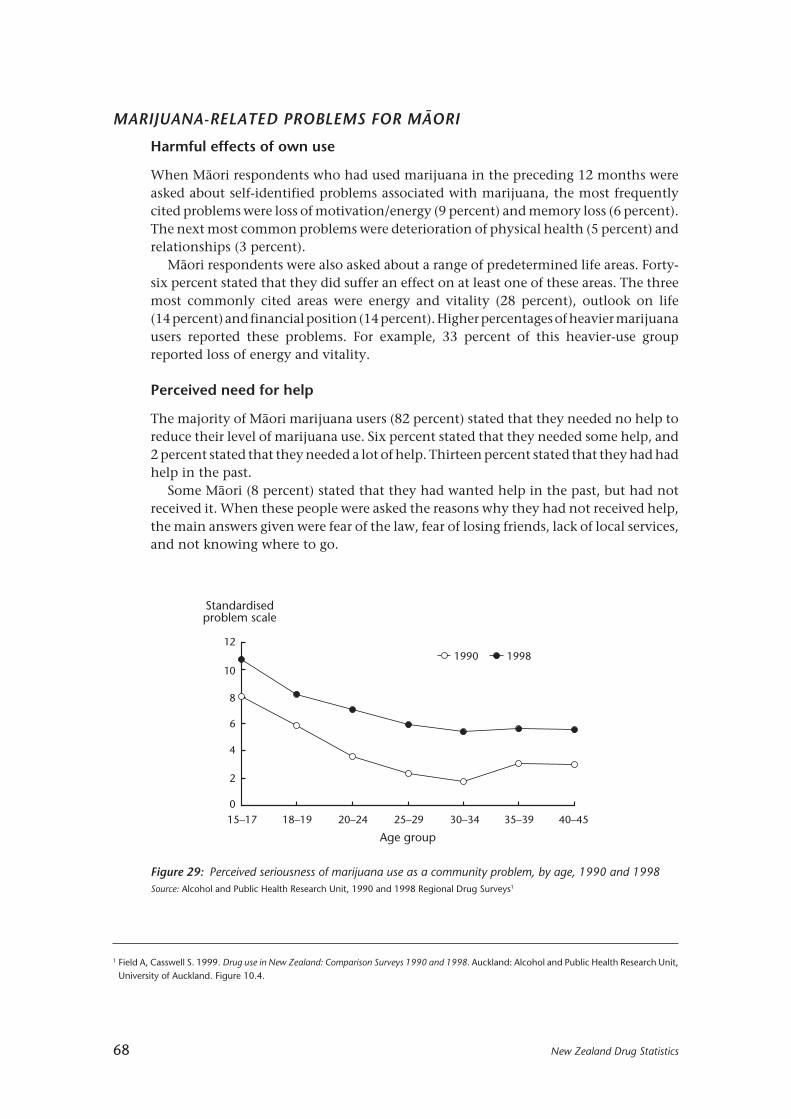
68 New Zealand Drug Statistics
MARIJUANA-RELATED PROBLEMS FOR MÂORI
Harmful effects of own use
When Mâori respondents who had used marijuana in the preceding 12 months wereasked about self-identified problems associated with marijuana, the most frequentlycited problems were loss of motivation/energy (9 percent) and memory loss (6 percent).The next most common problems were deterioration of physical health (5 percent) andrelationships (3 percent).
Mâori respondents were also asked about a range of predetermined life areas. Forty-six percent stated that they did suffer an effect on at least one of these areas. The threemost commonly cited areas were energy and vitality (28 percent), outlook on life(14 percent) and financial position (14 percent). Higher percentages of heavier marijuanausers reported these problems. For example, 33 percent of this heavier-use groupreported loss of energy and vitality.
Perceived need for help
The majority of Mâori marijuana users (82 percent) stated that they needed no help toreduce their level of marijuana use. Six percent stated that they needed some help, and2 percent stated that they needed a lot of help. Thirteen percent stated that they had hadhelp in the past.
Some Mâori (8 percent) stated that they had wanted help in the past, but had notreceived it. When these people were asked the reasons why they had not received help,the main answers given were fear of the law, fear of losing friends, lack of local services,and not knowing where to go.
19981990
15–17 18–19 20–24 25–29 30–34 35–39 40–45
12
10
8
6
4
2
0
Age group
Standardisedproblem scale
1 Field A, Casswell S. 1999. Drug use in New Zealand: Comparison Surveys 1990 and 1998. Auckland: Alcohol and Public Health Research Unit,University of Auckland. Figure 10.4.
Figure 29: Perceived seriousness of marijuana use as a community problem, by age, 1990 and 1998Source: Alcohol and Public Health Research Unit, 1990 and 1998 Regional Drug Surveys1
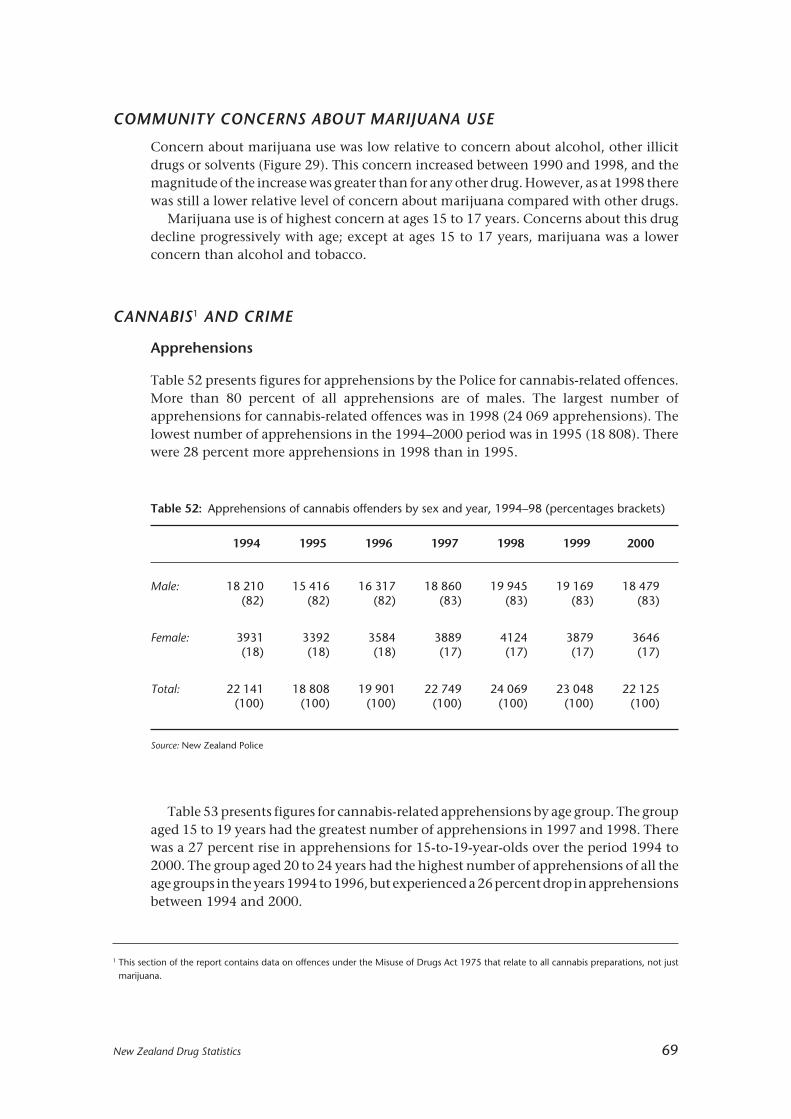
New Zealand Drug Statistics 69
COMMUNITY CONCERNS ABOUT MARIJUANA USE
Concern about marijuana use was low relative to concern about alcohol, other illicitdrugs or solvents (Figure 29). This concern increased between 1990 and 1998, and themagnitude of the increase was greater than for any other drug. However, as at 1998 therewas still a lower relative level of concern about marijuana compared with other drugs.
Marijuana use is of highest concern at ages 15 to 17 years. Concerns about this drugdecline progressively with age; except at ages 15 to 17 years, marijuana was a lowerconcern than alcohol and tobacco.
CANNABIS1 AND CRIME
Apprehensions
Table 52 presents figures for apprehensions by the Police for cannabis-related offences.More than 80 percent of all apprehensions are of males. The largest number ofapprehensions for cannabis-related offences was in 1998 (24 069 apprehensions). Thelowest number of apprehensions in the 1994–2000 period was in 1995 (18 808). Therewere 28 percent more apprehensions in 1998 than in 1995.
Table 52: Apprehensions of cannabis offenders by sex and year, 1994–98 (percentages brackets)
1994 1995 1996 1997 1998 1999 2000
Male: 18 210 15 416 16 317 18 860 19 945 19 169 18 479(82) (82) (82) (83) (83) (83) (83)
Female: 3931 3392 3584 3889 4124 3879 3646(18) (18) (18) (17) (17) (17) (17)
Total: 22 141 18 808 19 901 22 749 24 069 23 048 22 125(100) (100) (100) (100) (100) (100) (100)
Source: New Zealand Police
Table 53 presents figures for cannabis-related apprehensions by age group. The groupaged 15 to 19 years had the greatest number of apprehensions in 1997 and 1998. Therewas a 27 percent rise in apprehensions for 15-to-19-year-olds over the period 1994 to2000. The group aged 20 to 24 years had the highest number of apprehensions of all theage groups in the years 1994 to 1996, but experienced a 26 percent drop in apprehensionsbetween 1994 and 2000.
1 This section of the report contains data on offences under the Misuse of Drugs Act 1975 that relate to all cannabis preparations, not justmarijuana.
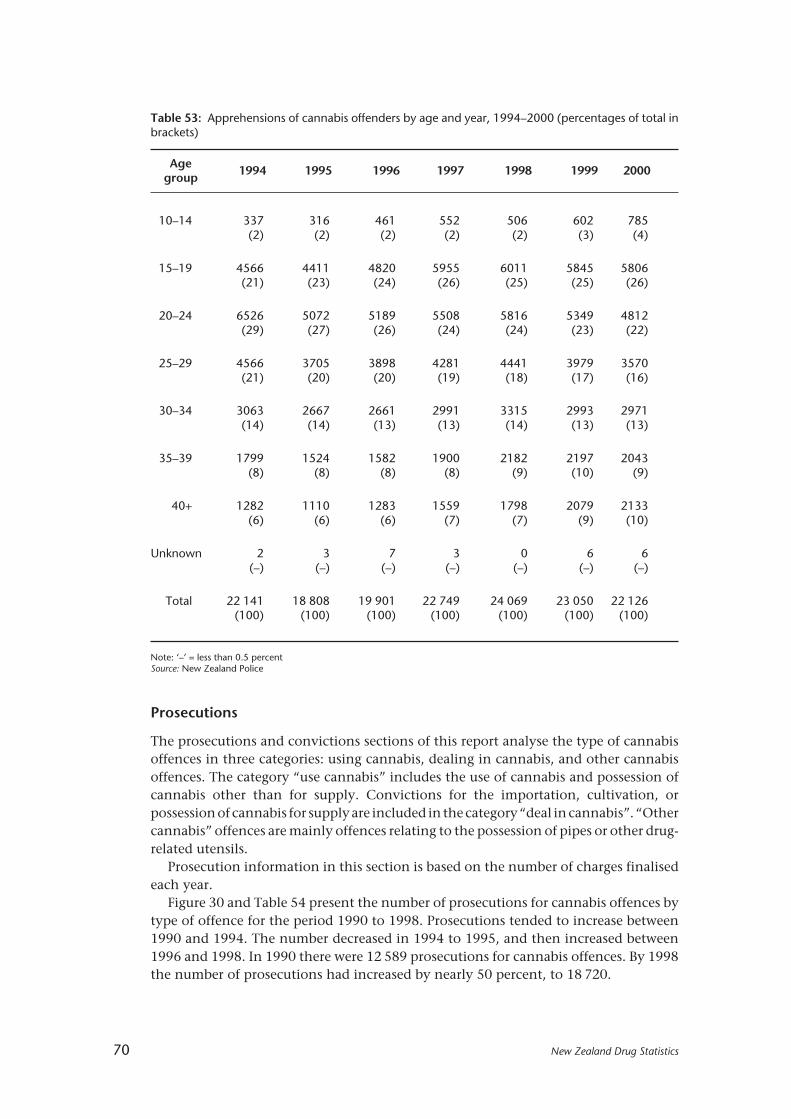
70 New Zealand Drug Statistics
Prosecutions
The prosecutions and convictions sections of this report analyse the type of cannabisoffences in three categories: using cannabis, dealing in cannabis, and other cannabisoffences. The category “use cannabis” includes the use of cannabis and possession ofcannabis other than for supply. Convictions for the importation, cultivation, orpossession of cannabis for supply are included in the category “deal in cannabis”. “Othercannabis” offences are mainly offences relating to the possession of pipes or other drug-related utensils.
Prosecution information in this section is based on the number of charges finalisedeach year.
Figure 30 and Table 54 present the number of prosecutions for cannabis offences bytype of offence for the period 1990 to 1998. Prosecutions tended to increase between1990 and 1994. The number decreased in 1994 to 1995, and then increased between1996 and 1998. In 1990 there were 12 589 prosecutions for cannabis offences. By 1998the number of prosecutions had increased by nearly 50 percent, to 18 720.
Table 53: Apprehensions of cannabis offenders by age and year, 1994–2000 (percentages of total inbrackets)
Age1994 1995 1996 1997 1998 1999 2000group
10–14 337 316 461 552 506 602 785(2) (2) (2) (2) (2) (3) (4)
15–19 4566 4411 4820 5955 6011 5845 5806(21) (23) (24) (26) (25) (25) (26)
20–24 6526 5072 5189 5508 5816 5349 4812(29) (27) (26) (24) (24) (23) (22)
25–29 4566 3705 3898 4281 4441 3979 3570(21) (20) (20) (19) (18) (17) (16)
30–34 3063 2667 2661 2991 3315 2993 2971(14) (14) (13) (13) (14) (13) (13)
35–39 1799 1524 1582 1900 2182 2197 2043(8) (8) (8) (8) (9) (10) (9)
40+ 1282 1110 1283 1559 1798 2079 2133(6) (6) (6) (7) (7) (9) (10)
Unknown 2 3 7 3 0 6 6(–) (–) (–) (–) (–) (–) (–)
Total 22 141 18 808 19 901 22 749 24 069 23 050 22 126(100) (100) (100) (100) (100) (100) (100)
Note: ‘–’ = less than 0.5 percentSource: New Zealand Police
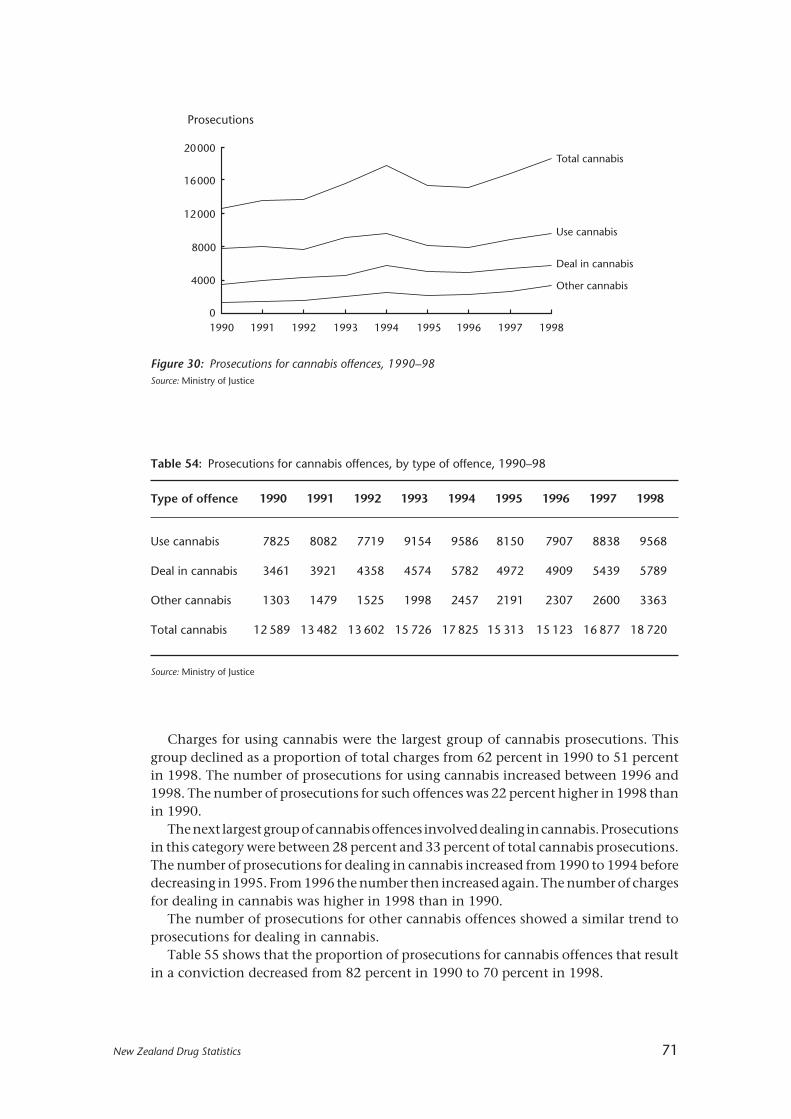
New Zealand Drug Statistics 71
Charges for using cannabis were the largest group of cannabis prosecutions. Thisgroup declined as a proportion of total charges from 62 percent in 1990 to 51 percentin 1998. The number of prosecutions for using cannabis increased between 1996 and1998. The number of prosecutions for such offences was 22 percent higher in 1998 thanin 1990.
The next largest group of cannabis offences involved dealing in cannabis. Prosecutionsin this category were between 28 percent and 33 percent of total cannabis prosecutions.The number of prosecutions for dealing in cannabis increased from 1990 to 1994 beforedecreasing in 1995. From 1996 the number then increased again. The number of chargesfor dealing in cannabis was higher in 1998 than in 1990.
The number of prosecutions for other cannabis offences showed a similar trend toprosecutions for dealing in cannabis.
Table 55 shows that the proportion of prosecutions for cannabis offences that resultin a conviction decreased from 82 percent in 1990 to 70 percent in 1998.
Table 54: Prosecutions for cannabis offences, by type of offence, 1990–98
Type of offence 1990 1991 1992 1993 1994 1995 1996 1997 1998
Use cannabis 7825 8082 7719 9154 9586 8150 7907 8838 9568
Deal in cannabis 3461 3921 4358 4574 5782 4972 4909 5439 5789
Other cannabis 1303 1479 1525 1998 2457 2191 2307 2600 3363
Total cannabis 12 589 13 482 13 602 15 726 17 825 15 313 15 123 16 877 18 720
Source: Ministry of Justice
Use cannabis
Deal in cannabis
Other cannabis
Total cannabis
1990 1991 1992 1993 1994 1995 1996 1997 1998
20000
16000
12000
8000
4000
0
Prosecutions
Figure 30: Prosecutions for cannabis offences, 1990–98Source: Ministry of Justice

72 New Zealand Drug Statistics
Convictions
Conviction information in this section is based on the number of cases finalised eachyear where the defendent was actually convicted. Because several charges may becombined into one case, the number of convictions is more than the number ofconvicted cases.
Table 56 shows that convictions for using cannabis were the largest group of cannabisoffences, although the proportion of cannabis offences that involve using cannabis hasbeen decreasing from 58 percent in 1990 to 45 percent in 1998. The next largest groupof cannabis offences was for dealing in cannabis. The number of convictions for dealingin cannabis increased from 1990 to 1994, before decreasing in 1995. In 1997 and 1998the number increased again. Other cannabis convictions showed a similar trend. Mostof those convicted of cannabis offences were males (about 85 percent per year).
Table 56: Convicted cases for cannabis offences by type of offence, 1990–98
Type of offence 1990 1991 1992 1993 1994 1995 1996 1997 1998
Use cannabis 3630 3584 3091 3890 3801 2927 2884 3046 3134
Deal in cannabis 2173 2310 2496 2781 2988 2462 2424 2695 2853
Other cannabis 491 558 585 800 865 728 645 721 1033
Total cannabis 6294 6452 6172 7471 7654 6117 5953 6462 7020
Source: Ministry of Justice
Table 55: Outcome of prosecutions for cannabis offences, 1990–98 (percentages in brackets)
Outcome ofprosecutions 1990 1991 1992 1993 1994 1995 1996 1997 1998
Convicted 10 329 10 649 10 548 12 384 13 340 10 834 10 591 11 911 13 120(82) (79) (78) (79) (75) (71) (70) (71) (70)
Youth Court 48 65 48 68 55 77 89 173 149proved (–) (1) (–) (–) (–) (1) (1) (1) (1)
S19 Discharge1 80 62 88 108 160 147 174 183 220(1) (1) (1) (1) (1) (1) (1) (1) (1)
Not proved 2132 2706 2918 3166 4270 4255 4269 4610 5231(17) (20) (22) (20) (24) (28) (28) (27) (28)
Total 12 589 13 482 13 602 15 726 17 825 15 313 15 123 16 877 18 720(100) (100) (100) (100) (100) (100) (100) (100) (100)
Note: ‘–’ = less than 0.5 percentSource: Ministry of Justice
1 Section 19 of the Criminal Justice Act 1985 allows a person who is found or pleads guilty to be discharged without a conviction beingrecorded. Such a discharge is deemed to be an acquittal.

New Zealand Drug Statistics 73
Between 1990 and 1995 most people convicted for cannabis offences were between20 and 24 years old. In 1996 the number of convictions for those in this age group andbetween 30 and 39 years old were almost the same. In 1997 and 1998 the largest numberof convictions were for those between 30 and 39 years old. The number of those 40 yearsold and older who were convicted of cannabis offences has shown an increasing trendfrom 241 in 1990 to 705 in 1998. This age group also made up an increasing proportionof cannabis convictions — 4 percent in 1990 and 10 percent in 1998 (see Table 58).
Table 57: Convicted cases for cannabis offences, by sex, 1990–98 (percentages in brackets)
1990 1991 1992 1993 1994 1995 1996 1997 1998
Male: 5360 5535 5258 6409 6493 5242 5023 5500 5989(85) (86) (85) (86) (85) (86) (84) (85) (85)
Female: 932 914 913 1060 1159 874 930 960 1030(15) (14) (15) (14) (15) (14) (16) (15) (15)
Unknown: 2 3 1 2 2 1 0 2 1(–) (–) (–) (–) (–) (–) (–) (–) (–)
Total: 6294 6452 6172 7471 7654 6117 5953 6462 7020(100) (100) (100) (100) (100) (100) (100) (100) (100)
Note: ‘–’ = less than 0.5 percentSource: Ministry of Justice
Table 58: Convicted cases for cannabis offences by age, 1990–98 (percentages in brackets)
Age 1990 1991 1992 1993 1994 1995 1996 1997 1998group
14–16 3 2 0 2 2 0 0 3 1(–) (–) (–) (–) (–) (–) (–) (–) (–)
17–19 1194 1003 879 952 928 783 803 952 933(19) (16) (14) (13) (12) (13) (14) (15) (13)
20–24 2076 2177 2009 2314 2249 1758 1614 1612 1701(33) (34) (33) (31) (29) (29) (27) (25) (24)
25–29 1441 1514 1525 1826 1876 1456 1413 1485 1564(23) (24) (25) (24) (25) (24) (24) (23) (22)
30–39 1337 1480 1433 1945 2056 1647 1637 1803 2115(21) (23) (23) (26) (27) (27) (28) (28) (30)
40+ 241 276 325 432 542 472 484 605 705(4) (4) (5) (6) (7) (8) (8) (9) (10)
Unknown 2 0 1 0 1 1 2 2 1(–) (–) (–) (–) (–) (–) (–) (–) (–)
Total 6294 6452 6172 7471 7654 6117 5953 6462 7020(100) (100) (100) (100) (100) (100) (100) (100) (100)
Note: ‘–’ less than 0.5 percentSource: Ministry of Justice

74 New Zealand Drug Statistics
Table 60: Convicted cases for cannabis offences, ethnicity, 1990–98 (percentages in brackets)
Ethnic group 1990 1991 1992 1993 1994 1995 1996 1997 1998
European 3859 3861 3794 4431 4443 3549 3210 3497 3809(61) (60) (62) (59) (58) (58) (54) (54) (54)
Mâori 2220 2377 2184 2801 2929 2358 2486 2690 2907(35) (37) (35) (38) (38) (39) (42) (42) (41)
Pacific peoples 147 158 145 175 181 160 193 199 218(2) (2) (2) (2) (2) (3) (3) (3) (3)
Other 29 20 16 23 45 19 18 42 41(1) (–) (–) (–) (1) (–) (–) (1) (1)
Unknown 39 36 33 41 56 31 46 34 45(1) (1) (1) (1) (1) (1) (1) (1) (1)
Total 6294 6452 6172 7471 7654 6117 5953 6462 7020(100) (100) (100) (100) (100) (100) (100) (100) (100)
Note: ‘–’ = less than 0.5 percentSource: Ministry of Justice
In 1998, more younger people were convicted of cannabis offences. Nearly six in 1000who were between 17 and 19 years old, and just over six in 1000 who were between 20and 24 years old, were convicted of such offences. However, the conviction rate forcannabis offences tended to decrease with age until less than one out of 1000 of thoseaged 40 years and older were convicted of such offences. Note that no rate has beenpresented for 14-to-16-year-olds, as the majority of these cases that are proven are in aYouth Court and are not recorded as convictions.
Table 59: Convictions for cannabis offences, age-specific rate per 1000 population over 16 years ofage, 1998
Total 17–19 20–24 25–29 30–39 40+
1.85 5.7 6.4 5.5 3.5 0.5
Source: Ministry of Justice
More people from the European ethnic group than from any other were convicted ofcannabis offences, although the proportion represented by this ethnic group hasdecreased from 61 percent of cannabis convictions in 1990 to 54 percent in 1998. Thenext largest group convicted of cannabis offences were from the Mâori ethnic group,who made up 35 percent of the cannabis offenders in 1990 and 41 percent in 1998. Theproportion of those convicted of cannabis offences who were from the Pacific peoplesethnic group was small, but has been gradually increasing (2 percent in 1990 and3 percent in 1998).

New Zealand Drug Statistics 75
Table 61: Convicted cases for cannabis offences, type of sentence, 1990–98 (percentages in brackets)
Type of sentence 1990 1991 1992 1993 1994 1995 1996 1997 1998
Custodial 401 381 413 397 483 393 398 522 505(6) (6) (7) (5) (6) (6) (7) (8) (7)
Periodic 1410 1526 1602 1888 1787 1305 1333 1385 1853Detention (22) (24) (26) (25) (23) (21) (22) (21) (26)
Community 20 41 34 34 31 23 24 21 11Programme (–) (1) (1) (1) (–) (–) (–) (–) (–)
Community 280 554 672 754 787 554 517 540 616Service (4) (9) (11) (10) (10) (9) (9) (8) (9)
Supervision 118 106 126 200 212 177 167 210 249(2) (2) (2) (3) (3) (3) (3) (3) (4)
Monetary 3932 3647 3045 3865 4007 3340 3216 3457 3349(63) (57) (49) (52) (52) (55) (54) (54) (48)
Deferment 75 119 156 183 151 168 130 130 163(1) (2) (3) (2) (2) (3) (2) (2) (2)
Other or no 58 78 124 150 196 157 168 197 274sentence (1) (1) (2) (2) (3) (3) (3) (3) (4)
Total 6294 6452 6172 7471 7654 6117 5953 6462 7020(100) (100) (100) (100) (100) (100) (100) (100) (100)
Note: ‘–’ = less than 0.5 percentSource: Ministry of Justice
Table 62: Convicted cases for cannabis offences, average length of custodial sentences (months),1990–98
1990 1991 1992 1993 1994 1995 1996 1997 1998
9.5 8.0 8.6 7.5 10.2 11.2 10.9 11.5 10.4
Source: Ministry of Justice
Monetary penalties were the most common type of sentence imposed for cannabisoffences. However, the proportion of cases that receive a monetary penalty hasdecreased from 63 percent in 1990 to 48 percent in 1998. Periodic detention was the nextmost common sentence and accounted for between 21 percent and 26 percent of thecases each year. The number of cases in the “other or no sentence” category has beenincreasing, from 58 in 1990 to 274 in 1998. (Most of these cases involve a conviction anddischarge.) This category has also increased as a proportion of the convicted cannabiscases from 1 percent in 1990 to 4 percent in 1998.
Each year between 5 and 8 percent of cannabis offences resulted in a custodialsentence being imposed. The average length of the custodial sentence varied from 7.5months in 1993 to 11.5 months in 1997 (Table 62).
76 New Zealand Drug Statistics
CANNABIS-RELATED MORTALITY
Cannabis-related conditions
The conditions that are used to define cannabis-related conditions as the underlyingcause of death are cannabis dependence syndrome, non-dependent abuse of cannabis,and drug psychoses with cannabis specified.
There were two deaths in the period 1990–96 where non-dependent abuse ofcannabis was the underlying cause of death. Both of these deaths were non-Mâori malesaged between 18 and 29. There is no defined toxicological level of cannabis that willcause death by poisoning, but in the case of these two deaths the coroner decided thatcannabis abuse was the underlying cause of death as the abuse led to death by othercauses. One of the deaths was due to inhalation of vomit into the lungs while under theinfluence of cannabis; the second was due to cardiomyopathy in association withtachycardia brought on by abuse of cannabis.
There were a further five deaths over the 1990–96 period where a mixed drugdependence or abuse was the underlying cause of death and cannabis was one of thedrugs involved. The other types of drugs that cannabis was consumed in combinationwith were opiates, hallucinogens, alcohol, and sedatives. The other drugs involved wereof greater toxicological significance, and so these deaths cannot be assumed as due solelyto cannabis.
Deaths due to external causes
This section examines deaths due to external causes where the deceased was reported tohave had cannabis in their blood at the time of the injury or poisoning (eg, falls, motorvehicle accidents, suicides) that led to their death. The recording of presence of cannabisis sourced from post-mortems, coroners’ findings, police reports, and other relevantinformation sources. It is not clear whether the person was intoxicated by cannabis atthe time of the injury or poisoning.
Table 63: Number and percentage of total in prison for cannabis offences, 1987–97
1987 1989 1991 1993 1995 1997
Number 120 135 1409 102 151 232
Percentage of sentenced inmates 4.4 4.4 3.7 2.7 3.7 5.9
Source: Ministry of Justice / Department of Corrections 1
Information from the census of prison inmates shows that between 2.7 and5.9 percent of sentenced prison inmates were in prison for cannabis offences.
1 Braybrook B, O’Neill R. 1988. A Census of Prison Inmates. Wellington: Policy and Research Division Branch, Department of Justice.Braybrook B. 1990. Census of Prison Inmates 1989. Wellington: Policy and Research Division Branch, Department of Justice.Braybrook B, Southey P. 1992. Census of Prison Inmates 1991. Wellington: Policy and Research Division Branch, Department of Justice.Southey P, Spier P, Edgar N. 1995. Census of Prison Inmates 1993. Wellington: Policy and Research Division Branch, Department of Justice.Lash B. 1996. Census of Prison Inmates 1995. Wellington: Ministry of Justice.Lash B. 1998. Census of Prison Inmates 1997. Wellington: Ministry of Justice.

New Zealand Drug Statistics 77
Table 64 shows the number of deaths due to external causes where cannabis wasdetected. There were 30 deaths of males due to external causes of injury and poisoningbetween the ages of 14 and 44 years where cannabis was reported as being in theirsystem. The seven deaths of females due to external causes of injury or poisoning wherecannabis was detected were restricted to the group aged 14 to 24 years. It is importantto note that not all deaths resulting from external causes have toxicology tests done andso the presence of cannabis will be underreported. These figures for possible cannabisinvolvement should be treated as indicative only.
Table 65: All publicly funded hospitalisations with a cannabis related condition or cannabis poisoning,by ethnicity, sex and year, numbers and rates, 1996–98
1996 1997 1998
No. Rate* No. Rate* No. Rate*
Mâori Total: 245 17.6 358 57.8 497 79.5
Male: 170 25.9 246 82.4 336 110.5
Female: 75 9.8 112 34.8 161 50.0
Non-Mâori Total: 307 10.1 599 19.7 716 23.9
Male: 215 14.0 426 27.5 535 35.7
Female: 92 6.2 173 12.0 181 12.2
Total Total: 552 11.1 957 25.8 1213 32.9
Male: 385 15.6 672 36.2 871 47.6
Female: 167 6.7 285 15.7 342 18.3
* Rates per 100 000 population, age-standardised to Segi’s world population.2
Source: New Zealand Health Information Service
CANNABIS-RELATED HOSPITALISATIONS
This section presents statistics on publicly funded hospitalisations where there was adiagnosis of a cannabis-related condition and/or poisoning by cannabis. Thehospitalisations are of inpatients and day patients only. (See the explanatory notes onpage 109 for further information about hospitalisation statistics.)
Table 65 presents figures for all publicly funded hospitalisations where one or morecannabis-related conditions were diagnosed or where cannabis poisoning was involved.
Table 64: Deaths due to external causes where cannabis is recorded as being in the blood of thedeceased, by age group at death and sex, 1990–96 combined
Total 0–13 14–17 18–24 25–29 30–34 35–39 40–44 45–49 50–54 55+
Male: 30 0 6 8 5 6 3 2 0 0 0
Female: 7 0 3 4 0 0 0 0 0 0 0
Total: 37 0 9 12 5 6 3 2 0 0 0
Source: New Zealand Health Information Service

78 New Zealand Drug Statistics
Over the three-year period from 1996 to 1998 there were 2722 publicly fundedhospitalisations that involved cannabis-related conditions and/or cannabis poisoningas the reason for admission or as an additional diagnosis. There has been a steady risein the total number of cannabis-related hospitalisations each year (552 in 1996, 1213 in1998), which is believed to be due to increased reporting of cannabis dependence andcannabis abuse as additional diagnoses. The result of this is that the figures for totalcannabis-related hospitalisations are not comparable over time.
Mâori made up 40 percent of all the hospitalisations from 1996 to 1998 involvingcannabis-related conditions and/or poisoning. Males made up 71 percent of totalcannabis-related hospitalisations.
The 1998 age-standardised hospitalisation rate for Mâori males (110.5 per 100 000population) was over three times greater than the rate for non-Mâori males (35.7 per100 000 population). The Mâori female hospitalisation rate in 1998 (50.0 per 100 000population) was less than half the Mâori male rate and over four times the non-Mâorifemale rate (12.2 per 100 000 population).
Cannabis-related principal diagnosis
The principal diagnosis is the condition that is established after investigation to be mostresponsible for the admission to hospital.
The number of hospitalisations where the principal diagnosis was a cannabis-relatedcondition has fluctuated over the period 1996 to 1998. The hospitalisation rate in 1996(3.7 per 100 000 population) rose to 5.5 per 100 000 population in 1997 before droppingto 4.5 per 100 000 population in 1998. Because of the relatively small numbers ofhospitalisations involved, these rates should be treated as indicative only.
The four conditions with the highest number of hospitalisations over the 1996 to1998 period are shown in Table 66. A drug psychosis was the condition with the highest
Table 66: Publicly funded hospitalisations with a cannabis-related principal diagnosis, numbers andrates, four leading diagnoses, 1996–98
1996 1997 1998
No. Rate* No. Rate* No. Rate*
All cannabis conditions 130 3.7 186 5.5 155 4.5
Drug psychoses59 1.6 91 2.5 93 2.7
(cannabis specified)
Drug dependence28 – 29 – 21 –
(cannabis specified)
Non-dependent abuse of24 – 29 – 19 –
drugs (cannabis specified)
Poisoning by psycho-16 – 32 1.2 19 –
dysleptics (cannabis specified)
Other 3 – 5 – 3 –
Note: ‘–’ = rate less than 1 per 100 000 population* Rates per 100 000 population, age-standardised to Segi’s world populationSource: New Zealand Health Information Service

New Zealand Drug Statistics 79
Table 67: Publicly funded hospitalisations involving cannabis poisoning, by circumstance of poisoning,1996–98
1996 1997 1998
No. Rate* No. Rate* No. Rate*
All (cannabis) external causes† 38 1.1 68 2.2 53 1.6
Accidental poisoning bypsychodysleptics (cannabis 31 1.0 62 2.0 44 1.4specified)
Psychotropic agents causingadverse effects in therapeutic 0 0.0 0 0.0 1 –use (cannabis specified)
Suicide and self-inflicted3 – 5 – 6 –
injury (cannabis specified)
Assault by poisoning 0 0.0 0 0.0 1 –
Poisoning by cannabis,undetermined whether
4 – 1 – 1 –accidentally or purposefullyinflicted
Note: ‘–’ = rate less than 1 per 100 000 population* Rates per 100 000 population, age-standardised to Segi’s world population† Note: may not equal sum of totals by cause as more than one external cause code can be recorded per eventSource: New Zealand Health Information Service
number of hospitalisations for 1996–98. The age-standardised hospitalisation rate fordrug psychoses has risen from 1.6 per 100 000 population in 1996 to 2.7 per 100 000population in 1998.
Cannabis poisoning
The following figures for cannabis poisoning are derived from the codes for externalcause of injury that are present on hospital discharge data in cases where an externalcause of injury (such as motor vehicle accidents) or poisoning has occurred (eitherleading to hospitalisation or occurring while hospitalised). Poisoning by cannabis is notattributed to an external cause of poisoning where the patient was using the drug forrecreational purposes or due to dependence. Accidental poisoning in this case meansaccidental ingestion of cannabis.
Table 67 shows the number of hospitalisations in 1996, 1997 and 1998 where thehospitalisation record specified that poisoning by cannabis was involved. These are notdiagnoses, but they describe the circumstances of the poisoning.
The most common circumstance was accidental poisoning by cannabis. This categoryaccounted for almost all cannabis poisonings.
Hospitals do not always provide clear or full descriptions of circumstances of injuryor poisoning, and cannabis involvement may not always be mentioned. The data shouldbe regarded as conservative counts and be treated as indicative only.
80 New Zealand Drug Statistics
Other illicit drugs
KEY FACTS
Use
• Opium and its derivatives had been tried by 4 percent of surveyed respondents in the1998 National Drug Survey, with 1 percent stating that they had used one or moreforms of this drug in the previous 12 months.
• Thirteen percent of National Drug Survey respondents in 1998 stated that they hadtried hallucinogens at some time. Five percent stated that they had used these drugsin the past 12 months. In the Regional Drugs Surveys, the percentage of 18-to-24-year-olds that had used LSD in the previous year grew from 5 percent in 1990 to 11 percentin 1998.
• Nine percent of respondents in the 1998 National Drugs Survey (11 percent of men,7 percent of women) had tried stimulants at some time. Three percent had usedstimulants in the last year.
Crime
• There were 2012 apprehensions in 2000 for offences related to illicit drugs other thancannabis. The number of prosecutions in 1998 was 1829, resulting in 1049 convictions.
Mortality
• There were 156 deaths in the period 1990–96 where opiate-related conditions orpoisonings were the underlying cause of death.
• There were two deaths between 1990 and 1996 where a hallucinogen (in combinationwith other drugs) was the underlying cause of death.
Hospitalisations
• Over the three-year period from 1996 to 1998 there were 3955 opiate-related publiclyfunded hospitalisations.
• Over the three-year period from 1996 to 1998 there were 343 hallucinogen-relatedpublicly funded hospitalisations.
• Over the three-year period from 1996 to 1998 there were 109 stimulant-relatedpublicly funded hospitalisations. Twenty-three of these were due to cocaine, with therest due to amphetamines.

New Zealand Drug Statistics 81
ILLICIT DRUGS AND CRIME
Information in this section reports on offending related to illicit drugs other thancannabis. Prosecution information in this section is based on the number of chargesfinalised each year.
Apprehensions
The number of apprehensions for illicit drugs other than those involving cannabisfluctuated over the 1994–2000 period, although there were increases for the last threeyears (Table 68). The figure of 2012 apprehensions in 2000 was the highest for thisperiod and represents a 46 percent increase since 1997. Males have consistently madeup about three-quarters of these apprehensions.
Table 68: Apprehensions of offenders with illicit drugs other than cannabis, by sex and year ofapprehension, numbers and percentages of total, 1994–2000 (percentages of total in brackets)
1994 1995 1996 1997 1998 1999 2000
Male: 1006 928 1089 1061 1077 1238 1525(77) (77) (76) (77) (73) (76) (76)
Female: 300 272 344 317 407 383 487(23) (23) (24) (23) (27) (14) (14)
Total: 1306 1200 1433 1378 1484 1621 2012(100) (100) (100) (100) (100) (100) (100)
Table 69: Apprehensions for offences related to illicit drugs other than cannabis, by age, numbers,1994–2000 (percentages of total in brackets)
Age 1994 1995 1996 1997 1998 1999 2000group
10–14 4 7 8 7 4 21 34(–) (1) (1) (1) (–) (1) (2)
15–19 148 157 191 235 179 228 321(11) (13) (13) (17) (12) (14) (16)
20–24 337 309 351 292 341 327 442(26) (26) (24) (21) (23) (20) (22)
25–29 330 259 356 303 329 363 407(25) (22) (25) (22) (22) (22) (20)
30–34 255 219 255 248 299 305 361(20) (18) (18) (18) (20) (13) (18)
35–39 135 133 185 156 195 202 230(10) (11) (13) (11) (13) (19) (11)
40+ 97 116 87 137 137 175 216(7) (10) (6) (10) (9) (11) (11)
Total 1306 1200 1433 1378 1484 1621 2012(100) (100) (100) (100) (100) (100) (100)
Percentages may not add to 100 owing to rounding. Note: ‘–’ = less than 0.5 percent.
Source: New Zealand Police

82 New Zealand Drug Statistics
Table 71: Prosecutions for drug offences other than cannabis, outcome, numbers by year,1990–98 (percentages in brackets)
Outcome ofprosecutions 1990 1991 1992 1993 1994 1995 1996 1997 1998
Convicted 978 906 894 855 860 960 1007 1101 1049(70) (67) (63) (64) (62) (57) (64) (53) (57)
Youth Court 2 3 0 3 1 3 1 3 2proved (–) (–) (–) (–) (–) (–) (–) (–) (–)
S19 discharge1 2 3 7 20 14 9 13 26 23(–) (–) (–) (2) (1) (1) (1) (1) (1)
Not proved 416 432 509 452 507 713 559 940 755(30) (32) (36) (34) (37) (42) (35) (45) (41)
Total 1398 1344 1410 1330 1382 1685 1580 2070 1829(100) (100) (100) (100) (100) (100) (100) (100) (100)
Percentages may not add to 100 owing to rounding. Note: ‘–’ = less than 0.5 percent. Source: Ministry of Justice
Table 70: Prosecutions for drug offences other than cannabis, by type, numbers and percentages oftotal by year, 1990–98 (percentages in brackets)
Type of offence 1990 1991 1992 1993 1994 1995 1996 1997 1998
Use other drugs 568 540 471 481 488 537 495 627 609(41) (40) (33) (36) (35) (32) (31) (30) (33)
Deal other drugs 540 547 664 616 664 860 817 1186 865(39) (41) (47) (46) (48) (51) (52) (57) (47)
Other drugs 290 257 275 233 230 288 268 257 355(21) (19) (20) (18) (17) (17) (17) (12) (19)
Total 1398 1344 1410 1330 1382 1685 1580 2070 1829(100) (100) (100) (100) (100) (100) (100) (100) (100)
Percentages may not add to 100 owing to rounding. Source: Ministry of Justice
Table 69 presents figures for apprehensions for offences involving illicit drugs otherthan cannabis, broken down according to age groups. It shows that the majority of allapprehensions for such offences are in the 20-to-34-year age group (55 to 71 percent).
Prosecutions
The number of prosecutions for drug offences other than cannabis offences has shownan increasing trend from 1398 in 1990 to 1829 in 1998 (Table 70). The greatest numberof prosecutions (2070) was in 1997. Most of the increase has come in the category ofdealing in drugs other than cannabis. This category has increased from 39 percent ofdrug offences other than cannabis offences in 1990 to 47 percent in 1998.
1 Section 19 of the Criminal Justice Act 1985 allows a person who is found or pleads guilty to be discharged without a conviction beingrecorded. Such a discharge is deemed to be an acquittal.
New Zealand Drug Statistics 83
A conviction is the most frequent outcome of a prosecution for drug offences otherthan cannabis offences. However, the proportion of prosecutions that result in aconviction decreased from 70 percent in 1990 to 57 percent in 1998 (Table 71). Therewas a corresponding increase in the proportion of prosecutions that resulted in a “notproved” outcome from 30 percent in 1990 to 41 percent in 1998.
Convictions
Conviction information in this section is based on the number of cases finalised eachyear. Because several charges may be combined into one case, the number of convictionsis more than the number of convicted cases.
The number of convictions for drug offences other than cannabis offences increasedslightly between 1990 and 1998, from 480 to 534. The greatest number of convictionswas in 1997, when there were 556 convictions. In most years between 1990 and 1998the two categories of using and dealing had similar numbers of convictions, and eachof these categories had more convictions than the “other drugs” category (Table 72).Table 73 shows that each year between 76 percent and 81 percent of people convictedof drug offences other than cannabis offences were male.
Table 72: Convicted cases for drug offences other than cannabis, type of offence, numbers by year,1990–98 (percentages in brackets)
Type of offence 1990 1991 1992 1993 1994 1995 1996 1997 1998
Use other drugs 190 194 164 188 192 213 207 235 198(40) (41) (35) (40) (40) (42) (38) (42) (37)
Deal other drugs 190 196 211 193 200 203 247 221 218(40) (41) (44) (41) (41) (40) (45) (40) (41)
Other drugs 100 86 101 91 93 91 91 100 118(21) (18) (21) (19) (19) (18) (17) (18) (22)
Total 480 476 476 472 485 507 545 556 534(100) (100) (100) (100) (100) (100) (100) (100) (100)
Percentages may not add to 100 owing to rounding. Source: Ministry of Justice
Table 73: Convicted cases for drug offences other than cannabis offences, numbers by sex and year,1990–98 (percentages in brackets)
1990 1991 1992 1993 1994 1995 1996 1997 1998
Male: 375 360 375 369 372 408 422 420 408(78) (76) (79) (78) (77) (81) (77) (76) (76)
Female: 105 116 101 103 113 99 123 136 126(22) (24) (21) (22) (23) (20) (23) (25) (24)
Total: 480 476 476 472 485 507 545 556 534(100) (100) (100) (100) (100) (100) (100) (100) (100)
Percentages may not add to 100 owing to rounding. Source: Ministry of Justice

84 New Zealand Drug Statistics
Table 74: Convicted cases for drug offences other than cannabis, numbers by age, 1990–98(percentages in brackets)
Age1990 1991 1992 1993 1994 1995 1996 1997 1998group
14–16 1 0 1 0 1 0 0 0 0(–) (–) (–) (–) (–) (–) (–) (–) (–)
17–19 46 32 36 38 31 42 34 46 30(10) (7) (8) (8) (6) (8) (6) (8) (6)
20–24 123 119 110 115 126 104 136 107 107(26) (25) (23) (24) (26) (21) (25) (19) (20)
25–29 142 126 123 125 127 131 128 126 125(30) (27) (26) (27) (26) (26) (24) (23) (23)
30–39 130 160 173 149 161 185 167 213 198(27) (34) (36) (32) (33) (37) (31) (38) (37)
40+ 38 39 32 45 39 45 80 64 74(8) (8) (7) (10) (8) (9) (15) (12) (14)
Unknown 0 0 1 0 0 0 0 0 0(–) (–) (–) (–) (–) (–) (–) (–) (–)
Total 480 476 476 472 485 507 545 556 534(100) (100) (100) (100) (100) (100) (100) (100) (100)
Percentages may not add to 100 owing to rounding.
Note: ‘–’ = less than 0.5 percent.
Source: Ministry of Justice
Each year most of those convicted of drug offences other than cannabis offences werebetween 20 and 39 years old. In 1990, 83 percent of the offenders, and in 1998, 80percent of the offenders, were in this age group (Table 74).
Most of those convicted of drug offences other than cannabis were European(Table 75). However, the proportion of European offenders decreased from 74 percentof drug offenders other than cannabis offenders in 1990 to 66 percent in 1998. Therewas a corresponding increasing trend in the proportion of Mâori offenders, from 21percent in 1990 to 28 percent in 1998.
In 1990 the most common sentence for drug offences other than cannabis offenceswas a custodial sentence, with 32 percent of convicted cases resulting in a custodialsentence (Table 76). By 1998, this proportion had decreased to 23 percent, and acustodial sentence was no longer the most frequently imposed sentence for suchoffences. In 1990 the next most common type of sentence was a monetary penalty with27 percent of drug offences other than cannabis offences receiving such a sentence.This proportion fluctuated between 19 percent and 30 percent, and by 1998 at 27percent was the most common type of sentence imposed. Periodic detention sentenceswere also common, and fluctuated between 19 percent and 28 percent of all drugoffences except cannabis offences.
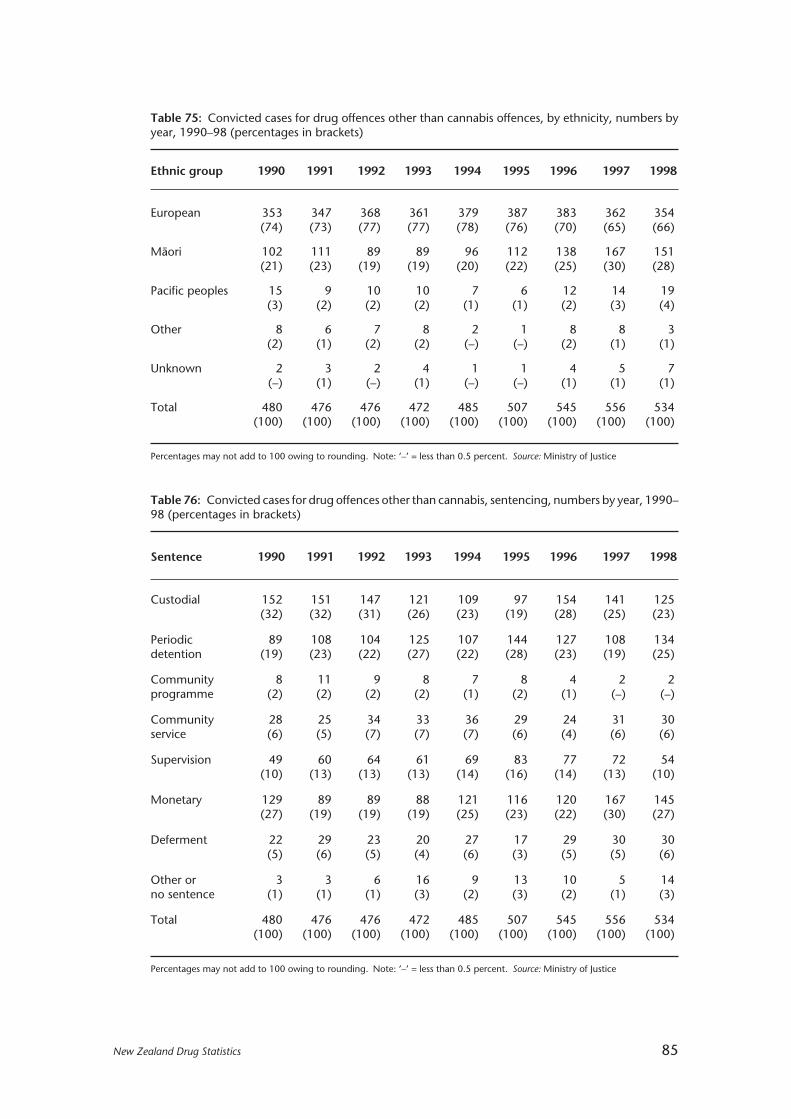
New Zealand Drug Statistics 85
Table 75: Convicted cases for drug offences other than cannabis offences, by ethnicity, numbers byyear, 1990–98 (percentages in brackets)
Ethnic group 1990 1991 1992 1993 1994 1995 1996 1997 1998
European 353 347 368 361 379 387 383 362 354(74) (73) (77) (77) (78) (76) (70) (65) (66)
Mâori 102 111 89 89 96 112 138 167 151(21) (23) (19) (19) (20) (22) (25) (30) (28)
Pacific peoples 15 9 10 10 7 6 12 14 19(3) (2) (2) (2) (1) (1) (2) (3) (4)
Other 8 6 7 8 2 1 8 8 3(2) (1) (2) (2) (–) (–) (2) (1) (1)
Unknown 2 3 2 4 1 1 4 5 7(–) (1) (–) (1) (–) (–) (1) (1) (1)
Total 480 476 476 472 485 507 545 556 534(100) (100) (100) (100) (100) (100) (100) (100) (100)
Percentages may not add to 100 owing to rounding. Note: ‘–’ = less than 0.5 percent. Source: Ministry of Justice
Table 76: Convicted cases for drug offences other than cannabis, sentencing, numbers by year, 1990–98 (percentages in brackets)
Sentence 1990 1991 1992 1993 1994 1995 1996 1997 1998
Custodial 152 151 147 121 109 97 154 141 125(32) (32) (31) (26) (23) (19) (28) (25) (23)
Periodic 89 108 104 125 107 144 127 108 134detention (19) (23) (22) (27) (22) (28) (23) (19) (25)
Community 8 11 9 8 7 8 4 2 2programme (2) (2) (2) (2) (1) (2) (1) (–) (–)
Community 28 25 34 33 36 29 24 31 30service (6) (5) (7) (7) (7) (6) (4) (6) (6)
Supervision 49 60 64 61 69 83 77 72 54(10) (13) (13) (13) (14) (16) (14) (13) (10)
Monetary 129 89 89 88 121 116 120 167 145(27) (19) (19) (19) (25) (23) (22) (30) (27)
Deferment 22 29 23 20 27 17 29 30 30(5) (6) (5) (4) (6) (3) (5) (5) (6)
Other or 3 3 6 16 9 13 10 5 14no sentence (1) (1) (1) (3) (2) (3) (2) (1) (3)
Total 480 476 476 472 485 507 545 556 534(100) (100) (100) (100) (100) (100) (100) (100) (100)
Percentages may not add to 100 owing to rounding. Note: ‘–’ = less than 0.5 percent. Source: Ministry of Justice
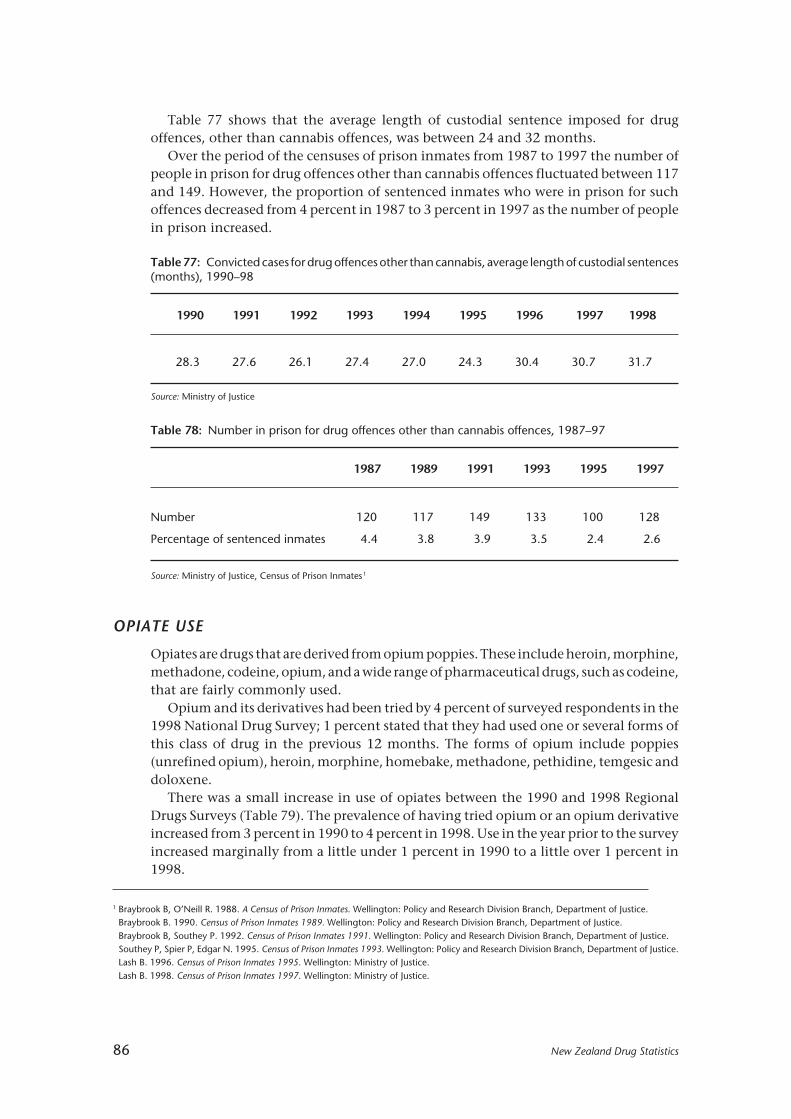
86 New Zealand Drug Statistics
Table 78: Number in prison for drug offences other than cannabis offences, 1987–97
1987 1989 1991 1993 1995 1997
Number 120 117 149 133 100 128
Percentage of sentenced inmates 4.4 3.8 3.9 3.5 2.4 2.6
Source: Ministry of Justice, Census of Prison Inmates1
1 Braybrook B, O’Neill R. 1988. A Census of Prison Inmates. Wellington: Policy and Research Division Branch, Department of Justice.Braybrook B. 1990. Census of Prison Inmates 1989. Wellington: Policy and Research Division Branch, Department of Justice.Braybrook B, Southey P. 1992. Census of Prison Inmates 1991. Wellington: Policy and Research Division Branch, Department of Justice.Southey P, Spier P, Edgar N. 1995. Census of Prison Inmates 1993. Wellington: Policy and Research Division Branch, Department of Justice.Lash B. 1996. Census of Prison Inmates 1995. Wellington: Ministry of Justice.Lash B. 1998. Census of Prison Inmates 1997. Wellington: Ministry of Justice.
Table 77 shows that the average length of custodial sentence imposed for drugoffences, other than cannabis offences, was between 24 and 32 months.
Over the period of the censuses of prison inmates from 1987 to 1997 the number ofpeople in prison for drug offences other than cannabis offences fluctuated between 117and 149. However, the proportion of sentenced inmates who were in prison for suchoffences decreased from 4 percent in 1987 to 3 percent in 1997 as the number of peoplein prison increased.
Table 77: Convicted cases for drug offences other than cannabis, average length of custodial sentences(months), 1990–98
1990 1991 1992 1993 1994 1995 1996 1997 1998
28.3 27.6 26.1 27.4 27.0 24.3 30.4 30.7 31.7
Source: Ministry of Justice
OPIATE USE
Opiates are drugs that are derived from opium poppies. These include heroin, morphine,methadone, codeine, opium, and a wide range of pharmaceutical drugs, such as codeine,that are fairly commonly used.
Opium and its derivatives had been tried by 4 percent of surveyed respondents in the1998 National Drug Survey; 1 percent stated that they had used one or several forms ofthis class of drug in the previous 12 months. The forms of opium include poppies(unrefined opium), heroin, morphine, homebake, methadone, pethidine, temgesic anddoloxene.
There was a small increase in use of opiates between the 1990 and 1998 RegionalDrugs Surveys (Table 79). The prevalence of having tried opium or an opium derivativeincreased from 3 percent in 1990 to 4 percent in 1998. Use in the year prior to the surveyincreased marginally from a little under 1 percent in 1990 to a little over 1 percent in1998.

New Zealand Drug Statistics 87
OPIATE-RELATED MORTALITY
Opiate-related conditions
The conditions that are used to define opiate-related conditions as the underlying causeof death are drug psychoses2 , opiate dependence syndrome, non-dependent abuse ofopiates, and poisoning by opiates. Poisoning by opiates includes adverse effects fromtherapeutic use, suicide, and accidental poisoning. Note that because of the relativelysmall numbers involved these figures should be taken as indicative only.
There were 156 deaths in the period 1990–96 where opiate-related conditions orpoisonings were the underlying cause of death. Figure 31 shows the deaths registeredeach year for males and females over the 1990–96 period. The figure for males increasedfrom 11 deaths (1990) to 29 deaths registered in 1996. For females, the increase was fromone death registered in 1990 to 11 deaths registered in 1996. The figure for males in 1996was over twice that for females.
Table 79: Usage levels of opiates, percentage of total sample, 1990 and 1998
Ever tried Used last year
1990 1998 1990 1998
Any opiates 3.0 4.1 0.7 1.3
Heroin 1.1 1.1 0.1 0.1
Homebake 0.7 1.2 0.3 0.5
Morphine 0.8 1.2 0.2 0.4
Poppies 1.1 1.9 0.2 0.5
Other opiates 1.4 0.9 0.2 0.3
Source: Alcohol and Public Health Research Unit, 1990 and 1998 Regional Drug Surveys1
1 Field A, Casswell S. 1999. Drug Use in New Zealand: Comparison Surveys 1990 and 1998. Auckland: Alcohol and Public Health Research Unit,University of Auckland. Table 8.3.
2 The category “drug psychoses” includes all drugs other than alcohol. These deaths are classified to opiates where the supplementary textfield specifies an opiate as the cause of the psychoses. The supplementary text field is used to provide further information regarding thecircumstances of death in cases where the classification does not adequately convey all relevant information.
Male Female
1990 1991 1992 1993 1994 1995 1996
25
30
20
15
10
5
0
No. of deaths
Year
Figure 31: Deaths due to opiate-related conditions, numbers, by sex and year, 1990–96
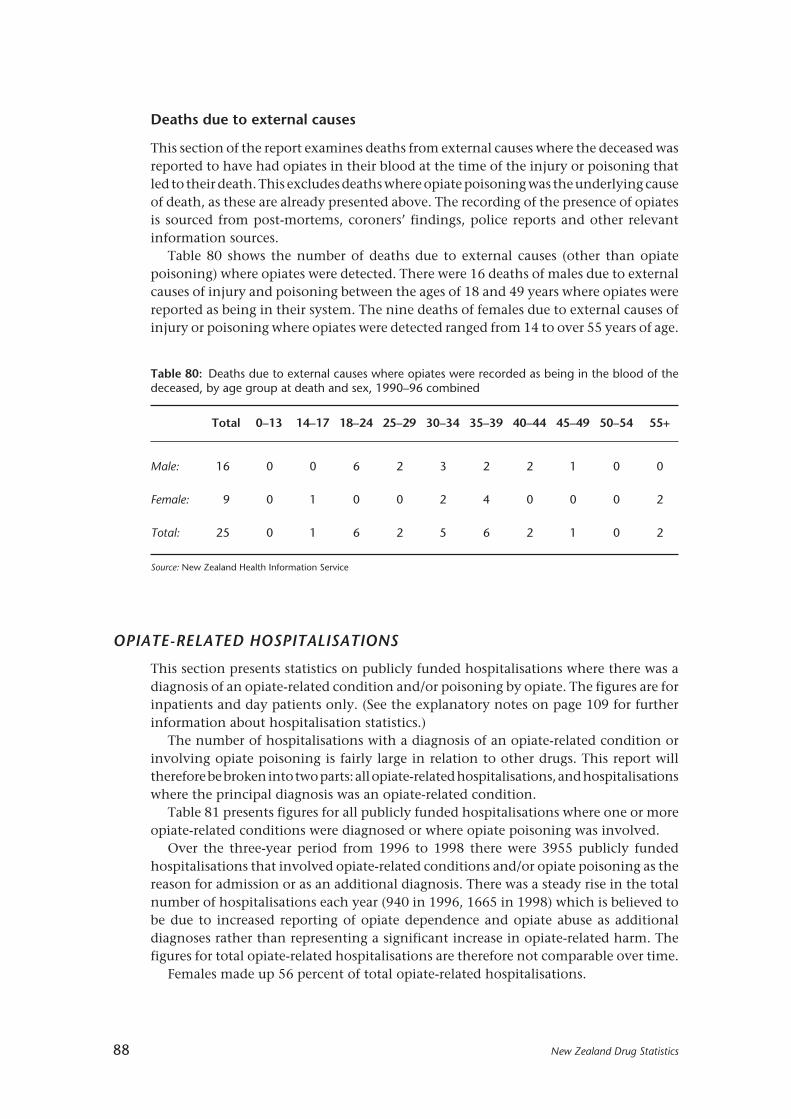
88 New Zealand Drug Statistics
Table 80: Deaths due to external causes where opiates were recorded as being in the blood of thedeceased, by age group at death and sex, 1990–96 combined
Total 0–13 14–17 18–24 25–29 30–34 35–39 40–44 45–49 50–54 55+
Male: 16 0 0 6 2 3 2 2 1 0 0
Female: 9 0 1 0 0 2 4 0 0 0 2
Total: 25 0 1 6 2 5 6 2 1 0 2
Source: New Zealand Health Information Service
Deaths due to external causes
This section of the report examines deaths from external causes where the deceased wasreported to have had opiates in their blood at the time of the injury or poisoning thatled to their death. This excludes deaths where opiate poisoning was the underlying causeof death, as these are already presented above. The recording of the presence of opiatesis sourced from post-mortems, coroners’ findings, police reports and other relevantinformation sources.
Table 80 shows the number of deaths due to external causes (other than opiatepoisoning) where opiates were detected. There were 16 deaths of males due to externalcauses of injury and poisoning between the ages of 18 and 49 years where opiates werereported as being in their system. The nine deaths of females due to external causes ofinjury or poisoning where opiates were detected ranged from 14 to over 55 years of age.
OPIATE-RELATED HOSPITALISATIONS
This section presents statistics on publicly funded hospitalisations where there was adiagnosis of an opiate-related condition and/or poisoning by opiate. The figures are forinpatients and day patients only. (See the explanatory notes on page 109 for furtherinformation about hospitalisation statistics.)
The number of hospitalisations with a diagnosis of an opiate-related condition orinvolving opiate poisoning is fairly large in relation to other drugs. This report willtherefore be broken into two parts: all opiate-related hospitalisations, and hospitalisationswhere the principal diagnosis was an opiate-related condition.
Table 81 presents figures for all publicly funded hospitalisations where one or moreopiate-related conditions were diagnosed or where opiate poisoning was involved.
Over the three-year period from 1996 to 1998 there were 3955 publicly fundedhospitalisations that involved opiate-related conditions and/or opiate poisoning as thereason for admission or as an additional diagnosis. There was a steady rise in the totalnumber of hospitalisations each year (940 in 1996, 1665 in 1998) which is believed tobe due to increased reporting of opiate dependence and opiate abuse as additionaldiagnoses rather than representing a significant increase in opiate-related harm. Thefigures for total opiate-related hospitalisations are therefore not comparable over time.
Females made up 56 percent of total opiate-related hospitalisations.

New Zealand Drug Statistics 89
Mâori made up 10 percent of all hospitalisations from 1996 to 1998 involving opiate-related conditions and/or poisoning.
The 1998 age-standardised hospitalisation rate for Mâori males (25.6 per 100 000population) was 27 percent less than the rate for non-Mâori males (35.2 per 100 000population). The Mâori female hospitalisation rate in 1998 (38.4 per 100 000 population)was 50 percent greater than the Mâori male rate but slightly lower than the non-Mâorifemale rate (43.5 per 100 000 population).
Opiate-related hospitalisations by age
The age group with the highest hospitalisation rates of Mâori males (48.4 per 100 000population) and non-Mâori males (72.8 per 100 000 population) was the 30-to-34-yearage group (Figure 32).
Table 81: All publicly funded hospitalisations with an opiate-related condition or poisoning, numbersand rates by ethnicity, sex and year, 1996–98
1996 1997 1998
No. Rate* No. Rate* No. Rate*
Mâori Male: 36 18.2 73 25.9 59 25.6
Female: 51 17.4 74 25.5 113 38.4
Total: 87 18.2 147 25.7 172 31.9
Non-Mâori Male: 400 22.3 511 27.4 658 35.2
Female: 453 24.9 692 36.6 835 43.5
Total: 853 23.5 1203 31.9 1493 39.3
Total Male: 436 21.9 584 27.5 717 33.3
Female: 504 22.9 766 34.9 948 42.9
Total: 940 22.3 1350 31.1 1665 38.0
*Rates per 100 000 population, age-standardised to Segi’s world populationSource: New Zealand Health Information Service
Figure 32: All publicly funded hospitalisations with an opiate-related condition or poisoning, average age-specific rates by ethnicity, sex and age, 1996–98 combined
0–13 14–17 18–24 25–29 30–34 35–39 40–44 45–49 50–54 55+
100
80
60
40
20
0
Rate per 100 000population
Age group
Mâori male Non-Mâori maleMâori female Non-Mâori female
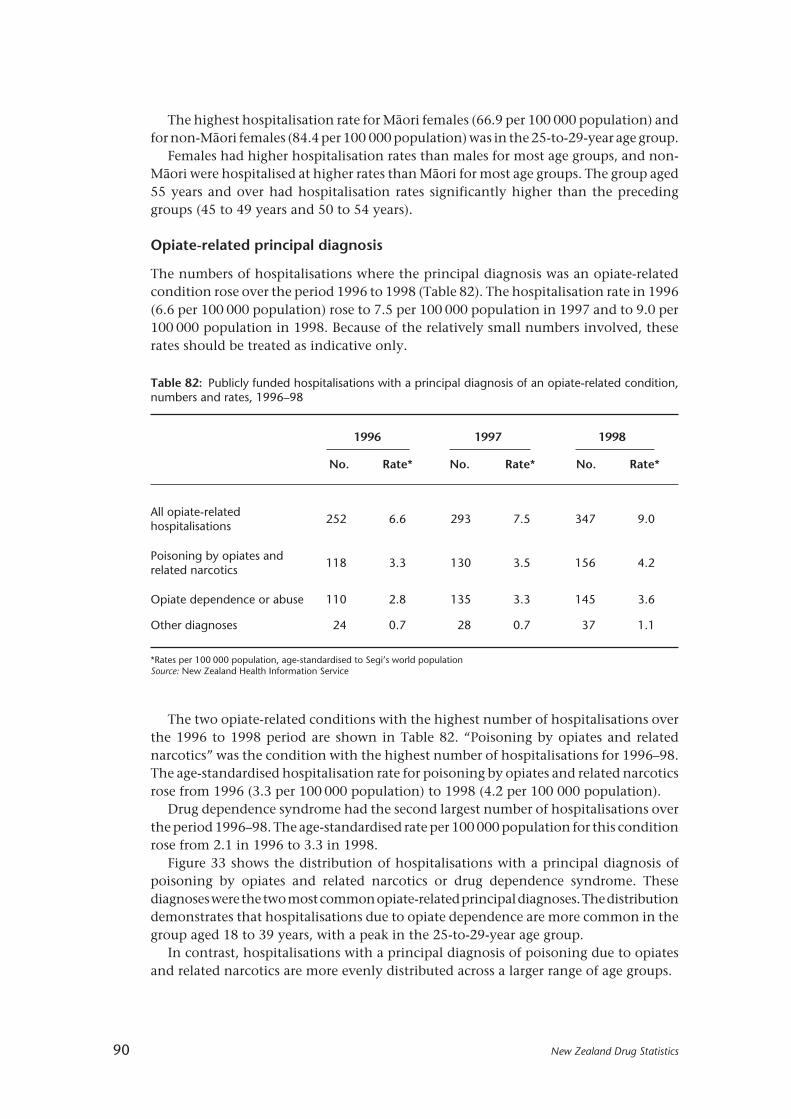
90 New Zealand Drug Statistics
Table 82: Publicly funded hospitalisations with a principal diagnosis of an opiate-related condition,numbers and rates, 1996–98
1996 1997 1998
No. Rate* No. Rate* No. Rate*
All opiate-relatedhospitalisations
252 6.6 293 7.5 347 9.0
Poisoning by opiates andrelated narcotics
118 3.3 130 3.5 156 4.2
Opiate dependence or abuse 110 2.8 135 3.3 145 3.6
Other diagnoses 24 0.7 28 0.7 37 1.1
*Rates per 100 000 population, age-standardised to Segi’s world populationSource: New Zealand Health Information Service
The highest hospitalisation rate for Mâori females (66.9 per 100 000 population) andfor non-Mâori females (84.4 per 100 000 population) was in the 25-to-29-year age group.
Females had higher hospitalisation rates than males for most age groups, and non-Mâori were hospitalised at higher rates than Mâori for most age groups. The group aged55 years and over had hospitalisation rates significantly higher than the precedinggroups (45 to 49 years and 50 to 54 years).
Opiate-related principal diagnosis
The numbers of hospitalisations where the principal diagnosis was an opiate-relatedcondition rose over the period 1996 to 1998 (Table 82). The hospitalisation rate in 1996(6.6 per 100 000 population) rose to 7.5 per 100 000 population in 1997 and to 9.0 per100 000 population in 1998. Because of the relatively small numbers involved, theserates should be treated as indicative only.
The two opiate-related conditions with the highest number of hospitalisations overthe 1996 to 1998 period are shown in Table 82. “Poisoning by opiates and relatednarcotics” was the condition with the highest number of hospitalisations for 1996–98.The age-standardised hospitalisation rate for poisoning by opiates and related narcoticsrose from 1996 (3.3 per 100 000 population) to 1998 (4.2 per 100 000 population).
Drug dependence syndrome had the second largest number of hospitalisations overthe period 1996–98. The age-standardised rate per 100 000 population for this conditionrose from 2.1 in 1996 to 3.3 in 1998.
Figure 33 shows the distribution of hospitalisations with a principal diagnosis ofpoisoning by opiates and related narcotics or drug dependence syndrome. Thesediagnoses were the two most common opiate-related principal diagnoses. The distributiondemonstrates that hospitalisations due to opiate dependence are more common in thegroup aged 18 to 39 years, with a peak in the 25-to-29-year age group.
In contrast, hospitalisations with a principal diagnosis of poisoning due to opiatesand related narcotics are more evenly distributed across a larger range of age groups.
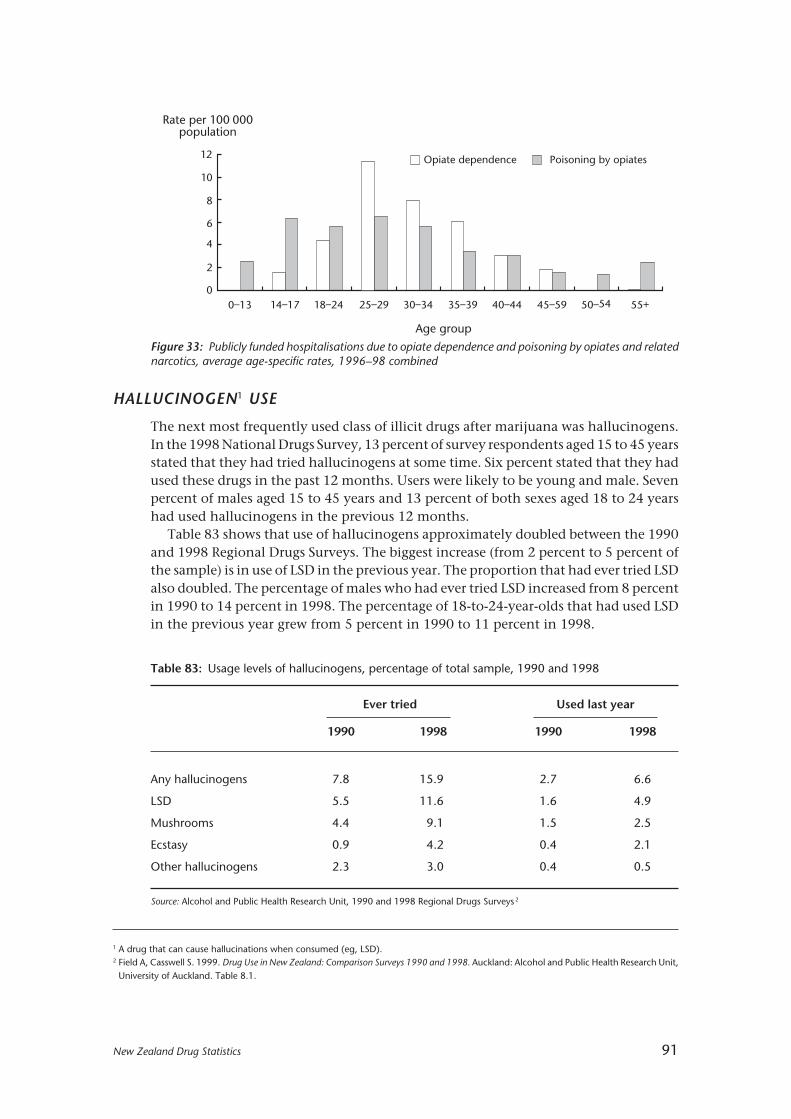
New Zealand Drug Statistics 91
HALLUCINOGEN1 USE
The next most frequently used class of illicit drugs after marijuana was hallucinogens.In the 1998 National Drugs Survey, 13 percent of survey respondents aged 15 to 45 yearsstated that they had tried hallucinogens at some time. Six percent stated that they hadused these drugs in the past 12 months. Users were likely to be young and male. Sevenpercent of males aged 15 to 45 years and 13 percent of both sexes aged 18 to 24 yearshad used hallucinogens in the previous 12 months.
Table 83 shows that use of hallucinogens approximately doubled between the 1990and 1998 Regional Drugs Surveys. The biggest increase (from 2 percent to 5 percent ofthe sample) is in use of LSD in the previous year. The proportion that had ever tried LSDalso doubled. The percentage of males who had ever tried LSD increased from 8 percentin 1990 to 14 percent in 1998. The percentage of 18-to-24-year-olds that had used LSDin the previous year grew from 5 percent in 1990 to 11 percent in 1998.
Figure 33: Publicly funded hospitalisations due to opiate dependence and poisoning by opiates and relatednarcotics, average age-specific rates, 1996–98 combined
0–13 14–17 18–24 25–29 30–34 35–39 40–44 45–59 50–54 55+
10
8
6
4
2
0
Rate per 100 000population
Age group
Opiate dependence Poisoning by opiates12
1 A drug that can cause hallucinations when consumed (eg, LSD).2 Field A, Casswell S. 1999. Drug Use in New Zealand: Comparison Surveys 1990 and 1998. Auckland: Alcohol and Public Health Research Unit,
University of Auckland. Table 8.1.
Table 83: Usage levels of hallucinogens, percentage of total sample, 1990 and 1998
Ever tried Used last year
1990 1998 1990 1998
Any hallucinogens 7.8 15.9 2.7 6.6
LSD 5.5 11.6 1.6 4.9
Mushrooms 4.4 9.1 1.5 2.5
Ecstasy 0.9 4.2 0.4 2.1
Other hallucinogens 2.3 3.0 0.4 0.5
Source: Alcohol and Public Health Research Unit, 1990 and 1998 Regional Drugs Surveys 2

92 New Zealand Drug Statistics
There were also increases in use of hallucinogenic mushrooms and of ecstasy. In 1990,1 percent of 18-to-24-year-olds had used ecstasy in the previous year; in 1998, 4 percenthad used ecstasy in the previous year.
HALLUCINOGEN-RELATED MORTALITY
Hallucinogen-related conditions
The conditions that are used to define hallucinogen-related conditions as the underlyingcause of death are drug psychoses1 , hallucinogen dependence syndrome, non-dependentabuse of hallucinogens, and poisoning by hallucinogens. There was one death of a malein the group aged 14 to 17 years in 1994 due to non-dependent abuse of hallucinogens.The hallucinogen involved was datura flowers. There were no other deaths in the1990–96 period where hallucinogens alone were the underlying cause of death.
There were two deaths (both males) in the period 1990–96 where a combined drugdependence or abuse (involving a hallucinogen) was the underlying cause of death. Inboth these cases cannabis was also consumed. One of these combination cases involvedmagic mushrooms with cannabis and alcohol. The other death involved LSD andcannabis.
External causes of death
This section of the report examines deaths due to external events where the deceased wasreported to have had hallucinogens in their blood at the time of the injury or poisoningthat led to their death. The recording of presence of hallucinogens is sourced from post-mortems, coroners’ findings, police reports and other relevant information sources.
There were four deaths in the period 1990–96 where a hallucinogen was detected orreported to have been consumed and may have contributed to the cause of death. Allfour of these deaths occurred in 1995 or 1996. Two of these deaths involved datura, theother two LSD. All four deaths were males aged between 14 and 29 years. The two deathsinvolving datura were both due to accidental drowning/submersion. One of the deathsinvolving LSD was a suicide by motor vehicle exhaust gas. The other was an accidentalfall with possible LSD involvement.
HALLUCINOGEN-RELATED HOSPITALISATIONS
The number of hospitalisations due to hallucinogen-related conditions or hallucinogenpoisoning is relatively small. For this reason no breakdown into principal diagnosis,additional diagnosis, or external cause of injury or poisoning categories has been done.
Table 84 presents figures for all discharges from hospital where one or morehallucinogen-related conditions were diagnosed or where hallucinogen poisoning wasinvolved.
Over the three-year period from 1996 to 1998 there were 343 publicly fundedhospitalisations that involved hallucinogen-related conditions and/or hallucinogenpoisoning as the reason for admission or as an additional diagnosis. The rise in the totalnumber of hospitalisations (92 in 1996, 128 in 1998) is believed to be due to increased
1 The category “drug psychoses” includes all drugs other than alcohol. These deaths are classified to hallucinogens where the supplementarytext field specifies a hallucinogen as the cause of the psychoses. The supplementary text field is used to provide further information regardingthe circumstances of death in cases where the classification does not adequately convey all relevant information.
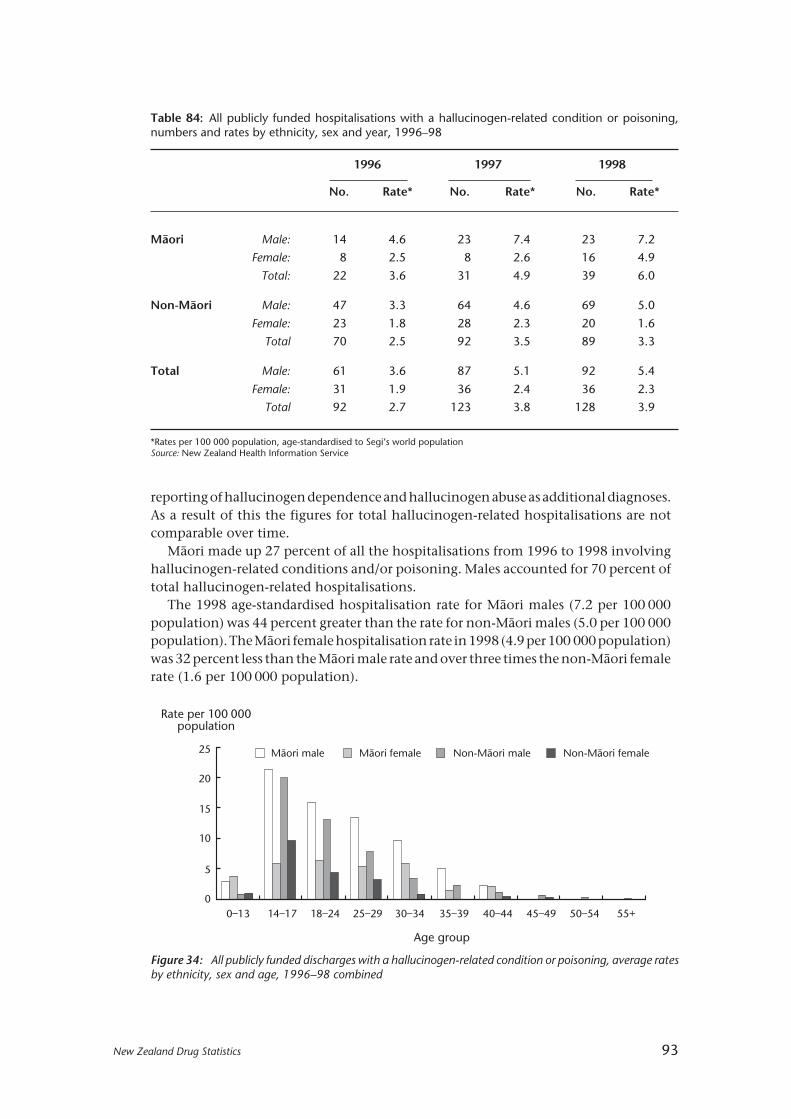
New Zealand Drug Statistics 93
Figure 34: All publicly funded discharges with a hallucinogen-related condition or poisoning, average ratesby ethnicity, sex and age, 1996–98 combined
Table 84: All publicly funded hospitalisations with a hallucinogen-related condition or poisoning,numbers and rates by ethnicity, sex and year, 1996–98
1996 1997 1998
No. Rate* No. Rate* No. Rate*
Mâori Male: 14 4.6 23 7.4 23 7.2
Female: 8 2.5 8 2.6 16 4.9
Total: 22 3.6 31 4.9 39 6.0
Non-Mâori Male: 47 3.3 64 4.6 69 5.0
Female: 23 1.8 28 2.3 20 1.6
Total 70 2.5 92 3.5 89 3.3
Total Male: 61 3.6 87 5.1 92 5.4
Female: 31 1.9 36 2.4 36 2.3
Total 92 2.7 123 3.8 128 3.9
*Rates per 100 000 population, age-standardised to Segi’s world populationSource: New Zealand Health Information Service
0–13 14–17 18–24 25–29 30–34 35–39 40–44 45–49 50–54 55+
25
20
15
10
5
0
Rate per 100 000population
Age group
Mâori male Non-Mâori maleMâori female Non-Mâori female
reporting of hallucinogen dependence and hallucinogen abuse as additional diagnoses.As a result of this the figures for total hallucinogen-related hospitalisations are notcomparable over time.
Mâori made up 27 percent of all the hospitalisations from 1996 to 1998 involvinghallucinogen-related conditions and/or poisoning. Males accounted for 70 percent oftotal hallucinogen-related hospitalisations.
The 1998 age-standardised hospitalisation rate for Mâori males (7.2 per 100 000population) was 44 percent greater than the rate for non-Mâori males (5.0 per 100 000population). The Mâori female hospitalisation rate in 1998 (4.9 per 100 000 population)was 32 percent less than the Mâori male rate and over three times the non-Mâori femalerate (1.6 per 100 000 population).

94 New Zealand Drug Statistics
Table 85: Usage levels of stimulants, percentage of total sample, 1990 and 1998
Ever tried Used in previous year
1990 1998 1990 1998
Any stimulants 5.0 11.0 1.6 4.2
Cocaine 2.6 4.4 0.4 1.1
Crack 0.5 0.8 0.2 0.2
Ice 0.1 0.3 0.0 0.1
Other stimulants 3.6 9.6 1.2 3.9
Source: Alcohol and Public Health Research Unit, 1990 and 1998 Regional Drugs Surveys 1
1 A drug that can stimulate/accelerate the central nervous system (brain, brainstem and spinal cord).2 Field A, Casswell S. 1999. Drug Use in New Zealand: Comparison Surveys 1990 and 1998. Auckland: Alcohol and Public Health Research Unit,
University of Auckland. Table 8.2.
Hallucinogen-related hospitalisations by age
The distribution of hospitalisations involving hallucinogen-related diagnoses or poisoningis concentrated in the younger age groups (Figure 34). The age group with the highesthospitalisation rates of Mâori males (21.5 per 100 000 population) and non-Mâori males(20.0 per 100 000 population) was the 14-to-17-year age group.
The highest hospitalisation rate for Mâori females was in the 18-to-24-year age group(6.4 per 100 000 population), whereas for non-Mâori females it was in the 14-to-17-yearage group (8.9 per 100 000 population).
Mâori had higher hospitalisation rates than non-Mâori for almost all age groups.
STIMULANT1 USE
In the 1998 National Drugs Survey, 9 percent of those surveyed (11 percent of men,7 percent of women) had used stimulants at some time. One subcategory of stimulantis cocaine. Fewer than 1 percent had used cocaine in the previous 12 months. Crack, avariant of cocaine, and ice, a form of methamphetamine, are also in use in New Zealandbut in 1998 were only used by a very small percentage (fewer than 1 percent) of people.Eight percent of respondents stated that they had used stimulants other than cocaineor methamphetamine, and 3 percent had used them in the past 12 months. Commonstimulants recorded in other surveys are amphetamines and diet pills.
The use of stimulants (including crack and cocaine) also increased in the 1990s. Theproportion who had tried any kind of stimulant increased by 6 percentage pointsbetween 1990 and 1998 to 11 percent having tried these drugs. Two percent of thesample stated in 1990 that they had been users in the previous year. By 1998 this hadrisen to 4 percent.
As shown in Table 85, the increase was mainly in the “other stimulants” category.This category includes amphetamines and some other substances. There was someincrease in use of cocaine, but little detectable change in use of crack and ice.

New Zealand Drug Statistics 95
STIMULANT-RELATED MORTALITY
There were no deaths over the period 1990–96 where a stimulant was recorded as theunderlying cause of death. There were no deaths due to external causes where astimulant (cocaine or amphetamine) was detected and recorded.
STIMULANT-RELATED HOSPITALISATIONS
This section presents statistics on publicly funded hospitalisations where there was adiagnosis of a stimulant-related condition and/or poisoning by a stimulant. Thehospitalisations are of inpatients and day patients only. See the explanatory notes onpage 109 for further information about hospitalisation statistics. Stimulants includecocaine and amphetamines (including “speed”).
The number of hospitalisations due to stimulant-related conditions or stimulantpoisoning is fairly small in relation to other drugs. For this reason all hospitalisations willbe looked at as one group with no breakdown into principal or additional diagnosis, orexternal causes of injury or poisoning.
Over the three-year period from 1996 to 1998 there were 109 publicly fundedhospitalisations that involved stimulant-related conditions and/or stimulant poisoningas the reason for admission or as a secondary diagnosis. There was a rise in the totalnumber of hospitalisations each year (18 in 1996, 46 in 1998) but because of the smallnumbers involved this should be treated as indicative only.
Mâori made up 14 percent of all hospitalisations from 1996 to 1998 involvingstimulant-related conditions and/or poisoning. Females made up 53 percent of totalstimulant-related hospitalisations.
Twenty-three of the 109 stimulant-related hospitalisations were due to cocaine, andthe rest were due to amphetamines.

96 New Zealand Drug Statistics
Other drugs
KEY FACTS
Use
• In the 1998 National Drug Survey, approximately 2 percent of those surveyed statedthat they had ever tried tranquillisers for recreational purposes, with a similarproportion having ever tried solvents. Fewer than 1 percent had used tranquillisersin the previous 12 months and fewer than 1 percent used solvents in the previous 12months.
• Of 994 sporting-related drug tests undertaken in the period from 1 July 1997 to 30June 1998, only 12 doping infractions were detected and only four competitors failedto provide samples.
• Seventy-one percent of top sports competitors have been tested at least once in theirhistory as competitors. Forty-four percent of competitors have been tested once in thelast 12 months.
Mortality
• There were 148 deaths in the period 1990 to 1996 where depressant-related conditionswere the underlying cause of death. Thirty-five of these deaths were specifically dueto solvents.
Hospitalisations
• Over the three-year period from 1996 to 1998 there were 9271 publicly fundedhospitalisations that involved depressant-related conditions and/or poisoning by adepressant as the reason for admission or as a secondary diagnosis. Of thesehospitalisations, 531 involved a solvent-related condition and/or poisoning.

New Zealand Drug Statistics 97
Table 86: Frequency of using licit and illicit drugs other than alcohol and tobacco, percentage of totalsample, 1998
Ever Previous 12 months Current
Marijuana 50 20 15
Any hallucinogens 13 6 4
Any stimulants 9 3 2
Kava 8 3 1
Any opiates 4 1 1
Tranquillisers 2 1 1
Solvents 2 <1 <1
Source: Alcohol and Public Health Research Unit, 1998 National Drug Survey2
1 Any drug that depresses the central nervous system (not to be confused with the psychological state of depression, as a depressant canincrease mood and decrease inhibitions).
2 Field, A, Casswell S. 1999. Drugs in New Zealand: National Survey, 1998. Auckland: Alcohol and Public Health Research Unit, University ofAuckland. Figures 6.1–6.6.
3 Field, A, Casswell S. 1999. Drug Use in New Zealand: Comparison Surveys, 1990 and1998. Auckland: Alcohol and Public Health Research Unit,University of Auckland. Table 8.4
Table 87: Usage levels of solvents, tranquillisers, and of hypodermic needles, percentages of totalsample, 1990 and 1998
Ever tried Used last year
1990 1998 1990 1998
Solvents 0.9 1.8 0.2 0.3
Tranquillisers 1.8 2.1 0.6 0.4
Hypodermics 0.9 1.1 0.1 0.1
Source: Alcohol and Public Health Research Unit, 1990 and 1998 Regional Drug Surveys3
DEPRESSANT 1 USE
The 1998 National Drug Survey showed that 22 percent of surveyed respondents(28 percent of men, 17 percent of women) had ever tried drugs other than alcohol,tobacco, or marijuana. Nine percent of respondents (12 percent of men, 6 percent ofwomen) had used these drugs in the previous 12 months. Figure 1 (page 6) shows relativeuse of licit and illicit drugs.
According to the drug survey, about 2 percent of those surveyed stated that they hadever tried tranquillisers for recreational purposes. Fewer than 1 percent had usedtranquillisers in the previous 12 months (Table 86).

98 New Zealand Drug Statistics
About 2 percent of the survey sample had ever tried solvents, and fewer than1 percent had used solvents in the previous 12 months.
Some classes of drug, particularly the opiates, are administered by hypodermicneedle. Only about 1 percent of respondents had ever taken drugs by this means.
Data from the 1990 and 1998 Regional Drug Surveys show that the proportion ofpeople who had ever tried solvents increased slightly in the 1990s, as shown in Table 87.Other changes in use were not statistically significant.
COMMUNITY CONCERNS ABOUT ILLICIT DRUGS AND SOLVENTS 1
How the community ranks illicit drug use as a problem is shown in Figure 35. This graphsuggests that illegal drugs other than marijuana were of about the same level of concernas was alcohol (page 22), and of higher concern than were marijuana (page 69) andtobacco. Unlike the concern about marijuana, tobacco and alcohol, which increasedbetween 1990 and 1998, concern about illegal drugs and solvents diminished over thisperiod.
Illegal drugs otherthan marijuana
SolventsStandardisedproblem scale
1990 1998
12.5
10.0
7.5
5.0
2.5
0.0
Figure 35: Perceived seriousness of illicit drugs and solvents use as a community problem, 1990 and 1998
Source: Alcohol and Public Health Research Unit, 1998 National Drug Survey 2
1 For example, petrol, LPG or glue.2 Field, A, Casswell S. 1999. Drugs in New Zealand: National Survey, 1998. Auckland: Alcohol and Public Health Research Unit, University of
Auckland. Figure 10.1.
DEPRESSANT-RELATED MORTALITY
Depressant-related conditions
The conditions that are used to define depressant-related conditions as the underlyingcause of death are drug psychoses, drug dependence, drug abuse, and poisoning(intentional and unintentional) by solvents, sedatives or tranquillisers.
Deaths of males due to depressant-related conditions declined from 18 deathsregistered in 1990 to 11 deaths registered in 1996. Female deaths due to depressant-related conditions in 1990 (five deaths) were less than one-third of the 1990 male figure.Female deaths due to depressant-related conditions fluctuated between 1991 (10 deaths)and 1996 (13 deaths), with seven deaths registered in 1994.
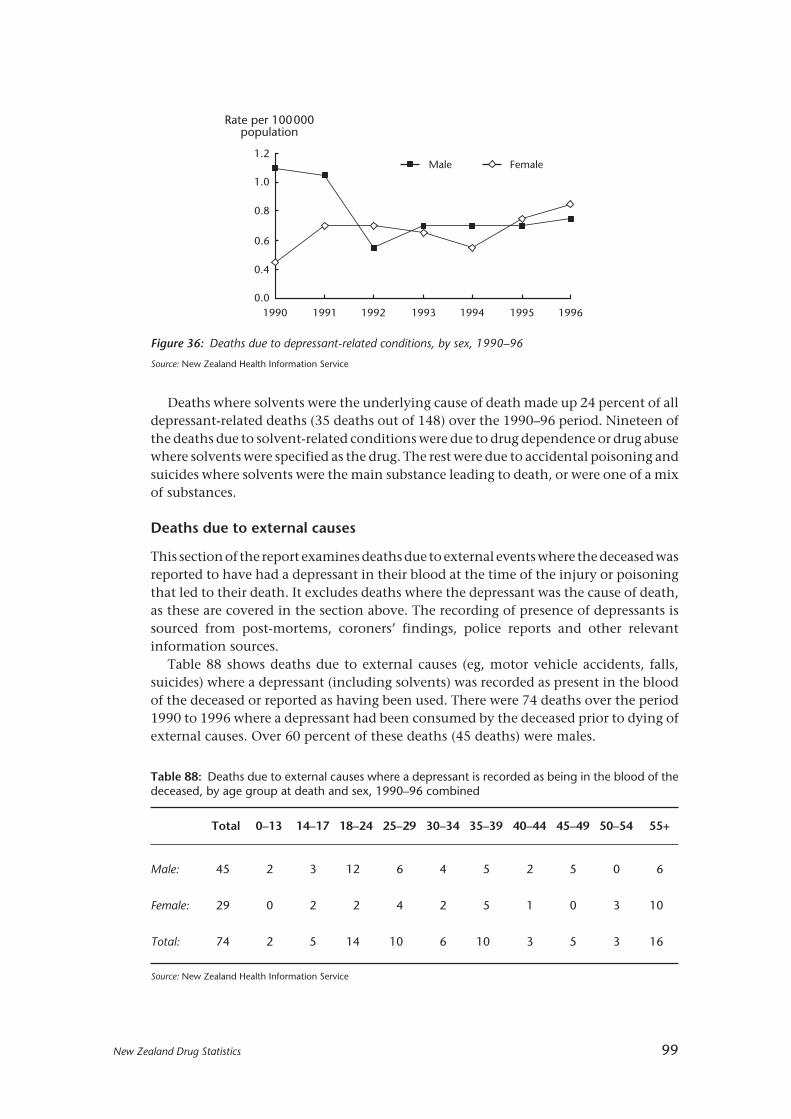
New Zealand Drug Statistics 99
Deaths where solvents were the underlying cause of death made up 24 percent of alldepressant-related deaths (35 deaths out of 148) over the 1990–96 period. Nineteen ofthe deaths due to solvent-related conditions were due to drug dependence or drug abusewhere solvents were specified as the drug. The rest were due to accidental poisoning andsuicides where solvents were the main substance leading to death, or were one of a mixof substances.
Deaths due to external causes
This section of the report examines deaths due to external events where the deceased wasreported to have had a depressant in their blood at the time of the injury or poisoningthat led to their death. It excludes deaths where the depressant was the cause of death,as these are covered in the section above. The recording of presence of depressants issourced from post-mortems, coroners’ findings, police reports and other relevantinformation sources.
Table 88 shows deaths due to external causes (eg, motor vehicle accidents, falls,suicides) where a depressant (including solvents) was recorded as present in the bloodof the deceased or reported as having been used. There were 74 deaths over the period1990 to 1996 where a depressant had been consumed by the deceased prior to dying ofexternal causes. Over 60 percent of these deaths (45 deaths) were males.
Figure 36: Deaths due to depressant-related conditions, by sex, 1990–96
Source: New Zealand Health Information Service
Table 88: Deaths due to external causes where a depressant is recorded as being in the blood of thedeceased, by age group at death and sex, 1990–96 combined
Total 0–13 14–17 18–24 25–29 30–34 35–39 40–44 45–49 50–54 55+
Male: 45 2 3 12 6 4 5 2 5 0 6
Female: 29 0 2 2 4 2 5 1 0 3 10
Total: 74 2 5 14 10 6 10 3 5 3 16
Source: New Zealand Health Information Service
Male Female
1990 1991 199419931992 1995 1996
1.2
1.0
0.8
0.6
0.4
0.0
Rate per 100000population
100 New Zealand Drug Statistics
Table 89: All publicly funded hospitalisations with a depressant-related condition or poisoning, byethnicity, sex and year, numbers and rates, 1996–98
1996 1997 1998
No. Rate* No. Rate* No. Rate*
Mâori Total: 370 67.8 415 71.8 452 76.4
Male: 149 80.2 172 62.3 191 67.7
Female: 221 54.6 243 80.7 261 84.9
Non-Mâori Total: 2432 70.3 2786 78.2 2816 77.1
Male: 914 56.1 981 57.3 1053 61.1
Female: 1518 84.0 1805 98.9 1763 92.7
Total Total: 2802 68.8 3201 77.9 3268 78.0
Male: 1063 59.7 1153 58.5 1244 62.7
Female: 1739 77.4 2048 97.0 2024 92.8
*Rates per 100 000 population, age-standardised to Segi’s world population.Source: New Zealand Health Information Service
There were 21 deaths due to external causes over the period 1990–96 where a solventhad been used by the deceased but was not the underlying cause of death. These deathshave been included in the figures for depressants above. Sixteen of these deaths were ofmales. Over 75 percent of these deaths where the presence of solvents was recorded werein the group aged 14 to 29 years.
DEPRESSANT-RELATED HOSPITALISATIONS
This section presents statistics on publicly funded hospitalisations where there was adiagnosis of a depressant-related condition and/or poisoning by a depressant. Thehospitalisations are for inpatients and day patients only. (See the explanatory notes onpage 109 for further information concerning hospitalisation statistics.) Depressants inthis report include solvents (eg, petrol, LPG, and glue), sedatives and tranquillisers.
Table 89 presents figures for all publicly funded hospitalisations where one or moredepressant-related conditions were diagnosed or where poisoning by a depressant wasinvolved.
Over the three-year period from 1996 to 1998 there were 9271 publicly fundedhospitalisations that involved depressant-related conditions and/or poisoning by adepressant as the reason for admission or as a secondary diagnosis.
Mâori made up 13 percent of all the hospitalisations from 1996 to 1998 involvingdepressant-related conditions and/or poisoning. For the total population, males madeup 37 percent of total depressant-related hospitalisations.
The 1998 age-standardised hospitalisation rate for Mâori males (67.7 per 100 000population) was 11 percent greater than the rate for non-Mâori males (61.1 per 100 000population).
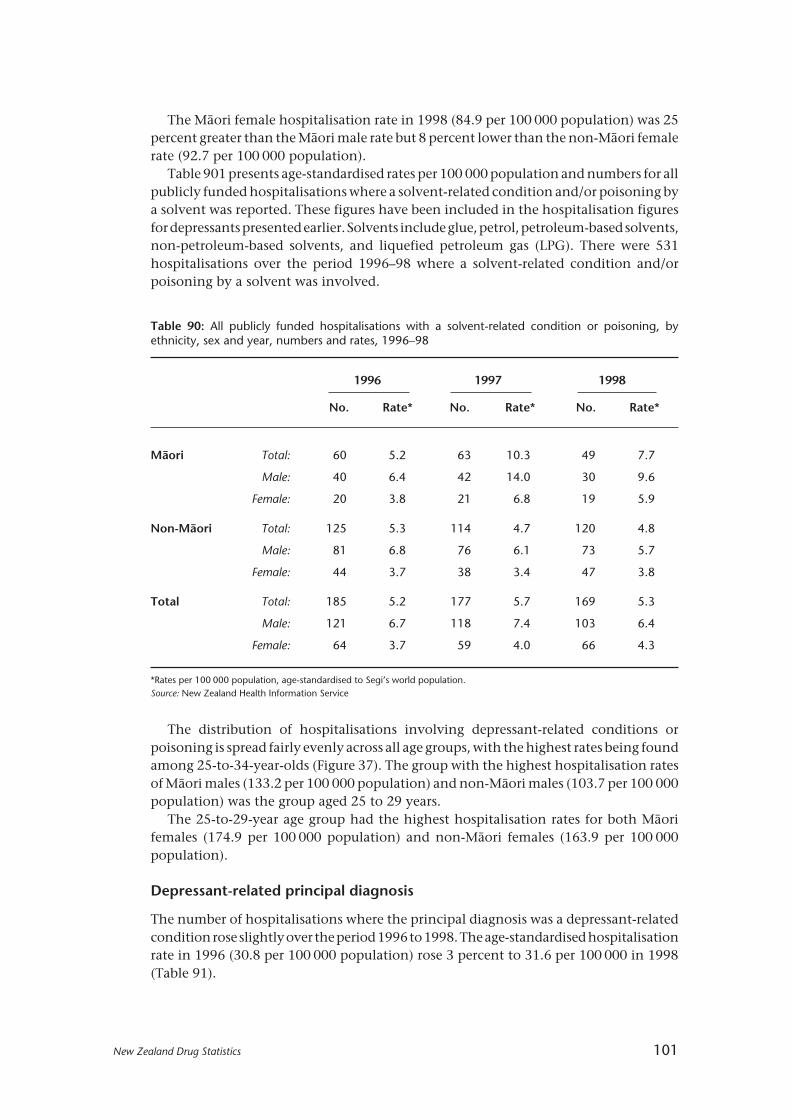
New Zealand Drug Statistics 101
Table 90: All publicly funded hospitalisations with a solvent-related condition or poisoning, byethnicity, sex and year, numbers and rates, 1996–98
1996 1997 1998
No. Rate* No. Rate* No. Rate*
Mâori Total: 60 5.2 63 10.3 49 7.7
Male: 40 6.4 42 14.0 30 9.6
Female: 20 3.8 21 6.8 19 5.9
Non-Mâori Total: 125 5.3 114 4.7 120 4.8
Male: 81 6.8 76 6.1 73 5.7
Female: 44 3.7 38 3.4 47 3.8
Total Total: 185 5.2 177 5.7 169 5.3
Male: 121 6.7 118 7.4 103 6.4
Female: 64 3.7 59 4.0 66 4.3
*Rates per 100 000 population, age-standardised to Segi’s world population.Source: New Zealand Health Information Service
The Mâori female hospitalisation rate in 1998 (84.9 per 100 000 population) was 25percent greater than the Mâori male rate but 8 percent lower than the non-Mâori femalerate (92.7 per 100 000 population).
Table 901 presents age-standardised rates per 100 000 population and numbers for allpublicly funded hospitalisations where a solvent-related condition and/or poisoning bya solvent was reported. These figures have been included in the hospitalisation figuresfor depressants presented earlier. Solvents include glue, petrol, petroleum-based solvents,non-petroleum-based solvents, and liquefied petroleum gas (LPG). There were 531hospitalisations over the period 1996–98 where a solvent-related condition and/orpoisoning by a solvent was involved.
The distribution of hospitalisations involving depressant-related conditions orpoisoning is spread fairly evenly across all age groups, with the highest rates being foundamong 25-to-34-year-olds (Figure 37). The group with the highest hospitalisation ratesof Mâori males (133.2 per 100 000 population) and non-Mâori males (103.7 per 100 000population) was the group aged 25 to 29 years.
The 25-to-29-year age group had the highest hospitalisation rates for both Mâorifemales (174.9 per 100 000 population) and non-Mâori females (163.9 per 100 000population).
Depressant-related principal diagnosis
The number of hospitalisations where the principal diagnosis was a depressant-relatedcondition rose slightly over the period 1996 to 1998. The age-standardised hospitalisationrate in 1996 (30.8 per 100 000 population) rose 3 percent to 31.6 per 100 000 in 1998(Table 91).

102 New Zealand Drug Statistics
Table 91: Publicly funded hospitalisations with a principal diagnosis of a depressant-related conditionor poisoning, numbers and rates, five leading diagnoses, 1996–98
1996 1997 1998
No. Rate* No. Rate* No. Rate*
All depressants 1124 30.8 1164 30.8 1206 31.6
Poisoning by tranquillisers 667 17.7 730 18.6 778 20.1
Poisoning by sedatives282 7.5 289 7.7 290 7.2
and hypnotics
Toxic effect of petroleum58 2.2 35 1.3 43 1.6
products
Toxic effect of solvents other51 1.9 45 1.6 37 1.4
than petroleum-based
Depressant abuse or48 1.1 39 0.9 32 0.7
dependence
Other 18 0.4 26 0.7 26 0.7
*Rates per 100 000 population, age-standardised to Segi’s world population
Source: New Zealand Health Information Service
The most common depressant-related principal diagnosis over this period waspoisoning by tranquillisers. Poisoning by sedatives and hypnotics was the second mostcommon diagnosis. Depressant abuse or dependence made up a fairly small proportionof hospitalisations for depressant-related conditions.
Figure 37: All publicly funded hospitalisations with a depressant-related condition or poisoning, by ethnicity,sex and age, 1998
Source: New Zealand Health Information Service
0–13 14–17 18–24 25–29 30–34 35–39 40–44 45–49 50–54 55+
200
Rate per 100 000population
Age group
Mâori male Non-Mâori maleMâori female Non-Mâori female
160
120
80
40
0
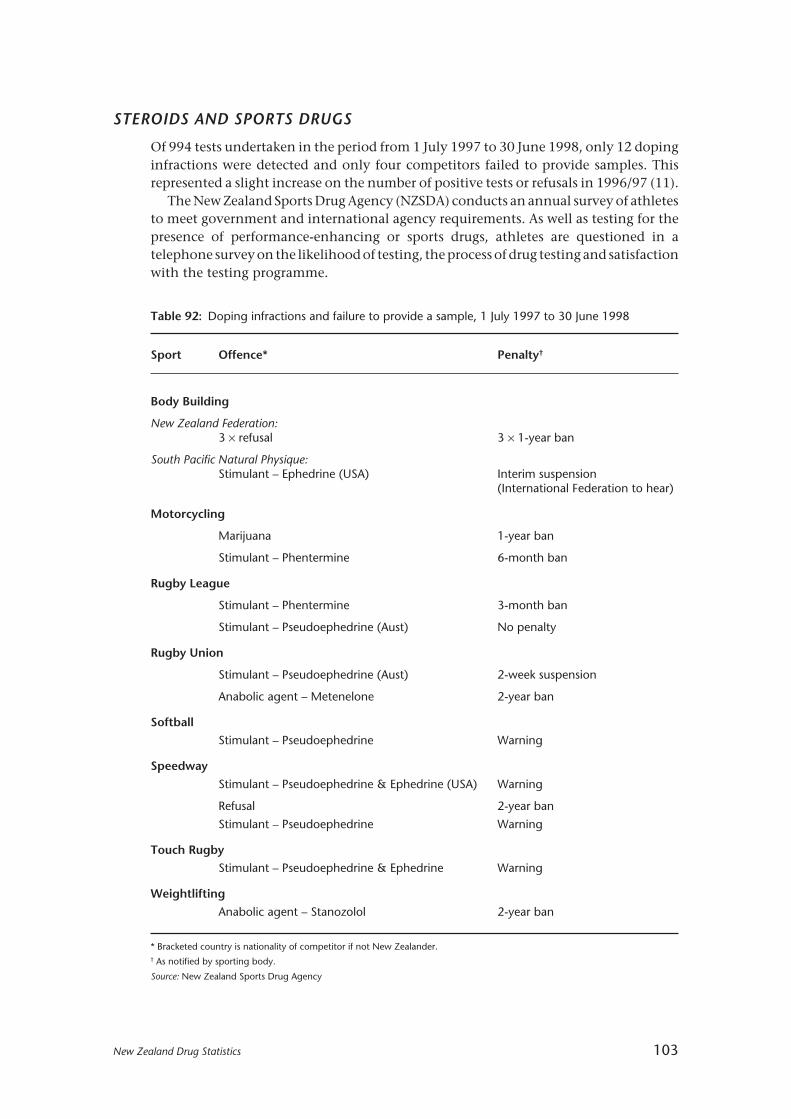
New Zealand Drug Statistics 103
Table 92: Doping infractions and failure to provide a sample, 1 July 1997 to 30 June 1998
Sport Offence* Penalty†
Body Building
New Zealand Federation:3 × refusal 3 × 1-year ban
South Pacific Natural Physique:Stimulant – Ephedrine (USA) Interim suspension
(International Federation to hear)
Motorcycling
Marijuana 1-year ban
Stimulant – Phentermine 6-month ban
Rugby League
Stimulant – Phentermine 3-month ban
Stimulant – Pseudoephedrine (Aust) No penalty
Rugby Union
Stimulant – Pseudoephedrine (Aust) 2-week suspension
Anabolic agent – Metenelone 2-year ban
Softball
Stimulant – Pseudoephedrine Warning
Speedway
Stimulant – Pseudoephedrine & Ephedrine (USA) Warning
Refusal 2-year ban
Stimulant – Pseudoephedrine Warning
Touch Rugby
Stimulant – Pseudoephedrine & Ephedrine Warning
Weightlifting
Anabolic agent – Stanozolol 2-year ban
* Bracketed country is nationality of competitor if not New Zealander.† As notified by sporting body.
Source: New Zealand Sports Drug Agency
STEROIDS AND SPORTS DRUGS
Of 994 tests undertaken in the period from 1 July 1997 to 30 June 1998, only 12 dopinginfractions were detected and only four competitors failed to provide samples. Thisrepresented a slight increase on the number of positive tests or refusals in 1996/97 (11).
The New Zealand Sports Drug Agency (NZSDA) conducts an annual survey of athletesto meet government and international agency requirements. As well as testing for thepresence of performance-enhancing or sports drugs, athletes are questioned in atelephone survey on the likelihood of testing, the process of drug testing and satisfactionwith the testing programme.

104 New Zealand Drug Statistics
Seventy-one percent of competitors had been tested at least once by the NZSDA intheir history as competitors as at June 1998. This represents a significant improvementon the number tested in the period to June 1997 (46 percent).
Approximately two-fifths (44 percent) of competitors were tested once in the periodJuly 1997 to June 1998, and 14 percent were tested twice or more.

New Zealand Drug Statistics 105
Explanatory notes
RATES
There are three main ways of calculating rates:
• Age-specific rates show the number of events as a proportion of the population in anage group in a particular year.
• Crude rates refer to the total number of events as a proportion of the total population.They do not adjust for differences in the age distribution of groups being compared.
• Age-standardised rates adjust for differences in the age distribution of the populationsbeing compared. They are calculated by multiplying the age-specific rates by astandard population. This allows for valid comparison of rates between differentpopulations (eg, Mâori/non-Mâori) and of the same population over time.
TOBACCO USE
Differences in definitions of tobacco smoking
Cigarette smoking (Census 1981, 1996), Health Survey 1996/97: Refers to the activesmoking of any tobacco products, including manufactured and hand-rolled cigarettes(excluding cigars, pipe tobacco and cigarillos). It does not include the smoking of anyother substances, such as herbal cigarettes or marijuana, but does include the smokingof home grown tobacco in cigarette form.
Cigarette smoking refers to active smoking and does not include passive smoking —the unintentional inhalation by non-smokers of tobacco smoke introduced into theatmosphere by smokers. The consumption of tobacco products by other means, such aschewing, is also excluded.Tobacco smoking (1992/93 Health Survey): The 1992/3 question asked, Q121, was:“Would you describe yourself as a tobacco smoker, an ex-smoker or a non-smoker?” Thisdefinition is not restricted to cigarette smoking.
Adjustment for age and sex
The figures for the Health Survey data are not adjusted for age and sex. Health surveysoften adjust for age because health status is strongly related to age, while health-riskbehaviours and health-related actions such as the use of health services are influencedby both age and sex. Therefore, when prevalence estimates for various sub-populationsare compared, the differences observed can (at least in part) be due to differences in ageand sex structures.
Seasonal effects in cigarettes and tobacco available for consumption
The cigarette and tobacco quarterly series are highly variable. This is due to the fact thatexcise on cigarettes and tobacco has been indexed to the rate of inflation on 1 Decembereach year since 1995 (before 1995 it was on a six-monthly basis). Thus there tends to bea larger volume of cigarettes and tobacco passed through Customs before the exciseincreases.

106 New Zealand Drug Statistics
ALCOHOL AND DRUG USE AND EFFECTS
Data sources
While some information on alcohol production and consumption can be obtained fromsources such as the Census of Population and Dwellings, the Household EconomicSurvey and production statistics, information on drinking behaviour comes fromspecialised sample surveys. These surveys have been conducted by the Alcohol andPublic Health Research Unit (APHRU) of the University of Auckland. In order to describedrinking behaviour in New Zealand, information has been drawn from the followingsurveys:
• 1995 National Alcohol Survey. This survey sampled 4232 people aged between 14and 65 years.
• 1998 National Drug Survey. This survey sampled 5475 people aged between 15 and45 years.
• Regional Drug Surveys. Surveys on alcohol, tobacco, marijuana and other drugs wereconducted in two regions — Auckland and Bay of Plenty — in 1990 and 1998. Thesesampled approximately 5000 people aged between 15 and 45 years.
• Annual Auckland Alcohol Surveys. These have been conducted every year since1990, and the latest year’s data available is 1998. They sample between 1000 and 1500people aged between 14 and 65 years.
• Surveys with Mâori. There have been two published reports:Te Ao Waipiro (1997). This was derived from the 512 Mâori interviewed in the 1995National Alcohol Survey. This survey made possible a separate analysis of Mâorialcohol consumption and publication of the results. Analysis is generally along thesame lines as for the general population, except that broader age groupings had to beused.Te Ao Taru Kino (2000). This report is based on two national samples of Mâori surveyedin 1998 — a sample of 446 Mâori from the 1998 National Drug Survey, and a separatesample of 1147 Mâori obtained through electoral roll information. When combined,the total number of Mâori interviewed was 1593. Te Ao Taru Kino discusses anddescribes Mâori use of drugs, including alcohol and tobacco.
• Surveys with Pacific peoples. The Annual Auckland Survey of alcohol consumptionalso allows a limited analysis of alcohol among Pacific peoples. A total of 760 Pacificpeoples have been interviewed since 1990. There is a sufficient number of cases foranalysis when they are aggregated, but there are insufficient for disaggregation by yearso as to analyse change over time. There is also insufficient data for analysis of Pacificpeoples’ use of drugs other than alcohol.
Survey methodology
All of the above surveys were conducted by computer-assisted telephone interviews(CATI). Household telephone numbers were selected using a stratified random-digitdialling method. Stratification was on a geographical basis, and census data was used todetermine relative sizes of these strata. For the New Zealand-wide surveys, the samplewas stratified into 32 geographical units based on both geographic regions and level ofurbanisation. For the Regional Drug Surveys, the sampling was apportioned betweenAuckland and Bay of Plenty. Telephone numbers were randomly selected by computerwithin these geographical strata. For the Annual Auckland Alcohol Survey, telephone

New Zealand Drug Statistics 107
numbers were randomly selected by computer from the free-calling Aucklandmetropolitan region. The exception to random-digit dialling was the methodology usedfor part of the 1998 Mâori sample. This identified Mâori by matching the electoral rollwith the telephone directory, and then sampled randomly within that frame. Moredetail about sampling methodology can be found in the appendices of Wyllie, Millardand Zhang1 and Field and Casswell2, and in Dacey and Moewaka Barnes3.
Standardisation of community concern
This information was obtained from the Regional Drugs Surveys — of the greaterAuckland area and the Bay of Plenty region — in 1990 and 1998. A scale from 1 for “nota problem” to 10 for “a serious problem” was used. While all respondents differentiatedbetween alcohol and other drugs in their level of concern, some respondents rated allof these substances towards the low end of the scale, while others rated all drugs towardsthe high end of the scale. For this reason, the level of response was standardised.
Analysis and transformation of data
Any changes over time or differences between population groups reported in the text arestatistically significant. Differences were examined using parametric or non-parametricstatistical tests as appropriate. All analysis was done with SAS software.
DRUGS AND CRIME
Source of information
The information on prosecutions and convictions was obtained from the Ministry ofJustice’s databases of charges and cases finalised in each year from 1990 to 1998. Theinformation for these databases was obtained from the Case Monitoring Subsystem ofthe Law Enforcement System (LES) of the former Wanganui Computer.
The information of those in prison was obtained from the biennial Census of PrisonInmates. Information for each census was obtained from the Custody/SupervisionSubsystem of LES, from prison records, and from interviews with inmates.
Charges and cases
Information on prosecutions is based on charges. However, information on convictionsis based on cases. Several charges for the same person were combined to form a case ifthey had the same first court hearing date or the same final court hearing date. Oneoffence was chosen to represent the case, and this was the offence that attracted the mostserious sentence. If several sentences were imposed for one case, information on themost serious offence is presented.
1 Wyllie A, Millard M, Zhang J-F. 1996. Drinking in New Zealand: A National Survey, 1995. Auckland: Alcohol and Public Health Research Unit,University of Auckland.
2 Field A, Casswell S. 1999. Drug Use in New Zealand: Comparison Surveys 1990 and 1998. Auckland: Alcohol and Public Health Research Unit,University of Auckland.
3 Dacey B, Moewaka Barnes H. 2000. Te Ao Taru Kino: Drug Use Among Mâori, 1998. Auckland: Whariki Mâori Health Research Group, Universityof Auckland.

108 New Zealand Drug Statistics
Outcome
The outcome of prosecutions include: proved charges involving young offenders whichare finalised in the Youth Court that are not recorded as convictions, discharge withoutconviction under Section 19 of the Criminal Justice Act 1985 after the offender is foundguilty or pleads guilty, and not proved charges where the charges were withdrawn,dismissed, discharged, struck out, not proceeded with or acquitted.
Ethnicity
The LES records the ethnicity for offenders in the categories of Caucasian, Mâori, PacificIsland, Negro, Indian, Asian, and Other. No allowance is made for offenders who wishto specify more than one ethnic group.
Type of offence
Cannabis offences are analysed in three categories: using cannabis, dealing in cannabisand other cannabis offences. The category “use cannabis” includes the use of cannabisand possession of cannabis other than for supply. Convictions for the importation,cultivation, or possession of cannabis for supply are included in the category “deal incannabis”. “Other cannabis” offences are mainly offences relating to the possession ofpipes or other drug-related utensils.
Offences for drugs other than cannabis are analysed in the same three categories:using, dealing, and other offences. The category “using” includes the use and possessionof drugs other than for supply. Convictions for the importation, cultivation, orpossession of drugs for supply are included in the category “dealing”. “Other drug”offences include the sale, manufacture, or importation of drugs.
MORTALITY INFORMATION
Source of information
Every death occurring in New Zealand is required to be registered within three days afterthe day of burial in a city or borough, or seven days in any other case. The New ZealandMortality Registry (maintained by the New Zealand Health Information Service)receives a copy of all death registrations in New Zealand, and this provides demographicdata relating to the deceased.
A copy of all death certificates is also received, as well as coroners’ findings, post-mortems, newspaper cuttings, police reports, and reports from various other organisationssuch as the Maritime Safety Authority. This information is used by the Mortality Registryto code the cause of death and any contributing factors.
Causes of death
The classification of causes of death used by the mortality registry is the AustralianVersion of the International Classification of Diseases, 9th Revision (2nd edition),Clinical Modification (World Health Organization ICD-9-CMA-II).
The selection of the cause of death in New Zealand, where more than one cause ofdeath is entered on a death certificate, is in accordance with the WHO Mortality Rulesfor Selection of the Underlying Cause of Death. This is largely determined from the
New Zealand Drug Statistics 109
statement of the certifying doctor, but reference is also made to all post-mortem reportsreceived and cancer registrations.
On some occasions hospital case summaries are compared with the entries on thedeath certificate. Information is also obtained from letters to certifying doctors,coroners’ records, the Land Transport Safety Authority, Water Safety New Zealand, andMedia Search.
Where the death is due to an external cause such as an accident or poisoning, it is theexternal cause and not the resulting injury that is coded as the cause of death. However,if the poisoning is the result of an overdose where the drug was taken for recreationalpurposes (drug abuse) or due to dependence, then the cause of death will be “non-dependent abuse of drugs” or “drug dependence syndrome”.
Deaths involving drugs
Some of the codes for dependence, abuse, or poisoning do not specify exactly what drugwas involved. In these cases the supplementary information field was examined toascertain the drug in question.
Deaths due to external causes that involved drugs were all determined by thespecification of a drug in the supplementary text field.
HOSPITALISATION INFORMATION
Source of data
The hospitalisation data reported in this publication was extracted from the NationalMinimum Dataset (NMDS) maintained by the New Zealand Health Information Service.The NMDS contains demographic and clinical data on all discharges of publicly fundedinpatients and day patients.
All hospitalisations with a discharge date in the years 1996 to 1998 and an alcohol-related or drug-related diagnosis or poisoning code were extracted. A number of theseconditions (eg, pancreatitis) were only potentially related to alcohol or drugs. If therecord also contained a diagnosis of alcohol or drug dependence or abuse, or alcohol ordrug poisoning, then the diagnosis was deemed to be due to alcohol or drugs. Also, thedescription that accompanied the code in the hospital discharge data was checked formention of alcohol or drugs as the cause of the condition. Some hospitals will manuallyoverride the automatically generated description to add in additional information inthis way.
It should be noted that these figures do not include outpatient or Accident andEmergency contacts with hospitals where the patient was not formally admitted. Theydo include transfers to other facilities and readmissions of the same person, and so arenot a count of individuals.
Type of data
The diagnosis and poisoning data reported to the NMDS by hospitals falls into threemain groups.
• Principal diagnosis. The principal diagnosis is the condition that was determined,after examination, to be chiefly responsible for the admission to hospital. Thisprincipal diagnosis may be a secondary condition to another condition. For example,

110 New Zealand Drug Statistics
a cancer sufferer may start suffering from anaemia as a result of the cancer ortreatment. If the anaemia is the reason the patient was admitted to hospital, then thiswill be coded as the principal diagnosis and the cancer will be coded as an additionaldiagnosis.
• Additional diagnosis. An additional diagnosis is a condition that was reported to theNMDS in addition to the principal diagnosis. These can be either a condition thatexisted in addition to the principal diagnosis or a condition that arose during the stayin hospital. Up to 24 additional diagnoses can be reported for each stay in hospital.
• External cause of poisoning. Every hospitalisation that involves a diagnosis that wasbrought on as a result of an external cause of injury or poisoning will contain anexternal-cause code. This external-cause code may relate to the principal diagnosis orto an additional diagnosis and may have occurred before the admission to hospitalor during the stay in hospital. These codes supply information regarding thecircumstances of the injury or poisoning (eg, motor vehicle crash, assault, suicide,self-inflicted poisoning). Poisoning by drugs or alcohol being used recreationally(abuse) or due to dependence do not have a code for external cause of poisoning —they are coded as a condition, using the appropriate code for alcohol or drug abuseor dependence.
Ethnicity
Hospital ethnicity data for the period used is based upon the concept of self-identification,with up to three ethnic groups able to be recorded. Prioritised ethnicity was used toanalyse hospitalisations by ethnic group.
CONTACT DETAILS
For further information, updated figures, or more specific details regarding the statisticspresented in this publication please contact the relevant organisation.
Ministry of HealthPhone: (04) 496 2000Fax: (04) 496 2340Post: PO Box 5013, WellingtonWeb sites: www.moh.govt.nz; www.ndp.govt.nz
New Zealand Health Information ServiceAnalytical Services UnitPhone: (04) 922 1800Fax: (04) 922 1897Post: PO Box 5013, WellingtonWeb site: www.nzhis.govt.nz
Alcohol Advisory Council of New ZealandPhone: (04) 472 0997Fax: (04) 473 0890Post: PO Box 5023, WellingtonWeb site: www.alcohol.org.nz

New Zealand Drug Statistics 111
Alcohol and Public Health Research UnitPhone: (09) 373 7524Fax: (09) 373 7057Post: University of Auckland,
Private Bag 92-019, AucklandWeb site: www.aphru.ac.nz
New Zealand Drug FoundationPhone: (04) 499 2920Fax: (04) 499 2925Post: PO Box 3082, WellingtonWeb site: www.nzdf.org.nz
Ministry of JusticePhone: (04) 494 9700Fax: (04) 494 9701Post: PO Box 180, WellingtonWeb site: www.justice.govt.nz
New Zealand PolicePhone: (04) 474 9499Fax: (04) 498 7400Post: PO Box 3017, WellingtonWeb site: www.police.govt.nz
Sports Drug AgencyPhone: (09) 521 5706Fax: (09) 521 5726Post: PO Box 18-339, Glen Innes, AucklandWeb site: www.nzsda.co.nz
Land Transport Safety AuthorityPhone: (04) 494 8600Fax: (04) 494 8601Post: PO Box 2840, WellingtonWeb site: www.ltsa.govt.nz
Water Safety New ZealandPhone: (04) 801 9600Fax: (04) 801 9599Post: PO Box 10-126, WellingtonWeb site: www.watersafety.org.nz

112 New Zealand Drug Statistics


