Tirado, R. GRL-TN-10-2007 Greenpeace Research Laboratories Technical Note 10/2007 November 2007 Nitrates in drinking water in the Philippines and Thailand Reyes Tirado, Greenpeace Research Laboratories Technical Note 10/2007 November 2007 Table of Contents INTRODUCTION 4 SAMPLING DESIGN AND METHODS 5 Sampling locations in the Philippines 5 Sampling locations in Thailand 6 Sampling and testing methods 8 RESULTS AND DISCUSSION 9 Water pollution with nitrates in the Philippines 9 Water pollution with nitrates in Thailand 11 Heavy fertilizer use and water pollution with nitrates 13 Human health risks associated with nitrate pollution 13 Excess nitrogen fertilizer also contributes to climate change 15 It is possible to produce food and keep both a healthy livelihood and environment 15 Greenpeace demands 15 REFERENCES 16 APPENDIX: TABLE 3. 18 Data collected in the field by Reyes Tirado and Daniel Ocampo, Roda Angeles, Nori Tolibas, Jong Baloloy and Totoy Quijano (in the Phiilppines), and Nat Ewasakul and Top Sak (in Thailand). Greenpeace South East Asia.
Transcript
Tirado, R. GRL-TN-10-2007 Greenpeace Research Laboratories Technical Note 10/2007 November 2007
Nitrates in drinking water in the Philippines and Thailand
Reyes Tirado, Greenpeace Research Laboratories Technical Note 10/2007
November 2007
Table of Contents
INTRODUCTION 4
SAMPLING DESIGN AND METHODS 5 Sampling locations in the Philippines 5 Sampling locations in Thailand 6 Sampling and testing methods 8
RESULTS AND DISCUSSION 9 Water pollution with nitrates in the Philippines 9 Water pollution with nitrates in Thailand 11 Heavy fertilizer use and water pollution with nitrates 13 Human health risks associated with nitrate pollution 13 Excess nitrogen fertilizer also contributes to climate change 15 It is possible to produce food and keep both a healthy livelihood and environment 15 Greenpeace demands 15
REFERENCES 16
APPENDIX: TABLE 3. 18
Data collected in the field by Reyes Tirado and Daniel Ocampo, Roda Angeles, Nori Tolibas, Jong Baloloy and
Totoy Quijano (in the Phiilppines), and Nat Ewasakul and Top Sak (in Thailand). Greenpeace South East Asia.
GRL-TN-10-2007 2
Executive Summary
Today, over 1.1 billion people worldwide lack access to safe drinking water. In Asia alone,
inadequate water supply and poor sanitation cause more than 500,000 infant deaths a year.
Intensive agricultural practices present a direct threat to the world’s clean water supply.
Excess application of nitrogen fertilizers in intensive crop production is leading to nitrate
pollution of the artesian wells that people use for drinking water. Away from agricultural
areas, nitrogen loading also leads to toxic algal blooms and loss of coral and fish species in
aquatic ecosystems. Drinking water with high levels of nitrate can cause serious health
problems, especially for children.
Nitrogen fertilizer consumption in Asia has grown dramatically, increasing approximately
17-fold in the last 40 years. Fertilizer application rates are increasing rapidly in some
developing countries, reaching excess amounts that the crops cannot use but cause problems
for human health and the environment. In Thailand, for example, in asparagus fields in
Nakhon Pathom province the application rates of nitrogen fertilizers reach 1000 kg N ha-1
year-1. Shockingly, the crop recovers only 5% of this nitrogen and the rest is lost to the soil,
water or air.
We investigated the nitrate levels in drinking water and their relation with nitrogen fertilizer
use in several farming areas in the Philippines and Thailand. We surveyed some examples of
crops and farming practices in different regions and tested nitrate levels in water from wells
and streams around farms.
Drinking water from artesian wells in agricultural areas in the Philippines and Thailand
shows evidence of pollution with nitrates, and this pollution correlates with intensive farming
practices where nitrogen fertilisers are applied in excess.
Drinking water from 30% of all groundwater wells sampled in both countries showed
nitrates levels above the World Heath Organization safety limit of 50 mg l-1 of nitrate
(NO3-). This nitrate pollution was highest in the most intensive crops, with nitrate levels
3 times the WHO safety limit (>150 mg l-1) in asparagus farms in Kanchanaburi,
Thailand. Groundwater wells in vegetable farming areas in Benguet, the ‘salad bowl’ of
the Philippines, were also polluted with nitrates levels above WHO limits.
GRL-TN-10-2007 3
As confirmed by our results, groundwater nitrate contamination is common in areas where
farmers use large quantities of nitrogen fertilizers. Babies and infants living around
agricultural areas and who drink water from wells are the most vulnerable to health risks
from nitrates. Additionally, anyone drinking from a contaminated well could be vulnerable to
the long-term effects of nitrates, such as various types of cancer.
Some of the excess nitrogen applied to soils is transformed to the gas nitrous oxide. Nitrous
oxide is an important greenhouse gas with 296 times the global warming potential of CO2.
Besides the effect of fertilizers applied to soils in nitrous oxide emissions, synthetic fertilizers
are also an important source of CO2 emissions. Fertilizer production is a very energy
intensive process and emits up to 1.2% of all global greenhouse emissions.
Greenpeace believes it is possible to produce food and at the same time keep both a healthy
livelihood and environment. There are many examples, especially in developing countries,
where farmers maintain high yields from their land in biologically and biodiversity-based
systems that ensure both a healthy livelihood and environment.
Greenpeace demands clean and safe drinking water for all. The dangerous practice of over-
using fertilizers in intensive agriculture is a serious threat to human health and the
environment and must be stopped. Governments should phase out subsidies for fertilizers and
implement fertilizer reduction policies to reduce nitrogen losses. Experiences in other
countries show that fertilizer reduction policies significantly contribute to a cleaner and safer
drinking water supply.
GRL-TN-10-2007 4
Introduction Today, over 1.1 billion people worldwide lack access to safe drinking water (Prasad 2006). In
Asia alone, inadequate water supply and poor sanitation cause more than 500,000 infant
deaths a year (UNEP 2002). Intensive agricultural practices present a direct threat to the
world’s clean water supply. Water quality around agricultural areas is decreasing, primarily
due the leaching of fertilizers and pesticides (Scanlon et al. 2007). Nitrogen loading from
intensive crop production is leading to toxic algal blooms and loss of coral and fish species in
aquatic ecosystems. Nitrogen lost from farm soils also accumulates in groundwater and
pollutes the artesian wells that people use for drinking water. Drinking water with high levels
of nitrate can cause serious health problems, especially for children (Camargo and Alonso
2006). In the past 40 years, there has been a 700% increase in global fertilizer use, and this is
one of the main drivers of water degradation (Foley et al. 2005).
As nitrogen application rates increase, so do nitrogen losses to the environment. In intensive
agriculture, half (or more) of the fertilizer applied to the soil generally does not stay on the
soil to help crops grow, but rather is lost via water and air to adjacent ecosystems where it
can fundamentally change the way those ecosystems function. Worldwide it is estimated that
cereal production only uses 33% of the nitrogen applied as fertilizer. The remaining 67%
represents a $15.9 billion annual loss of nitrogen fertilizer that escapes into the environment
through surface runoff, volatilization, leaching, plant emissions and soil denitrification (Raun
and Johnson 1999).
Nitrogen fertilizer consumption in Asia has grown dramatically, increasing approximately
17-fold in the last 40 years (Dobermann and Cassman 2004). Average fertilizer application
rates in the Philippines and Thailand are relatively low compared to more industrialized
countries (in 2005: the Philippines 70 kg ha-1, Thailand 101 kg ha-1, USA 113 kg ha-1, China
321 kg ha-1, the Netherlands 382 kg ha-1 -source FAO STAT). However, averages can be
misleading since application rates vary very much among regions, crops, and farming
practices, and rates are increasing rapidly in some developing countries. In China for
example, in some intensive vegetable growing areas fertilizer application rates exceed 1000
kg of N ha-1; rates reach 2000 kg ha-1 for flowers (Zhang et al 2004). It is usually believed
that fertiliser use is low in the Philippines and Thailand, as represented by average estimates,
but there is some evidence of increased consumption of fertilizers in highly intensified
farming systems. In asparagus fields in Nakhon Pathom province, Thailand, farmers apply
GRL-TN-10-2007 5
nitrogen fertilizers in rates close to 1000 kg N ha-1 year-1. Shockingly, only 5% of this
nitrogen is recovered by the plant, the rest being lost to the soil, water or air (Phupaibul et al.
2004).
As an initial study on the current status of the effect of agricultural practices in water quality
in the Philippines and Thailand, we investigated the nitrate levels in drinking water in several
farming areas in these countries. We surveyed some examples of crops and farming practices
in different regions in the Philippines and Thailand, and tested nitrate levels in water from
wells and streams around farms.
Sampling design and methods
A total of 49 groundwater samples and 14 surface water samples from different agricultural
regions in the Philippines (Northern and Central Luzon) and Thailand (Northwest and Central
Plain) were tested.
Sampling locations in the Philippines
We selected two agricultural regions in the island of Luzón in the Philippines, Benguet and
Bulacán provinces, to use as case studies of the effect of agricultural practices on water
pollution with nitrates.
We selected one sampling area in the Benguet province (Northern Luzon), where vegetables
for the Metro Manila markets are produced. The Benguet province is in the Cordillera
Administrative Region, and it includes an extensive area of upland mountain terraces
dedicated to commercial vegetable farming. Much of Benguet, which has come to be known
as the "salad bowl" of the Philippines, is now given over to intensive cultivation of vegetables
(Peterson 1994).
In Benguet province we selected two municipalities, Atok and Buguias, where the main land
use is vegetable farming, and a third municipality, La Trinidad, which is mostly urban
residential and densely populated (Table 1). In the municipalities of Atok and Buguias
vegetable farming is the main land use and also the main economic activity of the local
population. Vegetable production is used both for self-subsistence and income generation.
The main crops grown in these two municipalities are cabbage, carrot, potatoes, and celery.
GRL-TN-10-2007 6
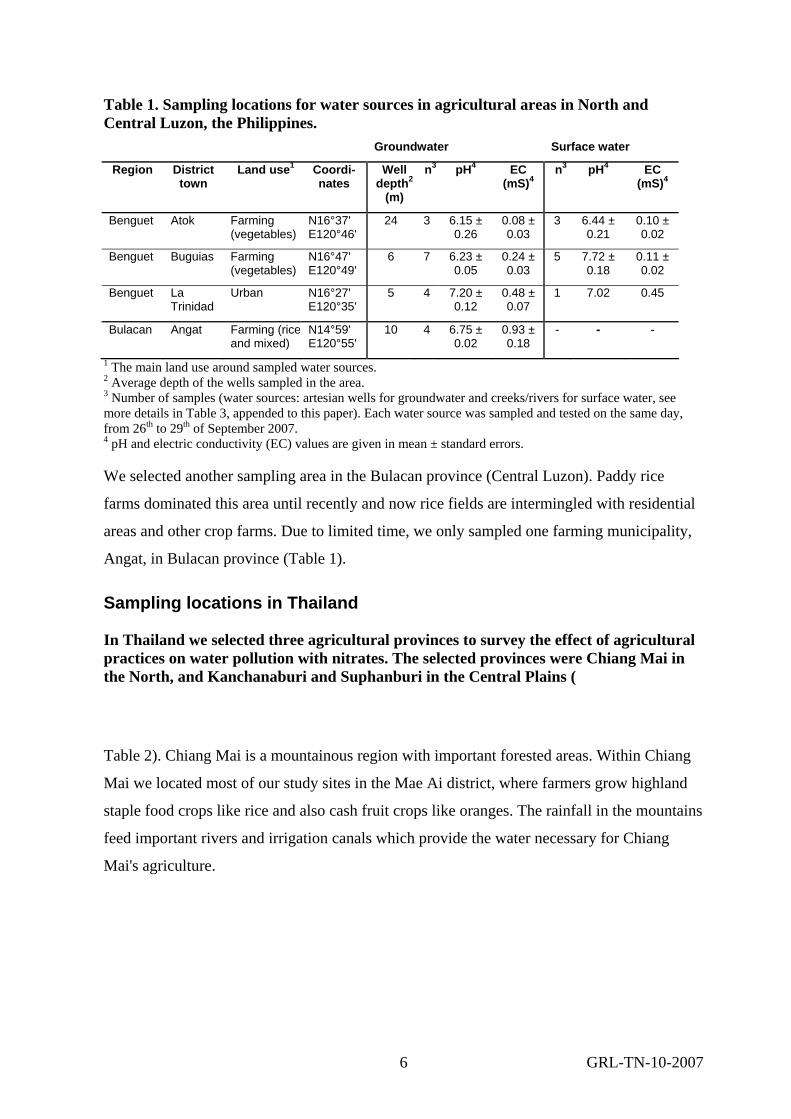
Table 1. Sampling locations for water sources in agricultural areas in North and Central Luzon, the Philippines. Groundwater Surface water
Region District town
Land use1 Coordi-nates
Well depth2
(m)
n3 pH4 EC (mS)4
n3 pH4 EC (mS)4
Benguet Atok Farming (vegetables)
N16°37' E120°46'
24 3 6.15 ± 0.26
0.08 ± 0.03
3 6.44 ± 0.21
0.10 ± 0.02
Benguet Buguias Farming (vegetables)
N16°47' E120°49'
6 7 6.23 ± 0.05
0.24 ± 0.03
5 7.72 ± 0.18
0.11 ± 0.02
Benguet La Trinidad
Urban N16°27' E120°35'
5 4 7.20 ± 0.12
0.48 ± 0.07
1 7.02 0.45
Bulacan Angat Farming (rice and mixed)
N14°59' E120°55'
10 4 6.75 ± 0.02
0.93 ± 0.18
- - -
1 The main land use around sampled water sources. 2 Average depth of the wells sampled in the area. 3 Number of samples (water sources: artesian wells for groundwater and creeks/rivers for surface water, see more details in Table 3, appended to this paper). Each water source was sampled and tested on the same day, from 26th to 29th of September 2007. 4 pH and electric conductivity (EC) values are given in mean ± standard errors. We selected another sampling area in the Bulacan province (Central Luzon). Paddy rice
farms dominated this area until recently and now rice fields are intermingled with residential
areas and other crop farms. Due to limited time, we only sampled one farming municipality,
Angat, in Bulacan province (Table 1).
Sampling locations in Thailand
In Thailand we selected three agricultural provinces to survey the effect of agricultural practices on water pollution with nitrates. The selected provinces were Chiang Mai in the North, and Kanchanaburi and Suphanburi in the Central Plains (
Table 2). Chiang Mai is a mountainous region with important forested areas. Within Chiang
Mai we located most of our study sites in the Mae Ai district, where farmers grow highland
staple food crops like rice and also cash fruit crops like oranges. The rainfall in the mountains
feed important rivers and irrigation canals which provide the water necessary for Chiang
Mai's agriculture.
GRL-TN-10-2007 7
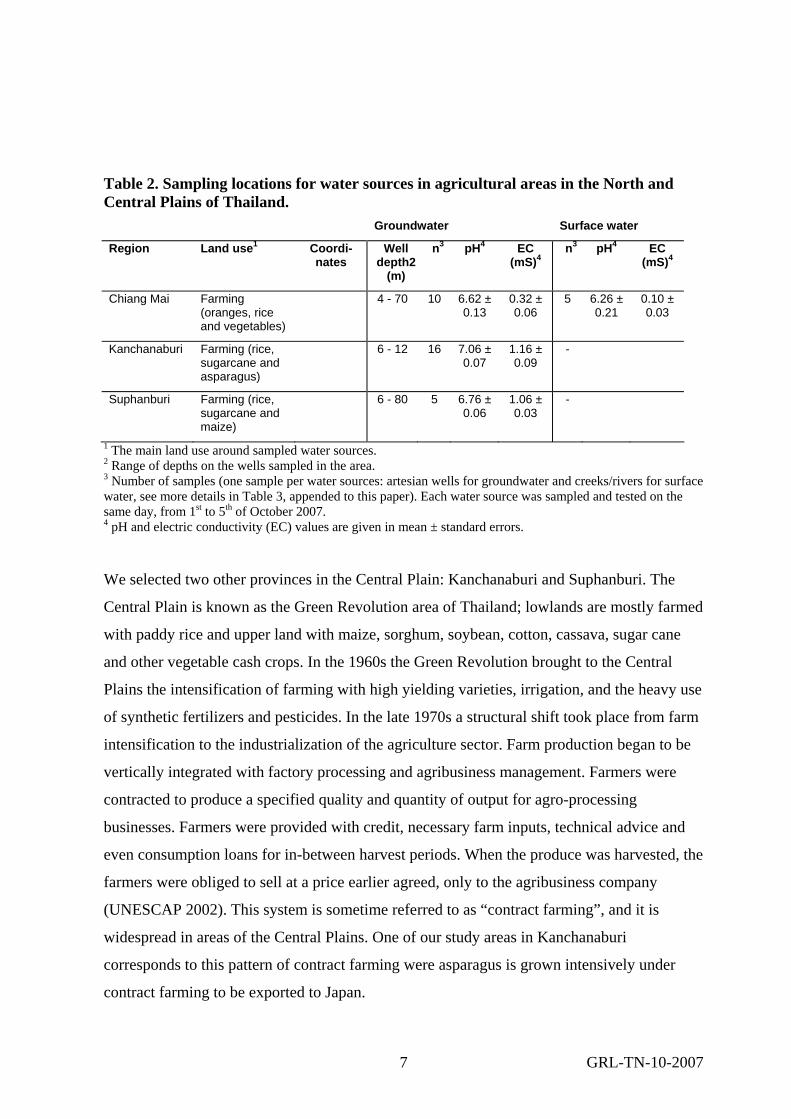
Table 2. Sampling locations for water sources in agricultural areas in the North and Central Plains of Thailand. Groundwater Surface water
Region Land use1 Coordi-nates
Well depth2
(m)
n3 pH4 EC (mS)4
n3 pH4 EC (mS)4
Chiang Mai Farming (oranges, rice and vegetables)
4 - 70 10 6.62 ± 0.13
0.32 ± 0.06
5 6.26 ± 0.21
0.10 ± 0.03
Kanchanaburi Farming (rice, sugarcane and asparagus)
6 - 12 16 7.06 ± 0.07
1.16 ± 0.09
-
Suphanburi Farming (rice, sugarcane and maize)
6 - 80 5 6.76 ± 0.06
1.06 ± 0.03
-
1 The main land use around sampled water sources. 2 Range of depths on the wells sampled in the area. 3 Number of samples (one sample per water sources: artesian wells for groundwater and creeks/rivers for surface water, see more details in Table 3, appended to this paper). Each water source was sampled and tested on the same day, from 1st to 5th of October 2007. 4 pH and electric conductivity (EC) values are given in mean ± standard errors.
We selected two other provinces in the Central Plain: Kanchanaburi and Suphanburi. The
Central Plain is known as the Green Revolution area of Thailand; lowlands are mostly farmed
with paddy rice and upper land with maize, sorghum, soybean, cotton, cassava, sugar cane
and other vegetable cash crops. In the 1960s the Green Revolution brought to the Central
Plains the intensification of farming with high yielding varieties, irrigation, and the heavy use
of synthetic fertilizers and pesticides. In the late 1970s a structural shift took place from farm
intensification to the industrialization of the agriculture sector. Farm production began to be
vertically integrated with factory processing and agribusiness management. Farmers were
contracted to produce a specified quality and quantity of output for agro-processing
businesses. Farmers were provided with credit, necessary farm inputs, technical advice and
even consumption loans for in-between harvest periods. When the produce was harvested, the
farmers were obliged to sell at a price earlier agreed, only to the agribusiness company
(UNESCAP 2002). This system is sometime referred to as “contract farming”, and it is
widespread in areas of the Central Plains. One of our study areas in Kanchanaburi
corresponds to this pattern of contract farming were asparagus is grown intensively under
contract farming to be exported to Japan.
GRL-TN-10-2007 8
Sampling and testing methods
In each study area we sampled water from a number of groundwater and surface water
sources (Table 3, see appendix); in each study area we selected a number of sampling sites
(i.e. farms) and in each of them we collected one water sample (i.e., from wells in farms or
households, details in Table 3). Groundwater sources were mostly artesian wells from farms
or farmer houses, all had concrete casing for protection from contamination by surface water
and were fitted with manually or power operated pumps. We took surface water samples
mostly from irrigation tanks or mountain creeks diverted for the town domestic use (see
details for each sample in Table 3). Both water sources were usually used for irrigation and in
households for domestic uses and drinking. When sampling groundwater we let the water
outlet (i.e. hand or electric pump) run for approximately 3 minutes before collecting the
sample in a sterile plastic bottle. Measurements of pH and electric conductivity (EC) were
taken on site at the time of sampling (Hanna Instruments, UK). Water samples were kept in a
cool box until later in the day when chemical testing was carried out. All nitrate testing was
done on the same day of sampling, within 6-10 hours of collection. All sampling and testing
was carried out between the 26th of September and 5th of October 2007.
Nitrate (NO3-) concentration in water samples was tested colorimetrically with the
chromotropic acid method (Method 10020, Test ‘N Tube™ Vials, Hach Lange, UK) using a
portable spectrophotometer (DR2400, Hach Lange, UK). The value given for each sample is
the average of testing 2 or 3 sub-samples.
When possible, we also recorded information about the characteristics of the water sources
we sampled (i.e., depth of the artesian well) and about the specific farming practices at each
sampling site by interviewing the farmers on site.
GRL-TN-10-2007 9
Results and Discussion Drinking water extracted from artesian wells in agricultural areas in the Philippines and
Thailand shows evidence of pollution with nitrates, and this pollution correlates with
intensive farming practices where nitrogen fertilisers are applied in excess (Table 3, Figures
1, 2 and 3).
Water pollution with nitrates in the Philippines
In the Philippines, the results show examples of groundwater pollution with nitrates in the
two provinces we sampled, Benguet and Bulacan, and this pollution seems related to
intensive farming areas where nitrogen fertilisers (and other agrochemicals) are applied in
excess (Reyes and Laurean 2006, 2007). In 5 out of the 18 artesian wells tested, nitrates
levels were above the World Health Organisation (WHO) drinking water safety limit of 50
mg/l NO3- (Figure 1); this water pollution could have serious health implications for the local
population, especially for children (see below). Surface waters generally showed lower
nitrate levels than groundwater sources (Table 3), pointing to the rapid cycling of nitrate in
surface waters in tropical climates. For both surface and ground waters, the high input of
nitrogen into the aquatic ecosystem could have negative environmental effects on the local
and regional level, from eutrophication in lakes to harmful algal blooms in coastal waters
(Beman et al. 2005).
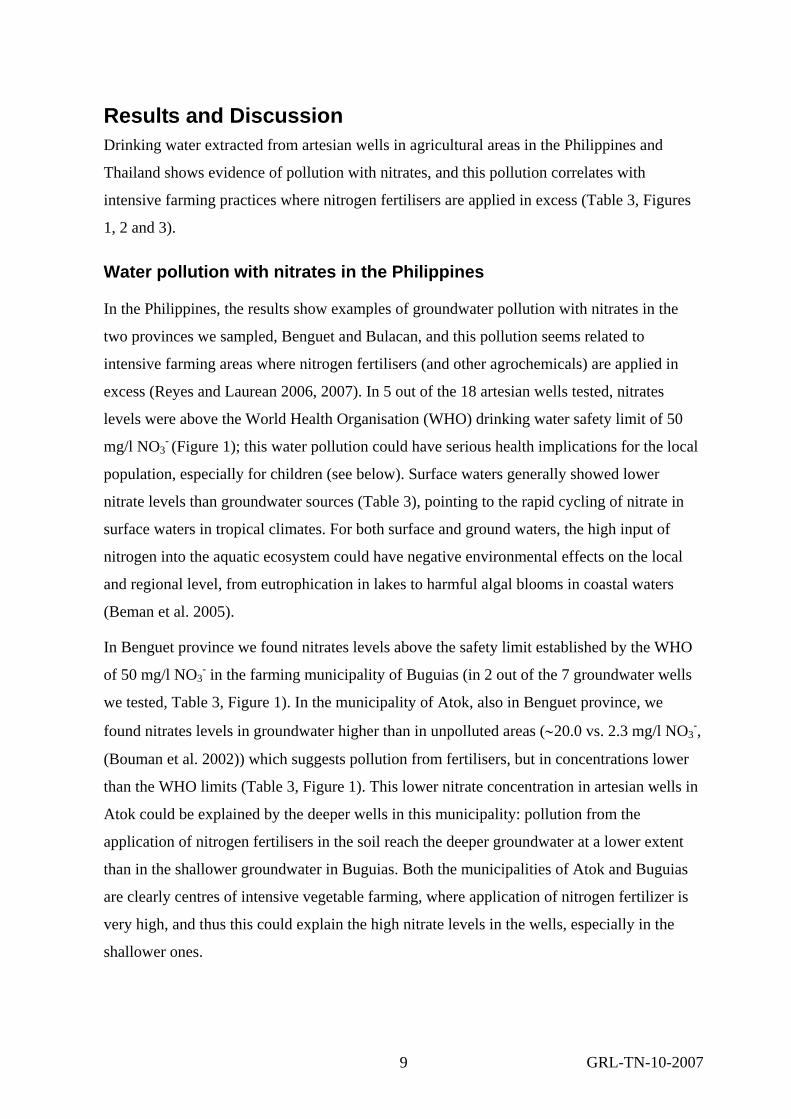
In Benguet province we found nitrates levels above the safety limit established by the WHO
of 50 mg/l NO3- in the farming municipality of Buguias (in 2 out of the 7 groundwater wells
we tested, Table 3, Figure 1). In the municipality of Atok, also in Benguet province, we
found nitrates levels in groundwater higher than in unpolluted areas (∼20.0 vs. 2.3 mg/l NO3-,
(Bouman et al. 2002)) which suggests pollution from fertilisers, but in concentrations lower
than the WHO limits (Table 3, Figure 1). This lower nitrate concentration in artesian wells in
Atok could be explained by the deeper wells in this municipality: pollution from the
application of nitrogen fertilisers in the soil reach the deeper groundwater at a lower extent
than in the shallower groundwater in Buguias. Both the municipalities of Atok and Buguias
are clearly centres of intensive vegetable farming, where application of nitrogen fertilizer is
very high, and thus this could explain the high nitrate levels in the wells, especially in the
shallower ones.
GRL-TN-10-2007 10
Figure 1. Nitrate concentration in groundwater wells in agricultural areas in the Philippines. The population density in the mountain areas of Atok and Buguias (the Philippines) is much
lower than the population in the other municipality we studied in Benguet province, La
Trinidad (where there is not intensive farming). Where population density is high, human
sewage is a source of nitrate pollution in the groundwater in places with controlled disposal
and where treatment is limited. By comparing Buguias and La Trinidad (where groundwater
depth is similar, but land use is different), we can explain the importance of the different
factors affecting nitrate pollution. If population density (through human sewage) were the
main source of nitrate pollution in the groundwater, we would have found higher pollution
with nitrates in the artesian wells in La Trinidad (given other factors as disposal and
treatment, aquifer depth, geology, etc., are similar). The lower nitrate levels found in
groundwater in La Trinidad (where population density is very high), compared to the high
nitrate levels found in Buguias (where highly-fertilised crops are extensively grown but
population is low), points to the role of intensive use of nitrogen fertilisers in nitrate
pollution. Groundwater wells in Atok are deeper than in Buguias or La Trinidad (24 m vs. 5
m, Table 1), and this may confound their comparison. However, the fact that nitrate values in
Atok and La Trinidad are similar also points to the importance of intensive use of nitrogen
fertilizers in nitrogen pollution, even in remote sites with low population density.
GRL-TN-10-2007 11
Water pollution with nitrates in Thailand
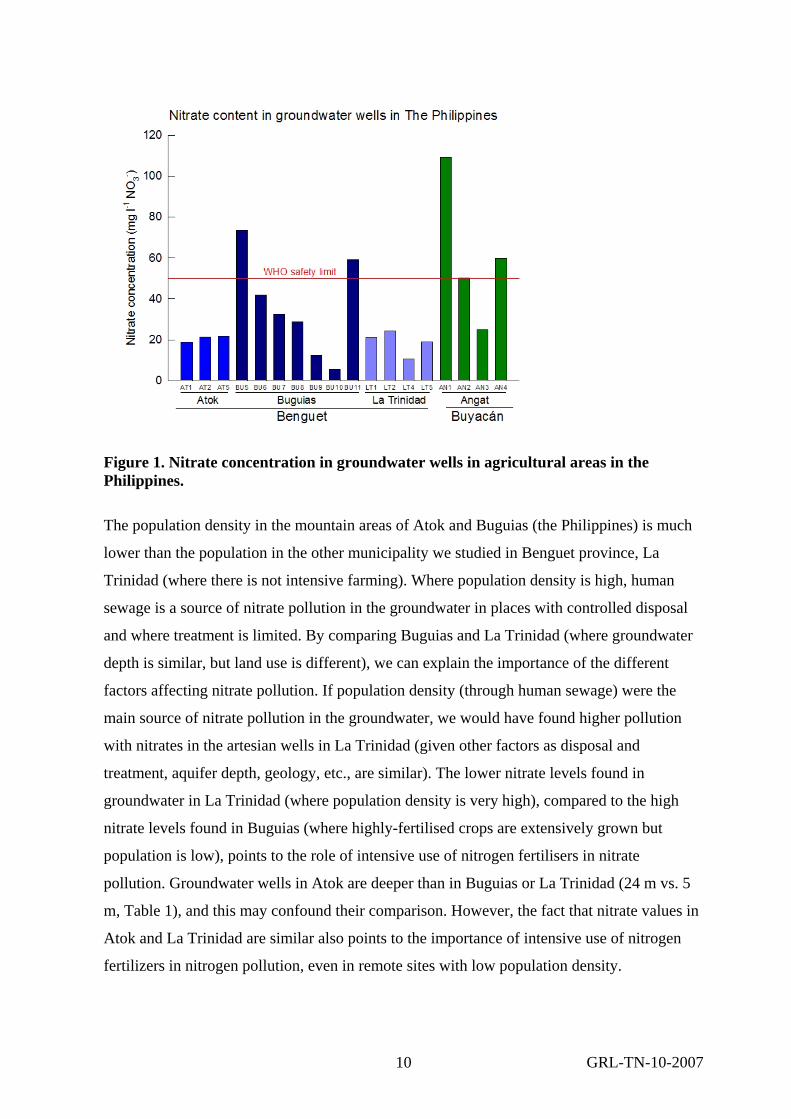
In Thailand we found examples of water pollution with nitrates in intensive farming areas in
the Central Plain (Kanchanaburi and Suphanburi). In Kanchanaburi, we found a clear
example of heavy fertilizer use related to water pollution with nitrates in asparagus farms
(Table 3, Figure 2). In 6 out of 11 asparagus farms, nitrates levels in groundwater wells were
above the WHO drinking water safety limit of 50 mg/l NO3-, and even in the other five wells
nitrate levels showed evidence of pollution (Table 3, Figure 2). In Suphanburi, two of the five
wells in farms we sampled had nitrates levels higher than the WHO safety limit (Table 3,
Figure 2). These high levels of nitrates in drinking water could have serious health effects for
the local population, especially for children.
Figure 2. Nitrate concentration in groundwater wells in Thailand.
Asparagus are grown in Kanchanaburi mostly under ‘contract farming’; farmers grow and
harvest asparagus spears year-round and they sell the fresh green spears directly to a Japanese
agro-business company for export. According to local farmers, asparagus farming is very
intensive in the amount of labour, irrigation and agrochemicals it requires. One of the farmers
we interviewed said that he needed to irrigate and harvest everyday and apply fertilizers,
hormones and pesticides every week.
GRL-TN-10-2007 12
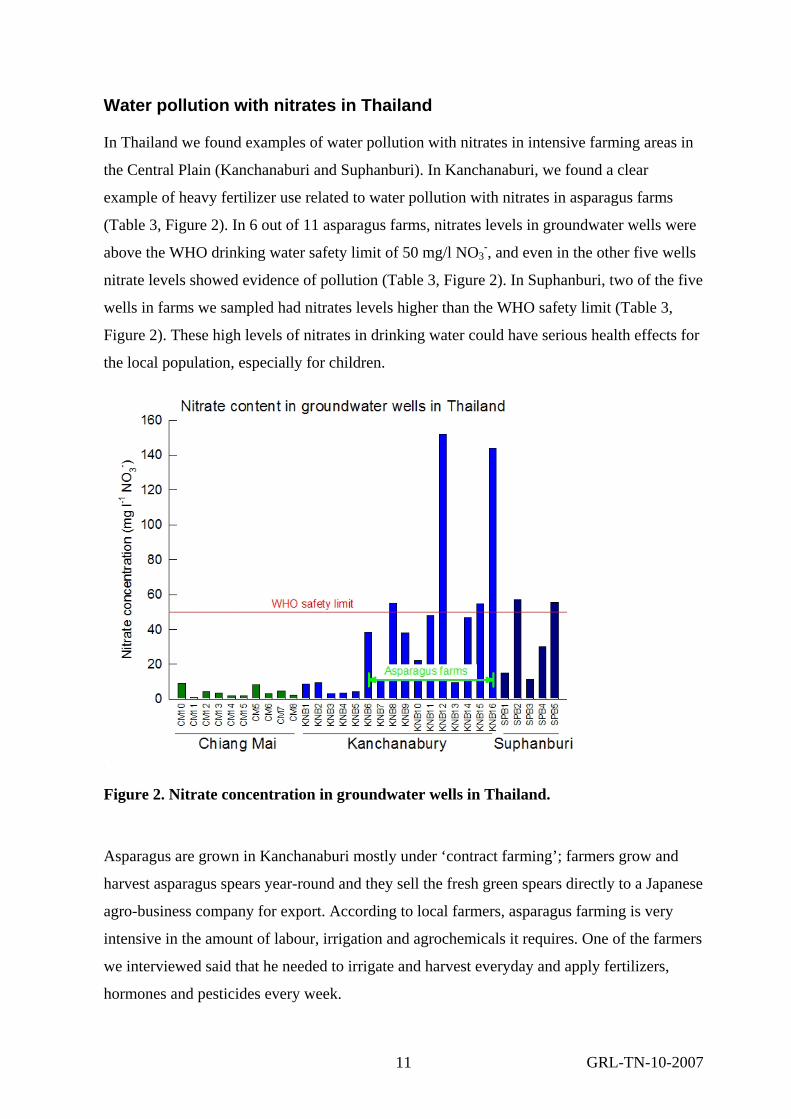
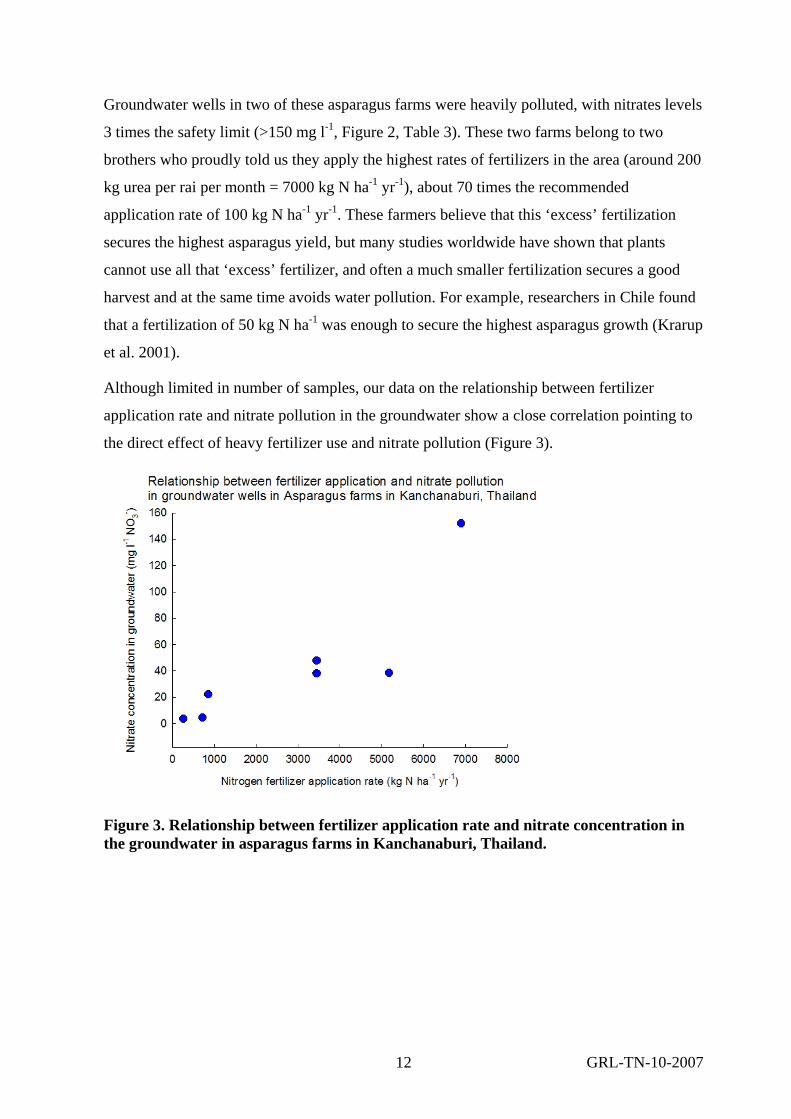
Groundwater wells in two of these asparagus farms were heavily polluted, with nitrates levels
3 times the safety limit (>150 mg l-1, Figure 2, Table 3). These two farms belong to two
brothers who proudly told us they apply the highest rates of fertilizers in the area (around 200
kg urea per rai per month = 7000 kg N ha-1 yr-1), about 70 times the recommended
application rate of 100 kg N ha-1 yr-1. These farmers believe that this ‘excess’ fertilization
secures the highest asparagus yield, but many studies worldwide have shown that plants
cannot use all that ‘excess’ fertilizer, and often a much smaller fertilization secures a good
harvest and at the same time avoids water pollution. For example, researchers in Chile found
that a fertilization of 50 kg N ha-1 was enough to secure the highest asparagus growth (Krarup
et al. 2001).
Although limited in number of samples, our data on the relationship between fertilizer
application rate and nitrate pollution in the groundwater show a close correlation pointing to
the direct effect of heavy fertilizer use and nitrate pollution (Figure 3).
Figure 3. Relationship between fertilizer application rate and nitrate concentration in the groundwater in asparagus farms in Kanchanaburi, Thailand.
GRL-TN-10-2007 13
Heavy fertilizer use and water pollution with nitrates
It is well known that the excess application of fertiliser on agricultural soils is one of the main
sources of nitrogen pollution of water bodies, mostly in the form of nitrate. When farmers
apply fertilizer to farms, half (or more) of that fertilizer generally does not stay on the soil to
help crops grow, but rather is carried away in water and air. The run-off of fertilizers in water
first reaches local wells and creeks, from where it travels to rivers and lakes and ultimately
the coast. Nitrogen pollution in water bodies causes eutrophication when too much nitrogen
disrupts the aquatic ecosystem and oxygen levels are reduced. This eutrophication leads to
the suffocation of fish and invertebrates, the loss of biodiversity, the creation of toxic and
overabundant algae blooms.
Farmers apply fertilizers in excess for a number of reasons, such as the perception that it is
always better to apply in excess to secure a good harvest, or a lack of expertise about specific
crop requirements and efficiency in the timing of application. But in many cases, farmers are
not directly responsible for this excess in fertiliser application. Agriculture extension officers
from the government institutions, who are responsible for providing technical
recommendations to farmers in terms of agrochemicals application rates, etc., are often
limited in capacity and do not reach farmers effectively. Throughout developing countries it
is common to find that agrochemical dealers (for example in local shops) are in reality acting
as agricultural extension officers providing the technical expertise to farmers and
recommending the optimal application rates, etc. It has been suggested that the conflict of
interest in agro-dealers (in terms of how much to sell and how much to apply) is one of the
reason for this massive over-application of fertilizers that it is starting to appear in some
developing countries, like China (Zhang et al. 2004), or like the example in Thai asparagus
farms.
Human health risks associated with nitrate pollution
As confirmed by our results, groundwater nitrate contamination is common in areas where
farmers use large quantities of nitrogen fertilizers (Ward et al. 2005). Babies and infants
living around agricultural areas and who are given water from wells are the most vulnerable
to health risks from nitrates. Additionally, anyone drinking from a contaminated well could
be vulnerable to the long term effects of nitrates, such as various types of cancer (Greer et al.
2005).
GRL-TN-10-2007 14
The greatest risk of nitrate poisoning is considered to be the blue baby syndrome or
methemoglobinemia, which occurs in infants given nitrate-laden water, and affects
particularly babies under 4 months of age (Greer et al. 2005). Blue-baby syndrome occurs
when the hemoglobin in the blood losses its capacity to carry oxygen, and this can ultimately
cause asphyxia and death. This occurs because nitrites (resulting from the reduction of the
nitrate in the anaerobic conditions of the digestive tract) block hemoglobin in the blood
(Townsend et al. 2003). Blue-baby syndrome can provoke cyanosis, headache, stupor,
fatigue, tachycardia, coma, convulsions, asphyxia and ultimately death. (Townsend et al.
2003, Ward et al. 2005). Since 1945 more than 3000 cases of blue-baby syndrome have been
reported worldwide, most of which were associated with private wells in farming areas with
high nitrate concentrations (concentrations > 50 mg/l NO3-). Some health professionals
believe that the blue-baby syndrome is often under- or misdiagnosed (Ward et al. 2005,
Camargo and Alonso 2006).
Drinking water contaminated with nitrates has a potential role in developing cancers of the
digestive tract, and has also been associated with other types of cancer such as non-Hodgkin's
lymphoma, bladder and ovarian cancers (Ward et al. 2005). The link between nitrates and
cancer is based on the contribution of nitrates to the bacterial formation of N-nitroso
compounds (like nitrosamines) in the digestive tract, particularly in the stomach. These
nitrosamines are among the most potent of the known carcinogens in mammals (Weyer et al.
2001). Some studies have shown that long-term consumption of drinking water with nitrate
concentrations even below the WHO maximum safety level of 50 mg/l NO3- may stimulate
the formation of these nitrate-related carcinogens (nitrosamines) in the digestive system
(Chiu and Tsai 2007). For example, in Iowa (USA) levels of nitrate in drinking water below
the recommended WHO levels have been linked with an increased risk of bladder and
ovarian cancers in women drinking water from municipal and private farm wells (Beman et
al. 2005). A recent study in Taiwan showed that drinking water with high levels of nitrates
was associated with increased risk of bladder cancer (Townsend et al. 2003).
One common and well-documented effect of intensive fertilizer use is the eutrophication of
coastal and marine ecosystems (Robertson and Swinton 2005). This can lead to ecological
changes with impacts on human health. One of the consequences of eutrophication is the
worldwide increase in harmful algal blooms (Pretty et al. 2003, Badgley et al. 2007). Algal
blooms can lead to the proliferation of algal species that produce toxins. When the algae are
GRL-TN-10-2007 15
ingested by shellfish this can result in neurological, amnesic, paralytic, and/or diarrhetic
shellfish poisoning in human consumers.
Excess nitrogen fertilizer also contributes to climate change
Some of the excess nitrogen applied to soils is transformed to the gas nitrous oxide. Nitrous
oxide, also known as laughing gas, is an important greenhouse gas with 296 times the global
warming potential of CO2. Scientists believe that agricultural runoff is a major source of
nitrous oxide, and this runoff is related, at least in part, to the amount of nitrogen fertilizer
applied to agricultural fields (IPCC 2007).
Besides the effect of fertilizers applied to soils in nitrous oxide emissions, synthetic fertilizers
are also an important source of CO2 emissions. Fertilizer production is a very energy-
intensive process and through fossil fuel burning emits up to 1.2% of all global greenhouse
emissions.
It is possible to produce food and keep both a healthy livelihood and environment
Farming requires new approaches that integrate people, biodiversity, and environment and
are based on agro-ecological principles . There are many examples, especially in developing
countries, where farmers maintain high yields from their land in biologically and
biodiversity-based systems that ensure both a healthy livelihood and environment .
Greenpeace demands
1. Clean and safe drinking water for all. The dangerous practice of over-using fertilizers in
intensive agriculture is a serious threat to human health and the environment and must be
stopped.
2. All subsidies on fertilizers – on a national and local level – should be phased out. Public
subsidies must not award environmentally and socially destructive practices. Subsidies
should be re-oriented towards sustainable farming systems by subsidizing practices that
increase soil fertility, water retention, and biodiversity, or that reduce greenhouse gas
emissions. Rather than subsidized, fertilizers and pesticides should be taxed to internalize
the real costs of chemical-intensive farming.
3. National fertilizer reduction policies that define maximum nitrogen applications per area
should be implemented and enforced. Experiences in other countries and regions show
GRL-TN-10-2007 16
that fertilizer reduction policies significantly contribute to a cleaner and safer drinking
water supply.
References Badgley, C., J. Moghtader, E. Quintero, E. Zakem, M. J. Chappell, K. Avilés-Vázquez, A.
Samulon, and I. Perfecto. 2007. Organic agriculture and the global food supply. Renewable Agriculture and Food Systems 22:86-108.
Beman, J. M., K. R. Arrigo, and P. A. Matson. 2005. Agricultural runoff fuels large phytoplankton blooms in vulnerable areas of the ocean. Nature 434:211-214.
Bouman, B. A. M., A. R. Castaneda, and S. I. Bhuiyan. 2002. Nitrate and pesticide contamination of groundwater under rice-based cropping systems: past and current evidence from the Philippines. Agriculture, Ecosystems & Environment 92:185-199.
Camargo, J. A., and A. Alonso. 2006. Ecological and toxicological effects of inorganic nitrogen pollution in aquatic ecosystems: A global assessment. Environment International 32:831.
Chiu, H. F., and S. S. Tsai. 2007. Nitrate in drinking water and risk of death from bladder cancer: an ecological case-control study in Taiwan. Journal of Toxicology and Environmental Health, Part A 70:1000-1004.
Foley, J. A., R. DeFries, G. P. Asner, C. Barford, G. Bonan, S. R. Carpenter, F. S. Chapin, M. T. Coe, G. C. Daily, H. K. Gibbs, J. H. Helkowski, T. Holloway, E. A. Howard, C. J. Kucharik, C. Monfreda, J. A. Patz, I. C. Prentice, N. Ramankutty, and P. K. Snyder. 2005. Global consequences of land use. Science 309:570-574.
Greer, F. R., M. Shannon, Committee on Nutrition, and Committee on Environmental Health. 2005. Infant methemoglobinemia: the role of dietary nitrate in food and water. Pediatrics 116:784-786.
Krarup, C., A. Krarup, and R. Pertierra. 2001. Growth of Asparagus crown with increasing nitrogen rates at three different sites. X International Asparagus Symposium 589:145-150.
Peterson, J. T. 1994. Household labor and child care needs among Philippine highland farmers. Journal of Anthropological Research 50:1-26.
Phupaibul, P., C. Chitbuntanorm, N. Chinoim, P. Kangyawongha, and T. Matoh. 2004. Phosphorus accumulation in soils and nitrate contamination in underground water under export-oriented asparagus farming in Nong Ngu Lauem village, Nakhon Pathom province, Thailand. Soil Science and Plant Nutrition 50:385-393.
Prasad, N. 2006. Privatisation results: private sector participation in water services after 15 years. Development Policy Review 24:669-692.
Pretty, J. N., J. I. L. Morison, and R. E. Hine. 2003. Reducing food poverty by increasing agricultural sustainability in developing countries. Agriculture, Ecosystems & Environment 95:217-234.
Raun, W. R., and G. V. Johnson. 1999. Improving nitrogen use efficiency for cereal production. Agronomy Journal 91:357-363.
Reyes, G. A., and C. P. Laurean. 2006. Pesticide residues in soil, water and vegetables from selected barangays in a Benguet municipality: assessing potential concern for human health. Saint Louis University Research Journal 37:35-51.
Reyes, G. A., and C. P. Laurean. 2007. A comprehensive assessment of pesticide residues in two vegetable-farming municipalities in Benguet. NLR Journal 1:39-54.
GRL-TN-10-2007 17
Robertson, G. P., and S. M. Swinton. 2005. Reconciling agricultural productivity and environmental integrity: a grand challenge for agriculture. Frontiers in Ecology and the Environment 3:38-46.
Scanlon, B. R., I. Jolly, M. Sophocleous, and L. Zhang. 2007. Global impacts of conversions from natural to agricultural ecosystems on water resources: Quantity versus quality. Water Resources Research 43.
Townsend, A. R., R. W. Howarth, F. A. Bazzaz, M. S. Booth, C. C. Cleveland, S. K. Collinge, A. P. Dobson, P. R. Epstein, E. A. Holland, and D. R. Keeney. 2003. Human health effects of a changing global nitrogen cycle. Frontiers in Ecology and the Environment 1:240-246.
UNESCAP. 2002. Organic agriculture and rural poverty alleviation: Potential and best practices in Asia. United Nations Economic and Social Commission for Asia and the Pacific.
Ward, M. H., T. M. deKok, and P. Levallois. 2005. Workgroup report: drinking-water nitrate and health-recent findings and research needs. Environmental Health Perspectives 113:1607-1614.
Weyer, P. J., J. R. Cerhan, B. C. Kross, G. R. Hallberg, J. Kantamneni, G. Breuer, M. P. Jones, W. Zheng, and C. F. Lynch. 2001. Municipal drinking water nitrate level and cancer risk in older women: the Iowa women's health study. Epidemiology 12:327-338.
GRL-TN-10-2007
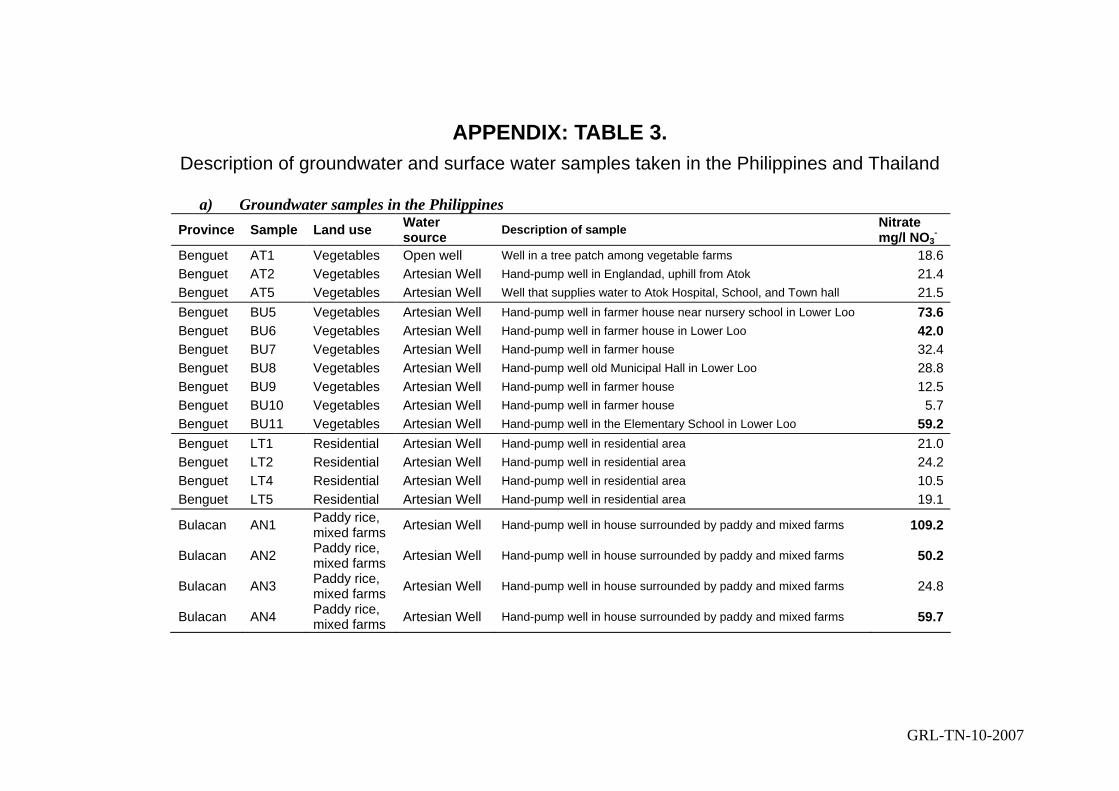
APPENDIX: TABLE 3. Description of groundwater and surface water samples taken in the Philippines and Thailand
a) Groundwater samples in the Philippines
Province Sample Land use Water source Description of sample Nitrate
mg/l NO3-
Benguet AT1 Vegetables Open well Well in a tree patch among vegetable farms 18.6Benguet AT2 Vegetables Artesian Well Hand-pump well in Englandad, uphill from Atok 21.4Benguet AT5 Vegetables Artesian Well Well that supplies water to Atok Hospital, School, and Town hall 21.5Benguet BU5 Vegetables Artesian Well Hand-pump well in farmer house near nursery school in Lower Loo 73.6Benguet BU6 Vegetables Artesian Well Hand-pump well in farmer house in Lower Loo 42.0Benguet BU7 Vegetables Artesian Well Hand-pump well in farmer house 32.4Benguet BU8 Vegetables Artesian Well Hand-pump well old Municipal Hall in Lower Loo 28.8Benguet BU9 Vegetables Artesian Well Hand-pump well in farmer house 12.5Benguet BU10 Vegetables Artesian Well Hand-pump well in farmer house 5.7Benguet BU11 Vegetables Artesian Well Hand-pump well in the Elementary School in Lower Loo 59.2Benguet LT1 Residential Artesian Well Hand-pump well in residential area 21.0Benguet LT2 Residential Artesian Well Hand-pump well in residential area 24.2Benguet LT4 Residential Artesian Well Hand-pump well in residential area 10.5Benguet LT5 Residential Artesian Well Hand-pump well in residential area 19.1
Bulacan AN1 Paddy rice, mixed farms Artesian Well Hand-pump well in house surrounded by paddy and mixed farms 109.2
Bulacan AN2 Paddy rice, mixed farms Artesian Well Hand-pump well in house surrounded by paddy and mixed farms 50.2
Bulacan AN3 Paddy rice, mixed farms Artesian Well Hand-pump well in house surrounded by paddy and mixed farms 24.8
Bulacan AN4 Paddy rice, mixed farms Artesian Well Hand-pump well in house surrounded by paddy and mixed farms 59.7
GRL-TN-10-2007 19
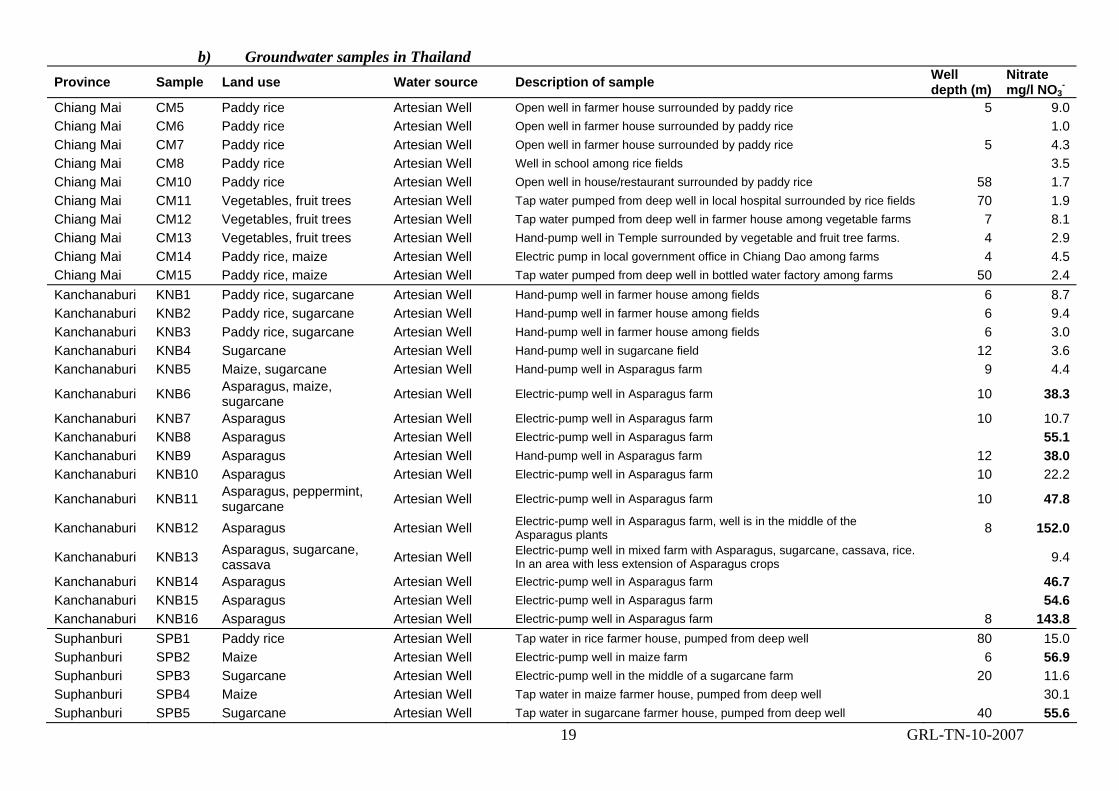
b) Groundwater samples in Thailand Province Sample Land use Water source Description of sample Well
depth (m) Nitrate mg/l NO3
- Chiang Mai CM5 Paddy rice Artesian Well Open well in farmer house surrounded by paddy rice 5 9.0 Chiang Mai CM6 Paddy rice Artesian Well Open well in farmer house surrounded by paddy rice 1.0 Chiang Mai CM7 Paddy rice Artesian Well Open well in farmer house surrounded by paddy rice 5 4.3 Chiang Mai CM8 Paddy rice Artesian Well Well in school among rice fields 3.5 Chiang Mai CM10 Paddy rice Artesian Well Open well in house/restaurant surrounded by paddy rice 58 1.7 Chiang Mai CM11 Vegetables, fruit trees Artesian Well Tap water pumped from deep well in local hospital surrounded by rice fields 70 1.9 Chiang Mai CM12 Vegetables, fruit trees Artesian Well Tap water pumped from deep well in farmer house among vegetable farms 7 8.1 Chiang Mai CM13 Vegetables, fruit trees Artesian Well Hand-pump well in Temple surrounded by vegetable and fruit tree farms. 4 2.9 Chiang Mai CM14 Paddy rice, maize Artesian Well Electric pump in local government office in Chiang Dao among farms 4 4.5 Chiang Mai CM15 Paddy rice, maize Artesian Well Tap water pumped from deep well in bottled water factory among farms 50 2.4 Kanchanaburi KNB1 Paddy rice, sugarcane Artesian Well Hand-pump well in farmer house among fields 6 8.7 Kanchanaburi KNB2 Paddy rice, sugarcane Artesian Well Hand-pump well in farmer house among fields 6 9.4 Kanchanaburi KNB3 Paddy rice, sugarcane Artesian Well Hand-pump well in farmer house among fields 6 3.0 Kanchanaburi KNB4 Sugarcane Artesian Well Hand-pump well in sugarcane field 12 3.6 Kanchanaburi KNB5 Maize, sugarcane Artesian Well Hand-pump well in Asparagus farm 9 4.4
Kanchanaburi KNB6 Asparagus, maize, sugarcane Artesian Well Electric-pump well in Asparagus farm 10 38.3
Kanchanaburi KNB7 Asparagus Artesian Well Electric-pump well in Asparagus farm 10 10.7 Kanchanaburi KNB8 Asparagus Artesian Well Electric-pump well in Asparagus farm 55.1 Kanchanaburi KNB9 Asparagus Artesian Well Hand-pump well in Asparagus farm 12 38.0 Kanchanaburi KNB10 Asparagus Artesian Well Electric-pump well in Asparagus farm 10 22.2
Kanchanaburi KNB11 Asparagus, peppermint, sugarcane Artesian Well Electric-pump well in Asparagus farm 10 47.8
Kanchanaburi KNB12 Asparagus Artesian Well Electric-pump well in Asparagus farm, well is in the middle of the Asparagus plants 8 152.0
Kanchanaburi KNB13 Asparagus, sugarcane, cassava Artesian Well Electric-pump well in mixed farm with Asparagus, sugarcane, cassava, rice.
In an area with less extension of Asparagus crops 9.4
Kanchanaburi KNB14 Asparagus Artesian Well Electric-pump well in Asparagus farm 46.7 Kanchanaburi KNB15 Asparagus Artesian Well Electric-pump well in Asparagus farm 54.6 Kanchanaburi KNB16 Asparagus Artesian Well Electric-pump well in Asparagus farm 8 143.8 Suphanburi SPB1 Paddy rice Artesian Well Tap water in rice farmer house, pumped from deep well 80 15.0 Suphanburi SPB2 Maize Artesian Well Electric-pump well in maize farm 6 56.9 Suphanburi SPB3 Sugarcane Artesian Well Electric-pump well in the middle of a sugarcane farm 20 11.6 Suphanburi SPB4 Maize Artesian Well Tap water in maize farmer house, pumped from deep well 30.1 Suphanburi SPB5 Sugarcane Artesian Well Tap water in sugarcane farmer house, pumped from deep well 40 55.6
GRL-TN-10-2007 20
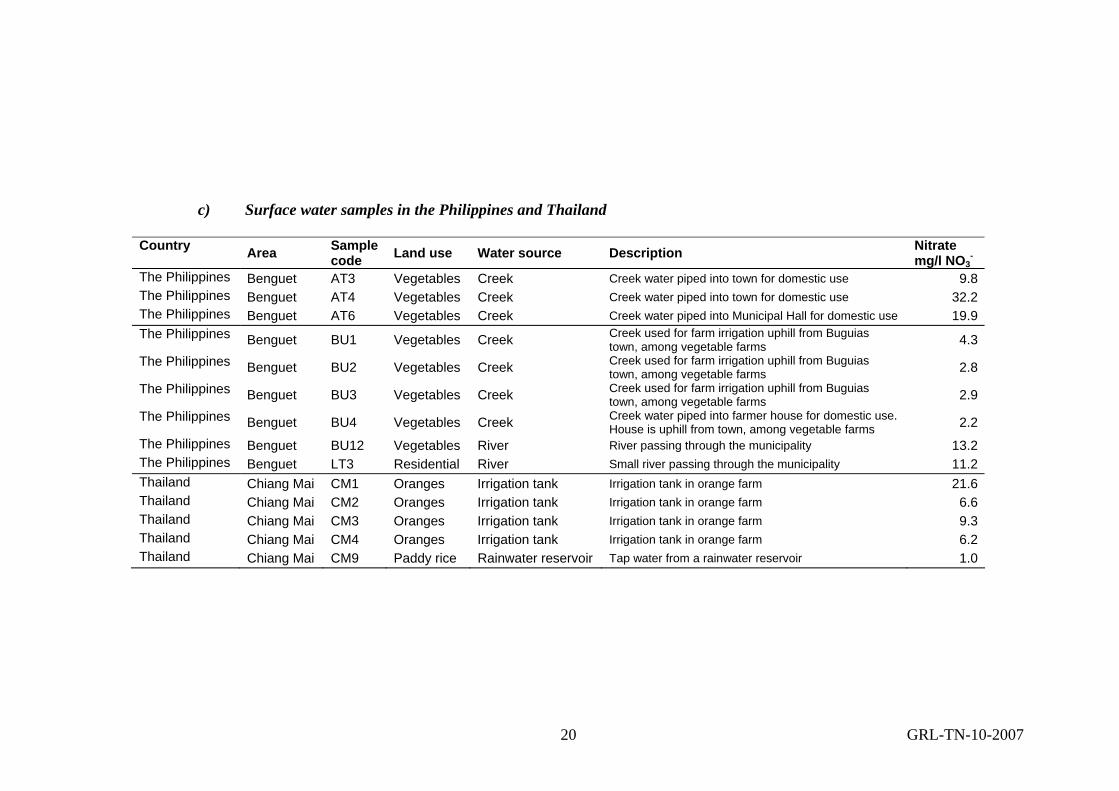
c) Surface water samples in the Philippines and Thailand Country Area Sample
code Land use Water source Description Nitrate mg/l NO3
- The Philippines Benguet AT3 Vegetables Creek Creek water piped into town for domestic use 9.8The Philippines Benguet AT4 Vegetables Creek Creek water piped into town for domestic use 32.2The Philippines Benguet AT6 Vegetables Creek Creek water piped into Municipal Hall for domestic use 19.9The Philippines Benguet BU1 Vegetables Creek Creek used for farm irrigation uphill from Buguias
town, among vegetable farms 4.3The Philippines Benguet BU2 Vegetables Creek Creek used for farm irrigation uphill from Buguias
town, among vegetable farms 2.8The Philippines Benguet BU3 Vegetables Creek Creek used for farm irrigation uphill from Buguias
town, among vegetable farms 2.9The Philippines Benguet BU4 Vegetables Creek Creek water piped into farmer house for domestic use.
House is uphill from town, among vegetable farms 2.2The Philippines Benguet BU12 Vegetables River River passing through the municipality 13.2The Philippines Benguet LT3 Residential River Small river passing through the municipality 11.2Thailand Chiang Mai CM1 Oranges Irrigation tank Irrigation tank in orange farm 21.6Thailand Chiang Mai CM2 Oranges Irrigation tank Irrigation tank in orange farm 6.6Thailand Chiang Mai CM3 Oranges Irrigation tank Irrigation tank in orange farm 9.3Thailand Chiang Mai CM4 Oranges Irrigation tank Irrigation tank in orange farm 6.2Thailand Chiang Mai CM9 Paddy rice Rainwater reservoir Tap water from a rainwater reservoir 1.0