Nitrogen substrate–dependent nitrous oxide cyclingin salt marsh sediments
by Qixing Ji1, Andrew R. Babbin2, Xuefeng Peng3, Jennifer L. Bowen4, andBess B. Ward5
ABSTRACTNitrous oxide (N2O) is important to Earth’s climate because it is a strong absorber of radiation and
an important ozone depletion agent. Increasing anthropogenic nitrogen input into the marine envi-ronment, especially to coastal waters, has led to increasing N2O emissions. Identifying the nitrogencompounds that serve as substrates for N2O production in coastal waters reveals important pathwaysand helps us understand their control by environmental factors. In this study, sediments were collectedfrom a long-term fertilization site in Great Sippewissett Marsh, Falmouth, Massachusetts. The 15Ntracer incubation time course experiments were conducted and analyzed for potential N2O productionand consumption rates. The two nitrogen substrates of N2O production, ammonium and nitrate, corre-spond to the two production pathways, nitrification and denitrification, respectively. When measurablenitrate was present, despite ambient high ammonium concentrations, denitrification was the majorN2O production pathway. When nitrate was absent, ammonium became the dominant substrate forN2O production, via nitrification and coupled nitrification-denitrification. Net N2O consumption wasenhanced under low oxygen and nitrate conditions. N2O production and consumption rates increasedwith increasing levels of nitrogen fertilization in long-term experimental plots. These results indicatethat increasing anthropogenic nitrogen input to salt marshes can stimulate sedimentary N2O produc-tion via both nitrification and denitrification, whereas episodic oxygen depletion results in net N2Oconsumption.
1. Department of Geosciences, Princeton University, Princeton, NJ 08540. e-mail: [email protected]. Department of Geosciences, Princeton University, Princeton, NJ 08540; and Department of Civil and Envi-
ronmental Engineering, Massachusetts Institute of Technology, Cambridge, MA 02139. e-mail: [email protected]. Department of Geosciences, Princeton University, Princeton, NJ 08540. e-mail: [email protected]. Biology Department, University of Massachusetts at Boston, 100 Morrissey Blvd., Boston, MA 02125.
e-mail: [email protected]. Department of Geosciences, Princeton University, Princeton, NJ 08540. Corresponding author: e-mail:
Nitrous oxide (N2O) is a trace gas that has a strong greenhouse effect and is a powerfulozone depletion agent, with increasing emissions since the Industrial Revolution (Crutzen1970; Cicerone 1987). Present-day N2O concentration in the atmosphere is the highest ithas been in the past 800,000 years (Schilt et al. 2010; Intergovernmental Panel on ClimateChange [IPCC] 2013). With control of CFCs accomplished by the Montreal Protocol, N2Ois likely to be the single most important anthropogenic ozone-depleting agent emitted inthe 21st century (Ravishankara, Daniel, and Portmann 2009).
Globally, more than 80% of total N2O emissions can be attributed to microbial activitiesoccurring in soil, open ocean, and coastal waters (IPCC 2013). Two microbial processes arethe known major pathways for N2O production. N2O can be produced as a by-product duringaerobic ammonium (NH+
4 ) oxidation to nitrate (NO−3 ) by bacteria (Arp and Stein 2003) and
archaea (Santoro et al. 2011). The other is denitrification, a stepwise reduction from NO−3
that emits N2O as a free intermediate in the absence of oxygen. Thus, NH+4 and NO−
3are two nitrogen substrates for N2O production. Generally, NH+
4 is derived from organicnitrogen mineralization, whereas NO−
3 is the product of nitrification, and the substrate forsubsequent denitrification. Increasing anthropogenic nitrogen supply into coastal watershas led to excess NH+
4 and NO−3 , which are intercepted and removed by coastal wetlands
and sediments at the interface between land and sea. The biological removal of excessNH+
4 and NO−3 produces N2O. Bange, Rapsomanikis, and Andreae (1996) estimated that
coastal waters contribute up to 60% of global oceanic N2O emissions. Salt marshes, situatedin coastal areas, are “hot spots” of N2O emission (Blackwell, Yamulki, and Bol 2010;Moseman-Valtierra et al. 2011).
Salt marshes are characterized by temporal and spatial variation of inorganic nitrogen(Brin et al. 2010) and oxygen availabilities (Howes et al. 1981). These two factors, combinedwith increasing nitrogen loading, regulate the magnitude and pathways of N2O produc-tion. Determining the relative contribution of NH+
4 and NO−3 to N2O production can help
us evaluate the relative importance of nitrification and denitrification to N2O emissionsin the environment. Oxygen critically affects N2O production and consumption because(1) N2O production via NH+
3 and N2O consumption are able to proceed only under low and zero oxygen;and (3) the enzyme that mediates N2O consumption, nitrous oxide reductase (N2OR), isthe most oxygen-sensitive in the canonical denitrification pathway (Bonin, Gilewicz, andBertrand 1989; Körner and Zumft 1989). Finally, N2O emissions from salt marshes areexpected to increase as a result of increasing anthropogenic nitrogen loading to coastalwaters, as demonstrated by modeling and by nutrient enrichment experiments (Seitzingerand Kroeze 1998; Moseman-Valtierra 2012 and reference therein). Because of their naturalgradients of oxygen and nitrogen concentrations, salt marshes are important experimentalsites for studying N2O production pathways and the effects of changing environmentalconditions.
2015] Ji et al.: Nitrogen substrate–dependent N2O cycling in salt marsh sediments 73
To investigate the effects of nutrient enrichment on salt marsh ecosystems, a long-termfertilization project was initiated in the 1970s in the Great Sippewissett Marsh, Falmouth,Massachusetts, by Valiela, Teal, and Sass (1973) and has been maintained without interrup-tion. The results of long-term fertilization have included increases in aboveground biomass(Valiela, Teal, and Sass 1975; Howes, Dacey, and Goehringer 1986), loss of Spartina alterni-flora and an increase in Distichlis spicata (Fox, Valiela, and Kinney 2012), and the alterationof microbial communities in high-nutrient environments (Hamlett 1986; Bowen et al. 2013).In addition, elevated rates of denitrification (Koop-Jakobsen and Giblin 2010; Kinney andValiela 2013) and coupled nitrification-denitrification (Hamersley and Howes 2005) wereassociated with increasing fertilization.
In this study, biological N2O production and consumption in the Great SippewissettMarsh sediments were investigated using 15N tracer incubation methods. Sediment NH+
4and NO−
3 were enriched with 15N, and the rates of 15NH+4 and 15NO−
3 transformation toN2O were monitored over 8-hour incubations. The time courses were analyzed to determinepotential rates of N2O production and to determine relative contributions of NH+
4 and NO−3
as substrates for N2O production. Furthermore, the effects of environmental factors, suchas dissolved inorganic nitrogen availability, oxygen level, and fertilization level, on N2Oproduction rates and the relative contribution of NH+
4 and NO−3 were investigated.
2. Methods
a. Site description and fieldwork
Sediment samples were collected from the Great Sippewissett Marsh located in Falmouth,Massachusetts (41◦35′3.1′′ N, 70◦38′17.0′′ W). Circular plots (10 m radius) of the marshhave been fertilized biweekly during the growing season (late April to early November,∼20 weeks) without interruption since the early 1970s, using commercially available pel-letized sewage sludge fertilizer (6% by weight total nitrogen, 0.9% NO−
3 -N, 0.2% NH+4 -N;
Milorganite, Milwaukee, WI). The fertilizer is applied at three levels (Table 1) to each setof replicate plots: low fertilization (LF), high fertilization (HF), and extrahigh fertilization(XF). Two additional plots are not directly fertilized above background and serve as controls(C). The plots are located within an area of 0.48 km2, where averaged weekly backgroundnitrogen loading from precipitation is estimated to be 0.023 g N m−2 week−1 (1.6 mmolN m−2 week−1) (Bowen and Valiela 2001). Nitrogen loading from nitrogen fixation plusgroundwater flow was 0.16 g N m−2 week−1 (11 mmol N m−2 week−1) (Valiela and Teal1979). At the time of sampling, the dominant vegetation cover in C, LF, and HF plots wasshort-form S. alterniflora in the high marsh and tall-form S. alterniflora in the low marsh.Low marsh in the XF plots was also dominated by tall-form S. alterniflora (XF-t). Highmarsh in the XF plots was dominated by D. spicata (XF-d) mixed with small patches ofshort-form S. alterniflora (XF-m). See Fox, Valiela, and Kinney (2012) for detailed mapsof vegetation cover.
Tabl
e1.
Phys
ical
and
chem
ical
prop
ertie
sof
sedi
men
tsa
mpl
es,
incl
udin
gin
itial
15N
perc
enta
gela
bel
for
15N
-NH
+ 4tr
eatm
ent
and
15N
-NO
− 3tr
eatm
ents
.T
heco
ncen
trat
ions
ofN
H+ 4
,N
O− 3
,an
dN
2O
inse
dim
ent
are
norm
aliz
edto
one
gram
ofw
etse
dim
ent.
Stan
dard
devi
atio
nsof
mea
sure
men
ts(n
=3)
are
show
nin
pare
nthe
ses.
The
“n.d
.”re
pres
ents
belo
wde
tect
ion
[NO
− 3]
insa
mpl
es;t
here
fore
,15N
cont
ento
fN
O− 3
coul
dno
tbe
dete
rmin
ed(r
epre
sent
edas
“-”)
.*E
quiv
alen
tfer
tiliz
erlo
adin
gin
the
unit
ofm
mol
-Nm
−2w
k−1
Plot
CX
FC
LF
HF
XF
XF-
mX
F-t
XF-
dC
HF
XF
Col
lect
ion
time
Aug
ust2
012
Nov
embe
r20
12A
ugus
t201
3
Fert
ilize
rdo
sage
07.
80
0.9
2.6
7.8
7.8
7.8
7.8
02.
67.
8(g
Nm
−2w
eek−
1)
560∗
64∗
190∗
560∗
560∗
560∗
560∗
190∗
560∗
Moi
stur
eco
nten
t80
.676
.982
.185
.079
.776
.577
.878
.577
.682
.483
.377
.7(%
tota
lwei
ght)
(0.3
)(0
.1)
(0.1
)(0
.1)
(0.2
)(0
.4)
(0.2
)(0
.3)
(0.1
)(0
.2)
(0.4
)(0
.3)
N2O
(nm
olg−
1)
0.48
4.30
0.77
0.66
0.85
36.8
44.2
5.14
177
0.37
1.11
104
(0.0
8)(0
.27)
(0.0
9)(0
.10)
(0.1
7)(4
.1)
(7.4
)(0
.51)
(16)
(0.1
5)(0
.19)
(25)
NH
+ 4(n
mol
g−1)
270
263
1,03
01,
730
1,81
01,
230
3,71
072
62,
920
7233
01,
040
(14)
(12)
(73)
(110
)(1
50)
(15)
(93)
(180
)(2
30)
(12)
(26)
(37)
NO
− 3(n
mol
g−1)
4.2
7.5
n.d.
n.d.
n.d.
600
630
3.1
540
7.2
3.1
210
(1.0
)(1
.0)
(70)
(110
)(0
.5)
(40)
(0.1
)(0
.1)
(30)
15N
-NH
+ 4(%
)0.
419
0.42
00.
423
0.40
20.
400
0.41
50.
385
0.44
60.
390
7.96
2.13
0.94
(0.0
52)
(0.0
46)
(0.0
71)
(0.0
64)
(0.0
83)
(0.0
12)
(0.0
25)
(0.2
48)
(0.0
79)
(0.1
7)(0
.079
)(0
.036
)15
N-N
O− 3
(%)
0.36
70.
367
––
–0.
387
0.38
60.
380
0.38
60.
473
0.37
50.
398
(0.0
02)
(0.0
03)
(0.0
04)
(0.0
01)
(0.0
02)
(0.0
03)
(0.0
02)
(0.0
02)
(0.0
01)
74
2015] Ji et al.: Nitrogen substrate–dependent N2O cycling in salt marsh sediments 75
Sediment cores were collected in August 2012, November 2012, and August 2013 sothat N2O dynamics could be examined in summer and late autumn. The plots where sed-iments were collected during each trip are listed in Table 1. Three to four sediment cores,representing both high and low marsh habitat and primary plant types, were collected fromC, LF, HF, and XF plots. After the roots were carefully removed, sediments from the sameplot were homogenized, and subsamples were used for incubation. Therefore, the sedimentsdo not represent N2O production for a particular habitat but, to a certain extent, the entirefertilized or control plot as a whole. Such an experimental design minimized the effects ofsmall-scale heterogeneity in this complex environment. Additionally, in November 2012,sediments representing different vegetation cover were collected from one of the XF plots.Sampling was performed at daytime low tide when the marsh bed was above water. Approx-imately 15 cm deep sediment cores were collected using 30 cm long, 7 cm diameter acrylictubes with a sharpened edge. Butyl stoppers and rubber caps were used to seal the top andbottom of the acrylic tube storing intact sediment. The intact cores were kept in coolerswith frozen reusable ice gel packs (Techni Ice, Frankston, VIC, Australia) for no more than72 hours before conducting incubations.
b. Sediment incubations
Replicate sediment cores taken from the upper 10 cm of the same fertilized plots werehomogenized and aliquotted (15 ± 0.2 g) into preweighed 30 mL amber serum bottles(Wheaton, Millville, NJ). The bottles were sealed with butyl rubber stoppers and aluminumseals (National Scientific, Rockwood, TN). Two sets of tracer amendments (5 mL injection)were applied. The 15N-NH+
4 treatments received 15N-labeled NH4Cl (99%; CambridgeIsotope Laboratories, Tewksbury, MA) and natural abundance KNO3 (Fisher Scientific,Pittsburgh, PA). The 15N-NO−
3 treatments received 15N-labeled KNO3 (99%; CambridgeIsotope Laboratories) and natural abundance NH4Cl (Fisher Scientific). The initial 15Nlabeling for NH+
4 and NO−3 was usually <1% (Table 1). For NH+
4 , the fraction of substrate15N labeling was calculated, assuming the 15N content of the ambient NH+
4 in sedimentto be close to natural abundance (15N/14N = 0.37%). The 15N labeling for NO−
3 wasmeasured using the denitrifier method (Sigman et al. 2001). After the tracer solution wasadded, the bottles were vortexed with glass beads to distribute the tracers in the sediment.Incubations were performed under atmospheric oxygen headspace in order to simulate thesurface sediment conditions because oxygen is likely to penetrate along with root matricesdown to 10 cm. Incubation experiments lasted 6 to 8 hours at room temperature (22◦C),during which triplicate samples were sacrificed every 2 hours by adding 1 mL of 7 M ZnCl2to terminate biological activity.
A subset of XF sediments from November 2012 incubated under helium headspace wascompared with incubations of the same sediment under an oxygenated headspace in orderto investigate the effect of oxygen on N2O production and consumption. The headspace ofthe incubation bottles was adjusted to a lower oxygen level by purging with ultrahigh-purity
76 Journal of Marine Research [73, 3–4
helium at 4 psi for 20 minutes. After oxygen adjustment, the sediments were incubated,and inorganic nitrogen concentrations were measured in triplicate bottles sacrificed every2 hours by adding 1 mL of 7 M ZnCl2.
c. Analytical methods
Sediment moisture content was determined from the difference between wet and dryweight after drying sediment samples at 65◦C to constant weight. NH+
4 and NO−3 were
extracted from sediments using 2 M KCl after N2O had been measured in the headspace.Slurries were placed on a reciprocal shaker for 30 minutes at 300 rpm, followed by cen-trifugation at 4,000g. The supernatant was filtered (pore size 0.2 μm) and then frozen at−20◦C until analysis. NH+
4 concentration was measured colorimetrically in triplicate usingthe phenol-hypochlorite method (Strickland and Parsons 1968); for 1 mL sample size, thedetection limit was 0.5 μM. Samples with NH+
4 concentrations exceeding 50 μM and 500μM were diluted 10- and 20-fold with 2 M KCl, respectively. Absorbance was measured ona UV-1800 UV-Visible Spectrophotometer (Shimadzu, Kyoto, Japan). NO−
3 concentrationwas measured using a hot (90◦C) acidified vanadium (III) reduction column coupled to aTeledyne Chemiluminescence NO/NOx Analyzer (Model 200E) (Garside 1982; Bramanand Hendrix 1989). Samples (20–100 μL) were injected in triplicate, with a detection limitof 0.1 μM.
Prior to headspace N2O analysis, the serum bottle was vortexed so that N2O in thesediment was equilibrated with the headspace. Thus, when N2O was extracted from theheadspace, it was considered to represent the concentration and isotopic composition of N2Oin the sediment. N2O was extracted from the headspace using a 1 mL (XF samples) or 3 mL(C, LF, and HF samples) plastic syringe (BD Biosciences, San Jose, CA). Concentrations ofN2O in August and November 2012 were measured by electron capture gas chromatography(GC-8A; Shimadzu). The detection limit was 2 pmol N (25◦C, 1 atm). N2O concentrationsfor samples from August 2013 were measured by mass spectrometry (Delta V Plus; ThermoScientific, Waltham, MA), with a detection limit of 0.1 nmol N. N2O 15N/14N isotopicratio (denoted as 15N-N2O hereafter) was measured using mass spectrometry. Calibrationstandards for N2O isotopic ratio, ranging from 0.37 to 1.74 15N atom %, were preparedaccording to the denitrifier method (Sigman et al. 2001), assuming complete conversion ofKNO3 with known 15N/14N isotopic ratio.
The total amount of each nitrogen species was normalized to unit wet weight of sedi-ment. Results were reported as nanomoles per gram of wet homogenized sediment (nmolN g−1). This unit is equivalent to micromoles per liter, assuming the density of the sed-iment slurry was close to that of water. In the same manner, the N2O production andconsumption rates are reported as nanomoles per gram of wet homogenized sediment perhour (nmol N g−1 h−1). Such normalization on a mass basis rather than volume facil-itated the computation of nitrogen transformation rates for comparison across differentsediments.
2015] Ji et al.: Nitrogen substrate–dependent N2O cycling in salt marsh sediments 77
Figure 1. Conceptual model demonstrating nitrogen transformations involved in N2O productionand consumption. Reactions rates rnit , rdenit , and rsink indicate N2O production from NH+
4 , N2Oproduction from NO−
3 , and N2O consumption rates, respectively. Rates are all reported as nmol Ng−1 h−1. Dashed arrows indicate important processes supplying NH+
4 and NO−3 .
d. Model estimation of N2O production and consumption rates
Based on mass balance, a box model (Fig. 1) representing the processes of N2O productionfrom NH+
4 (rnit) and NO−3 (rdenit) and N2O consumption (rsink) was developed. NH+
4 andNO−
3 were the two major dissolved inorganic nitrogen species because NO−2 was below
detection. Both NH+4 and NO−
3 were considered as possible nitrogen substrates for N2O.Even in incubations in the presence of atmospheric oxygen, significant decreases in N2Oconcentration were observed; therefore, consumption of N2O was also considered. Definedas the ratio of 15N over 14N transformation rates for a specific process, isotope effects (α)
associated with N2O production from NH+4 (αnit), production from NO−
3 (αdenit), and N2Oconsumption (αsink) were taken into account because the amended isotope comprised a verysmall fraction of the overall nitrogen pool. According to the compilations by Pérez (2005)and Dawson and Siegwolf (2007), isotope effects associated with N2O production fromNH+
4 ranged from 0.932 to 0.965, production from NO−3 ranged from 0.97 to 0.99, and
N2O consumption ranged from 0.996 to 0.987 in pure culture, soil, and aqueous samples.The values of αnit, αdenit, and αsink in the model simulations were fixed at 0.96, 0.98, and0.99, respectively. In the case of XF sediment from November 2012, varying the valuesof αnit, αdenit, and αsink by 0.03, 0.01, and 0.01, respectively, the percent changes in ratesrelative to the base case were <43%, and generally <30%, which fell within the standard
78 Journal of Marine Research [73, 3–4
Table 2. Descriptions of parameters used in numerical simulations.
Parameter Description Unit
rnit Rate of N2O production from NH+4 nmol N g−1 h−1
rdenit Rate of N2O production from NO−3 nmol N g−1 h−1
rsink Rate of N2O consumption nmol N g−1 h−1
αnit Nitrogen fractionation factor for rnit Unitless, 0.96
αdenit Nitrogen fractionation factor for rdenit Unitless, 0.98
αsink Nitrogen fractionation factor for rsink Unitless, 0.99
N2O Sediment N2O concentration nmol N g−1
15NH+4
14NH+4
NH+4
15N content %
15NO−3
14NO−3
NO−3
15N content %
dN2O
dtChange of N2O concentration with time nmol g−1 h−1
d
(15N2O14N2O
)
dt Change of N2O 15N content with time % h−1
deviations of the Monte Carlo simulations. These approximations will serve as a startingpoint for future in-depth investigation for isotope effects associated with N2O productionand consumption in salt marshes.
The N2O production and consumption rates were prognostically modeled in MATLABusing equations (1) and (2), assuming constant rates during the incubation (see Table 2 fordescriptions of parameters).
dN2O
dt= 0.5 · (rnit + rdenit − rsink) (1)
d(15N2O/14N2O)
dt� 1
[N2O] ·15N2O14N2O
· 0.5 · (−rsink · αsink − rnit − rdenit + rsink)
+ 1
[N2O] · 0.5 ·(
rnit · αnit ·15NH414NH4
+ rdenit · αdenit ·15NO314NO3
)(2)
Equation (1) assumes a mass balance on N2O concentrations controlled by rates of produc-tion and consumption. Equation (2) describes the control of 15N-N2O by rates of productionand consumption, the 15N atom % of NH+
4 and NO−3 , and the isotope effects involved in
N2O production and consumption.
2015] Ji et al.: Nitrogen substrate–dependent N2O cycling in salt marsh sediments 79
Model inputs are 15N content of NH+4 and NO−
3 , and 15N-N2O measured at each timepoint. A grid search was performed for rnit, rdenit, and rsink whereby the cost functionwas the mean-squared residual between the measured and the modeled values from N2Oconcentration and isotope values from 15N-NO−
3 and 15N-NH+4 treatments. The inverse of
the standard deviation of the residual between modeled results and measurements was usedas a weighting coefficient to normalize each cost component to similar magnitudes (seesupplementary material available online). By assigning initial conditions listed in Table 2and calculating the minimum cost function, the N2O production rate from NH+
4 (rnit) andNO−
3 (rdenit) and N2O consumption (rsink) were determined. To assess errors associated withmodeled rates, a Monte Carlo simulation (n = 10,000) was run for each incubation; thesimulations were generated from Gaussian distributions with the same mean and varianceas the measured data set.
3. Results
a. Sediment characteristics
Sediments collected from the top 10 cm of the marsh changed color with depth, from darkbrown to black. Root matrices penetrated deeper than 10 cm, with C and XF sediment havingthe most (65% weight to weight ratio [w/w]) and least (26% w/w) vegetative materials.After the stems and roots of marsh vegetation were removed and the remaining sedimentwas homogenized, pore water content averaged ∼80% by weight (Table 1).
NH+4 concentration, in most cases, increased with fertilization level and in all plots
exceeded NO−3 concentration. Within the same fertilized plot, NH+
4 concentrations in Augustwere generally lower than in November (Table 1). NO−
3 concentrations were similar amongC, LF, and HF plots, usually <8 nmol g−1, but were two orders of magnitude higher (>500nmol g−1) in XF, XF-m, and XF-d sediment. In November 2012, XF-m and XF-d had >500nmol N g−1 NO−
3 , whereas XF-t had <5 nmol N g−1 NO−3 . The homogenized XF sediment
(XF) consisted of 45% (w/w) of XF-m, 38% of XF-t, and 17% of XF-d and had NO−3
concentrations of ∼600 nmol N g−1. Nitrite was not detected in any sediment samples.NH+
4 plus NO−3 increased with increasing fertilization (Table 1). N2O concentrations were
similar (<1.2 nmol g−1) in C, LF, and HF sediment ,whereas XF sediment had elevatedN2O concentrations ranging from 4.3 nmol g−1 in August 2012 to 177.3 nmol g−1 in XF-din November 2012.
b. Change of inorganic nitrogen with time during incubations of C and XF
The greatest contrast in the biogeochemistry in the salt marsh was observed betweenC and XF plots (Fig. 2); therefore, results from C and XF incubations are the focus ofSections 3b and c (for the complete data set, see Fig. S1 in the supplementary material).NH+
4 concentrations in C incubations from November 2012 and August 2013 did not changesignificantly (P = 0.18 and 0.88, respectively, analysis of variance [ANOVA]) during the 8-hour incubation. XF sediments collected in August 2013 were the only incubation in which
80 Journal of Marine Research [73, 3–4
Figure 2. Time courses of NH+4 , NO−
3 , and N2O concentrations during incubation experiments of Cand XF sediments under atmospheric oxygen headspace. The concentrations of NH+
4 , NO−3 , and
N2O in sediment are normalized to one gram of wet sediment. Time zero indicates the moment ofadding tracer solutions. (a) C sediment; (b) XF sediment. NH+
4 , NO−3 , and N2O concentrations are
shown in upper, middle, and lower panels, respectively.
2015] Ji et al.: Nitrogen substrate–dependent N2O cycling in salt marsh sediments 81
NH+4 concentration showed a net increase after 8 hours. XF generally had higher initial NO−
3concentrations than C. Sediments from both C and XF plots that were incubated underatmospheric oxygen level had significant decreases in NO−
3 concentrations, suggestingactive denitrification. Net NO−
3 consumption rates ranged from ∼0.1 nmol N g−1 h−1
in C from August 2013 to ∼80 nmol N g−1 h−1 in XF from November 2012 and evenhigher (>100 nmol N g−1 h−1) during the first 2 hours of incubation in XF from August2013. Changes in N2O concentration with time displayed different patterns with season. InNovember 2012, neither C nor XF incubations had significant change (P > 0.1, ANOVA)in N2O concentrations, whereas in August 2013, N2O concentrations decreased in bothincubations. In the shorter incubation (3 hours) from August 2012, N2O concentrationdecreased, but the trend was less pronounced.
c. Change of 15N − N2O with time in 15N-NH4 and 15N-NO3 treatments duringincubations of C and XF in November 2012
N2O concentration did not change significantly in C and XF sediment; however, theincrease in 15N2O indicates N2O production. In 15N-NH+
4 treatments in November 2012,15N-N2O increased in both C and XF (middle panels of Fig. 3a and b). In 15N-NO3 treat-ments, 15N-N2O also increased in XF. In C 15N-NO3 treatments, however, the 15N-N2Opool was already enriched to 0.398 atom % (natural abundance = 0.367 atom %) at 30minutes, but 15N-N2O then decreased from 30 minutes to the end of the incubation (middlepanels of Fig. 3a and b).
Both of these 15N-N2O patterns in 15N-NO−3 treatments were also observed in other
incubation experiments (Fig. S2b in the supplementary material), with low sediment NO−3
concentration correlating with decreasing 15N-N2O and vice versa.
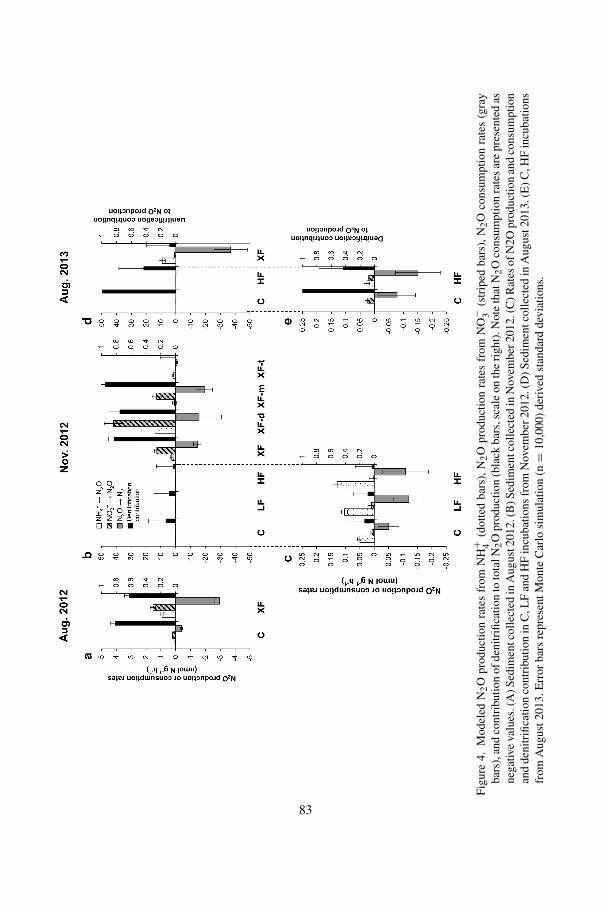
d. Modeled N2O production rates
Model simulations of N2O concentrations and N2O isotope data were used to derivethe N2O production and consumption rates (Fig. 4). Even though there was no significantchange in N2O concentration in some cases (e.g., C and XF from November 2012 in Fig.3), simultaneous N2O production and consumption occurred in all experiments.
N2O production rates from NH+4 were 0.05 ± 0.01 and 0.9 ± 0.1 nmol N g−1 h−1 in
August 2012 C and XF sediment, respectively (Fig. 4a). N2O production from NO−3 was
greater than that from NH+4 ; rates were 0.2 ± 0.02 and 1.5 ± 0.2 nmol N g−1 h−1 in C and
XF sediment, respectively. In November 2012, N2O production rates from XF sedimentsranged from 1.7 nmol N g−1 h−1 in XF-t to 55 nmol N g−1 h−1 in XF-d (Fig. 4b), oneto two orders of magnitude higher than C, LF, and HF sediments, in which rates weregenerally <0.15 nmol N g−1 h−1 (Fig. 4c). When NO−
3 was present at low to undetectableconcentrations (C, LF, and HF), N2O production was dominated by NH+
4 oxidation; whenNO−
3 was abundant (XF, XF-d, and XF-m), N2O production rates from NO−3 were 12–42
nmol N g−1 h−1, 3 to 15 times higher than N2O production rates from NH+4 , indicating
82 Journal of Marine Research [73, 3–4
Figure 3. Time courses of N2O concentration and 15N-N2O during incubation experiment underoxygenated headspace. Time zero indicates the moment of adding tracer solutions. (a) C sedimentfrom November 2012. (b) XF sediment from November 2012. Filled circles (from 15N-NH+
4treatment) and triangles (from 15N-NO−
3 treatment) represent measurements; solid lines represent“best fit” of model simulation; shaded areas represent 95% confidence band for model simulations.Evolution of N2O concentration in sediment is shown in the upper two panels; 15N-N2O evolution in15N-NH4 treatment and 15N-NO3 treatment is shown in the middle and lower panels, respectively.See Figure S3 (in the supplementary material) for the complete set of model simulations.
denitrification as the major production pathway. In XF-t where NO−3 was low (∼3 nmol
g−1; Fig. S1 in the supplementary material) throughout the incubation period, unlike theother XF samples, N2O production from NO−
3 was very low (<0.05 nmol N g−1 h−1), andNH+
4 was the dominant source of N2O, with a production rate of 1.7 ± 0.1 nmol N g−1
h−1. In August 2013 (Fig. 4d), XF sediment had much higher N2O production rates than Cand HF sediments. XF sediment had an initial NO−
3 concentration of 214 nmol g−1, but the
Figu
re4.
Mod
eled
N2O
prod
uctio
nra
tes
from
NH
+ 4(d
otte
dba
rs),
N2O
prod
uctio
nra
tes
from
NO
− 3(s
trip
edba
rs),
N2O
cons
umpt
ion
rate
s(g
ray
bars
),an
dco
ntri
butio
nof
deni
trifi
catio
nto
tota
lN2O
prod
uctio
n(b
lack
bars
,sca
leon
the
righ
t).N
ote
that
N2O
cons
umpt
ion
rate
sar
epr
esen
ted
asne
gativ
eva
lues
.(A
)Sed
imen
tcol
lect
edin
Aug
ust2
012.
(B)S
edim
entc
olle
cted
inN
ovem
ber2
012.
(C)R
ates
ofN
2Opr
oduc
tion
and
cons
umpt
ion
and
deni
trifi
catio
nco
ntri
butio
nin
C,L
Fan
dH
Fin
cuba
tions
from
Nov
embe
r201
2.(D
)Sed
imen
tcol
lect
edin
Aug
ust2
013.
(E)C
,HF
incu
batio
nsfr
omA
ugus
t201
3.E
rror
bars
repr
esen
tMon
teC
arlo
sim
ulat
ion
(n=
10,0
00)
deri
ved
stan
dard
devi
atio
ns.
83
84 Journal of Marine Research [73, 3–4
concentration dropped significantly to <3 nmol g−1 in the first 2 hours of incubation andmaintained a low NO−
3 concentration for the remainder of the incubation (Fig. 2b, middlepanel). Thus, from 2 hours onward, nitrification became the major N2O production pathway,at a rate of 11.7 nmol N g−1 h−1. N2O production was mainly from NO−
3 in C at a rate of<0.03 nmol N g−1 h−1. Similar N2O production rates occurred in HF, where both NH+
4and NO−
3 served as nitrogen sources (Fig. 4e).N2O production rates from NH+
4 and NO−3 were used to calculate relative contributions
of nitrification and denitrification to N2O production. The fraction of N2O produced fromdenitrification in each experiment is shown in Figure 4. Except for C sediment collectedin August 2013, all samples showed N2O production from NH+
4 . In C, LF, HF, and XF-tsediment from November 2012, where NO−
3 was low or undetectable, NH+4 was the major
nitrogen source. When NO−3 was present (>3 nmol g−1), for example, in XF, XF-d, and
XF-m from November 2012, the majority of N2O was produced from NO−3 .
e. Modeled N2O consumption rates and the effect of oxygen on N2O and NO−3
consumption
It is interesting to note that net N2O consumption occurred in some incubations underatmospheric oxygen headspace, as shown by decreasing N2O concentration (Fig. 2, lowerpanels; and Fig. S3 in the supplementary material). Sediments collected in August 2012 and2013 showed greater N2O consumption than production (Fig. 4a and d). N2O consumptionrates in November 2012 sediments were generally similar to or lower than production rates(Fig. 4b and c). N2O consumption rates were higher in XF than in other plots; the lowestwas 1 nmol N g−1 h−1 (XF-t from November 2012), and the peak was at ∼40 nmol N g−1
h−1 in XF from August 2013. N2O consumption rates for C, LF, and HF were generally<0.2 nmol N g−1 h−1, one to two orders of magnitude lower than XF.
The subset of XF sediment from November 2012 incubated under helium headspacewas compared with incubations under oxygenated headspace (Fig. 5). In helium headspace(−O2) incubations, after NO−
3 depletion, N2O concentration decreased significantly to <5nmol g−1 between 2.3 and 4.8 h, at a rate of ∼25 nmol N g−1 h−1 (Fig. 5, upper panel).Lower N2O consumption rate (∼15 nmol N g−1 h−1) was modeled when incubated withatmospheric oxygen (+O2) in the presence of NO−
Salt marsh sediment is potentially a net N2O source to the atmosphere via nitrificationand denitrification. These microbial processes depend on availabilities of NH+
4 and NO−3
for nitrogen sources. Because NH+4 oxidation requires oxygen and NO−
3 reduction doesnot, strong redox gradients in the sediment allow N2O production via NH+
4 oxidation,NO−
3 reduction to N2O, and N2O consumption to co-occur. In Great Sippewissett Marsh,
2015] Ji et al.: Nitrogen substrate–dependent N2O cycling in salt marsh sediments 85
Figure 5. Time courses of N2O and NO−3 concentrations during incubation experiment for XF
sediment from November 2012, under low oxygen and atmospheric headspaces. Upper panel:headspace purged with helium to remove oxygen (labeled “−O2”); lower panel: atmospheric oxy-gen headspace (labeled “+O2”). The concentrations of NO−
3 and N2O in sediment are normalizedto one gram of wet sediment.
sediment has been subjected to long-term fertilization, resulting in elevated N2O productionand consumption rates.
a. Inorganic nitrogen availability controls nitrogen sources for N2O production
Results from incubation experiments showed that when NO−3 concentration was low or
undetectable (e.g., C, LF, HF, and XF-t from November 2012), NH+4 was the dominant
nitrogen substrate for N2O production, supported by the increase of 15N-N2O in 15N-NH+4
treatments (Fig. 3a). In 15N-NO−3 treatments, the decrease of 15N-N2O from initial 15N
enrichment indicated that NH+4 , which was not labeled with 15N, contributed nitrogen to
N2O. Model simulations confirmed that NH+4 oxidation alone could explain the progres-
sive enrichment of N2O with 15N in 15N-NH+4 treatments, as well as dilution by 14N from
unlabeled NH+4 in 15N-NO−
3 treatments (Fig. 3a). When NO−3 was present throughout the
incubation experiment, for example, XF, XF-d, and XF-m sediment from November 2012
86 Journal of Marine Research [73, 3–4
where NO−3 >500 nmol g−1 (Table 2), both NO−
3 and NH+4 were nitrogen substrates for
N2O production, as indicated by simultaneous increase in 15N-N2O in both 15N-NH+4 and
15N-NO−3 treatments (Fig. 3b). Model simulation showed that the major nitrogen source
compound for N2O was NO−3 , presumably as a consequence of active denitrification, con-
sistent with the observed decrease in NO−3 concentration (Fig. 2b).
The nitrogen substrate determination provides insights into N2O production pathways.As a product of heterotrophic remineralization, NH+
4 was always present at high concen-trations (>70 nmol g−1). In sediment with low NO−
3 concentrations, such as C, LF, andHF sediments, NH+
4 was the major substrate for N2O production. Thus, it appears that theN2O production pathways supported by NH+
4 oxidation, such as nitrifier denitrification andcoupled nitrification-denitrification (Wrage et al. 2001), are responsible. NO−
3 could be sup-plied by fertilizer or potentially by nitrification (Kaplan, Valiela, and Teal 1979), or fromgroundwater discharge (Valiela and Teal 1979). Current incubation experiments showeddenitrification was responsible for the majority of N2O production in sediments with highNO−
3 concentration (∼500 nmol g−1), despite NH+4 being the major form of inorganic nitro-
gen. This suggests that NO−3 availability may be an indicator of N2O production pathways
in these sediments, consistent with short-term NO−3 addition stimulating N2O emission as
reported by Moseman-Valtierra et al. (2011). Further research could investigate the relativephysiological advantage between nitrification and denitrification in these sediments underdifferent NO−
3 availabilities to test how N2O production pathways are regulated.
b. The control of N2O production and consumption by oxygen
Oxygen concentration, which is spatially and temporally variable in tidal marshes,regulates N2O production and consumption. When incubated under atmospheric oxygenheadspace, NH+
4 oxidation, NO−3 reduction, and N2O consumption were detected. In XF
sediment from November 2012, N2O production was balanced by consumption, as indicatedby no significant change in headspace N2O concentrations over the course of the incubation.The significant decrease in N2O concentration under low oxygen conditions suggested ele-vated N2O consumption and decreased N2O production, because once oxygen was removedfrom the headspace, NH+
4 oxidation ceased so that NO−3 became the only possible nitrogen
source for N2O production. As nitrification ceased and thus no more NO−3 was produced,
denitrification resulted in a net loss of NO−3 , and eventually NO−
3 was depleted. Greater netconsumption of N2O followed because (1) there was no NH+
4 oxidation producing N2O,(2) depletion of NO−
3 prevented an additional N2O source, and (3) N2OR was relieved fromoxygen inhibition; this was confirmed by the elevated N2O consumption rate discussed inSection 3e.
As the plants’ roots penetrate deeper than 10 cm, sediments collected for incubationexperiments are likely to experience molecular oxygen supplied from tidal water as wellas diffusion from air. In August, actively growing S. alterniflora oxidizes the sediment(Howes et al. 1981), potentially favoring the growth of aerobes and aerobic metabolism.
2015] Ji et al.: Nitrogen substrate–dependent N2O cycling in salt marsh sediments 87
Because incubation experiments were performed in a closed system with limited oxygen,such active aerobic processes would lower the oxygen concentration in sediment, allowingN2O consumption to occur. This could be the reason that N2O consumption exceededproduction during incubation in August (Fig. 4a, d, and e). In November, growth of S.alterniflora ceases and in situ remineralization supports the growth of denitrifiers. Whenincubation was performed in the absence of oxygen, NO−
3 and N2O were consumed in afew hours, indicating the presence of active denitrifiers. When oxygen was present in theheadspace, oxygen inhibition of N2OR decreased N2O consumption rates. Further studiesfocused on the effects of oxygen availability on activities of nitrifiers and denitrifiers on atidal cycle as well as seasonal cycle would provide more insight into N2O fluxes in thesetime frames.
c. Nitrogen loading affects the N2O production rates
As demonstrated in this study, increased N2O production and consumption rates corre-late with nitrogen loading from fertilizer. This is probably because fertilizer input enhancesplant growth, and subsequent accumulation of above- and belowground biomass providesnutrients and electron donors to support nitrogen metabolisms, including denitrification(Hamersley and Howes 2005; Koop-Jakobsen and Giblin 2010). It should be noted thatintermediate nitrogen loading (LF and HF plots), though already higher than the nitrogenloading of the vast majority of New England salt marshes, did not significantly increasesediment N2O concentrations. Only XF plots, where the nitrogen loading is more than40 times higher than background, showed significantly elevated N2O concentrations. Thisindicates that elevated nitrogen loading at low to intermediate levels does not necessar-ily enhance N2O production. Thus, denitrification is likely important in the consump-tion of N2O. This is consistent with the finding of Lee et al. (1997) who showed thatthe emission ratio of N2O:N2 in marsh sediment is lower under higher nitrogen loadingand called for future studies targeting the variability of N2O:N2 emissions in salt marshsediment.
Increasing nitrogen loading from fertilization also resulted in changes in the relative con-tribution from NH+
4 versus NO−3 to N2O production. Fertilization results in higher NO−
3availability from fertilizer and possibly from NH+
4 oxidation, thus increasing NO−3 avail-
ability to support NO−3 reduction to N2O. As N2O yield during denitrification is generally
higher than that of nitrification (Bange 2008), it is likely that NO−3 reduction to N2O becomes
the major production pathway when denitrification occurs. This was observed in XF plotsexcept XF-t from November 2012. In sediments with low fertilizer supply and in XF-t fromNovember 2012, NH+
4 was the dominant inorganic nitrogen form and NO−3 was present at
low concentration because of rapid turnover by denitrification and tidal efflux (Brin et al.2010). Therefore, the majority of N2O was produced via NH+
4 oxidation. Unlike all otherXF samples, XF-t behaved more like the lower fertilized samples. NO−
3 concentration waslow in XF-t in November 2012 possibly because of its lower elevation, which is subjected to
88 Journal of Marine Research [73, 3–4
more frequent tidal exchange. Thus, N2O production was dominated by NH+4 oxidation; the
production and consumption rate (∼1 nmol N g−1 h−1) was an order of magnitude higherthan rates in lower fertilization plots (∼0.1 nmol N g−1 h−1).
Studies conducted in New England salt marshes (e.g., Great Sippewissett Marsh and PlumIsland Estuary) have shown that decadal-scale elevated fertilizer input promotes the removalof excess nitrogen via denitrification (Hamersley and Howes 2005; Koop-Jakobsen andGiblin 2010). However, many adverse effects are reported, such as increasing NO−
3 exportto the adjacent estuary (Brin et al. 2010), subsidence of marsh surface because of reductionof organic matter accumulation (Turner et al. 2009), loss of marsh coverage because ofreduced stability of sediment-root matrices and sea-level rise (Deegan et al. 2012), andgreater N2O production, as demonstrated in this study.
d. Factors in interpretation of experimental and model results in the actual environment
Homogenization of the sediment for these incubation experiments greatly altered theconditions to which organisms were exposed. Because this disruption occurred in all exper-iments, it should not obscure the treatment effect of different fertilizer levels. During thehandling of sediment, availabilities of inorganic nitrogen might have changed because ofactive nitrification and denitrification. Exposing the sediment under atmospheric oxygenheadspace may have partially inhibited denitrifiers, leading to underestimation of the reduc-tion of NO−
3 or N2O, as well as overestimation of nitrification. Despite homogenization inatmospheric oxygen, however, both nitrifiers and denitrifiers were apparently still active inthe incubations, as shown by the simultaneous increase of 15N-N2O in both 15N-NH+
4 and15N-NO−
3 treatments (Fig. 3b). Thus, 15N tracer incubation experiments identified potentialpathways and rates for N2O production and consumption. Also, incubation with homoge-nized sediment allowed the isolation of the intercorrelated variables, such as fertilization,plant biomass, and sediment inorganic nitrogen levels, which was necessary to discern thedependence of N2O production on environmental factors.
The model simulation in this study is capable of distinguishing nitrogen source com-pounds for N2O production but cannot determine the exact biochemical pathways involved.Even though there was coupling between nitrification and denitrification, during whichnitrogen was transferred from NH+
4 to NO−3 and to N2O, the data did not specify the path-
way by which the transfer occurred. It may be possible in the future to use the dual isotopeapproach, combining 18O as another tracer to identify the pathways (Kool, Van Groenigen,and Wrage 2011). The model parameterization in this study, using constant N2O productionand consumption rates, adequately described the majority of the experimental data. How-ever, NH+
4 oxidation, NO−3 reduction, and N2O reduction are enzymatic processes, often
assumed to follow Michaelis-Menten kinetics. The use of concentration-dependent nitrogentransformation rates may simulate the observations more accurately in the few incubationsin which concentrations changed appreciably, notably the XF experiment in August 2013. Inthis experiment, the N2O concentration decreased, which probably caused the rate of N2O
2015] Ji et al.: Nitrogen substrate–dependent N2O cycling in salt marsh sediments 89
consumption to decrease, and this was poorly represented by concentration-independentmodeled rates (Fig. S3 in the supplementary material).
In C sediment from November 2012, N2O was rapidly (i.e., by the first time point)enriched with 15N in the 15NO3 treatment, whereas there was no initial 15N enrichmentof N2O observed in the 15N-NH+
4 treatment. Similar observations have been reported byStevens et al. (1997), who attributed such phenomena to 15NO−
2 impurity in 15NO−3 tracer,
and 15NO−2 rather than 15NO−
3 underwent rapid chemical reduction to N2O. However, theamount of 15NO−
2 impurity in the 15NO−3 tracer used in this study was 80 ppm, which was
not sufficient to enrich the initial 15N-N2O to the observed level. The reason for this initialenrichment was not fully understood and requires further investigation.
Potential rates of N2O production from NH+4 and NO−
3 under controlled environmentalconditions were shown in this study. To further investigate in situ N2O production in naturalsalt marshes, nonintrusive methods such as in situ incubations coupled with flux chambers(Moseman-Valtierra et al. 2011), or evaluation of N2O isotopic signatures from differentproduction pathways, would be necessary.
5. Conclusion
Coastal salt marshes play an important role in the removal of land-derived excess nitro-gen via several microbial processes that produce N2O. Using 15N tracer incubations andnumerical modeling, the availabilities of inorganic nitrogen and oxygen and nitrogen load-ing were the controlling factors of N2O production and consumption. NO−
3 was the majornitrogen substrate for N2O production under high NO−
3 concentrations, and NH+4 was the
dominant nitrogen source under low NO−3 concentrations. Oxygen was critical in regulating
N2O consumption, which was enhanced in incubations under anoxic headspace. Decadal-scale fertilization increased sediment NH+
4 and NO−3 concentrations; plots with the highest
fertilization had significantly higher rates of N2O production and consumption than control.Therefore, increasing anthropogenic nitrogen loading will increase nitrogen substrate avail-abilities and nitrogen transformation rates, and thus, N2O flux from salt marshes is likely toincrease. Short-term, high fluxes of N2O are possible if N2O production and consumptiondecouple as a consequence of coastal eutrophication.
Acknowledgments. The authors are indebted to the owners of salt marsh parcels, Salt Pond Sanc-tuaries and Dr. E. F. X. Hughes, for allowing us to have access to the experimental plots withintheir properties. We gratefully acknowledge those responsible for the establishment of the long-termexperimental plots, which made these experiments possible. The fertilization experiment at the GreatSippewissett Marsh started with a collaboration between Ivan Valiela and John Teal. In recent years,Brian Howes and Dale Goehringer have maintained the fertilization plots, with funding support fromthe National Science Foundation (NSF; OCE-0453292, DEB-0516430 to I. Valiela). The authorsthank John Angell and Patrick Kearns for their support during sample collection.
In the preparation of this manuscript, the authors acknowledge Frederik Simons for significantadvice on numerical modeling and optimization, and François Morel and Daniel Sigman for their
90 Journal of Marine Research [73, 3–4
helpful advice and discussions on this manuscript. The manuscript was greatly improved by sugges-tions from two anonymous reviewers. This work was funded by the NSF (DEB-1019624 to BBW andJLB).
REFERENCES
Arp, D. J., and L. Y. Stein. 2003. Metabolism of inorganic N compounds by ammonia-oxidizingbacteria. Crit. Rev. Biochem. Mol. Biol., 38(6), 471–495.
Bange, H. W. 2008. Gaseous nitrogen compounds (NO, N2O, N2, NH3) in the ocean, in Nitrogenin the Marine Environment, 2nd ed., D. G. Capone, D. A. Bronk, M. R. Mulholland, and E. J.Carpenter, eds. Burlington, MA: Academic Press, 51–94.
Bange, H. W., S. Rapsomanikis, and M. O. Andreae. 1996. Nitrous oxide in coastal waters. GlobalBiogeochem. Cycles, 10(1), 197–207.
Blackwell, M. S. A., S. Yamulki, and R. Bol. 2010. Nitrous oxide production and denitrification ratesin estuarine intertidal saltmarsh and managed realignment zones. Estuarine, Coastal Shelf Sci.,87(4), 591–600.
Bonin, P., M. Gilewicz, and J. C. Bertrand. 1989. Effects of oxygen on each step of denitrification onPseudomonas nautica. Can. J. Microbiol., 35(11), 1061–1064.
Bowen, J. L., J. E. K. Byrnes, D. Weisman, and C. Colaneri. 2013. Functional gene pyrosequencingand network analysis: An approach to examine the response of denitrifying bacteria to increasednitrogen supply in salt marsh sediments. Front. Microbiol., 4, 342. doi: 10.3389/fmicb.2013.00342
Bowen, J. L., and I. Valiela. 2001. Historical changes in atmospheric nitrogen deposition to CapeCod, Massachusetts, USA. Atmos. Environ., 35(6), 1039–1051.
Braman, R. S., and S. A. Hendrix. 1989. Nanogram nitrite and nitrate determination in environmentaland biological materials by vanadium(III) reduction with chemiluminescence detection. Anal.Chem., 61(24), 2715–2718.
Brin, L. D., I. Valiela, D. Goehringer, and B. Howes. 2010. Nitrogen interception and export byexperimental salt marsh plots exposed to chronic nutrient addition. Mar. Ecol.: Prog. Ser., 400,3–17.
Cicerone, R. J. 1987. Changes in stratospheric ozone. Science, 237(4810), 35–42.Crutzen, P. J. 1970. The influence of nitrogen oxides on the atmospheric ozone content. Q. J. R.
Meteorol. Soc., 96(408), 320–325.Dawson, T. E., and R. T. W. Siegwolf. 2007. Using stable isotopes as indicators, tracers, and recorders
of ecological change: Some context and background, in Terrestrial Ecology, Vol. 1, Stable Isotopesas Indicators of Ecological Change, T. E. Dawson and R. T. W. Siegwolf, eds. Amsterdam: Elsevier,1–18.
Deegan, L. A., D. S. Johnson, R. S. Warren, B. J. Peterson, J. W. Fleeger, S. Fagherazzi, and W. M.Wollheim. 2012. Coastal eutrophication as a driver of saltmarsh loss. Nature, 490, 388–392.
Fox, L., I. Valiela, and E. L. Kinney. 2012. Vegetation cover and elevation in long-term experimentalnutrient-enrichment plots in Great Sippewissett salt marsh, Cape Cod, Massachusetts: Implicationsfor eutrophication and sea level rise. Estuaries Coasts, 35(2), 445–458.
Garside, C. 1982. A chemiluminescent technique for the determination of nanomolar concentrationsof nitrate and nitrite in seawater. Mar. Chem., 11(2), 159–167.
Hamersley, M. R., and B. L. Howes. 2005. Coupled nitrification–denitrification measured in situ in aSpartina alterniflora marsh with a 15NH+
4 tracer. Mar. Ecol.: Prog. Ser., 299, 123–135.Hamlett, N. V. 1986. Alteration of a salt marsh bacterial community by fertilization with sewage
sludge. Appl. Environ. Microbiol., 52, 915–923.
2015] Ji et al.: Nitrogen substrate–dependent N2O cycling in salt marsh sediments 91
Howes, B. L., J. W. H. Dacey, and D. D. Goehringer. 1986. Factors controlling the growth form ofSpartina alterniflora: Feedbacks between above-ground production, sediment oxidation, nitrogenand salinity. J. Ecol., 74(3), 881–898.
Howes, B. L., R. W. Howarth, J. M. Teal, and I. Valiela. 1981. Oxidation-reduction potentials in asalt marsh: Spatial patterns and interactions with primary production. Limnol. Oceanogr., 26(2),350–360.
Intergovernmental Panel on Climate Change (IPCC). 2013. Carbon and other biogeochemical cycles,in Climate Change 2013: The Physical Science Basis. Contribution of Working Group I to theFifth Assessment Report of the Intergovernmental Panel on Climate Change, T. F. Stocker, D. Qin,G.-K. Plattner, M. Tignor, S. K. Allen, J. Boschung, A. Nauels, Y. Xia, V. Bex, and P. M. Midgley,eds. Cambridge, UK: Cambridge University Press, 465–570.
Kaplan, W., I. Valiela, and J. M. Teal. 1979. Denitrification in a salt marsh ecosystem. Limnol.Oceanogr., 24(4), 726–734.
Kinney, E. L., and I. Valiela. 2013. Changes in δ15N in salt marsh sediments in a long-term fertilizationstudy. Mar. Ecol.: Prog. Ser., 477, 41–52.
Kool, D. M., J. W. Van Groenigen, and N. Wrage. 2011. Source determination of nitrous oxide basedon nitrogen and oxygen isotope tracing: dealing with oxygen exchange, in Methods in Enzymology,Vol. 496, Research on Nitrification and Related Processes, Part B, M. G. Klotz and L. Y. Stein,eds. Burlington, MA: Academic Press, 139–160.
Koop-Jakobsen, K., and A. E. Giblin. 2010. The effect of increased nitrate loading on nitrate reductionvia denitrification and DNRA in salt marsh sediments. Limnol. Oceanogr., 55(2), 789–802.
Körner, H., and W. G. Zumft. 1989. Expression of denitrification enzymes in response to the dissolvedoxygen level and respiratory substrate in continuous culture of Pseudomonas stutzeri. Appl. Env-iron. Microbiol., 55(7), 1670–1676.
Lee, R. Y., S. B. Joye, B. J. Roberts, and I. Valiela. 1997. Release of N2 and N2O from salt-marshsediments subject to different land-derived nitrogen loads. Biol. Bull., 193, 292–293.
Moseman-Valtierra, S. 2012. Reconsidering climatic roles of marshes: Are they sinks or sources ofgreenhouse gases? in Marshes: Ecology, Management and Conservation, D. C. Abreu and S. L. deBorbón, eds. New York: Nova Science, 1–48.
Moseman-Valtierra, S., R. Gonzalez, K. D. Kroeger, J. Tang, W. C. Chao, J. Crusius, J. Bratton, A.Green, and J. Shelton. 2011. Short-term nitrogen additions can shift a coastal wetland from a sinkto a source of N2O. Atmos. Environ., 45(26), 4390–4397.
Pérez, T. 2005. Factors that control the isotopic composition of N2O from soil emissions, in StableIsotopes and Biosphere-Atmosphere Interactions, L. B. Flanagan, J. R. Ehleringer, and D. E. Pataki,eds. San Diego, CA: Academic Press, 69–84.
Ravishankara, A. R., J. S. Daniel, and R. W. Portmann. 2009. Nitrous oxide (N2O): The dominantozone-depleting substance emitted in the 21st century. Science, 326(5949), 123–125.
Santoro, A. E., C. Buchwald, M. R. McIlvin, and K. L. Casciotti. 2011. Isotopic signature of N2Oproduced by marine ammonia-oxidizing archaea. Science, 333(6047), 1282–1285.
Schilt, A., M. Baumgartner, T. Blunier, J. Schwander, R. Spahni, H. Fischer, and T. F. Stocker. 2010.Glacial–interglacial and millennial-scale variations in the atmospheric nitrous oxide concentrationduring the last 800,000 years. Quat. Sci. Rev., 29(1–2), 182–192.
Seitzinger, S. P., and C. Kroeze. 1998. Global distribution of nitrous oxide production and N inputsin freshwater and coastal marine ecosystems. Global Biogeochem. Cycles, 12(1), 93–113.
Sigman, D. M., K. L. Casciotti, M. Andreani, C. Barford, M. Galanter, and J. K. Böhlke. 2001. Abacterial method for the nitrogen isotopic analysis of nitrate in seawater and freshwater. Anal.Chem., 73(17), 4145–4153.
92 Journal of Marine Research [73, 3–4
Stevens, R. J., R. J. Laughlin, L. C. Burns, J. R. M. Arah, and R. C. Hood. 1997. Measuring thecontributions of nitrification and denitrification to the flux of nitrous oxide from soil. Soil Biol.Biochem., 29(2), 139–151.
Strickland, J. D. H., and T. R. Parsons. 1968. A Practical Handbook of Seawater Analysis. Bulletinof Fisheries Research Board of Canada, no. 167. Ottawa, ON, Canada: Fisheries Research Boardof Canada, 311 pp.
Turner, R. E., B. L. Howes, J. M. Teal, C. S. Milan, E. M. Swenson, and D. D. Goehringer-Toner.2009. Salt marshes and eutrophication: An unsustainable outcome. Limnol. Oceanogr., 54(5),1634–1642.
Valiela, I., and J. M. Teal. 1979. The nitrogen budget of a salt marsh ecosystem. Nature, 280(5724),652–656.
Valiela, I., J. M. Teal, and W. Sass. 1973. Nutrient retention in salt marsh plots experimentally fertilizedwith sewage sludge. Estuarine Coastal Mar. Sci., 1(3), 261–269.
Valiela, I., J. M. Teal, and W. J. Sass. 1975. Production and dynamics of salt marsh vegetationand the effects of experimental treatment with sewage sludge. Biomass, production and speciescomposition. J. Appl. Ecol., 12(3), 973–981.Wrage, N., G. L. Velthof, M. L. van Beusichem, andO. Oenema. 2001. Role of nitrifier denitrification in the production of nitrous oxide. Soil Biol.Biochem., 33(12–13), 1723–1732.