Electronic Research Archive of Blekinge Institute of Technology http://www.bth.se/fou/ This is an author produced version of a journal paper. The paper has been peer-reviewed but may not include the final publisher proof-corrections or journal pagination. Citation for the published Journal paper: Title: Author: Journal: Year: Vol. Issue: Pagination: URL/DOI to the paper: Access to the published version may require subscription. Published with permission from:
Transcript
Electronic Research Archive of Blekinge Institute of Technology
http://www.bth.se/fou/
This is an author produced version of a journal paper. The paper has been peer-reviewed but
may not include the final publisher proof-corrections or journal pagination.
Citation for the published Journal paper:
Title:
Author:
Journal:
Year:
Vol.
Issue:
Pagination:
URL/DOI to the paper:
Access to the published version may require subscription.
Published with permission from:
Shahid et al. EURASIP Journal on Image and Video Processing 2014, 2014:40http://jivp.eurasipjournals.com/content/2014/1/40
REVIEW Open Access
No-reference image and video qualityassessment: a classification and review ofrecent approachesMuhammad Shahid*, Andreas Rossholm, Benny Lövström and Hans-Jürgen Zepernick
Abstract
The field of perceptual quality assessment has gone through a wide range of developments and it is still growing.In particular, the area of no-reference (NR) image and video quality assessment has progressed rapidly during the lastdecade. In this article, we present a classification and review of latest published research work in the area of NR imageand video quality assessment. The NR methods of visual quality assessment considered for review are structured intocategories and subcategories based on the types of methodologies used for the underlying processing employed forquality estimation. Overall, the classification has been done into three categories, namely, pixel-based methods,bitstream-based methods, and hybrid methods of the aforementioned two categories. We believe that the reviewpresented in this article will be helpful for practitioners as well as for researchers to keep abreast of the recentdevelopments in the area of NR image and video quality assessment. This article can be used for various purposessuch as gaining a structured overview of the field and to carry out performance comparisons for the state-of-the-artmethods.
Keywords: No-reference; Image quality assessment; Video quality assessment; Perceptual quality
1 Review1.1 IntroductionThere has been a tremendous progress recently in theusage of digital images and videos for an increasing num-ber of applications. Multimedia services that have gainedwide interest include digital television broadcasts, videostreaming applications, and real-time audio and video ser-vices over the Internet. The global mobile data traffic grewby 81% in 2013, and during 2014, the number of mobile-connected devices will exceed the number of people onearth, according to predictions made by Cisco. The videoportion of the mobile data traffic was 53% in 2013 andis expected to exceed 67% by 2018 [1]. With this hugeincrease in the exposure of image and video to the humaneye, the interest in delivering quality of experience (QoE)may increase naturally. The quality of visual media canget degraded during capturing, compression, transmis-sion, reproduction, and displaying due to the distortionsthat might occur at any of these stages.
*Correspondence: [email protected] Institute of Technology, Karlskrona SE-37179, Sweden
The legitimate judges of visual quality are humans asend users, the opinions of whom can be obtained bysubjective experiments. Subjective experiments involve apanel of participants which are usually non-experts, alsoreferred to as test subjects, to assess the perceptual qual-ity of given test material such as a sequence of imagesor videos. Subjective experiments are typically conductedin a controlled laboratory environment. Careful planningand several factors including assessment method, selec-tion of test material, viewing conditions, grading scale,and timing of presentation have to be considered priorto a subjective experiment. For example, Recommenda-tion (ITU-R) BT.500 [2] provides detailed guidelines forconducting subjective experiments for the assessment ofquality of television pictures. The outcomes of a subjec-tive experiment are the individual scores given by the testsubjects, which are used to compute mean opinion score(MOS) and other statistics. The obtained MOS, in par-ticular, represents a ground truth for the development ofobjective quality metrics. In ITU-R BT.500 and relatedrecommendations, various types of subjective methodshave been described. These types include either single
Shahid et al. EURASIP Journal on Image and Video Processing 2014, 2014:40 Page 2 of 32http://jivp.eurasipjournals.com/content/2014/1/40
stimulus or double stimulus-based methods. In singlestimulus methods, the subjects are shown variants of thetest videos and no reference for comparison is provided.In some situations, a hidden reference can be included butthe assessment is based only on a no-reference scoring ofthe subjects.
Due to the time-consuming nature of executing subjec-tive experiments, large efforts have been made to developobjective quality metrics, alternatively called as objectivequality methods. The purpose of such objective qual-ity methods is to automatically predict MOS with highaccuracy. Objective quality methods may be classifiedinto psychophysical and engineering approaches [3]. Psy-chophysical metrics aim at modeling the human visualsystem (HVS) using aspects such as contrast and orienta-tion sensitivity, frequency selectivity, spatial and temporalpattern, masking, and color perception. These metricscan be used for a wide variety of video degradations butthe computation is generally demanding. The engineer-ing approach usually uses simplified metrics based on theextraction and analysis of certain features or artifacts ina video but do not necessarily disregard the attributes ofthe HVS as they often consider psychophysical effects aswell. However, the conceptual basis for their design is todo analysis of video content and distortion rather thanfundamental vision modeling.
A set of features or quality-related parameters of animage or video are pooled together to establish an objec-tive quality method which can be mapped to predict MOS.Depending on the degree of information that is availablefrom the original video as a reference in the quality assess-ment, the objective methods are further divided into fullreference (FR), reduced reference (RR), and no-reference(NR) as follows:
• FR methods: With this approach, the entire origi-nal image/video is available as a reference. Accord-ingly, FR methods are based on comparing distortedimage/video with the original image/video.
• RR methods: In this case, it is not required to giveaccess to the original image/video but only to providerepresentative features about texture or other suitablecharacteristics of the original image/video. The com-parison of the reduced information from the originalimage/video with the corresponding information fromthe distorted image/video provides the input for RRmethods.
• NR methods: This class of objective quality methodsdoes not require access to the original image/video butsearches for artifacts with respect to the pixel domainof an image/video, utilizes information embedded inthe bitstream of the related image/video format, orperforms quality assessment as a hybrid of pixel-basedand bitstream-based approaches.
1.2 Applications of no-reference image and video qualityassessment
In recent years, there has been increasing interest in thedevelopment of NR methods due to the widespread use ofmultimedia services in the context of wireless communi-cations and telecommunication systems. Applications ofNR methods include the following areas:
• Network operators and content providers have astrong interest to objectively quantify the level ofservice quality delivered to the end user and insidethe network nodes. NR methods will provide thedata needed to adopt network settings such that cus-tomer satisfaction is secured and hence churn can beavoided.
• The involvement of multiple parties between contentproviders and the end users gives rise to establishservice-level agreements (SLA) under which an agreedlevel of quality has to be guaranteed. In this respect,NR methods are a suitable choice for in-service qualitymonitoring in live systems.
• In general, NR methods are well suited to per-form real-time objective quality assessment whereresources are limited such as frequency spectrum inwireless communications. In such cases, RR meth-ods have limited application as an ancillary channelis required to transmit the required features of theoriginal video.
• Real-time communication and streaming servicesrequire quality adaptations using NR methods for col-lecting statistics of the delivered quality.
1.2.1 Related work: published reviews of objective visualquality methods
According to the framework introduced in [4] for NRvisual quality estimation, three stages are present in anNR quality estimation approach. These stages are mea-surement of a physical quantity relevant for visual quality,also called as feature, pooling the measured data overspace and/or time, and mapping the pooled data to anestimate of perceived quality. A survey of the measure-ment stage, which is essentially the main focus in muchof the work done in NR quality estimation, has been pro-vided in the same contribution. The survey in [4] dividesthe literature review into two main categories. In thefirst category, the methods estimating mean square error(MSE) caused by block-based compression, MSE causedby packet loss errors, and noise estimation methods tocompute MSE have been discussed. The second categoryencompasses the approaches that are termed as feature-based. The feature-based methods are based on either amodel developed for particular artifacts related to a vis-ible degradation, or a model developed to quantify theimpact of degradations on a specific set of attributes of
Shahid et al. EURASIP Journal on Image and Video Processing 2014, 2014:40 Page 3 of 32http://jivp.eurasipjournals.com/content/2014/1/40
the original uncorrupted image or video. A brief surveyof NR methods of image quality assessment (IQA) basedon the notion of quantifying the impact of distortions onnatural scene statistics (NSS) is provided in [5]. Some NRmethods of visual quality are discussed in [6] also underthe categorization of features and artifacts detection. Sim-ilarly, a review of the objective methods of video qualityassessment (VQA) is provided in [7] including a classifi-cation of objective methods in general without specifyingit for no-reference methods. In [7], the objective methodsare classified as data metrics, pictures metrics, and packetor bitstream-based metrics. The review and performancecomparison of video quality assessment methods in [8]present a classification of FR and RR methods only. A sur-vey on visual quality assessment methods that are basedon information theory is given in [9]. It was observed thatinformation theory-based research for the developmentof NR methods is rather limited. The type of NR meth-ods surveyed in [9] relies on an approach that employsRényi entropy for determining the amount of random-ness in the orientation of local structures in an image.NR methods have been reviewed in [10] by classifyingthem following three approaches. Firstly, a review of NRmethods has been performed by classifying them basedon the type of distortion that is estimated to formu-late a quality value. The second approach used for theclassification is based on methods that are designed forquantifying the artifacts produced by a specific compres-sion standard. Lastly, a review of methods that are notdesigned specifically for a particular distortion has beenperformed. A broad survey of image and video qualitymethods, as well as a classification of the methods, waspublished during 2007 in [11]. This includes both NR andRR methods, and our article focuses on a classificationand review of NR methods of IQA and VQA publishedafter [11].
1.2.2 Our proposed classificationThe current literature in the area of methods of NRimage/video quality assessment is quite diverse. Hence,it is a challenging task to classify these methods into awell-structured and meaningful categorization. A goodcategorization of such methods should be concise enoughto be properly understandable and also comprehensiveenough to present most of the relevant methodolo-gies. The aforementioned types of classifications cover arange of NR methods, but there is a need to broadenthe categorization approaches in order to review cur-rently existing methods in this area. Reibman et al. [12]classify NR methods as either stemming from statisticsderived from pixel-based features and call them NR pixel(NR-P) type or computed directly from the coded bit-stream and call them NR bitstream (NR-B) type. Webelieve that this is a useful classification which can
serve as an effective basis for constructing a broaderclassification.
In the case of NR-P-based methods, one relevantmethod to classify available approaches is to investigatethese in terms of the employment of certain artifactsthat are related to a specific kind of degradation of thevisual quality. Quantification of such artifacts has beenused as a measure for the quality assessment. The qual-ity values may depend only on a single artifact or itmay depend upon a combination of many artifacts. Itis common that single artifact measure-based methodsare developed by considering a given model of degra-dation, often simulated artifacts, and sometimes theirperformance remains unknown for realistic or more gen-eral scenarios. For example, most of the available blurmethods are based on Gaussian or linear blur models,which may not adequately measure the blur producedby a complex relative motion between image captur-ing device and the object. Moreover, single-artifact-basedquality methods may not have satisfactory performance inthe assessment of the overall quality, in the presence ofother artifacts. Therefore, methods have been introducedwhere estimation of a combination of artifacts is fusedto generate a single quality score. Also, in the domainof NR-P-based methods, there are many methods whichwork beyond simple artifacts computation and the qual-ity assessment is derived from the impact of distortionsupon NSS (referring to statistical characteristics com-monly found in natural images). Moreover, some quality-relevant features can be computed from the image/videopixels to formulate an estimation of the perceptualquality.
The NR-B-based methods are relatively simpler to com-pute than NR-P-based methods, and the quality values canoften be computed in the absence of a full decoder. How-ever, such methods can have limited scope of applicationas they are usually designed for a particular coding tech-nique and bitstream format, e.g., H.264/AVC standard.Such methods are based on either the encoding infor-mation derived from the bitstream or the packet headerinformation or a combination of both. These methods arequite suitable for network video applications such IPTVand video conferencing.
Quality assessment performance can be compromisedin NR-B-based methods to gain reduction in the com-putational complexity as compared to the NR-P-basedmethods. The performance of NR-B-based methods ofquality assessment can be improved by adopting anapproach of adding some input from NR-P-based qual-ity assessment. Such composites of NR-P- and NR-B-based methods are called hybrid methods. These methodsinherit the computational simplicity of NR-B-based meth-ods and depend on NR-P-related data to gain furtherrobustness.
Shahid et al. EURASIP Journal on Image and Video Processing 2014, 2014:40 Page 4 of 32http://jivp.eurasipjournals.com/content/2014/1/40
In light of the aforementioned discussion, our approachof a meaningful classification of NR objective visual qual-ity methods is outlined in Figure 1. This classificationis formulated by considering the type and granularity ofusage of the image or video data for the design of anobjective method of quality. Thus, it offers the opportu-nity to present a discussion of most of recently publishedtechniques of the NR visual quality assessment. It is tobe noted that the main focus of this article is to review,in a systematic and structured manner, recent advance-ments in this area. Hence, a performance comparison ofthe reviewed methods on a comprehensive test databaseis out of the scope of this paper.
1.2.3 The preliminaries and organization of this paperMost of the existing NR quality methods fall into NR-P orNR-B type methods or a hybrid of these two approaches.As shown in Figure 1, the following sections presentan overview of the different classes of NR methods ofIQA and VQA. In each section, we have presented ageneral idea used in computation of various types ofmethods of quality estimation using block diagrams. Sum-maries of most of the discussed methods are shown intables throughout the paper and in dedicated discussionsections. Mostly, the performance of an objective qualityprediction model is reported by using measure of predic-tion accuracy, i.e., Pearson’s linear correlation coefficient,and measure of monotonicity, i.e., Spearman’s rank ordercorrelation coefficient, as recommended by Video Qual-ity Expert Group (VQEG) [13]. These measures have beenused to report the performance of the reviewed methods
in the tables. In these tables, some cells have been markedwith a hyphen (-) in cases where the corresponding valuehas not been reported in the reference or some uncom-mon measure of performance has been used. Other thanthe explicit numerical values of the number of pixels usedfor stating the resolution of the test data, the followingshort forms are used:
• QCIF, Quarter Common Intermediate Format(176 × 144)
• CIF, Common Intermediate Format (352 × 288)
• SIF, Standard Interchange Format (320 × 240)
• SD, Standard Definition (720 × 480 or 720 × 576)
• HD, High Definition (1920 × 1080 or 1280 × 720)
For validation of the proposed method, some publiclyavailable databases of images and videos have been usedin most of the reference papers. In this article, the ref-erence to a public database of test media indicates thateither a subset or the complete set of the available mediahas been used. These sources of the test media include thefollowing:
• Laboratory for Image and Video Engineering (LIVE):LIVE offers databases of compressed images andvideos with the corresponding data of the subjec-tive assessment. The images have been encodedusing Joint Photographic Experts Group (JPEG) andJPEG2000 standards. Moreover, some images havebeen generated using simulated conditions of cer-tain artifacts such as Gaussian blur and white noise.The video database contains sets of videos encoded
No-Reference Image and Video Quality Assessment Methods
Figure 1 An overview of NR image and video quality assessment methods. The second row of boxes gives a division into three maincategories, further divided into subcategories in the next row. The bottom row gives examples of extracted features or information used forprocessing in each subcategory.
Shahid et al. EURASIP Journal on Image and Video Processing 2014, 2014:40 Page 5 of 32http://jivp.eurasipjournals.com/content/2014/1/40
using Moving Picture Experts Group (MPEG)-2 andH.264/AVC. While we refer to the usage of test datafrom LIVE in the tables, the standard used for encod-ing shown in the column Processing indicates whetherthe used data is an image or a video. References to thepublications based on the use of these databases havebeen provided at the source website [14].
• Video Quality Experts Group (VQEG): VQEG hasreleased its test data for public use which is availableon their website [15]. The data contains standard def-inition television videos and the corresponding valuesof the subjective assessment.
• Tampere Image Database 2008 (TID2008): Thisdatabase contains test data produced from 17 differenttypes of distortion introduced in the given 25 refer-ence images. The test images have been provided withthe corresponding subjective assessment scores andvalues of many objective methods of quality estima-tion. More information on it is found in [16].
• Images and Video Communications (IVC): The IVCdatabase contains a set of ten original images dis-torted by four types of processing and is supportedby the corresponding quality scores as availablein [17].
• Toyoma: This database consists of subjective assess-ment data and test stimuli generated through pro-cessing of 14 reference images using JPEG andJPEG2000 [18].
This article is organized as follows. For the pixel-based approaches, the methods that apply direct esti-mation of single and multiple artifacts are reviewed inSections 1.3 and 1.4, respectively. The methods basedon computation of various features and an evaluation ofimpacts of pertinent artifacts upon NSS are discussed inSection 1.5. Bitstream-based NR methods are reviewedin Section 1.6. The methods constructed as hybrids ofpixel and bitstream-based approaches are discussed inSection 1.7. Finally, some conclusive remarks and a briefoutlook of possible future works in this area are presentedin Section 2.
1.3 Single artifact NR-P-based methodsBlurring, blocking, and ringing are considered to bethe most commonly found spatial domain artifacts inimages/videos compressed by lossy encoders [19]. More-over, noise is also a common source of annoyance inimages and videos. Transmission of videos over lossy net-works gives rise to temporal artifacts such as frame freeze.In the following, we examine the recent methods whichadopt the approach of quantifying a single artifact forperceptual quality estimation. The section is divided intosubsections for each of these artifacts, and an overalldiscussion is provided at the end.
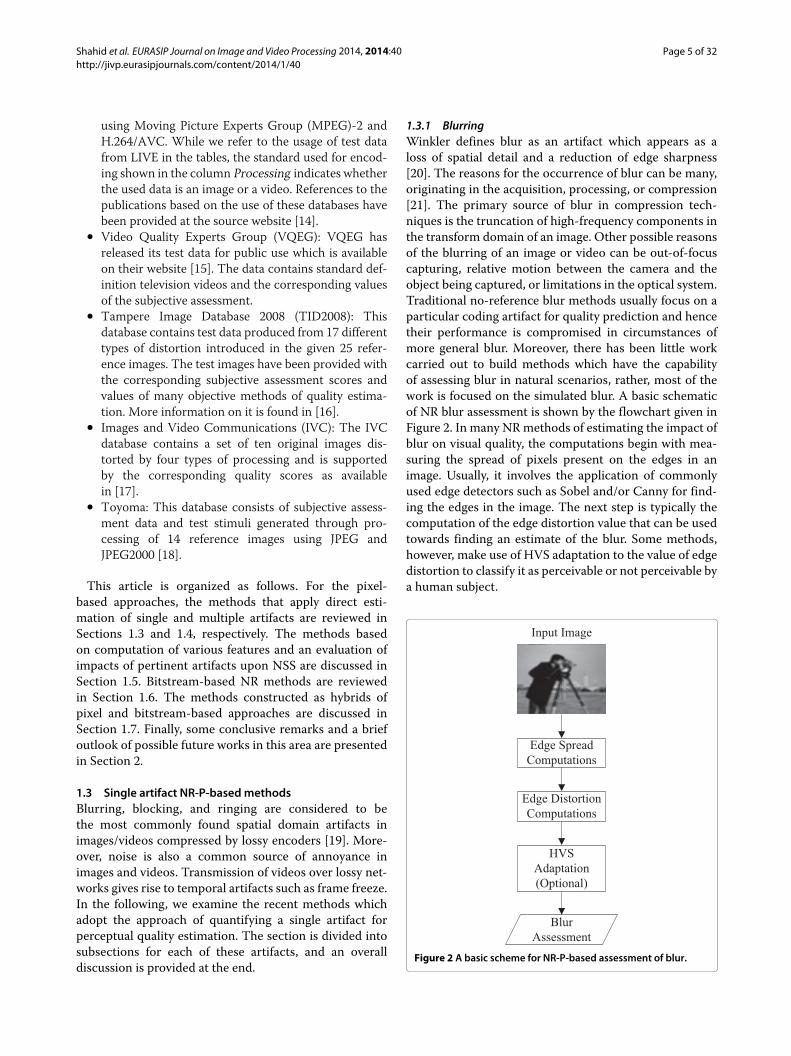
1.3.1 BlurringWinkler defines blur as an artifact which appears as aloss of spatial detail and a reduction of edge sharpness[20]. The reasons for the occurrence of blur can be many,originating in the acquisition, processing, or compression[21]. The primary source of blur in compression tech-niques is the truncation of high-frequency components inthe transform domain of an image. Other possible reasonsof the blurring of an image or video can be out-of-focuscapturing, relative motion between the camera and theobject being captured, or limitations in the optical system.Traditional no-reference blur methods usually focus on aparticular coding artifact for quality prediction and hencetheir performance is compromised in circumstances ofmore general blur. Moreover, there has been little workcarried out to build methods which have the capabilityof assessing blur in natural scenarios, rather, most of thework is focused on the simulated blur. A basic schematicof NR blur assessment is shown by the flowchart given inFigure 2. In many NR methods of estimating the impact ofblur on visual quality, the computations begin with mea-suring the spread of pixels present on the edges in animage. Usually, it involves the application of commonlyused edge detectors such as Sobel and/or Canny for find-ing the edges in the image. The next step is typically thecomputation of the edge distortion value that can be usedtowards finding an estimate of the blur. Some methods,however, make use of HVS adaptation to the value of edgedistortion to classify it as perceivable or not perceivable bya human subject.
Figure 2 A basic scheme for NR-P-based assessment of blur.
Shahid et al. EURASIP Journal on Image and Video Processing 2014, 2014:40 Page 6 of 32http://jivp.eurasipjournals.com/content/2014/1/40
A paradigm for blur evaluation has been presented in[22] that is mainly composed of four methods of blurquantification, given in [23-25] and [26], which have beenintegrated by an artificial neural network (ANN) pow-ered multifeature classifier. In the method given in [23],an image quality measurement method in terms of globalblur has been proposed. The method relies on histogramsof discrete cosine transform (DCT) coefficients presentin MPEG and JPEG encoded data to qualitatively encom-pass the distribution of null coefficients, given the factthat blurred images usually end up having a lot of high-frequency coefficients set to zero. This algorithm pro-vides results which align with subjective assessment butit focuses only on out-of-focus blur and it does not per-form well when there is a uniform background presentor when an image is over-illuminated. The blur assess-ment algorithm proposed in [24] exploits the ability ofthe Haar wavelet transform (HWT) to distinguish edgetypes, and the method works both for out-of-focus andlinear-motion blur. This method is however not testedfor realistic blur. The method proposed in [25] presents aframework where global blur is measured in terms of aver-aged edge lengths. The authors considered only a small setof Gaussian blurred images for its evaluation. Nonethe-less, the method has good correlation with subjectivescores. An improved version of [25] is found in [26] whereHVS properties have been added to get weighted edgelengths. It is to be noted that none of these four referencemethods quantify realistic blur situations, but Ciancioet al. [22] have shown their method to be useable for mea-suring naturally occurring blur. Overall, [22] uses localphase coherence, mean brightness level, and variance ofthe HVS frequency response and contrast as additionalinputs, together with the earlier mentioned four methods,to various ANN models designed for quality estimation.For input calibration, a five-parameter nonlinear mappingfunction was used for the types of blur including simu-lated Gaussian, simulated linear motion, a combinationof both, and real blur. The proposed method outper-forms the given four reference methods when tested ona fairly large database of 6,000 images corrupted by blur.Although the proposed method does not correlate so wellwith subjective scores in realistic blur scenarios, with aPearson’s correlation coefficient of approximately 0.56, itperforms better than the reference methods with respectto subjective rating. In an earlier paper, the same authorshave used the idea of estimating image blur using localphase coherence [27] and a similar method proposed byHassen et al. is found in [28].
It has been argued in [29] that blur below a certainthreshold value remains unperceived by the HVS and sucha threshold value is termed as just noticeable blur (JNB).By incorporating the response of the HVS to sharpnessat various contrast levels, the authors have proposed a
measure of image sharpness. It is suggested that most ofthe existing no-reference blur assessment methods do notperform well for a variety of images and are rather lim-ited to assess varying blur in a certain image. They havevalidated this argument by testing a set of 13 contem-porary reference methods, which are based on differenttechniques of blur assessment used for quality assess-ment such as pixel-based techniques, statistical prop-erties, edge-detection-based, and derivative-based tech-niques. The proposed method has higher correlation withsubjective MOS than the given 13 objective methods ofquality assessment when it has been tested on a pub-lic database of test images. In [29], the block size usedfor finding edge pixels is 64 × 64, and a similar contri-bution based on JNB from the same authors is reportedin [30] where a block size of 8 × 8 has been used forfinding the edge pixels. The method proposed in [30] hasbeen improved in [31] by adding the impact of saliency-weighting in foveated regions of an image. Specifically,more weighting is given to the local blur estimates thatbelong to salient regions of an image, while spatial blurvalues are pooled together to compute an overall value ofblur for the whole image.
A similar method found in [21,32] improves [29] byaddition of the concept of commutative probability ofblur detection (CPBD) so that the method should esti-mate the quality by including the impact of HVS sensi-tivity towards blur perception at different contrast levels.Testing the proposed method upon three public imagedatabases having different blur types reveals that themethod performance is considerably better than some ofthe contemporary sharpness/blur methods. However, thismethod gives a quality index in a continuous range of 0 to1 and the authors have modified it in [33] where it givesa quality value on a discrete scale of 1 to 5, the usual fivequality classes which are described from Bad to Excellent.Given that blur estimation methods most often work onthe idea of measurement of edge-spread and blur man-ifests itself in smooth or diminished edges, some edgesmay remain undetected. Varadarajan et al. [34] improvedthe method proposed in [29] by incorporating an edgerefinement method to enhance the edge detection andhence outperformed the blur assessment. The authorsachieved as much as 9% increase in Pearson’s correlationcoefficient.
In contrast to usual schemes of blur detection at theedges, the method proposed in [35] does an estimationof blur at the macroblock (MB) boundaries. The overallblur of an image can be calculated by averaging the blocklevel measure for the whole image. The authors have alsoused a content-sensitive masking approach to compensatethe impact of image texture. As the method was designedfor videos encoded following the H.264/AVC standard, itmainly quantifies the blurring effects from quantization
Shahid et al. EURASIP Journal on Image and Video Processing 2014, 2014:40 Page 7 of 32http://jivp.eurasipjournals.com/content/2014/1/40
and de-blocking filter. This method is essentially based ona method proposed for images [36] where an estimation ofthe blur in a video is made by taking an average measureof blur values for each frame.
A wavelet-based noise-resilient color image sharpnessmethod is presented in [37]. The procedure is to computea multiscale wavelet-based structure tensor which repre-sents the multiscale gradient information of local areas ina color image (image gradient is defined as the directionalchange in the intensity or color in an image). The pro-posed tensor structure preserves edges even in the pres-ence of noise. Thus, the sharpness method is defined bycalculating the eigenvalues of the multiscale tensor onceedges have been identified. A competitive correlation withsubjective MOS is achieved when the proposed method istested on LIVE image database [14], in comparison to asimilar sharpness method.
Out-of-focus blur estimation without using any refer-ence information has been given in [38] using the pointspread function (PSF) which is derived from edge infor-mation. As the proposed algorithm works in the spatialdomain, avoiding any iterations or involvement of com-plex frequencies, it is expected to operate fast and possibleto be deployed in real-time perceptual applications. Basedon the similar approach in [39], the method has beenmade workable to assess blurriness of conditions likeadded blur, realistic blur, and noise contamination.
Chen et al. [40] have claimed that their method worksfor any kind of blurriness, without being sensitive to thesource of the blur. A gradient image is calculated from thegiven image pixel array. A Markov model is used and atransition probability matrix is computed. Finally, a pool-ing strategy is applied to the probabilistic values to obtainthe blurriness measure.
Some of the other recently introduced no-referenceblur assessment methods include the following: In [41]a method based on multiscale gradients and waveletdecomposition of images is given, an image sharp-ness based on Riemannian tensor mapping into a non-Euclidean space has been found in [42], radial analysis ofblurred images in frequency domain is done in [43] toset an image quality index for blur estimation, and ref-erence [44] presents a perceptual blur method to assessquality of Gaussian blurred images. A method based onblur measure in salient regions has been presented in [45].The perceptually relevant areas in an image are identi-fied through elements of visual attention, namely, colorcontrast, object size, orientation, and eccentricity. Qualityvalues in correlation with subjective scores are producedby localizing the degradation measure in these elements.
1.3.2 BlockingBlocking is an artifact which manifests itself as a dis-continuity between adjacent blocks in images and video
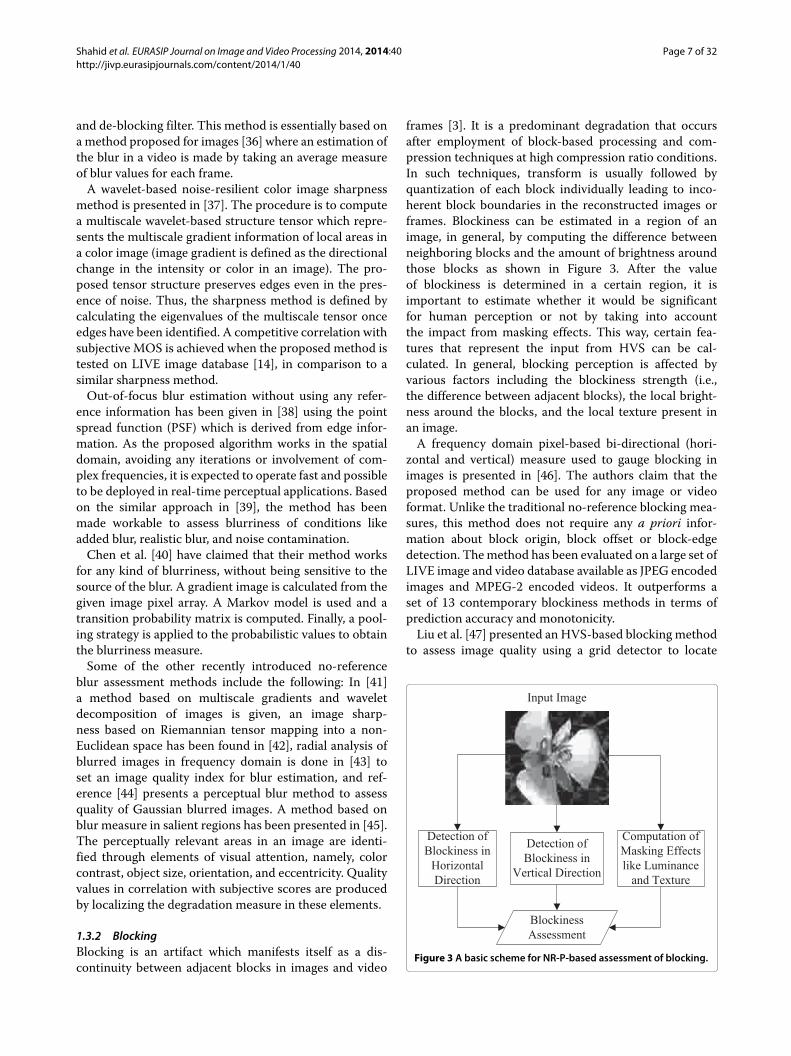
frames [3]. It is a predominant degradation that occursafter employment of block-based processing and com-pression techniques at high compression ratio conditions.In such techniques, transform is usually followed byquantization of each block individually leading to inco-herent block boundaries in the reconstructed images orframes. Blockiness can be estimated in a region of animage, in general, by computing the difference betweenneighboring blocks and the amount of brightness aroundthose blocks as shown in Figure 3. After the valueof blockiness is determined in a certain region, it isimportant to estimate whether it would be significantfor human perception or not by taking into accountthe impact from masking effects. This way, certain fea-tures that represent the input from HVS can be cal-culated. In general, blocking perception is affected byvarious factors including the blockiness strength (i.e.,the difference between adjacent blocks), the local bright-ness around the blocks, and the local texture present inan image.
A frequency domain pixel-based bi-directional (hori-zontal and vertical) measure used to gauge blocking inimages is presented in [46]. The authors claim that theproposed method can be used for any image or videoformat. Unlike the traditional no-reference blocking mea-sures, this method does not require any a priori infor-mation about block origin, block offset or block-edgedetection. The method has been evaluated on a large set ofLIVE image and video database available as JPEG encodedimages and MPEG-2 encoded videos. It outperforms aset of 13 contemporary blockiness methods in terms ofprediction accuracy and monotonicity.
Liu et al. [47] presented an HVS-based blocking methodto assess image quality using a grid detector to locate
Figure 3 A basic scheme for NR-P-based assessment of blocking.
Shahid et al. EURASIP Journal on Image and Video Processing 2014, 2014:40 Page 8 of 32http://jivp.eurasipjournals.com/content/2014/1/40
blocking. A local pixel-based blockiness measure whichis calculated on the detected degraded regions is aver-aged to provide a blockiness value for the whole image.The main strength of this method in terms of computa-tional efficiency and relevance to HVS response lies inthe application of visual masking which makes the calcu-lations perform only in the areas of blockiness visible tohuman perception. The authors took up the same methodfor further extensive evaluation in [48] under various con-ditions of comparison of performance where, for example,HVS models and grid detector are omitted or included.The results show that the proposed method performs bet-ter than some contemporary methods and can be a goodcandidate for real-time applications due to its simplifiedHVS model.
In [49], a blockiness assessment method is presentedfor block-based discrete cosine transform (BDCT) codedimages. It is based on the estimation of noticeable block-iness. The so-called noticeable blockiness map is derivedfrom luminance adaptation and texture masking in linewith HVS response combined with a discontinuity mapto quantify the visual quality. Along with its validatedusability for deblocking of JPEG images, it has the poten-tial of optimizing the codec parameters and similar otherpost-processing techniques.
Babu et al. presented their HVS related features-basedblocking method in [50]. Blockiness as perceived byhumans in JPEG encoded images is affected by a numberof features such as edge amplitude around the borders ofDCT blocks and edge length; the value of these increasein amount as compression rate is increased. It is alsoaffected by the amount of background activity and back-ground luminance as these have masking impact on possi-ble blocking artifacts. The authors have used a sequentiallearning algorithm in a growing and pruning radial basisfunction (GAP-RBF) network to estimate the relationshipbetween the mentioned features and the correspondingquality measure. Babu et al. also proposed a method ofdetermining block-edge impairment [51] using the ideathat edge gradients of blocks in the regions of low spatialdetails would contribute towards the overall blocking inan image. The level of spatial details is estimated throughedge activity that is computed through standard deviationmeasurement of each edge.
Other methods in this area include the blind measure-ment of blocking in low bit rate H.264/AVC encodedvideos based on temporal blocking artifact measurebetween successive frames of a video presented in [52].A weighted Sobel operator-based blocking method ispresented in [53], in which the computation involvesluminance gradient matrices of DCT-coded images. Amethod where a rather simple approach of taking abruptchange in pixel values as a signal of blocking has beenproposed in [54] and it can be implemented both in
pixel and DCT domain, and a method of blockiness esti-mation in natural scene JPEG compressed images hasbeen presented in [55] which was influenced by theimpact of multineural channels pattern of HVS for visionsensing.
1.3.3 RingingThe ringing artifact is associated with Gibbs phenomenonand is observed along edges in otherwise smooth tex-ture areas [20]. It has yet been relatively less investigatedfor NR perceptual quality measurements. This kind ofdegradation is caused by rough quantization of the high-frequency transform coefficients and is observed in theform of ripples around high contrast edges. A schematicblock diagram of commonly used approaches for the esti-mation of perceptual ringing is shown in Figure 4. Certainfeatures can be extracted from the edge maps to clas-sify the image areas in terms of relevance towards ringingartifact. Masking effects of textured regions can be exam-ined to check if the ringing would be visible to HVSperception. From the obtained data, a ringing map is gen-erated for various regions and an overall value of percep-tual ringing is obtained for the whole image. We have notfound any publication on the NR estimation of ringing invideos.
Liu et al. have put forward HVS-based quality assess-ment methods which quantify ringing in compressedimages in [56,57]. The work in [56] does not incorpo-rate the masking effects of HVS properties. However, in[57], Liu et al. have improved the already existing method
Figure 4 A basic scheme for NR-P-based assessment of ringing.
Shahid et al. EURASIP Journal on Image and Video Processing 2014, 2014:40 Page 9 of 32http://jivp.eurasipjournals.com/content/2014/1/40
in multiple aspects. Edge detection is crucial for locatingthe possible ringing artifact and is used along with con-sideration of HVS masking in designing of such a method.The HVS masking is integrated by adding human visibil-ity index of ringing nuisance estimate inside the alreadydetected distorted regions. This method has a perfor-mance level comparable to a full reference method and itoutperforms the two given no-reference methods of ring-ing assessment while tested on JPEG compressed images.As the method does not use coding parameters like DCTcoefficients, the authors argue that a slightly tuned ver-sion of the same method should perform similarly wellwhen employed on other types of compressed images, e.g.,JPEG2000.
Ringing may occur also as a result of an image restora-tion process, unlike the other artifacts which usually occurduring compression. The ringing that occurs due to imagerestoration has different characteristics as compared tothe one that occurs due to compression. Iterations ofblind deconvolution in the image restoration process arelikely to result in the generation of ringing [58]. A qualitymethod to assess perceived ringing as a result of applica-tion of blind deconvolution methods for image restorationis proposed in [58] and in [59]. The authors claim thatthese methods evaluate ringing with no sensitivity to theimage content type and any specific ringing process. Inthe method proposed in [58], a 2D Gabor wavelet fil-ter and a line detector were used to quantify ringing inrestored images. A similar approach with enhancement isfound in [59] where the authors have proposed to assessthe degradation on image boundaries and image edgesseparately and then fuse the weighted results of the twovalues to have the overall ringing value. A 2D Gabor filterresponse image is used to calculate the perceived ring-ing at boundaries, and a Canny edge detector is usedfor locating ringing around edges in the image. The pro-posed method was tested on gray scale images restoredfrom simulated blur. It has been found that the reportedresults are in line with subjective scores of qualityassessment.
1.3.4 NoiseBesides the aforementioned unwanted components of animage or video that affect the perceptual quality, therecan be other types of spatial noise as well. The mostlyoccurring types of spatial noise include salt and peppernoise, quantization noise, Gaussian noise, and speckle incoherent light situations. Mostly, the noise is consideredto be an additive component, e.g., Gaussian noise, butin some situations the noise component is multiplicative,e.g., speckle noise [60]. Noise can be introduced duringthe image/video acquisition, recording, processing, andtransmission [61]. Estimation of noise is required due tonumerous reasons and applications in image processing
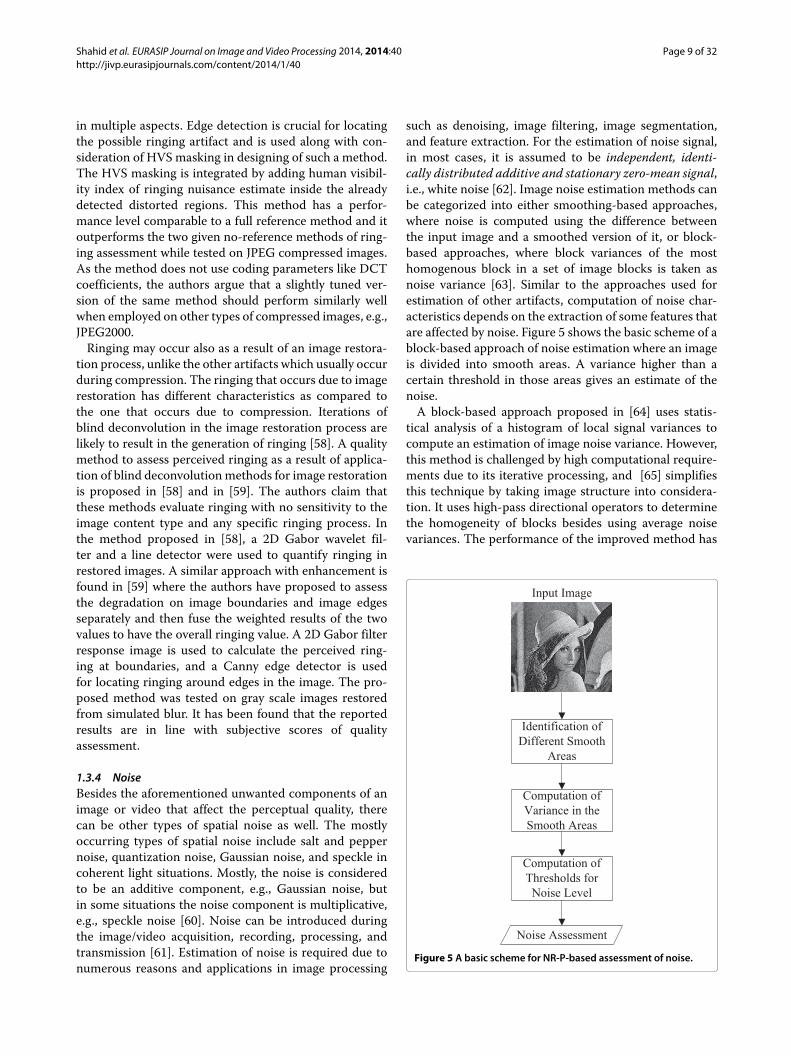
such as denoising, image filtering, image segmentation,and feature extraction. For the estimation of noise signal,in most cases, it is assumed to be independent, identi-cally distributed additive and stationary zero-mean signal,i.e., white noise [62]. Image noise estimation methods canbe categorized into either smoothing-based approaches,where noise is computed using the difference betweenthe input image and a smoothed version of it, or block-based approaches, where block variances of the mosthomogenous block in a set of image blocks is taken asnoise variance [63]. Similar to the approaches used forestimation of other artifacts, computation of noise char-acteristics depends on the extraction of some features thatare affected by noise. Figure 5 shows the basic scheme of ablock-based approach of noise estimation where an imageis divided into smooth areas. A variance higher than acertain threshold in those areas gives an estimate of thenoise.
A block-based approach proposed in [64] uses statis-tical analysis of a histogram of local signal variances tocompute an estimation of image noise variance. However,this method is challenged by high computational require-ments due to its iterative processing, and [65] simplifiesthis technique by taking image structure into considera-tion. It uses high-pass directional operators to determinethe homogeneity of blocks besides using average noisevariances. The performance of the improved method has
Figure 5 A basic scheme for NR-P-based assessment of noise.
Shahid et al. EURASIP Journal on Image and Video Processing 2014, 2014:40 Page 10 of 32http://jivp.eurasipjournals.com/content/2014/1/40
been verified using highly noisy as well as good qualityimages. This method requires a full search of an image todetermine the homogeneous areas in it. At the expenseof decreased accuracy, spatial separations between blockscan be used to reduce the computational complexity. Thisapproach has been adopted in [66] where particle filteringtechniques have been used in the process of localizationof the homogeneous regions. It has been shown that theproposed method reduces the number of required com-putations for homogeneity measurements while it out-performs [65] in accuracy. More examples of block-basedapproaches are found in [67-69] where noise level is com-puted by performing principal component analysis (PCA)of the image blocks.
1.3.5 Temporal impairmentsTemporal impairments can be divided into two main cat-egories: impairments caused by the encoding process andimpairments caused by network perturbations. The typ-ical temporal impairments caused by the encoding pro-cess come from temporal downsampling which can beperformed uniformly or non-uniformly, depending on dif-ferent underlying reasons. The impairments generatedby network perturbations come from delay or packetloss [70]. These different impairments can be categorizedas the following [3,4,71,72]:
• Jerkiness: non-fluent and non-smooth presentation offrames as a result of temporal downsampling
• Frame freeze: frame halts as a result of unavailabilityof new frames to present due to network congestionor packet loss etc.
• Jitter: perceived as unnatural motion due to variationsin transmission delay as a result of, e.g., fluctuations inthe available bandwidth or network congestion
• Flickering: noticeable discontinuity between consecu-tive frames as a result of a too-low frame rate togetherwith high texture, coding artifacts, or motion content
• Mosquito noise: appears as temporal shimmering seenmostly in smooth textured areas produced by ring-ing and prediction error due to motion compensationmismatch
Jerkiness is the impairment perceived by the user, whilejitter and frame freezes are the technical artifacts whichproduce jerkiness. Figure 6 presents an overview of howtemporal impairments are computed in most of the con-temporary methods. Generally, the first step is to computethe inter-frame difference of pixel intensities (usually theluminance channel only) and the obtained value can beused as it is or a mean square value can be calculated.Afterwards, various techniques can be applied to deter-mine the location and possibility of frame freeze or framedrops. Some kind of thresholding is then useful to obtain
Figure 6 A basic scheme for NR-P-based assessment of temporalartifacts.
more information about the occurrence of a potentialtemporal artifact. Finally, a suitable pooling mechanismis used to compute an overall value of the artifact underconsideration.
Borer [71] presented a model based on the mean squaredifference (MSD) of frames for measuring jerkiness (bothframe jitter and frame freeze) which proved its potentialfor quality assessment of videos with resolution rangingfrom QCIF up to HD. This model calculates jerkiness asan accumulative result of multiplication of three func-tions called relative display time, a monotonic function ofdisplay time, and motion intensity of all frames. The dis-play time and motion intensity values are parameterizedthrough a mapping S-shaped function, which is equivalentto a sigmoid function. Besides the fact that the proposedmodel has reasonable correlation with MOS, it does nottake into account the value of the motion intensity at thestart of a freezing interval.
An earlier proposed temporal quality method which iscentered around measuring the annoyance of frame freezeduration is given in [72]. This method uses MSD value tomark freeze events and builds a mapping function basedon such durations of freeze to estimate the subjectiveMOS. The method is a part of ITU-T RecommendationJ.247 Annex C [73] for the objective perceptual qual-ity measurement of video. Although the quality method
Shahid et al. EURASIP Journal on Image and Video Processing 2014, 2014:40 Page 11 of 32http://jivp.eurasipjournals.com/content/2014/1/40
has not been compared for performance against othermethods, it has promising values of correlation with thesubjective scores. However, the blind frame freeze detec-tion system proposed in [74] claims to outperform themodel [72] in terms of precision of correctly signalinga zero MSD event as a frame freeze event or not. Theyhave presented an algorithm for thresholding such as zeroMSD events to be classified as frame freeze events or theabsence of it. The proposed method is reported to beequally good in performance for videos encoded using lowor high quantization parameter (QP) values.
Wolf proposed an approach to accurately detect videoframe dropping in [75]. One of the salient features ofthis approach is its use in a RR method where an adap-tive threshold value is determined to avoid detectionof very low amount of motion (e.g., lips movement) asa potential frame drop event. Similar to the temporal-artifact-based methods discussed before, this method alsoderives its computations from the basic difference inpixel values between frames to check for possible framedrops.
A method for visual quality distortion due to arbitraryframe freeze is discussed in [76]. It recursively aggregatesarbitrary freeze distortions in the video under test usinga method which they proposed earlier in [77]. Essentially,the approach presented in [77] replaces the sum of variousfreeze distortions with an equivalent single freeze lengthfor predicting the video quality.
Yang et al. targeted their research to assess both con-sistent and inconsistent frame drops as a measure ofperceptual quality in their contribution found in [78]. Theconstituents of the quality method are the amount offrame drops, motion of various objects in a video, andlocalized contrast of temporal quality. Instead of relyingon frame rate to be used as a basis for temporal qual-ity method, the event length of frame losses has beenused. The proposed method correlates well with subjec-tive MOS for test sequences with a range of frame ratesand a variety of motion contents.
A rather general model was proposed in [79] for sev-eral fluidity break conditions: isolated, regular, irregular,sporadic, and varying discontinuity durations with dif-ferent distributions and densities. Similarly, the temporalquality method proposed in [80] accounts for the impactof various frame dropping situations and spatio-temporalluminance variations due to motion.
In [81], the authors have shared their preliminary find-ings on estimation of the effects of lost frames on visualquality by analyzing the inter-frame correlation presentat the output of the rendering application. As the lostframes are replaced by a repetition of the previous frame,this results in high temporal correlation at those loca-tions. Analysis of this correlation results in temporal anddistortion maps.
1.3.6 DiscussionExcept for temporal impairments, most of the methodsreviewed in this section have been proposed and testedfor images and not for videos. For example, blockiness isa common artifact at high compression rates and somecoding standards such as H.264/AVC include the useof a deblocking filter while the videos are being pro-cessed by the codec. The blockiness methods proposedfor images can be used in the case of videos as wellwhere a suitable temporal pooling scheme needs to beused. We believe that development and testing of moreNR methods of blockiness estimation for videos wouldbe beneficial. For the case of spatial-artifacts-based meth-ods, it is evident that most of the research focus hasbeen aimed at the development of techniques that arebased on a specific coding technique or image compres-sion standard. This fact necessitates the focus towardsunraveling cross-encoder methodologies. Considering theavailable methods related to the quantification of per-ceptual impacts of various temporal artifacts, it is notedthat more diverse methods are required in this area thatcan be applied for a variety of video resolutions andframe rates. It has also been observed that many meth-ods employ some commonly used test database of imagesand videos which in turn gives an opportunity to comparethe performance of competitive methods on the com-mon benchmarks of quality. One important strength ofthe methods that are tested for the performance usingtest databases such as LIVE (image or video) is theirhigher applicability because the media present in suchdatabases have been assessed for overall perceptual qual-ity and not for a particular artifact. However, the testdatabases should be enriched with new demanding areassuch as higher-resolution images and videos (HD andabove). Besides declaring the performance of the pro-posed methods, finding some common approaches forreporting the computational complexity would be inter-esting. Table 1 presents a summary of the methods dis-cussed in the subsections regarding blurring, blocking,ringing, and temporal artifacts. It is noted that a very lownumber of methods have been tested for HD resolutionimages. Competitive methods can be seen at a glance byobserving the significantly high values of the performanceindicators.
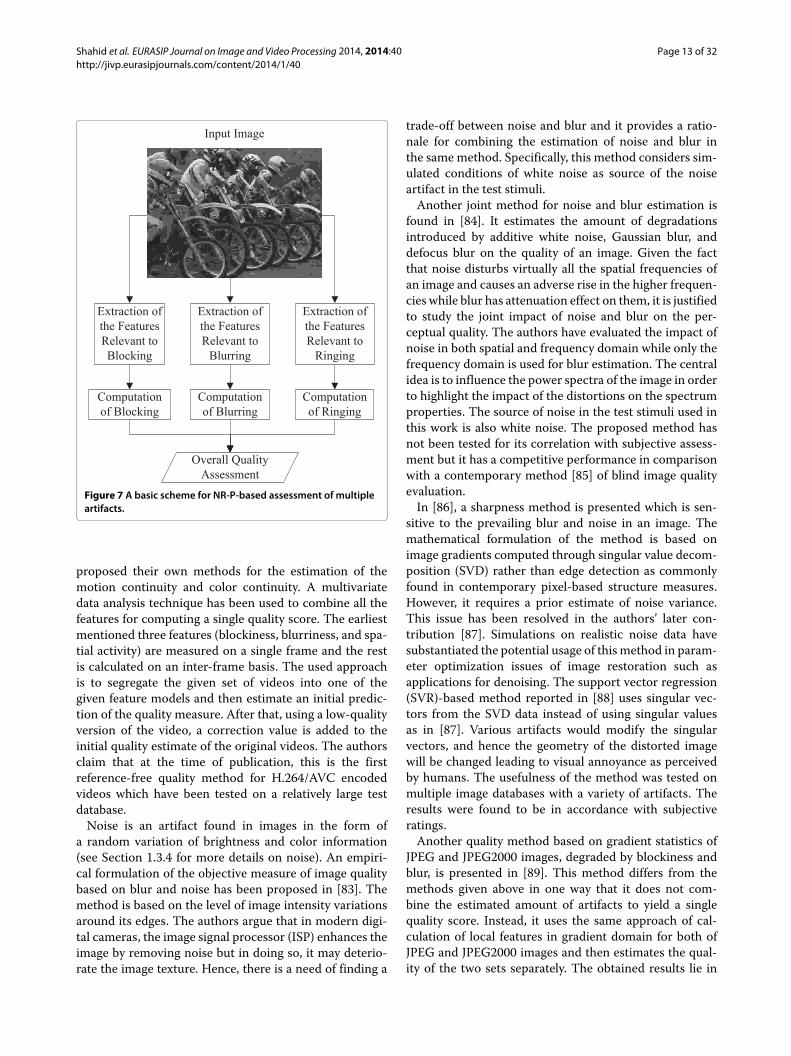
1.4 Multiple artifacts NR-P-based methodsVarious artifacts found in images and videos, incurred dueto compression or other reasons, can be combined to pre-dict the overall perceived quality. As shown in Figure 7,an image or video can be processed for the extraction offeatures relevant to different artifacts. A suitable poolingmechanism can be employed to combine the results ofdifferent artifact measurements, to make an estimate ofoverall perceptual quality.
Shahid et al. EURASIP Journal on Image and Video Processing 2014, 2014:40 Page 12 of 32http://jivp.eurasipjournals.com/content/2014/1/40
Table 1 Characteristic summary of single-artifact-based metrics
Method Reference Processing Resolution Test dataa Performanceb
Blurring Narvekar et al. [21] JPEG2000 768 × 512 LIVE image, TID2008, (LIVE) PC = 0.88, SC = 0.88
Ciancio et al. [22] Multiple Multiple 6,000 test images Multiple
Hassen et al. [28] Multiple 768 × 512 LIVE image PC = 0.92, SC = 0.93
Ferzli et al. [29] JPEG2000 768 × 512 LIVE image PC = 0.88, SC = 0.87
Gaussian blur 768 × 512 LIVE image PC = 0.93, SC = 0.94
Varadarajan et al. [34] Gaussian blur - 24 test images PC = 0.75
Debing et al. [35] H.264/AVC HD 1,176 test images PC = 0.85
Maaloof et al. [37] Multiple 768 × 512 LIVE image PC = 0.96, SC = 0.95
Chen et al. [41] Gaussian blur 768 × 512 LIVE image SC = 0.61
Chetouani et al. [43] Gaussian blur Multiple LIVE image, IVC PC = 0.86 (LIVE), 0.94 (IVC)
Hua et al. [44] Gaussian blur 768 × 512 LIVE image PC = 0.96, SC = 0.95
Oprea et al. [45] JPEG2000 768 × 512 29 test images PC = 0.85
Blocking Chen et al. [46] JPEG 768 × 512 LIVE image PC = 0.96, SC = 0.94
MPEG-2 768 × 512 LIVE video PC = 0.95, SC = 0.85
Liu et al. [47] JPEG 768 × 512 LIVE image PC = 0.73, SC = 0.91
Liu et al. [48] JPEG 768 × 512 LIVE image PC = 0.79, SC = 0.91
Zhai et al. [49] JPEG 768 × 512 LIVE image PC = 0.96, SC = 0.91
Babu et al. [50] JPEG 768 × 512 LIVE image R-square = 0.95
Zhang et al. [52] H.264/AVC CIF 50 test videos -
Hua et al. [53] JPEG 768 × 512 LIVE image PC = 0.92, SC = 0.83
Suthahran et al. [55] JPEG 768 × 512 LIVE image PC = 0.94
Ringing Liu et al. [56] JPEG 768 × 512 16 test images -
Liu et al. [57] JPEG 768 × 512 55 test images PC = 0.80, SC = 0.73
Zuo et al. [59] - 171 × 256 LIVE image PC = 0.94
Temporal impairments Borer [71] H.264/AVC CIF, HD - -
Huynh-Thu et al. [72] - QCIF - PC = 0.95
Wolf [75] H.264/AVC SD VQEG phase 1 -
Yang et al. [78] - QCIF 6 SRCs PC = 0.94
aThe used test database; bperformance denotes the correlation with subjective assessment, unless stated otherwise; SRC, source sequence; PC, Pearson’s correlationcoefficient; SC, Spearman’s rank order correlation coefficient.
Blurring and ringing are the main associated degrada-tions when JPEG2000 coding is operated at low bitrateconditions. The quality method proposed in [19] predictsquality of JPEG2000 coded images by combining blur andringing assessment methods. Based on the local imagestructures, a gradient profile sharpness histogram is cal-culated for evaluation of a blur estimation method, and aringing method is generated from regions associated withgradients profiles. Here, a gradient profile is essentially thedistribution of the gradient magnitude along the gradientdirection. It has been argued that the underlying proposed
blur method is insensitive to the inherent blur found innatural images, e.g., out-of-focus blur. The performanceof the method is similar to or better than a number ofcompetitive methods while tested on LIVE JPEG2000 andTID2008 datasets.
A rule-based VQA method given in [82] relies on agroup of pixel domain features of a video. It includesblockiness and blurriness as well as spatial activity, tem-poral predictability, edge continuity, motion continuity,and color continuity. The authors have used already avail-able methods to measure the first five features and have
Shahid et al. EURASIP Journal on Image and Video Processing 2014, 2014:40 Page 13 of 32http://jivp.eurasipjournals.com/content/2014/1/40
Figure 7 A basic scheme for NR-P-based assessment of multipleartifacts.
proposed their own methods for the estimation of themotion continuity and color continuity. A multivariatedata analysis technique has been used to combine all thefeatures for computing a single quality score. The earliestmentioned three features (blockiness, blurriness, and spa-tial activity) are measured on a single frame and the restis calculated on an inter-frame basis. The used approachis to segregate the given set of videos into one of thegiven feature models and then estimate an initial predic-tion of the quality measure. After that, using a low-qualityversion of the video, a correction value is added to theinitial quality estimate of the original videos. The authorsclaim that at the time of publication, this is the firstreference-free quality method for H.264/AVC encodedvideos which have been tested on a relatively large testdatabase.
Noise is an artifact found in images in the form ofa random variation of brightness and color information(see Section 1.3.4 for more details on noise). An empiri-cal formulation of the objective measure of image qualitybased on blur and noise has been proposed in [83]. Themethod is based on the level of image intensity variationsaround its edges. The authors argue that in modern digi-tal cameras, the image signal processor (ISP) enhances theimage by removing noise but in doing so, it may deterio-rate the image texture. Hence, there is a need of finding a
trade-off between noise and blur and it provides a ratio-nale for combining the estimation of noise and blur inthe same method. Specifically, this method considers sim-ulated conditions of white noise as source of the noiseartifact in the test stimuli.
Another joint method for noise and blur estimation isfound in [84]. It estimates the amount of degradationsintroduced by additive white noise, Gaussian blur, anddefocus blur on the quality of an image. Given the factthat noise disturbs virtually all the spatial frequencies ofan image and causes an adverse rise in the higher frequen-cies while blur has attenuation effect on them, it is justifiedto study the joint impact of noise and blur on the per-ceptual quality. The authors have evaluated the impact ofnoise in both spatial and frequency domain while only thefrequency domain is used for blur estimation. The centralidea is to influence the power spectra of the image in orderto highlight the impact of the distortions on the spectrumproperties. The source of noise in the test stimuli used inthis work is also white noise. The proposed method hasnot been tested for its correlation with subjective assess-ment but it has a competitive performance in comparisonwith a contemporary method [85] of blind image qualityevaluation.
In [86], a sharpness method is presented which is sen-sitive to the prevailing blur and noise in an image. Themathematical formulation of the method is based onimage gradients computed through singular value decom-position (SVD) rather than edge detection as commonlyfound in contemporary pixel-based structure measures.However, it requires a prior estimate of noise variance.This issue has been resolved in the authors’ later con-tribution [87]. Simulations on realistic noise data havesubstantiated the potential usage of this method in param-eter optimization issues of image restoration such asapplications for denoising. The support vector regression(SVR)-based method reported in [88] uses singular vec-tors from the SVD data instead of using singular valuesas in [87]. Various artifacts would modify the singularvectors, and hence the geometry of the distorted imagewill be changed leading to visual annoyance as perceivedby humans. The usefulness of the method was tested onmultiple image databases with a variety of artifacts. Theresults were found to be in accordance with subjectiveratings.
Another quality method based on gradient statistics ofJPEG and JPEG2000 images, degraded by blockiness andblur, is presented in [89]. This method differs from themethods given above in one way that it does not com-bine the estimated amount of artifacts to yield a singlequality score. Instead, it uses the same approach of cal-culation of local features in gradient domain for both ofJPEG and JPEG2000 images and then estimates the qual-ity of the two sets separately. The obtained results lie in
Shahid et al. EURASIP Journal on Image and Video Processing 2014, 2014:40 Page 14 of 32http://jivp.eurasipjournals.com/content/2014/1/40
accordance with some contemporary methods of block-ing estimation in JPEG images and blur estimation inJPEG2000 images. Further, an artificial neural network hasbeen used in [90] to combine a blocking method, a blur-ring method, and a ringing method to estimate the overallquality of an image. Quality estimators targeted for imagesencoded by JPEG2000 usually quantify ringing only, butsuch images may contain blur as well. The method pro-posed in [91] first determines the type of distortion byusing an ANN classifier and then, depending on theseresults, either uses a ringing [92] or blur [43] method forthe quality assessment.
Different from the aforementioned IQA methods,another example of a composite method has beenproposed for videos [93]. This method is based on block-ing and flickering measure of H.264/AVC encoded videos.It correlates well with subjective quality assessment andalso with the structural similarity (SSIM) index [94].
Most of the VQA methods are processed in the lumi-nance plane only to simplify the computational complex-ity. However, the method proposed in [95] computes threeartifacts both in the luminance and chrominance planesof a video. In this method, they compute the significanceof the direction in which an artifact is calculated for deter-mining its contribution to perceptual quality assessment.Hence, for example, the value of blur in vertical directionhas been given more weighting than the same in hori-zontal direction. In this method, blocking is measured bycomputing boundary smoothness between 8 × 8 blocksand block visibility detection. The third impairment whichis considered is jitter/jerkiness. Finally, a multiple regres-sion scheme is employed for weighted integration of thesix feature values towards the corresponding quality value.The suggested quality predictor bears competitive corre-lation with subjective MOS when compared with somecontemporary methods as tested on standard-definitiontelevision (SDTV) sequences found in VQEG Phase 1database.
A modular method of combining artifacts both fromspatial and temporal domain for quality estimationhas been proposed in [80]. The method accounts forframe freeze/jerkiness and clearness/sharpness in MPEG-4 encoded videos. It has been claimed that the combinedmodel is an estimator of global visual quality.
1.4.1 DiscussionGiven the fact that a certain type of processing, e.g.,JPEG2000 coding, can introduce more than one kind ofartifacts, it is imperative to have quality estimators thatcan assess the impact of more than one artifact. The appli-cation of the estimation of multiple artifacts becomes evenmore interesting when a certain processing that involvesremoval of an artifact, such as denoising, can produceanother artifact due to its underlying methodology. The
popularity of digital cameras in the recent years increasesthe demand of a quality estimation mechanism to com-pute multiple artifacts that can be used as an aid toimprove the photography experience. Global visual qual-ity estimators such as in [80] are a useful contributiontowards making an overall assessment of a video signalas it can be impaired by spatial artifacts like blurring andtemporal artifacts like jerkiness at the same time. Table 2presents a summary of some of the existing methods ofquality assessment that are based on the estimation ofmultiple artifacts. Overall, it is noted that these methodsshould be tested on higher-resolution images/videos toaccount for the requirements of the new display deviceswith capability of presenting resolutions of HD and above.
1.5 Features measures-based methodsAn image or video signal can be decomposed to obtainvarious features that may be used in the process of esti-mating the perceptual quality of an image or a video.Generally, such features can represent a particular aspectof the visual signal and its relation to the correspondingperceptual quality. Depending upon the nature of the fea-ture with regards to its relation to perceptual quality, acertain feature can be a desired or an unwanted compo-nent of an image or video. For instance, the presence ofsharpness in an image can be perceptually preferred inmany cases and hence it may be considered as a wantedfeature. On the other hand, an image with pixel distor-tions could be considered as of low quality. In addition,certain features represent different characteristics of animage or video and can be used as complementary infor-mation besides other features for making an estimate ofquality. For example, the amount of spatio-temporal infor-mation content of a video can be used to characterize themasking effect on various artifacts that may be present inthe signal. More examples of visual quality relevant fea-tures include local contrast, brightness, colorfulness, andstructural activity [96,97].
Moreover, it has been described in [98] that naturalimages possess a common statistical behavior. This behav-ior has been termed as NSS, and it has been found tobe a useful feature for the description of image quality.There have been numerous applications of NSS includ-ing image segmentation, denoising, and texture analysisand synthesis. Although it was concluded in [98] that themajor usage of scene statistics would be in the investiga-tion of visual sensory processing, these have recently beenproved to be quite useful in the design of no-referencequality methods. It has been found that such common sta-tistical characteristics get distorted by image processingapplications like image compression, and a quantitativemeasure of this distortion can yield the relevant varia-tions in the image quality. Thus, an NSS-driven NR qualityassessment method would provide the measure of the
Shahid et al. EURASIP Journal on Image and Video Processing 2014, 2014:40 Page 15 of 32http://jivp.eurasipjournals.com/content/2014/1/40
Table 2 Characteristic summary of multiple-artifacts-based and features measures-based metrics
Method Reference Processing Resolution Test dataa Performanceb
Multiple Liang et al. [19] JPEG2000 768 × 512 LIVE image, TID2008 (LIVE) PC = 0.92, SC = 0.94
artifacts Pastrana et al. [80] MPEG-4 QCIF, CIF 6 SRCs PC = 0.9, SC = 0.9
NR-P-based Oelbaum et al. [82] H.264/AVC CIF 300 test videos PC = 0.82, SC = 0.75
Choi et al. [83] JPEG2000, noise 768 × 512 LIVE image PC = 0.91
Cohen et al. [84] Noise and blur 256 × 256 75 test images -
Zhu et al. [86] JPEG2000 512 × 768 LIVE image -
Narwaria et al. [88] Multiple Multiple Multiple (LIVE) PC = 0.8894
Liu et al. [89] JPEG, JPEG2000 768 × 512 LIVE image PC = 0.92
Natural scene Zhou et al. [99] JPEG2000 768 × 512 LIVE image -
statistics Lu et al. [100] Multiple 768 × 512 LIVE image Multiple
Shen et al. [102] Multiple 512 × 512 LIVE +26, 260 test images Multiple
Moorthy et al. [103] Multiple 768 × 512, 512 × 384 LIVE image, TID2008 Multiple
Pixel-based Gastaldo et al. [111] JPEG 480 × 720, 768 × 512 LIVE image PC = 0.94
features Li et al. [112] Multiple 768 × 512 LIVE image PC = 0.87, SC = 0.87
Zhang et al. [113] JPEG2000 768 × 512 LIVE image PC = 0.93, SC = 0.92
Zhang et al. [97] JPEG, JPEG2000 768 × 512 LIVE image PC = 0.92, SC = 0.92
Yao et al. [119] - - VQEG phase 1 PC = 0.86, SC = 0.85
Ries et al. [121] H.264/AVC SIF 10 SRCs PC = 0.93
Ries et al. [122] H.264/AVC SIF 10 SRCs PC = 0.93
Pixel-based Sazzad et al. [114] JPEG2000 768 × 512 LIVE image PC = 0.93, SC = 0.96
features and Jiang et al. [127] MPEG-2 HD 72 test images PC = 0.91
artifacts Keimel et al. [129] H.264/AVC HD 7 SRC videos PC = 0.86, SC = 0.85
Sazzad et al. [130] JPEG 640 × 480 490 test image pairs PC = 0.93
aThe used test database; bperformance denotes the correlation with subjective assessment, unless stated otherwise; SRC, source sequence; PC, Pearson’s correlationcoefficient; SC, Spearman’s rank order correlation coefficient.
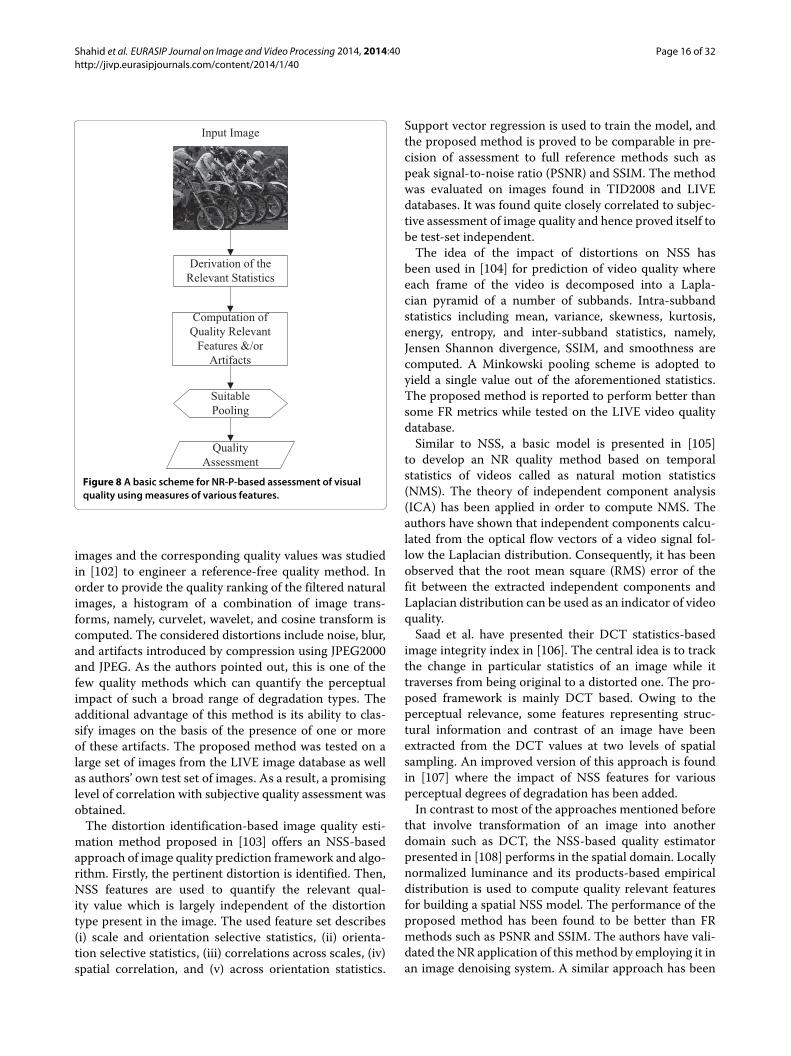
unnaturalness introduced into the natural scene statisticsunder the effect of image distortions. Figure 8 shows abasic schematic block diagram of feature-based methods.We have divided the review of such methods into threesubsections: (i) Natural scene statistics, (ii) Pixel-basedfeatures, and (iii) Pixel-based features and artifacts.
1.5.1 Natural scene statisticsIt has been claimed in [92] that the distortion introducedin the nonlinear dependencies found in natural imagescan be quantified for making an estimate of perceptualquality. Based on that notion, the authors presented anNSS-driven approach for quality assessment of imagesprocessed by wavelet-based compression standards likeJPEG2000.
Similarly, the NSS-based image quality predictionapproach presented in [99] is also limited to be applica-ble only to JPEG2000. The authors have used a neural
network to regress between inputs from NSS-based spec-tral amplitude fall-off curves in combination with posi-tional similarity measure of wavelet coefficients and thecorresponding quality value.
Harnessed by the measures to keep the model attributesunaffected by image content variations, the method pro-posed in [100] uses a contourlet transform [101] to quan-tify the degradations incurred on NSS. The authors showthat wavelet transform does not completely exhibit theartifacts present in the image and the effect of degra-dations is visible in all the subbands of the contourletdomain. Hence, the contourlet domain can be more effec-tive in image quality assessment. The proposed methodhas a clear advantage in precisely predicting the imagequality while tested for images degraded by JPEG2000and JPEG compression and distortions like Gaussian blur,fast fading channel, and white noise. Similarly, a statis-tical relationship between the characteristics of NSS in
Shahid et al. EURASIP Journal on Image and Video Processing 2014, 2014:40 Page 16 of 32http://jivp.eurasipjournals.com/content/2014/1/40
Figure 8 A basic scheme for NR-P-based assessment of visualquality using measures of various features.
images and the corresponding quality values was studiedin [102] to engineer a reference-free quality method. Inorder to provide the quality ranking of the filtered naturalimages, a histogram of a combination of image trans-forms, namely, curvelet, wavelet, and cosine transform iscomputed. The considered distortions include noise, blur,and artifacts introduced by compression using JPEG2000and JPEG. As the authors pointed out, this is one of thefew quality methods which can quantify the perceptualimpact of such a broad range of degradation types. Theadditional advantage of this method is its ability to clas-sify images on the basis of the presence of one or moreof these artifacts. The proposed method was tested on alarge set of images from the LIVE image database as wellas authors’ own test set of images. As a result, a promisinglevel of correlation with subjective quality assessment wasobtained.
The distortion identification-based image quality esti-mation method proposed in [103] offers an NSS-basedapproach of image quality prediction framework and algo-rithm. Firstly, the pertinent distortion is identified. Then,NSS features are used to quantify the relevant qual-ity value which is largely independent of the distortiontype present in the image. The used feature set describes(i) scale and orientation selective statistics, (ii) orienta-tion selective statistics, (iii) correlations across scales, (iv)spatial correlation, and (v) across orientation statistics.
Support vector regression is used to train the model, andthe proposed method is proved to be comparable in pre-cision of assessment to full reference methods such aspeak signal-to-noise ratio (PSNR) and SSIM. The methodwas evaluated on images found in TID2008 and LIVEdatabases. It was found quite closely correlated to subjec-tive assessment of image quality and hence proved itself tobe test-set independent.
The idea of the impact of distortions on NSS hasbeen used in [104] for prediction of video quality whereeach frame of the video is decomposed into a Lapla-cian pyramid of a number of subbands. Intra-subbandstatistics including mean, variance, skewness, kurtosis,energy, entropy, and inter-subband statistics, namely,Jensen Shannon divergence, SSIM, and smoothness arecomputed. A Minkowski pooling scheme is adopted toyield a single value out of the aforementioned statistics.The proposed method is reported to perform better thansome FR metrics while tested on the LIVE video qualitydatabase.
Similar to NSS, a basic model is presented in [105]to develop an NR quality method based on temporalstatistics of videos called as natural motion statistics(NMS). The theory of independent component analysis(ICA) has been applied in order to compute NMS. Theauthors have shown that independent components calcu-lated from the optical flow vectors of a video signal fol-low the Laplacian distribution. Consequently, it has beenobserved that the root mean square (RMS) error of thefit between the extracted independent components andLaplacian distribution can be used as an indicator of videoquality.
Saad et al. have presented their DCT statistics-basedimage integrity index in [106]. The central idea is to trackthe change in particular statistics of an image while ittraverses from being original to a distorted one. The pro-posed framework is mainly DCT based. Owing to theperceptual relevance, some features representing struc-tural information and contrast of an image have beenextracted from the DCT values at two levels of spatialsampling. An improved version of this approach is foundin [107] where the impact of NSS features for variousperceptual degrees of degradation has been added.
In contrast to most of the approaches mentioned beforethat involve transformation of an image into anotherdomain such as DCT, the NSS-based quality estimatorpresented in [108] performs in the spatial domain. Locallynormalized luminance and its products-based empiricaldistribution is used to compute quality relevant featuresfor building a spatial NSS model. The performance of theproposed method has been found to be better than FRmethods such as PSNR and SSIM. The authors have vali-dated the NR application of this method by employing it inan image denoising system. A similar approach has been
Shahid et al. EURASIP Journal on Image and Video Processing 2014, 2014:40 Page 17 of 32http://jivp.eurasipjournals.com/content/2014/1/40
adopted in [109] to define latent quality factors that wereused to estimate the image quality.
The idea of NSS features-based quality estimator hasbeen used in the case of stereoscopic images as well. Inreference [110], 2D- and 3D-based statistical features areextracted from stereopsis to estimate the image quality.A support vector machine model has been trained usingthese features, and the model has been tested using theLIVE 3D database.
1.5.2 Pixel-based featuresThere are some methods of no-reference quality esti-mation which rely on certain statistics, mainly spatialfeatures, derived from pixels of an image or video to per-form the corresponding perceptual quality evaluation. In[111], the authors present an example where they haveused objective features related to energy, entropy, homo-geneousness, and contrast from the color correlogramof an image. These features have been used to train anANN which serves as a prediction model. Li et al. [112]have also deployed an ANN-based model to devise aquality estimation method using perceptually relevantimage features including phase congruency, entropy of thedegraded image, and gradient of the degraded image. Theimportance of phase of an image for its fidelity repre-sentation is well known, and the gradient of an image isan implication of changes in the luminance of an image.An ANN model is also used in the image semantic qual-ity method presented in [96] where a variety of qualitydescriptive features have been used. The authors arguethat the overall visual quality can be seen in terms ofthe usefulness and naturalness of an image. Sharpnessand clarity are considered as the representatives of use-fulness of an image, whereas brightness and colorfulnessrepresent naturalness. These four representations of use-fulness and brightness are further branched into a large setof pixel-based features; edge pixel distribution, contrast,mean brightness, and color dispersion are a few of theused 14 features. The advantage of using higher numberof features has been shown by better performance of thepredictor.
Compared to the aforementioned methods that rely onthe process of training a particular model by using anextracted set of features, the pixel-activity-based methodproposed in [113] does not use such methodology. Thefocus here is on the activity map of an image, essentiallycontrolled by features, namely, monotone-changing, zero-crossing (ZC), and the existence of inactive pixels, whichare calculated for non-overlapping image blocks. The con-cept of ZC has been used to refer to the places in theLaplacian of an image where the value of the Laplacianpasses through zero, i.e., the points where the Laplacianchanges sign. Such points often occur at edges in animage. The use of ZC as a constituent of an activity map
is justified as the method was proposed for JPEG2000encoded images; and ringing, which can be caused byJPEG2000-based compression, has the potential of gen-erating ZC around contours. Moreover, spatial featuresconsisting of edge information and pixel distortion havebeen used to predict quality of JPEG2000 encoded imagesin [114]. Pixel distortion is computed using standarddeviation of a central pixel and a measure of differencebetween central pixel and its closest neighbor pixels. Edgeinformation relies on zero-crossing rate and a histogrammeasure. Particle swarm optimization has been employedto integrate these features into a single quality index.The authors have presented a similar method in theircontribution [115].
The notion of quality estimation with regards to struc-tural changes in images as a result of distortions hasgained widespread attention. The FR method SSIM [94]is a commonly used representative method of this area.Zhang et al. [97] have put forward a similar approach ofquality estimation based on structural changes. However,the nature of the particular distortion should be knownbeforehand. This method can be used to evaluate degrada-tion caused by the following artifacts but one set at a time:(i) Gaussian blur and noise, (ii) blur and ringing, and (iii)blockiness. In a nutshell, local structural activity is takenin the form of direction spread whereas structural activ-ity weight is computed through a measure of structuralstrength and zero-crossing activity.
Some feature-based methods make use of the proper-ties of HVS to govern the performance of the method forbetter correlation with subjective assessment. A 3D mul-tispectral wavelet transform-based method of NR qualityestimation for color video has been given in [116]. Vari-ous channels of the HVS have been represented by waveletdecomposition of the video. To invoke the impact of theHVS, a perceptual mask of sensitivity with integratedimpacts of spatio-temporal contrast and luminance hasbeen applied to all wavelet bands. The final step is to drawa perceptual mask weighted flow tensor between succes-sive frames to define the method. An ANN has been usedin [117] with an extreme learning machine (ELM) algo-rithm for determining the relationship between spatialstatistics of an image and its corresponding quality. Thesestatistics are mainly HVS-inspired features, namely, edgeamplitude, edge length, background activity, and back-ground luminance of an image. As the proposed methodis basically targeted at JPEG encoded images, some ofthe underlying methodologies which help calculate thesefeatures are focused on computation of blockiness. SinceDCT coding is used in video coding also, the proposedalgorithm can be generalized to be workable for videoquality assessment.
In the experiments on determining the visual interestfor different objects and locations inside an image, it has
Shahid et al. EURASIP Journal on Image and Video Processing 2014, 2014:40 Page 18 of 32http://jivp.eurasipjournals.com/content/2014/1/40
been found that HVS perception is not spatially uniform.Instead, there are specific areas called region of interest(ROI), which draw more attention and hence contributemore towards overall quality assessment of an image.Treisman et al. [118] observed that the visual systemnotices and codes different features in parallel channelsbefore the observer actually recognizes the objects in animage. Features such as color, brightness, and orienta-tion can be pooled together to form a unique entity tobe observed. Based on this observation, there exist IQAmethods which assess perceptual quality of an image byfocusing mainly on those ROIs. One such method is pro-posed in [119] where the impact of importance of variousROIs in a video frame has been integrated into a wavelet-based just noticeable difference (JND) profile of visualperception. The proposed method works better than somecontemporary methods when it was tested on the VQEGPhase I database.
In order to estimate the impact of packet loss impair-ments on video quality, a method based on edge strengtharound macroblock boundaries is proposed in [51]. Edgestrength values are processed through a low-pass filter,and a threshold value is applied to compute the edgemaps of adjacent rows. Finally, the impact of packet loss iscomputed through a difference between these edge maps.
In order to quantify the quality of enhanced images,the method given in [120] divides an image into smoothand textured areas. A JND formulation of perception isderived based on the local average brightness and localspatial frequency. The effect of enhancement is moni-tored through a comparison of local brightness and a JNDthreshold. The performance of the proposed method isreported to be better than that of conventional averagelocal variance-based methods.
Features-based assessment of the content of an imageor video can be used in the estimation of perceptual qual-ity. Ries et al. have shown the relevance of the contentclass of videos in the process of determination of thevisual quality in [121]. The authors classify a given setof videos into five groups based on the content. One ofsuch group, called class here, contains videos which havea small moving ROI with a still scene in the background.Another content class has videos with huge spread ofangle of movie capturing device and is called panorama.These content classes are created based on the statisticsthat are mainly related to motion dynamics of a video.Values of zero motion vector ratio, mean size of motionvector, uniformity of the movement, horizontalness ofmovement, and greenness are the classification parame-ters which are used to segregate the set of videos intodifferent content classes. The central idea of the methodis to first check the content class of a video and then esti-mate the visual quality based on bitrate and frame rate.The authors continued working on the same idea in their
contribution found in [122] where they have presenteda method aimed at the most common content classes ofvideos for handheld devices. Khan et al. have proposeda content-based method to combine encoding and trans-mission level parameters to predict video quality in [123].Based on spatio-temporal features, the videos are firstdivided into content-based groups using cluster analysis.Adaptive network-based fuzzy inference system (ANFIS)and a regression model have been used separately to esti-mate the quality score. As per their results, transmissionparameters like packet error rate have more impact on thequality than the compression parameters such as framerate etc. The underlying techniques of ANFIS model andcontent clustering have been used in the authors’ othercontributions as given in [124,125].
1.5.3 Pixel-based features and artifactsSome of the existing no-reference perceptual qualityassessment methods are composed of a set of spatial fea-tures combined with some measurement of artifacts. Aset of spatial artifacts has been combined with some spa-tial image features to estimate perceptual image qualityin [126]. An ANN model was trained with these featuresfor the quality prediction. Working on a similar approach,the method presented in [127] integrates spatial featuressuch as picture entropy (represents the amount of infor-mation of a picture) and frequency energy (distributionof frequency energy in images) with artifacts, namely,blur and blockiness. The proposed method seems promi-nent because of its use of the chrominance informationalso while most of the contemporary quality measuresare based on statistics from the luminance channel only.In this contribution, it has been shown that extractionof these features from ROI further improves the value ofcorrelation with subjective scores. Five features of qual-ity significance have been used to model an ANN-basedquality predictor in [128] where the features set consti-tutes a measure of artifacts such as blocking and ringingand spatial statistics such as zero-crossing rate, edge activ-ity measure, and z-score. Another method built on similarprinciple is found in [129] where the amount of blurringand blocking has been combined with spatial activity in animage and predictability of an image. A partial least squareregression (PLSR) approach has been used to deter-mine the function between these features and the qualityvalue.
The approach given in [130] uses local segmented fea-tures related to degradation and dissimilarity for qualityestimation of 3D images. In fact, the essential method-ology used in [114] for 2D images have been extendedto be employed for 3D images in [130]. One of the keymeans used to check disparity in left and right images ofa stereoscopic image is the block-based edge informationmeasure.
Shahid et al. EURASIP Journal on Image and Video Processing 2014, 2014:40 Page 19 of 32http://jivp.eurasipjournals.com/content/2014/1/40
The authors in [131] propose a method for the assess-ment of facial image quality. Eye-detection, sharpness,noise, contrast, and luminance values of a test image arecalculated. A weighted sum of these quantities constitutesthe value of the quality method. In view of the discussionpresented in [132], relatively more weighting has beengiven to sharpness and eye-detection as they are moreimportant for determining facial image quality.
In [133], a set of artifacts, namely, blocking, ringing,truncation of the number of bits for image values, andnoise is combined with a set of features including contrastand sharpness for designing a video quality predictionmethod. Each of these parameters is fitted separately ina functional relationship with subjective assessment ofquality such that the correlation between the parametervalues and subjective scores is maximized. Subsequently,these individual fitting functions are merged together toform a joint relationship with the perceptual quality. Thedata used for training includes original videos as well asdifferent combinations of sharpness-enhanced and noise-contaminated videos. The trained model is tested onanother data set which reveals a promising correlationwith subjective scores.
Unlike the aforementioned NR-P-based artifacts or fea-tures measures-based methods, the mean square errordistortion due to network impairments for a H.264/AVCencoded video is computed in [134]. An estimate of MSEis computed using the pattern of lost macroblocks dueto an erroneous transmission of the video. Informationabout the lost macroblocks is estimated through the tracesof the error concealment process. The same methodologyhas been enhanced in [135] for more general applicationscenarios such as no assumption is done about a certainerror concealment algorithm and it does not require theknowledge of exact slicing structure.
1.5.4 DiscussionFrom the review of the features measures-based methods,we can make some general observations. The approach ofestimating visual quality by quantifying the impact of dis-tortions on natural scene statistics has gained a wide inter-est to gauge degradations due to different image process-ing techniques including compression. However, more ofsuch approaches should be tested in the case of videos aswell. Moreover, assessment of quality degradation due tonetwork impairments using NSS-based approaches couldbe useful. The pixel-based and features-based approachescan be seen as composed of techniques that rely on a vari-ety of spatial features including those related to edges,contrast, and some measures of structural information.The performance of these approaches can be enhancedby adapting the computational procedure with regardsto the input of HVS preferences. Additionally, includingthe impact of mostly occurring artifacts such as blurring,
blocking, or noise could be an advantage. We observe thatmost of the pixel domain features-based approaches havebeen designed for images and it is desirable to generalizethe relevant methods for applications in the case of videos.Temporal pooling quality methods such as Minkowskisummation or other methods such as adaptive to percep-tual distortion [136] can be used for this purpose. Table 2presents a summary of some of the methods discussedin this section. It is evident that most of the meth-ods in this category exhibit very promising performance,with correlation coefficient values equal to or higherthan 0.85.
1.6 Bitstream-based methodsAn estimate of the quality of an encoded video can bemade by parsing the coded bitstream to deliver readilyavailable features such as encoding parameters and net-work quality of service (QoS)-related parameters. Themethods that adopt the usage of the bitstream data forquality estimation avoid the computational complexity ofprocessing the full video data, as full decoding of the inputvideo is not usually required in the case of bitstream-based methods. Another advantage of this type of meth-ods is the use of readily available information from thebitstream that is significant for the quality estimation, forexample, the motion vectors, coding modes, and quan-tization parameter values. However, these methods areinherently coding standard specific as different encodershave different formats of bitstream. There is a range ofquality relevant features that can be extracted by partialdecoding or primary analysis of the bitstream data. Theperformance of such methods significantly depends uponthe level of access to the bitstream [137]. A block diagramof general framework in bitstream-based methods is givenin Figure 9. We have divided the discussion of these meth-ods into three categories based on the level of informationused for processing, in accordance with the standardizedmodels recommended by telecommunication standard-ization sector of International Telecommunication Union(ITU-T), as discussed in [138,139]. This includes paramet-ric models (parametric planning model and parametricpacket-layer model) and bitstream layer model. In theformer type, extrinsic features of a video that are of para-metric nature such as bitrate, frame rate, and packet lossrate are used. Bitstream layer models have detailed accessto the payload and intrinsic features related to a video suchas coding modes, quantization parameter, and DCT coef-ficients. The standardization of these models includes themethods designed for estimation of audio quality as well,but our discussion is limited to video quality only.
1.6.1 Parametric planning modelThe parametric planning models have rather low com-plexity as they do not access the bitstream and utilize
Shahid et al. EURASIP Journal on Image and Video Processing 2014, 2014:40 Page 20 of 32http://jivp.eurasipjournals.com/content/2014/1/40
Figure 9 A basic scheme used for video quality assessmentmethods based on bitstream-based features.
bitrate, codec type, and packet loss rate for making acrude estimation of video quality. The work item relatedto this category in ITU-T is known as Opinion model forvideo-telephony applications, G.1070 [140]. ITU-T Rec-ommendation G.1070 proposes a method for the assess-ment of videophone quality, based on speech and videoparameters, that can be used by the network perfor-mance planners for ensuring the given level of end-to-end quality of the service. A quality prediction modelfor MPEG-2 and H.264/AVC encoded videos for IPTVis presented in [141]. The model takes some parametersrelated to encoding information, packet information andclient information to assess the overall quality. In refer-ence [142], a parametric model is proposed that is basedon a simple method of estimating MSE that occurs dueto a given pattern of packet loss. The authors deriveda relationship between average motion vector lengthand MSE and this relation gives a fair estimate of theactual MSE.
1.6.2 Parametric packet-layer modelThe packet layer models have access to the packet headerof the bitstream and can extract a limited set of param-eters including bitrate on sequence or frame level, framerate and type, and packet loss rate. Parametric packet-layer models are also known as QoS-based methods. Thework item related to this category in ITU-T is knownas non-intrusive parametric model for the assessment ofperformance of multimedia streaming (P.NAMS) [143].The visual quality estimation method proposed in [144]presents an approach where it is not required to decodethe video at any level, suitable for situations where
the encoded video is encrypted. Given the observationthat error concealment is more effective when there isless motion in the video, an estimation of the motiondynamics of a particular video is required to assess theeffectiveness of an error concealment strategy. In thismethod, the ratio of the average of the B (bi-predictivecoded) frame data size to the average of the size ofall frames is compared with a predetermined thresh-old to adjust the value of the video quality score. Theresults obtained from the effectiveness of error conceal-ment are refined by adjusting the values in accordancewith the importance of the region in which the error hasoccurred.
The models in [141,145] are designed for H.264/AVCcoded SD and HD videos where a support vector machine(SVM) classifier has been used to assess the video qualitybased on the visibility of packet loss. By the same researchgroup, the packet layer model presented in [146] usesvideo resolution, bitrate, packet loss rate, and some infor-mation of the codec settings to design a quality estimatorfor H.264/AVC- and MPEG-2-based encoded videos. Animprovement on such statistical parameters-based mod-els is found in [147] where temporal and spatial charac-teristics of a video are estimated from the packet headerto build a content-adaptive model for quality assessment.The no-reference method presented in [148] is basedon a nonlinear relationship between an objective qual-ity metric and the quality-related parameters. To make itcomputationally simple, the authors have used only twoparameters, namely, packet loss rate and the value of theinterval between intra-frames of a video.
In [149], the authors have presented preliminary resultsof their investigation into streamlining the impacts ofdifferent conditions of packet loss over visible degrada-tion to classify packet loss as visible or invisible. Theparameters used in the decision making are extractedfrom the encoded bitstream. This model was tested forSD resolution H.264/AVC coded videos. If 25% or lesssubjects perceived an artifact, such a packet loss eventwas classified as invisible. If 75% or more subjects per-ceived an artifact, the corresponding packet loss event wasclassified as visible. In this case, the artifacts perceivedby subjects between 25% and 75% were not accountedfor at all. This issue was addressed in the authors’ latercontribution [150] where all artifacts perceived by lessthan 75% subjects were classified as invisible. Moreover,they extended the model by including more quality-relevant parameters and generalized it by testing it on HDvideos. The authors applied the same model for High Effi-ciency Video Coding (HEVC) encoded videos to examineits cross-standard performance, as reported in [151]. Itwas observed that the artifact visibility slightly increaseswhile changing from H.264/AVC to HEVC-based videocoding.
Shahid et al. EURASIP Journal on Image and Video Processing 2014, 2014:40 Page 21 of 32http://jivp.eurasipjournals.com/content/2014/1/40
1.6.3 Bitstream layer modelIn the bitstream-based methods, bitstream layer mod-els have access to most of the data that can be used forthe video quality estimation. The work item paramet-ric non-intrusive bitstream assessment of video mediastreaming quality (P.NBAMS) [152] in its mode 1 (pars-ing mode) is related to the bitstream layer models. Inthis mode, it is allowed to do any kind of analysis ofthe bitstream except the usage of the pixel data. Theinput information includes parameters extracted fromthe packet header and payload. Besides the parametersincluded in the parametric models, this model uses QP,DCT coefficients of the coded video, and pixel informa-tion. This makes the model comparatively more com-plex but it generally offers better performance. A low-complexity solution of video quality prediction based onbitstream extracted parameters is found in [153]. Thefeatures used are mainly related to the encoding param-eters and are taken on sequence level. Low complexityhas been achieved by using a simple multilinear regres-sion system for building the relationship between theparameters and quality values. An improvement of thisapproach is presented in [154] where the required numberof parameters has been reduced for computational effi-ciency and the prediction accuracy has been improved bythe virtue of the usage of an ANN. A further improve-ment is found in [155] where a larger features set is usedand the prediction of subjective MOS is also performed.A set of 48 bitstream parameters related to slice codingtype, coding modes, various statistics of motion vectors,and QP value was used in [156] to predict the qualityof high-definition television (HDTV) video encoded byH.264/AVC. PLSR was used as tool for regression betweenthe feature set and subjective assessment. This methodoutperformed the authors’ earlier contribution [129] andsome contemporary objective methods of visual qualityassessment.
H.264/AVC employs an in-loop filter to suppress block-ing, and this filter has a specific parameter called bound-ary strength (BS) assigned to transform blocks. Statisticsof BS combined with QP and average bitrate has beenused in [157] to predict quality of H.264/AVC encodedvideos. The proposed method formulates a linear com-bination of these parameters and a linear regression wasconducted to determine its relationship with the sub-jective assessment scores. A motion-based visual qualityestimation method was proposed in [158] for H.264/AVCencoded videos. In this method, some statistical fea-tures related to motion vectors along with bitrate andframe rate are calculated. PCA is used to identify theparameters most influential in the estimation of videoquality value. Finally, the selected set of features is fedto an equation of quality computation. The inclusion ofmotion features into the reference-free quality assessment
is justified by the fact that the reduction in visual qual-ity is less for a certain level of compression when themotion is low, for example, the case of videos with staticscenes.
A PSNR estimator for H.264/AVC encoded video ispresented in [159] where bitrate, QP value, and codingmode are used as the features for quality prediction. Themethod given in [160] uses QP and block coding modeparameters for quality prediction of H.264/AVC encodedvideos.
Based on an opinion model from ITU-T [140], an auto-matic QoE monitoring method is proposed in [161]. Itdepends on the network level information derived frompacket loss pattern and loss rank of a frame in a groupof pictures (GOP) and a measure of motion vectors torepresent motion activity to train an ANN model againstsubjective scores of expert viewers.
In [162], the authors proposed a framework for qual-ity estimation where a QoS parameter, packet loss rate,is combined with spatial and temporal complexities ofa video. Usually, a complete decoding of the video isrequired to estimate its spatial and temporal complexityas these complexity values are generally obtained by anaverage measure of the pixel variance of codeblocks ina frame. However, the authors have proposed a methodof estimating spatial and temporal complexity from thebitstream information only. Specifically, they have devel-oped a rate-distortion model for QP value and bitratewhich helps in estimating the complexity measure. Com-bining this complexity estimate with effects of packet lossdelivers a measure of frame quality. Temporal domainquality degradation is computed through occurrences offrame freeze or frame loss. An overall estimate of the videoquality is made by a pooling scheme which integrates thespatial and temporal quality indicators. The authors haveargued that the suggested method can be used for real-time video services due to its fair accuracy and efficiencyin computational cost.
In [163], the impact of compression on quality esti-mated through MSE prediction using DCT coefficientsdata [164] is combined with (i) a packet loss model sim-ilar to the one presented in ITU-T Recommendation G.1070 [140], (ii) a frame type-dependent packet loss model,and (iii) a frame type- and error pattern-dependent modelseparately. It was concluded from the obtained results thata combination of [164] and (iii) offers the best predictionof visual quality of these three combinations.
Bitstream layer methods can also utilize the DCT coef-ficients data of the encoded image or video, as it canbe obtained by partial decoding [138]. There are severalsuch methods which make a quality estimate based onthe statistics of the DCT coefficient values. Eden [165]has proposed an algorithm for estimation of PSNR usingthe assumption that the probability distribution function
Shahid et al. EURASIP Journal on Image and Video Processing 2014, 2014:40 Page 22 of 32http://jivp.eurasipjournals.com/content/2014/1/40
(pdf) of DCT coefficients follows Laplacian distributionfor H.264/AVC encoded videos. A modified Laplacianmodel for estimation of DCT coefficients distribution hasbeen presented in [166] for JPEG images. The authorsproposed to use maximum likelihood with linear predic-tion estimates to compute the parameter λ (lambda) ofthe Laplacian pdf, where λ is a parameter of the distribu-tion. Investigation of the correlation between distributionparameters at adjoining frequencies and integration ofthe prediction results using maximum-likelihood param-eters are the key components of this method. They havealso used Watson’s model [167] for perceptual weightingof local error estimates in an image. The method givenin [166] has been upgraded to be workable for videosin [168]. Here, the video quality predictor has a local errorassessment unit, besides having statistics from motionvectors. These values are passed to a perceptual spatio-temporal model that incorporates the HVS sensitivityto produce the visual quality score. Two more methodsbased on the similar approach from these authors arePSNR estimation for H.264/AVC encoded videos [169]and PSNR estimation for MPEG-2 encoded videos asgiven in [170].
Contrary to the assumption of Laplacian distribution tomodel DCT coefficients, it has been argued in [171] that aCauchy distribution better suits the H.264/AVC encodeddata in the process of quality estimation. The proposedapproach has been found to be better than the Laplaciandistribution [165] in terms of bias between the actual andestimated values of PSNR.
The authors in [172] have used DCT basis functionsto evaluate kurtosis measure of images for quality assess-ment. Three different kinds of kurtosis measures havebeen made, namely, 1D kurtosis based on frequency band,basis function-based 1D kurtosis, and 2D kurtosis. How-ever, the proposed scheme is meant only for imagesdegraded by blur and it has been tested on LIVE [14] dataset JPEG2000 encoded images.
Nishikawa et al. presented a PSNR estimation methodof JPEG2000 coded videos in [173] which is actually ano-reference version of their earlier article that neededreference information [174]. The method estimates thePSNR by using wavelet coefficients from the neighbor-ing frames of the frame which has lost some compressedcodeblocks. It is assumed that the effect of packet lossupon codeblocks is possible to compute at the receiverend, given that only packet loss occurs and no bit errorsexist.
1.6.4 DiscussionBitstream-based methods of VQA have recently receiveda significant attention for their computational simplicityand applications in the online quality monitoring. Poten-tially, the main advantage of these methods is the variety
in choice of the features which can be used for quality esti-mation that in turn means the privilege of adapting to thedesired level of complexity. As compared to pixel-basedprocessing, the bitstream-based methods have specialadvantage of having access to readily available informationsuch as bitrate, frame rate, QP, motion vectors, and vari-ous types of information regarding the impacts of networkimpairments. However, these methods are coding schemespecific that makes them less generally applicable. In thecase of parametric planning models, the performance ofquality estimation remains limited due to the constraintsof the information that can be obtained from the allowedlevel of access to the bitstream. Packet layer models havebetter performance with popular application in interme-diate nodes of a network as they do not need complexprocessing and decryption of the data. Bitstream layermodels are superior in the performance and the com-plexity can be flexible depending upon the desired levelof accuracy. For possible future works in this area, somecomparative performance reports of various models, suchas the ones presented in [139,175] would be useful to fur-ther accelerate the research in designing better bitstream-based VQA approaches. As we notice in the summary ofbitstream-based methods in Table 3, the research commu-nity has mostly embraced H.264/AVC-based coding forthe design of such methods. It would be advantageousto develop such methods for other popular coding stan-dards as well. Moreover, analysis of the features relevantfor quality estimation for the recently approved ITU-T standard of video coding, namely, H.265/HEVC [176]would be useful. For example, in [177], it has beenshown that the existing methods of MSE estimationare not feasible for HEVC as it has significantly dif-ferent coding structure as compared to the previousstandards.
1.7 Hybrid of NR-P and NR-B methodsThere are no-reference visual quality estimation meth-ods which combine features from the coded bitstreamand some statistics from the decoded media. This typeof methods inherits the simplicity of computation fromthe bitstream-based approaches, and further accuracyin quality estimation is achieved by adding input fromthe pixel-based approaches. Therefore, such methods canavoid some of the difficulties involved in the pixel andbitstream-based methods [178]. One such example is thefusion of artifacts like blocking or blurring with param-eters derived from motion vectors to build up a qualityestimation method. The work item P.NBAMS [152] in itsmode 2 (full decoding mode) is related to the hybrid mod-els where the information from the coded bitstream aswell as reconstructed video can be used. Figure 10 gives anoverview of the methodology used in this type of methods.Essentially, the choice of the features for extraction from
Shahid et al. EURASIP Journal on Image and Video Processing 2014, 2014:40 Page 23 of 32http://jivp.eurasipjournals.com/content/2014/1/40
Table 3 Characteristic summary of NR-B and hybrid metrics
Method Reference Processing Resolution Test dataa Performanceb
Bitstream-based Saad et al. [106] Multiple 768 × 512 LIVE image SC = 0.8
Saad et al. [107] Multiple 768 × 512 LIVE image SC = 0.93, PC = 0.93
Yamada et al. [144] H.264/AVC 1, 440 × 1, 080 - PC = 0.85
Rossholm et al. [153] H.264/AVC QCIF 288 test videos PC (PEVQ) = 0.95
Shahid et al. [154] H.264/AVC QCIF 288 test videos PC (PEVQ) = 0.98
Shahid et al. [155] H.264/AVC QCIF, CIF 120 test videos PC = 0.98
Keimel et al. [156] H.264/AVC HD - PC = 0.93
Lee [157] H.264/AVC QCIF 13 SRCs PC = 0.9
Ries et al. [158] H.264/AVC QCIF, SIF, CIF - PC = 0.80
Yang et al. [162] MPEG-4 QCIF - PC = 0.93, SC = 0.93
Eden [165] H.264/AVC HD 5 SRCs PC (PSNR) = 0.99
Brandão et al. [166] JPEG 768 × 512 LIVE image PC = 0.97, SC = 0.97
Brandão et al. [168] H.264 - 50 test videos PC = 0.93, SC = 0.95
Zhang et al. [172] JPEG2000 768 × 512 LIVE image PC = 0.9
Ichigaya et al. [191] MPEG-2 SD, HD 26 test videos PC (PSNR) = 0.95
Hybrid of NR-P and NR-B Farias et al. [181] H.264/AVC CIF 5 SRCs Regression (PSNR) = 0.79
Shanableh [182] MPEG-2 CIF - PC = 0.93
Shanableh [183] MPEG-2 CIF - NRMSE = 0.046
Davis et al. [184] H.264/AVC - 18 test videos PC = 0.91
Yamada et al. [186] H.264/AVC SD - PC = 0.95
Sugimoto et al. [189] H.264/AVC HD 14 SRCs PC = 0.91
aThe used test database; bperformance denotes the correlation with subjective assessment, unless stated otherwise. SRC, source sequence; NRMSE, normalized rootmean square error; PC, Pearson’s correlation coefficient; SC, Spearman’s rank order correlation coefficient.
Figure 10 A basic scheme for quality assessment methods basedon hybrid of NR-P- and NR-B-based approaches.
bitstream or pixel domain depends on the design require-ments of a method, the availability of a certain type ofdata for quality estimation, and the encoding scheme. Thediscussion on this class of methods is divided into two cat-egories, namely, pixel-based and bitstream-based featuresor artifacts, and statistics of transform coefficients.
1.7.1 Pixel-based and bitstream-based features or artifactsVideo quality-related features and measures of artifactscan be computed both from the pixel and bitstream dataand can be pooled for an overall quality estimate. Onesuch method which focuses on quantifying the percep-tual quality of H.264/AVC encoded videos degraded byloss of packets in the IP networks is presented in [179].The error incurred due to packet loss becomes propaga-tive due to the two types of coding predictions involvedin H.264/AVC encoders, namely, intra-prediction (spa-tial) and inter-prediction (temporal) at the encoder end.Even more errors can be introduced while the decodertries to conceal for the prediction residuals and/or motionvectors lost due to missing packets in the IP bitstream.For simulating the packet loss conditions, a packet lossrate in the range [0.1, 20]% with error patterns generated
Shahid et al. EURASIP Journal on Image and Video Processing 2014, 2014:40 Page 24 of 32http://jivp.eurasipjournals.com/content/2014/1/40
using a two-state Gilbert model set for average burstlength of three packets was used. Quantitatively, the mea-sures involved in the modeling of the proposed methodencompass the impact of errors due to concealment,errors propagated due to loss of reference MBs, and thechannel-induced degradation due to H.264/AVC-specificcoding techniques. The calculations of these distortionsare done on the macroblock level, and the resulting val-ues are summed up to frame and sequence levels. It hasbeen observed that the proposed method yields resultswhich bear good correlation with SSIM [94]. Anothermethod was presented by the same authors in their earlierpublished contribution [180] where the effects of loss ofmotion vector information and prediction residuals wereincorporated for quality estimation. A method in whichtransmission and compression artifacts are integrated forVQA is presented in [181]. The constituents of the methodare estimations of blockiness, blurring, and packet lossratio.
Two MPEG-4 encoded video quality prediction meth-ods based on several MB level statistics, derived frombitstream and reconstructed videos, are reported in [182]for PSNR and in [183] for SSIM. A plethora of bitstream-based and pixel-based features at macroblock level havebeen used in these two methods. One of the distinctiveaspects of these two contributions is the usage of differentmodels for system identification between the parame-ters and the corresponding quality index. In the methodtargeted for PSNR estimation, spectral regression andreduced model polynomial network have been employed.A multipass prediction system based on stepwise regres-sion has been used in the estimation of SSIM method.The statistical features in both of the methods constitutemainly the coding information of an MB, some relativemeasures of motion vector of neighboring MBs, and somenumerical values related to the texture of an MB.
Average QP values were combined with pixel differencecontrast measure values to offer a visual quality methodin [184]. The authors have shown that the method out-performs PSNR for a wide range of bitrates of H.264/AVCencoded videos. Similarly, two parametric models havebeen combined in [185] to design a hybrid model ofperceptual quality for H.264/AVC encoded videos. Thismethod uses average value of QP and an average measureof contrast from the decoded video, besides having inputfrom noise masking property of the video content.
A hybrid of bitstream-based and pixel domain qualityestimator is proposed in [186]. It has been argued thata video quality estimation merely based on the amountof impaired macroblocks could be erroneous as, in mod-ern video decoders, some error concealment methodsare applied to cure the impaired macroblocks and thisconcealment is not accounted for in such estimations.As the error concealment may not always be effective,
the proposed method uses motion intensity and lumi-nance discontinuity measures to estimate the numberof impaired macroblocks for which error concealmentremains ineffective. In essence, the visual quality, in termsof MSE, is estimated directly based on the macroblocksfor which the error concealment could not perform well.The same authors have generalized this approach for threemethods of error concealment and a different value ofpacket length in [187].
In order to estimate the impact of transmission errorson the quality of H.264/AVC encoded videos, a saliencymap-based method is proposed in [188]. Color, contrast,and luminance information has been used to computespatial saliency map, while motion vector information,readily available in coded bitstream of a video, has beenexploited for the computation of temporal saliency maps.A squared sum of spatial and temporal saliency maps hasbeen used to pool them together for computing the over-all spatio-temporal map. Accordingly, this map is usedfor weighting of an error map for each video frame tocalculate the value of the proposed model.
Another hybrid method of perceptual quality measure-ment, which is based on information from the bitstreamand spatio-temporal image features, is presented in [189].The weighted Minkowski method is employed to integratethe average quantization scale with their proposed mea-sures of flickering and blocking for H.264/AVC encodedvideos.
A framework for a hybrid method for videos transmit-ted over long term evolution (LTE) networks is proposedin [190]. It suggests to include parameters from packetlayer (packet loss rate, packet size), bitstream layer (frameerror, frame duration), and media layer (blurring, block-ing) for estimation of the quality. However, a suitable pool-ing scheme to integrate these parameters into a qualityindication value remains as a future work.
1.7.2 Statistics of transform coefficientsIn some cases, the transform coefficients can be obtainedthrough partial decoding of the coded bitstream data andfeatures from bitstream as well as pixel domain can becombined for the quality estimation. One such example isfound in [191] where an estimate of PSNR has been com-puted for MPEG-2 coded videos using DCT coefficients.This is actually an improved version of the authors’ earliercontribution [192] in which they modeled the distribu-tion of DCT coefficients as a Laplacian pdf to calculatePSNR of the video frames one-by-one for all types, i.e., I,P, and B frames. However, it lacks in accuracy of assess-ment for B frames. Therefore, the authors conjecturedthat this happens as a result of fall in the amount of DCTcoefficients information which is available for B framesdue to processes of rate control and motion compensa-tion. Henceforth, a hybrid approach to resolve this issue
Shahid et al. EURASIP Journal on Image and Video Processing 2014, 2014:40 Page 25 of 32http://jivp.eurasipjournals.com/content/2014/1/40
has been found in [191] where picture energy has alsobeen used in addition to DCT coefficients. There is a sig-nificant improvement of correlation with estimated andactual PSNR, in the case when the proposed method wastested on SDTV and HDTV sequences.
1.7.3 DiscussionThe hybrid methods use not only pixel-based informa-tion but also bitstream-based information, which in turnmakes the hybrid framework having a potential of beingthe most accurate quality estimator as compared to theother approaches [193]. Thus, the importance of care-ful combination of the features from pixel and bitstreamdomains is evident. Further studies are needed to investi-gate the interaction among various types of artifacts dueto compression and transmission and the joint impacttowards the video quality.
Various approaches exist on how to combine the impactof various sources of degradation into one representa-tive value for all the artifacts under consideration. In therecommendation ITU-T P.1202.1 that presents a com-plementary algorithm of NR quality assessment for therecommendation P.NBAMS [152], four types of degrada-tions are sorted with respect to their impact on quality.The values of the two most significant artifact types arepooled together through a linear combination. A higherweighting is applied to the artifact value that is found tobe the most significant out of the four types. As differ-ent artifact types can exist in different range of values, itis important that all of them are aligned to the same scalebefore the sorting is applied. Besides linear combination,some contributions [189] adopt the Minkowski metric [3]for pooling the values of different artifacts into a singlequantity.
With regards to the preference on which a pooling strat-egy should be chosen it may depend on many factorsincluding relative severity of different artifacts, spatio-temporal characteristics of the contents, and the presenceof masking effects. Linear combination is more valid if theconstituents can be related to the quality value througha linear regression. While combining different artifactsthrough a linear relation, different artifacts can be givendifferent significance. For example, more weight is givento the impact of bitstream layer features than to media-layer features in the hybrid model given in [194]. On theother hand, the Minkowski metric of summation has itsroots in additive properties of low-level vision. Therefore,it is required to find the suitable value of its exponentthrough measurements.
Most of the aforementioned hybrid methods make anassessment of quality in terms of MSE but this measureof quality is known to be rather inaccurate in represent-ing the perceptual quality [195]. This fact necessitates thedesire of enhancing such methods for better correlation
with subjective quality assessment. As can be seen fromthe summary of hybrid methods in Table 3, the main focusof the development of hybrid methods has been on videos.
2 ConclusionsMotivated by the growing interest in NR methods ofquality assessment for images and videos, we have pre-sented a classification and review of recent approachesproposed in this research area. The available contribu-tions have been classified into different categories basedon the methodologies used in the design. Recognized clas-sifications and standardizations in the area have beenextrapolated to introduce our approach of classification.The new classification enabled us to present a review ofa large amount of recently published work. On the high-est tier, three categories have been identified to group theexisting NR methods. The NR methods that employ pixeldomain approaches for quality assessment are called NR-P-based methods, and the methods that employ encodedbitstream and parametric information of the media sig-nal are called NR-B-based methods. The third category iscalled hybrid methods which are designed by a compositeof NR-P- and NR-B-based methods. A further subcatego-rization has been presented to organize the discussion ofthe review.
It is observed that the majority of the publications intro-duce methods that are processed in the pixel domain.This trend can be attributed to the rich heritage of workin the image processing area. In most cases, pixel-basedmethods require more processing power than bitstream-based methods. NR quality estimation is a widely adoptedapplication in the area of online quality monitoring. Itis thus required to employ computationally less complexmethods. This fact necessitates to focus towards design-ing bitstream-based or hybrid methods. The distortionspresent in a network can introduce a variety of tempo-ral perturbations in a video transmitted through it. Suchperturbations have to be monitored by service providersto ensure a given threshold of visual quality at the endusers’ premises. This can be performed using NR metricswhich estimate the impact of degradation in the temporaldomain. Unfortunately, most of the existing methods aredesigned to account for a single or a limited set of degra-dations. Therefore, it is not easy to make an estimate of theoverall loss of visual quality. Hence, methods which canmake a complete assessment of the quality are desirable.Similarly, attention can be drawn towards designing lesscomplex methods which are not application specific, suchas the methods that are not limited to a particular codingstandard.
In the context of the reviewed methods, it is interest-ing to compare the approaches adopted in case of IQAand VQA methods. In case of IQA, the main focus hasbeen on addressing the most occurring spatial artifacts
Shahid et al. EURASIP Journal on Image and Video Processing 2014, 2014:40 Page 26 of 32http://jivp.eurasipjournals.com/content/2014/1/40
such as blocking, blurring, and ringing as a result of pop-ular compression techniques such as JPEG and JPEG2000.Besides many methods that are specifically designed forparticular artifacts and hence have limited application, itis exciting to see many methods that are not restricted toa specific artifact type and have a wider application area.In such methods of global application, the mostly adoptedapproach is based on computing the impact of distortionson natural scene statistics of natural images. This also sug-gests that such approaches may not be applied to artificialimages (such as animations and cartoons). This issue canbe considered as a challenge for future work in IQA. Morefocus has been seen on the development of bitstream-based approaches in the case of VQA methods. This is ofadvantage in the sense that bitstream-based approacheshave relatively low computational complexity. However,they face the drawbacks of being coding scheme specificand sometimes less accurate. We believe that the devel-opment of more robust approaches based on hybrids ofNR-P and NR-B methods may be beneficial to meet thesechallenges associated with the NR VQA area.
We observe that many of the existing contributionsin NR IQA and VQA have reported the results of theproposed methods therein by doing the relevant perfor-mance tests on the publicly available test databases. Thisis useful for independent benchmarking and performancecomparison tests of these methods by other researchers.Therefore, more variety in the content and resolution ofthe media available through public test databases wouldbe of great value. On the other hand, one general draw-back of many existing methods of NR quality assessmentlies in the limited use of the test data, as the data usedfor the designing or training of a metric is often alsoused for its performance verification. This drawback actu-ally does not allow to draw meaningful results from suchstudies. Also, it has been observed that most of the exist-ing methods for video quality assessment are limited toone encoder implementation or rather one particular set-ting of an encoder. Hence, cross-encoder design of VQAmetrics would be a useful contribution. Moreover, weenlist the following trends and directions towards futureresearch in the area of NR quality assessment:
• The trend of contribution in the NR quality estima-tion has been settling towards finding approaches oflesser complexity as shown by the growing interestin the bitstream-based methods. However, bitstream-based methods face the challenge of being limited for aspecific codec. Given the fact that such methods havebeen shown to have promising performance by havingreasonable values of correlation with subjective qual-ity assessment, it would be advantageous to generalizethe methodologies of these methods for diverse codingschemes.
• The performance of the bitstream-based methodshas been found to be largely content dependent, asthe spatio-temporal perceptual complexities vary withvarying content, and, in turn, the nature of the featuresused for quality estimation also changes. However, inthe case of pixel-based methods, it is relatively easierto differentiate the content characteristics. Thus, it isrequired for bitstream-based models to be trained ona sufficiently high variety in content, enabling them tobe used in practice. Future inventions can focus on thedevelopment of methods that can be applied in moregeneral scenarios with the desired amount of varietyin content.
• The existing NR methods are usually designed andtested for cases where the quality difference is beyondthe threshold of perception of an artifact, i.e., ratherclearly visible. However, attention needs to be paidto scenarios where the test stimuli may already beof high quality. Future developments should there-fore envisage the degradations that are considered inthe category of subthreshold artifacts. The need ofsuch methods becomes even more important withregards to the newly approved HEVC standard thatsupports ultra-high definition video resolutions of 4Kand beyond.
• It has been observed that emphasis is being puttowards making the quality estimation more in linewith the perceived quality by HVS. In the future, theNR quality assessment methods should continue toadapt for HVS parameters and further advancementsin the understanding of HVS, such as attention-drivenfoveated quality assessment models [196] should betaken into consideration.
• A robust combination of audio-visual quality estima-tors can be devised for designing scenario-dependentmodels. For example, in quality monitoring of sportsvideo, more emphasis can be put on the visual com-ponent than audio as the viewers might be interestedmore in video. For example, a video of a footballmatch would draw more focus towards visual scenethan audio, as compared to news or head and shoulderscenario. Moreover, audio-visual quality estimationis challenging due to the complex interplay of HVSpreferences. In terms of the mutual impact of audio-visual subjective quality, some studies report an aver-age cross-modal interaction level of 0.5 MOS [197] toabove 2 MOS points [198] on a scale of 1 to 5 qualityrating.
• Given the presented comprehensive literature review,it has been observed that developments of NR meth-ods that consider visual attention are rather limited,especially, in the case of videos. As noted in [199],visual attention models can be integrated into existingNR methods to make them more robust. Generally,
Shahid et al. EURASIP Journal on Image and Video Processing 2014, 2014:40 Page 27 of 32http://jivp.eurasipjournals.com/content/2014/1/40
the advantage of including visual attention-basedmodeling appears to be larger for methods designedfor video quality assessment than for image qualityassessment methods. Visual attention becomes moresignificant in scenarios of audio-visual stimuli, as it isrequired to account for the cues from visual channelsas well as auditory channels.
• To make the quality estimation closer to the subjec-tive assessment, intelligent methods are needed thatconsider the content preference and expectations ofhumans in a given scenario. For example, the sub-jective quality assessment results mentioned in [200]indicate that desirable content is rated significantlyhigher than the undesirable and neutral contents.
• The task of finding the optimal trade-off betweentemporal and spatial resolution, and the level of quan-tization for its impacts on the perceptual quality indifferent scenarios of application, is challenging [201].This issue should be taken into consideration for thefuture development of NR methods.
• In order to combine independent and isolatedapproaches for the development of hybrid NR VQAmethods, a five-point agenda has been identified byjoint effort group (JEG) at VQEG [202]. We believethat such collaborative works will be instrumental inpaving the ways of NR VQA towards a measurableevolution.
We believe that our contribution in this article can beutilized and extended in various ways. One can use thisreview as a systematic literature review to perform com-parisons on a class of NR methods using the same imageor video test database to highlight the state-of-the-art.Furthermore, this review can be very useful for the begin-ner researchers in this area to achieve a concise yet com-prehensive overview of the field. This way, we expect thiscontribution to be instrumental for future research anddevelopment in the area of NR visual quality assessment.Moreover, a possible future work is to survey the contri-butions for audio-visual quality assessment based on NRparadigm, similar to [203] that deals with FR methods ofaudio-visual quality assessment.
Competing interestsThe authors declare that they have no competing interests.
Authors’ contributionsMS prepared the database of the publications in the area, streamlined thepublications to be reviewed in the paper, planned the structure of the paperin consultation with co-authors, and wrote the main draft of the paper. ARparticipated in writing some parts of the paper and involved in the discussionson improving the manuscript. BL took part in the initial discussions on thepaper topic and gave feedback during the writing process on the structure,the content and its revisions, and wrote the first draft of the conclusions. HJZhelped with refining and structuring the content of the review; participated indrafting, correcting, and revising the article; and helped with assessing thereviewed approaches. All authors read and approved the final manuscript.
Received: 15 April 2014 Accepted: 25 July 2014Published: 14 August 2014
References1. Cisco Visual Networking Index, Global mobile data traffic forecast
update, 2013-2018. Cisco white paper (2014)2. ITU, ITU-R Recommendation BT.500-13 Methodology for the subjective
assessment of the quality of the television pictures. http://www.itu.int/rec/R-REC-BT.500-13-201201-I/en. Accessed 4 November 2013
3. HR Wu, KR Rao, Digital Video Image Quality and Perceptual Coding(Signal Processing and Communications). (CRC, Boca Raton, 2005)
4. SS Hemami, AR Reibman, No-reference image and video qualityestimation: applications and human-motivated design. Signal Process.Image Commun. 25(7), 469–481 (2010)
5. Z Wang, AC Bovik, Reduced- and no-reference image qualityassessment. IEEE Signal Process. Mag. 28(6), 29–40 (2011)
6. W Lin, C-c Jay Kuo, Perceptual visual quality metrics: a survey. J. Vis.Commun. Image Representation 22(4), 297–312 (2011)
7. M Vranješ, S Rimac-Drlje, K Grgic, Review of objective video qualitymetrics and performance comparison using different databases.Signal Process. Image Commun. 28(1), 1–19 (2013)
8. S Chikkerur, V Sundaram, M Reisslein, LJ Karam, Objective video qualityassessment methods: a classification, review, and performancecomparison. IEEE Trans. Broadcasting 57(2), 165–182 (2011)
9. R Soundararajan, A Bovik, Survey of information theory in visual qualityassessment. Signal, Image Video Process. 7(3), 391–401 (2013)
10. DM Chandler, Seven challenges in image quality assessment: past,present, and future research. ISRN Signal Processing 53 (2013).(doi:10.1155/2013/905685)
11. U Engelke, H-J Zepernick, Perceptual-based quality metrics for imageand video services: a survey, in EuroNGI Conference on Next GenerationInternet Networks (Trondheim, 21–23 May 2007), pp. 190–197
12. AR Reibman, S Sen, JV der Merwe, Analyzing the spatial quality ofinternet streaming video, in International Workshop on VideoProcessing and Quality Metrics for Consumer Electronics (Scottsdale,January 2005)
13. VQEG, Final report from the Video Quality Experts Group on thevalidation of objective models of multimedia quality assessment,phase I (2008). http://www.its.bldrdoc.gov/vqeg/projects/multimedia-phase-i/multimedia-phase-i.aspx. Accessed 11 April 2014
14. HR Sheikh, Z Wang, L Cormack, Bovik AC, LIVE Image QualityAssessment Database. http://live.ece.utexas.edu/research/quality.Accessed 11 April 2014
15. Video Quality Experts Group (VQEG). http://www.its.bldrdoc.gov/vqeg/downloads.aspx. Accessed 11 April 2014
16. N Ponomarenko, V Lukin, A Zelensky, K Egiazarian, M Carli, F Battisti,TID2008 - a database for evaluation of full reference visual qualityassessment metrics. Adv. Modern Radioelectron. 10, 30–45 (2009)
17. PL Callet, F Autrusseau, Subjective quality assessment IRCCyN/IVCdatabase (2005). http://www.irccyn.ec-nantes.fr/ivcdb.Accessed 11 April 2014
18. ZMP Sazzad, Y Kawayoke, Horita Y, Image Quality Evaluation Database.http://mict.eng.u-toyama.ac.jp/mictdb.html. Accessed 11 April 2014
19. L Liang, S Wang, J Chen, S Ma, D Zhao, W Gao, No-reference perceptualimage quality metric using gradient profiles for JPEG2000. SignalProcess. Image Commun. 25(7), 502–516 (2010)
20. S Winkler, Digital Video Quality: Vision Models and Metrics. (Wiley,Chichester, 2005)
21. N Narvekar, L Karam, A no-reference image blur metric based on thecumulative probability of blur detection (CPBD). IEEE Trans. ImageProcess. 20(9), 2678–2683 (2011)
22. A Ciancio, ALNT da Costa, EAB da Silva, A Said, R Samadani, P Obrador,No-reference blur assessment of digital pictures based on multifeatureclassifiers. IEEE Trans. Image Process. 20(1), 64–75 (2011)
23. X Marichal, W-Y Ma, H Zhang, Blur determination in the compresseddomain using DCT information, in IEEE International Conference on ImageProcessing, vol. 2 (Kobe, 24–28 October 1999), pp. 386–390
24. H Tong, M Li, H Zhang, C Zhang, Blur detection for digital images usingwavelet transform, in IEEE International Conference on Multimedia andExpo, vol. 1 (Taipei, 27–30 June 2004), pp. 17–20
Shahid et al. EURASIP Journal on Image and Video Processing 2014, 2014:40 Page 28 of 32http://jivp.eurasipjournals.com/content/2014/1/40
25. P Marziliano, F Dufaux, S Winkler, T Ebrahimi, Perceptual blur andringing metrics: application to JPEG2000. Signal Process. ImageCommun. 19(2), 163–172 (2004)
26. R Ferzli, LJ Karam, Human visual system based no-reference objectiveimage sharpness metric, in IEEE International Conference on ImageProcessing, (2006), pp. 2949–2952
27. A Ciancio, ALN da Costa, EAB da Silva, A Said, R Samadani, P Obrador,Objective no-reference image blur metric based on local phasecoherence. Electron. Lett. 45(23), 1162–1163 (2009)
28. R Hassen, Z Wang, M Salama, No-reference image sharpnessassessment based on local phase coherence measurement, in IEEEInternational Conference on Acoustics Speech and Signal Processing (Dallas,14–19 March 2010), pp. 2434–2437
29. R Ferzli, LJ Karam, No-reference objective image sharpness metric basedon the notion of just noticeable blur (JNB). IEEE Trans. Image Process.18(4), 717–728 (2009)
30. R Ferzli, LJ Karam, A no-reference objective image sharpness metricbased on just-noticeable blur and probability summation, in IEEEInternational Conference on Image Processing, vol. 3 (San Antonio, TX,USA, 16–19 September 2007), pp. 445–448
31. NG Sadaka, LJ Karam, R Ferzli, GP Abousleman, A no-referenceperceptual image sharpness metric based on saliency-weighted fovealpooling, in 15th IEEE International Conference on Image Processing(San Diego, 12–15 October 2008), pp. 369–372
32. ND Narvekar, LJ Karam, A no-reference perceptual image sharpnessmetric based on a cumulative probability of blur detection, inInternational Workshop on Quality of Multimedia Experience (San Diego,29–31 July 2009), pp. 87–91
33. N Narvekar, LJ Karam, An improved no-reference sharpness metricbased on the probability of blur detection, in Workshop on VideoProcessing and Quality Metrics (Scottsdale, 13–15 January 2010)
34. S Varadarajan, LJ Karam, An improved perception-based no-referenceobjective image sharpness metric using iterative edge refinement, inIEEE International Conference on Image Processing (San Diego, 12–15October 2008), pp. 401–404
35. L Debing, C Zhibo, M Huadong, X Feng, G Xiaodong, No reference blockbased blur detection, in International Workshop on Quality of MultimediaExperience (San Diego, 29–31 July 2009), pp. 75–80
36. P Marziliano, F Dufaux, S Winkler, T Ebrahimi, A no-reference perceptualblur metric, in Proceedings of the International Conference on ImageProcessing 2002, vol. 3 (Rochester, New York, 22–25 September 2002),pp. 57–60
37. A Maalouf, M-C Larabi, A no reference objective color imagesharpness metric, in The European Signal Processing Conference(Aalborg, 23–27 August 2010), pp. 1019–1022
38. S Wu, W Lin, Z Lu, EP Ong, S Yao, Blind blur assessment for vision-basedapplications, in IEEE International Conference on Multimedia and Expo(Beijing, 2–5 July 2007), pp. 1639–1642
39. S Wu, W Lin, S Xie, Z Lu, EP Ong, S Yao, Blind blur assessment forvision-based applications. J. Vis. Commun. Image Representation20(4), 231–241 (2009)
40. C Chen, W Chen, JA Bloom, A universal reference-free blurriness measure.SPIE J. Image Q. Syst. Performance VIII 7867, 78670–7867014 (2011)
41. M-J Chen, AC Bovik, No-reference image blur assessment usingmultiscale gradient, in International Workshop on Quality of MultimediaExperience (San Diego, 29–31 July 2009), pp. 70–74
42. R Ferzli, L Karam, A no reference objective sharpness metric usingriemannian tensor, in International Workshop on Video Processing andQuality Metrics for Consumer Electronics (Scottsdale, 25–26 January 2007),pp. 25–26
43. A Chetouani, A Beghdadi, M Deriche, A new reference-free imagequality index for blur estimation in the frequency domain, in IEEEInternational Symposium on Signal Processing and Information Technology(Ajman, 14–17 December 2009), pp. 155–159
44. Z Hua, Z Wei, C Yaowu, A no-reference perceptual blur metric by usingOLS-RBF network, in Pacific-Asia Workshop on Computational Intelligenceand Industrial Application (Wuhan, 19–20 December 2008),pp. 1007–1011
45. C Oprea, I Pirnog, C Paleologu, M Udrea, Perceptual video qualityassessment based on salient region detection, in Advanced International
Conference on Telecommunications (Venice, 24–28 May 2009),pp. 232–236
46. C Chen, JA Bloom, A blind reference-free blockiness measure, inProceedings of the Pacific Rim Conference on Advances in MultimediaInformation Processing: part I (Shanghai, 21–24 September 2010),pp. 112–123
47. H Liu, I Heynderickx, A no-reference perceptual blockiness metric, in IEEEInternational Conference on Acoustics, Speech and Signal Processing(Las Vegas, 31 March to 4 April 2008), pp. 865–868
48. H Liu, I Heynderickx, A perceptually relevant no-reference blockinessmetric based on local image characteristics. EURASIP J. Adv. SignalProcess. 2009, 1–15 (2009)
49. G Zhai, W Zhang, X Yang, W Lin, Y Xu, No-reference noticeableblockiness estimation in images. Signal Process. Image Commun.23(6), 417–432 (2008)
50. RV Babu, S Suresh, A Perkis, No-reference JPEG-image qualityassessment using GAP-RBF. Signal Process. 87, 1493–1503 (2007)
51. RV Babu, AS Bopardikar, A Perkis, OI Hillestad, No-reference metrics forvideo streaming applications, in International Workshop on Packet Video(Irvine, 13–14 December 2004)
52. Z Zhang, H Shi, S Wan, A novel blind measurement of blocking artifactsfor H.264/AVC video, in International Conference on Image and Graphics(Xian, 20–23 September 2009), pp. 262–265
53. Z Hua, Z Yiran, T Xiang, A weighted Sobel operator-based no-referenceblockiness metric, in Pacific-Asia Workshop on Computational Intelligenceand Industrial Application, vol. 1 (Wuhan, 19–20 December 2008),pp. 1002–1006
54. C-S Park, J-H Kim, S-J Ko, Fast blind measurement of blocking artifacts inboth pixel and DCT domains. J. Math. Imaging Vis. 28, 279–284 (2007)
55. S Suthaharan, No-reference visually significant blocking artifact metricfor natural scene images. Signal Process. 89(8), 1647–1652 (2009)
56. H Liu, N Klomp, I Heynderickx, A perceptually relevant approach toringing region detection. IEEE Trans. Image Process. 19(6), 1414–1426(2010)
57. H Liu, N Klomp, I Heynderickx, A no-reference metric for perceivedringing artifacts in images. IEEE Trans. Circuits Syst. Video Technol.20(4), 529–539 (2010)
58. B-X Zuo, J-W Tian, D-L Ming, A no-reference ringing metrics forimages deconvolution, in International Conference on Wavelet Analysisand Pattern Recognition, vol. 1 (Hong Kong, 30–31 August 2008),pp. 96–101
59. B-X Zuo, D-L Ming, J-W Tian, Perceptual ringing metric to evaluate thequality of images restored using blind deconvolution algorithms.SPIE J. Opt. Eng. 48(3), 037004 (2009)
60. AC Bovik, Handbook of Image and Video Processing, 2nd edn. (ElsevierAcademic, Burlington, 2005)
61. A Amer, E Dubois, Fast and reliable structure-oriented video noiseestimation. IEEE Trans. Circuits Syst. Video Technol. 15(1), 113–118 (2005)
62. J Tian, L Chen, Image noise estimation using a variation-adaptiveevolutionary approach. IEEE Signal Process. Lett. 19(7), 395–398 (2012)
63. SI Olsen, Estimation of noise in images: an evaluation. CVGIP: Graph.Models Image Process. 55(4), 319–323 (1993)
64. K Rank, M Lendl, R Unbehauen, Estimation of image noise variance.IEE Proc. Vis. Image Signal Process. 146(2), 80–84 (1999)
65. A Amer, E Dubois, Fast and reliable structure-oriented video noiseestimation. IEEE Trans. Circuits Syst. Video Technol. 15(1), 113–118 (2005)
66. M Ghazal, A Amer, Homogeneity localization using particle filters withapplication to noise estimation. IEEE Trans. Image Process. 20(7),1788–1796 (2011)
67. X Liu, M Tanaka, M Okutomi, Noise level estimation using weak texturedpatches of a single noisy image, in 19th IEEE International Conference onImage Processing (ICIP) (Orlando, 30 September to 3 October 2012),pp. 665–668
68. X Liu, M Tanaka, M Okutomi, Single-image noise level estimation forblind denoising. IEEE Trans. Image Process. 22(12), 5226–5237 (2013)
69. S Pyatykh, J Hesser, L Zheng, Image noise level estimation by principalcomponent analysis. IEEE Trans. Image Process. 22(2), 687–699 (2013)
70. Q Huynh-Thu, M Ghanbari, Temporal aspect of perceived quality inmobile video broadcasting. IEEE Trans. Broadcasting 54(3), 641–651(2008)
Shahid et al. EURASIP Journal on Image and Video Processing 2014, 2014:40 Page 29 of 32http://jivp.eurasipjournals.com/content/2014/1/40
71. S Borer, A model of jerkiness for temporal impairments in videotransmission, in International Workshop on Quality of MultimediaExperience (Trondheim, 21–23 June 2010), pp. 218–223
72. Q Huynh-Thu, M Ghanbari, No-reference temporal quality metric forvideo impaired by frame freezing artefacts, in IEEE InternationalConference on Image Processing (Cairo, 7–10 November 2009),pp. 2221–2224
73. ITU-T Recommendation J.247: objective perceptual multimedia videoquality measurement in the presence of a full reference. http://www.itu.int/rec/T-REC-J.247/en. Accessed 4 November 2013
74. G Yammine, E Wige, F Simmet, D Niederkorn, A Kaup, Blind framefreeze detection in coded videos, in Picture Coding Symposium(Krakow, 7–9 May 2012), pp. 341–344
75. S Wolf, A no reference (NR) and reduced reference (RR) metric fordetecting dropped video frames, in International Workshop on VideoProcessing and Quality Metrics for Consumer Electronics (Scottsdale,15–16 January 2009)
76. K Watanabe, J Okamoto, T Kurita, Objective video quality assessmentmethod for evaluating effects of freeze distortion in arbitrary videoscenes. Proc. SPIE-Image Qual. Syst. Perform. IV 6494, 64940–1649408(2007)
77. K Watanabe, J Okamoto, T Kurita, Objective video quality assessmentmethod for freeze distortion based on freeze aggregation.Proc. SPIE- Image Qual. Syst. Perform. III 6059, 1–8 (2007)
78. K-C Yang, CC Guest, K El-Maleh, PK Das, Perceptual temporal qualitymetric for compressed video. IEEE Trans. Multimedia 9(7), 1528–1535(2007)
79. RR Pastrana-Vidal, J-C Gicquel, Automatic quality assessment of videofluidity impairments using a no-reference metric, in InternationalWorkshop on Video Processing and Quality Metrics for Consumer Electronics(Scottsdale, 22–24 January 2006)
80. RR Pastrana-Vidal, J-C Gicquel, A no-reference video quality metricbased on a human assessment model, in International Workshop onVideo Processing and Quality Metrics for Consumer Electronics(Scottsdale, 25–26 January 2007)
81. F Battisti, ANM Carli, No-reference quality metric for color videocommunication, in International Workshop on Video Processing andQuality Metrics for Consumer Electronics (Scottsdale, 19–20January 2012)
82. T Oelbaum, C Keimel, K Diepold, Rule-based no-reference video qualityevaluation using additionally coded videos. IEEE J. Select. Topics SignalProcess. 3(2), 294–303 (2009)
84. E Cohen, Y Yitzhaky, No-reference assessment of blur and noise impactson image quality. Signal, Image Video Process. 4(3), 289–302 (2010)
85. S Gabarda, G Cristóbal, Blind image quality assessment throughanisotropy. J. Opt. Soc. Am. A 24(12), 42–51 (2007)
86. X Zhu, P Milanfar, A no-reference sharpness metric sensitive to blur andnoise, in International Workshop on Quality of Multimedia Experience(San Diego, 29–31 July 2009), pp. 64–69
87. X Zhu, P Milanfar, A no-reference image content metric and itsapplication to denoising, in IEEE International Conference on ImageProcessing (Hong Kong, 26–29 September 2010), pp. 1145–1148
88. M Narwaria, W Lin, Objective image quality assessment based onsupport vector regression. IEEE Trans. Neural Netw. 21(3), 515–519(2010)
89. H Liu, J Redi, H Alers, R Zunino, I Heynderickx, ed. by BE Rogowitz, TNPappas, No-reference image quality assessment based on localizedgradient statistics: application to JPEG and JPEG2000, in SPIEProceedings-Human Vision and Electronic Imaging, vol. 7527, (2010),p. 75271
90. R Ferzli, L Karam, A novel free reference image quality metric usingneural network approach, in International Workshop on Video Processingand Quality Metrics for Consumer Electronics (Scottsdale, 13–15 January2010), pp. 1–4
91. A Chetouani, A Beghdadi, A new image quality estimation approach forJPEG2000 compressed images, in IEEE International Symposium on SignalProcessing and Information Technology (Bilbao, 14–17 December 2011),pp. 581–584
92. HR Sheikh, AC Bovik, L Cormack, No-reference quality assessmentusing natural scene statistics: JPEG2000. IEEE Trans. Image Process.14(11), 1918–1927 (2005)
93. P Romaniak, L Janowski, MI Leszczuk, Z Papir, Perceptual qualityassessment for H.264/AVC compression, in IEEE International Workshopon Future Multimedia Networking (Las Vegas, 14–17 January 2012)
94. Z Wang, AC Bovik, HR Sheikh, EP Simoncelli, Image quality assessment:from error visibility to structural similarity. IEEE Trans. Image Process.13(4), 600–612 (2004)
95. X Liu, M Chen, T Wan, C Yu, Hybrid no-reference video qualityassessment focusing on codec effects. Korea Internet Inform. Soc. Trans.Internet Inform. Syst. 5(3), 592–606 (2011)
96. S Ouni, E Zagrouba, M Chambah, M Herbin, No-reference imagesemantic quality approach using neural network, in IEEE InternationalSymposium on Signal Processing and Information Technology(Bilbao, 14–17 December 2011), pp. 106–113
97. J Zhang, TM Le, SH Ong, TQ Nguyen, No-reference image qualityassessment using structural activity. Signal Process. 91(11), 2575–2588(2011)
98. DL Ruderman, The statistics of natural images. Network: Comput. NeuralSyst. 5(4), 517–548 (1994)
99. J Zhou, B Xiao, Q Li, A no reference image quality assessment methodfor JPEG2000, in IEEE International Joint Conference on Neural Networks(Hong Kong, 1–8 June 2008), pp. 863–868
100. W Lu, K Zeng, D Tao, Y Yuan, X Gao, No-reference image qualityassessment in contourlet domain. Neurocomputing 73, 784–794 (2010)
101. MN Do, M Vetterli, The contourlet transform: an efficient directionalmultiresolution image representation. IEEE Trans. Image Process.14(12), 2091–2106 (2005)
102. J Shen, Q Li, G Erlebacher, Hybrid no-reference natural image qualityassessment of noisy, blurry, JPEG2000, and JPEG images. IEEE Trans.Image Process. 20(8), 2089–2098 (2011)
103. AK Moorthy, AC Bovik, Blind image quality assessment: from naturalscene statistics to perceptual quality. IEEE Trans. Image Process.20(12), 3350–3364 (2011)
104. K Zhu, K Hirakawa, V Asari, D Saupe, A no-reference video qualityassessment based on Laplacian pyramids, in 20th IEEE InternationalConference on Image Processing (ICIP) (Melbourne, 15–18 September2013), pp. 49–53
105. MA Saad, AC Bovik, Natural motion statistics for no-reference videoquality assessment, in International Workshop on Quality of MultimediaExperience (San Diego, 29–31 July 2009), pp. 163–167
106. MA Saad, AC Bovik, C Charrier, A DCT statistics-based blind image qualityindex. IEEE Signal Process. Lett. 17(6), 583–586 (2010)
107. MA Saad, AC Bovik, C Charrier, DCT statistics model-based blind imagequality assessment, in IEEE International Conference on Image Processing(Brussels, 11–14 September 2011), pp. 3093–3096
108. A Mittal, A Moorthy, A Bovik, No-reference image quality assessment inthe spatial domain. IEEE Trans. Image Process. 21(12), 4695–4708(2012)
109. A Mittal, GS Muralidhar, J Ghosh, AC Bovik, Blind image qualityassessment without human training using latent quality factors.IEEE Signal Process. Lett. 19(2), 75–78 (2012)
111. P Gastaldo, G Parodi, J Redi, R Zunino, No-reference quality assessmentof JPEG images by using CBP neural networks, in 17th InternationalConference Artificial Neural Networks (Porto, 9–13 September 2007).Lecture Notes in Computer Science, vol. 4669, (Springer, Heidelberg),pp. 564–572
112. C Li, AC Bovik, X Wu, Blind image quality assessment using a generalregression neural network. IEEE Trans. Neural Netw. 22(5), 793–799(2011)
113. J Zhang, TM Le, A new no-reference quality metric for JPEG2000 images.IEEE Trans. Consumer Electron. 56(2), 743–750 (2010)
114. ZMP Sazzad, Y Kawayoke, Y Horita, No reference image qualityassessment for JPEG2000 based on spatial features. Image Commun.23, 257–268 (2008)
115. ZMP Sazzad, Y Kawayoke, Y Horita, Spatial features based no referenceimage quality assessment for JPEG2000, in IEEE International Conference
Shahid et al. EURASIP Journal on Image and Video Processing 2014, 2014:40 Page 30 of 32http://jivp.eurasipjournals.com/content/2014/1/40
on Image Processing, vol. 3 (San Antonio, 16–19 September 2007),pp. 517–520
116. A Maalouf, M-C Larabi, A no-reference color video quality metric basedon a 3D multispectral wavelet transform, in International Workshop onQuality of Multimedia Experience (Trondheim, 21–23 June 2010),pp. 11–16
117. S Suresh, R Venkatesh Babu, HJ Kim, No-reference image qualityassessment using modified extreme learning machine classifier.Appl. Soft Comput. 9, 541–552 (2009)
118. AM Treisman, G Gelade, A feature-integration theory of attention.Cognit. Psychol. 12(1), 97–136 (1980)
119. S Yao, E Ong, MH Loke, Perceptual distortion metric based on waveletfrequency sensitivity and multiple visual fixations, in IEEE InternationalSymposium on Circuits and Systems (Seattle, 18–21 May 2008),pp. 408–411
120. X-H Wang, Z Ming, A new metric for objectively assessing the quality ofenhanced images based on human visual perception. J. Optoelectron.Laser 19(2), 254–262 (2008)
121. M Ries, C Crespi, O Nemethova, M Rupp, Content based video qualityestimation for H.264/AVC video streaming, in IEEE Conference on WirelessCommunications and Networking (Kowloon, 11–15 March 2007),pp. 2668–2673
122. M Ries, O Nemethova, M Rupp, Performance evaluation of mobilevideo quality estimators, in European Signal Processing Conference(Poznan, 3–7 September 2007)
123. A Khan, L Sun, E Ifeachor, Content-based video quality prediction forMPEG4 video streaming over wireless networks. J. Multimedia4(4), 228–239 (2009)
124. A Khan, L Sun, E Ifeachor, An ANFIS-based hybrid video qualityprediction model for video streaming over wireless networks, inInternational Conference on Next Generation Mobile Applications, Servicesand Technologies (Cardiff, 16–19 September 2008), pp. 357–362
125. A Khan, L Sun, E Ifeachor, Content clustering based video qualityprediction model for MPEG4 video streaming over wireless networks, inIEEE International Conference on Communications (Dresden, 14–18 June2009), pp. 1–5
126. U Engelke, H-J Zepernick, An artificial neural network for qualityassessment in wireless imaging based on extraction of structuralinformation, in IEEE International Conference on Acoustics, Speech andSignal Processing, vol. 1 (Honolulu, 15–20 April 2007), pp. 1249–1252
127. X Jiang, F Meng, J Xu, W Zhou, No-reference perceptual video qualitymeasurement for high definition videos based on an artificial neuralnetwork, in International Conference on Computer and ElectricalEngineering (Phuket, 20–22 December 2008), pp. 424–427
128. D Culibrk, D Kukolj, P Vasiljevic, M Pokric, V Zlokolica, Feature selectionfor neural-network based no-reference video quality assessment.Lecture Notes Comput. Sci. 5769, 633–642 (2009)
129. C Keimel, T Oelbaum, K Diepold, No-reference video quality evaluationfor high-definition video, in IEEE International Conference on Acoustics,Speech and Signal Processing (Taipei, 19–24 April 2009), pp. 1145–1148
130. ZMP Sazzad, S Yamanaka, Y Kawayokeita, Y Horita, Stereoscopic imagequality prediction, in International Workshop on Quality of MultimediaExperience, (2009), pp. 180–185
131. D Bhattacharjee, S Prakash, P Gupta, No-reference image qualityassessment for facial images, in International Conference on AdvancedIntelligent Computing Theories and Applications. With Aspects of ArtificialIntelligence, Zhengzhou, vol. 6839 (Springer Heidelberg, Germany,11–14 August 2011), pp. 594–601
132. OYG Castillo, Survey about facial image quality. Technical Report.Fraunhofer Institute for Computer Graphics Research (2007), Darmstadt,Germany, (2006)
133. JE Caviedes, F Oberti, No-reference quality metric for degraded andenhanced video, in Proceedings of SPIE 5150, Visual Communications andImage Processing, vol. 5150 (Lugano, 8 July 2003), pp. 621–632
134. G Valenzise, S Magni, M Tagliasacchi, S Tubaro, Estimatingchannel-induced distortion in H.264/AVC video without bitstreaminformation, in Second International Workshop on Quality of MultimediaExperience (QoMEX) (Trondheim, 21–23 June 2010), pp. 100–105
135. G Valenzise, S Magni, M Tagliasacchi, S Tubaro, No-reference pixel videoquality monitoring of channel-induced distortion. IEEE Trans. CircuitsSyst. Video Technol. 22(4), 605–618 (2012)
136. J Park, K Seshadrinathan, S Lee, AC Bovik, Video quality poolingadaptive to perceptual distortion severity. IEEE Trans. Image Process.22(2), 610–620 (2013)
137. AR Reibman, VA Vaishampayan, Y Sermadevi, Quality monitoring ofvideo over a packet network. IEEE Trans. Multimedia 6(2), 327–334 (2004)
138. A Takahashi, D Hands, V Barriac, Standardization activities in the ITU for aQoE assessment of IPTV. IEEE Commun. Mag. 46(2), 78–84 (2008)
139. F Yang, S Wan, Bitstream-based quality assessment for networked video:a review. IEEE Commun. Mag. 50(11), 203–209 (2012)
140. ITU-T, ITU-T Recommendation G.1070: opinion model forvideo-telephony applications (2012). http://www.itu.int/rec/T-REC-G.1070. Accessed 11 April 2014
141. A Raake, MN Garcia, S Moller, J Berger, F Kling, P List, J Johann, CHeidemann, T-V-model: parameter-based prediction of IPTV quality, inIEEE International Conference on Acoustics, Speech and Signal Processing(Las Vegas, 31 March to 4 April 2008), pp. 1149–1152
142. J Han, Y-H Kim, J Jeong, J Shin, Video quality estimation for packet lossbased on no-reference method, in IEEE International Conference onAdvanced Communication Technology, vol. 1 (Phoenix Park, Dublin,7–10 February 2010), pp. 418–421
143. ITU, ITU-T Recommendation P.1201: Parametric non-intrusiveassessment of audiovisual media streaming quality (2012). http://handle.itu.int/11.1002/1000/11727. Accessed 11 April 2014
144. T Yamada, S Yachida, Y Senda, M Serizawa, Accurate video-qualityestimation without video decoding, in IEEE International Conference onAcoustics Speech and Signal Processing (Dallas, 14–19 March 2010),pp. 2426–2429
145. S Argyropoulos, A Raake, M-N Garcia, P List, No-reference bit streammodel for video quality assessment of H.264/AVC video based on packetloss visibility, in IEEE International Conference on Acoustics, Speech andSignal Processing (Prague, 22–27 May 2011), pp. 1169–1172
146. M-N Garcia, A Raake, Parametric packet-layer video quality model forIPTV, in 10th International Conference on Information Sciences SignalProcessing and Their Applications (ISSPA) (Kuala Lumpur, 10–13 May2010), pp. 349–352
147. F Yang, J Song, S Wan, HR Wu, Content-adaptive packet-layer model forquality assessment of networked video services. IEEE J. Select. TopicsSignal Process. 6(6), 672–683 (2012)
148. I Sedano, K Brunnström, M Kihl, A Aurelius, Full-reference video qualitymetric assisted the development of no-reference bitstream videoquality metrics for real-time network monitoring. EURASIP J. ImageVideo Process (2014). doi:10.1186/1687-5281-2014-4
149. N Staelens, N Vercammen, Y Dhondt, B Vermeulen, P Lambert, R Van deWalle, P Demeester, VIQID: a no-reference bit stream-based visualquality impairment detector, in International Workshop on Quality ofMultimedia Experience (Trondheim, 21–23 June 2010), pp. 206–211
150. N Staelens, G Van Wallendael, K Crombecq, N Vercammen, J De Cock, BVermeulen, R Van de Walle, T Dhaene, P Demeester, No-referencebitstream-based visual quality impairment detection for high definitionH.264/AVC encoded video sequences. IEEE Trans. Broadcasting58(2), 187–199 (2012)
151. G Van Wallendael, N Staelens, L Janowski, J De Cock, P Demeester, R Vande Walle, No-reference bitstream-based impairment detection for highefficiency video coding, in Fourth International Workshop on Quality ofMultimedia Experience (Yarra Valley, 5–7 July 2012), pp. 7–12
152. ITU, ITU-T Recommendation P.1202: parametric non-intrusive bitstreamassessment of video media streaming quality (2012). http://handle.itu.int/11.1002/1000/11730. Accessed 11 April 2014
153. A Rossholm, B Lövström, A new low complex reference free videoquality predictor, in IEEE Workshop on Multimedia Signal Processing(Cairns, 8–10 October 2008), pp. 765–768
154. M Shahid, A Rossholm, B Lövström, A reduced complexity no-referenceartificial neural network based video quality predictor, in InternationalCongress on Image and Signal Processing, vol. 1 (Shanghai, 15–17 October2011), pp. 517–521
155. M Shahid, A Rossholm, B Lövström, A no-reference machine learningbased video quality predictor, in Fifth International Workshop onQuality of Multimedia Experience (QoMEX) (Klagenfurt, 3–5 July 2013),pp. 176–181
156. C Keimel, M Klimpke, J Habigt, K Diepold, No-reference video qualitymetric for HDTV based on H.264/AVC bitstream features, in IEEE
158. M Ries, O Nemethova, M Rupp, Motion based reference-free qualityestimation for H.264/AVC video streaming, in International Symposiumon Wireless Pervasive Computing (San Juan, 5–7 February 2007)
159. M Slanina, V Ricny, R Forchheimer, A novel metric for H.264/AVCno-reference quality assessment, in EURASIP Conference on Speech andImage Processing Multimedia Communications and Services (Maribor,27–30 June 2007), pp. 114–117
160. I Park, T Na, M Kim, A noble method on no-reference video qualityassessment using block modes and quantization parameters ofH.264/AVC, in Proceedings of SPIE-Image Quality and SystemPerformance VIII, vol. 7867 (San Francisco Airport, 23 January 2011),pp. 78670–7867011
161. KD Singh, G Rubino, No-reference quality of experience monitoringin DVB-H networks, in Wireless Telecommunications Symposium(Tampa, 21–23 April 2010), pp. 1–6
162. F Yang, S Wan, Q Xie, HR Wu, No-reference quality assessment fornetworked video via primary analysis of bit stream. IEEE Trans. CircuitsSyst. Video Technol. 20(11), 1544–1554 (2010)
163. M Chin, T Brandão, MP Queluz, Bitstream-based quality metric forpacketized transmission of H.264 encoded video, in InternationalConference on Systems, Signals and Image Processing (Vienna, 11–13 April2012), pp. 312–315
164. T Brandão, M Chin, MP Queluz, From PSNR to perceived quality in H.264encoded video sequences, in Proceedings of EuroITV (Lisbon, 29 June to1 July 2011)
165. A Eden, No-reference estimation of the coding PSNR for H.264-codedsequences. IEEE Trans. Consumer Electron. 53(2), 667–674 (2007)
166. T Brandão, PQ Maria, No-reference image quality assessment based onDCT domain statistics. Signal Process. 88(4), 822–833 (2008)
167. AB Watson, DCT quantization matrices visually optimized for individualimages, in Proceedings of SPIE, Human Vision, Visual Processing, and DigitalDisplay IV, vol. 1913 (San Jose, 31 January 1993), pp. 202–216
168. T Brandão, PQ Maria, No-reference quality assessment of H.264/AVCencoded video. IEEE Trans. Circuits Syst. Video Technol. 20(11),1437–1447 (2010)
169. T Brandão, PQ Maria, No-reference PSNR estimation algorithm for H.264encoded video sequences, in European Signal Processing Conference(Laussane, 25–29 August 2008)
170. T Brandão, PQ Maria, Blind PSNR estimation of video sequences usingquantized DCT coefficient data, in Picture Coding Symposium(Lausanne, 12–13 November 2007)
171. S-Y Shim, J-H Moon, J-K Han, PSNR estimation scheme using coefficientdistribution of frequency domain in H.264 decoder. Electron. Lett.44(2), 108–109 (2008)
172. J Zhang, SH Ong, TM Le, Kurtosis-based no-reference qualityassessment of JPEG2000 images. Image Commun. 26, 13–23 (2011)
173. K Nishikawa, K Munadi, H Kiya, No-reference PSNR estimation for qualitymonitoring of motion JPEG2000 video over lossy packet networks.IEEE Trans. Multimedia 10(4), 637–645 (2008)
174. K Nishikawa, S Nagawara, H Kiya, QoS estimation method for JPEG2000coded image at RTP layer. IEICE Trans. E89-A(8), 2119–2128 (2006).doi:10.1093/ietfec/e89-a.8.2119
175. J Joskowicz, R Sotelo, JCL Ardao, Towards a general parametric modelfor perceptual video quality estimation. IEEE Trans. Broadcasting59(4), 569–579 (2013)
176. ITU, ITU-T Recommendation H.265/high efficiency video coding.http://www.itu.int/rec/T-REC-H.265-201304-I. Accessed 11 April 2014
177. B Lee, M Kim, No-reference PSNR estimation for HEVC encoded video.IEEE Trans. Broadcasting 59(1), 20–27 (2013)
178. S Winkler, P Mohandas, The evolution of video quality measurement:from PSNR to hybrid metrics. IEEE Trans. Broadcasting 54(3), 660–668(2008)
179. M Naccari, M Tagliasacchi, S Tubaro, No-reference video qualitymonitoring for H.264/AVC coded video. IEEE Trans. Multimedia11(5), 932–946 (2009)
180. M Naccari, M Tagliasacchi, F Pereira, S Tubaro, No-reference modeling ofthe channel induced distortion at the decoder for H.264/AVC videocoding, in IEEE International Conference on Image Processing(San Diego, 12–15 October 2008), pp. 2324–2327
181. MCQ Farias, MM Carvalho, HTM Kussaba, BHA Noronha, A hybrid metricfor digital video quality assessment, in IEEE International Symposium onBroadband Multimedia Systems and Broadcasting (Nuremberg,8–10 June 2011), pp. 1–6
182. T Shanableh, No-reference PSNR identification of MPEG-4 video usingspectral regression and reduced model polynomial networks.IEEE Signal Process. Lett. 17(8), 735–738 (2010)
183. T Shanableh, Prediction of structural similarity index of compressedvideo at a macroblock level. IEEE Signal Process. Lett. 18(5), 335–338(2011)
184. AG Davis, D Bayart, DS Hands, Hybrid no-reference video qualityprediction, in IEEE International Symposium on Broadband MultimediaSystems and Broadcasting (Bilbao, 13–15 May 2009), pp. 1–6
185. K Yamagishi, T Kawano, T Hayashi, Hybrid video-quality-estimationmodel for IPTV services, in IEEE Global Telecommunications Conference,(GLOBECOM) (Honolulu, 30 November to 4 December 2009), pp. 1–5
186. T Yamada, Y Miyamoto, M Serizawa, No-reference video qualityestimation based on error-concealment effectiveness, in InternationalWorkshop on Packet Video (Lausanne, 12–13 November 2007),pp. 288–293
187. T Yamada, Y Miyamoto, T Nishitani, No-reference quality estimation forvideo-streaming services based on error-concealment effectiveness.IEICE Trans. Fundamentals Electron. Commun. Comput. Sci.E95-A(11), 2007–2014 (2012)
188. H Boujut, J Benois-Pineau, T Ahmed, O Hadar, P Bonnet, A metric forno-reference video quality assessment for HD TV delivery based onsaliency maps, in IEEE International Conference on Multimedia and Expo(ICME) (Barcelona, 11–15 July 2011), pp. 1–5
189. O Sugimoto, S Naito, S Sakazawa, A Koike, Objective perceptual videoquality measurement method based on hybrid no referenceframework, in IEEE International Conference on Image Processing(Cairo, 7–10 November 2009), pp. 2237–2240
190. S Zhao, H Jiang, Q Cai, S Sherif, A Tarraf, Hybrid framework forno-reference video quality indication over LTE networks, in 23rd Wirelessand Optical Communication Conference (WOCC) (Newark, 9–10 May2014), pp. 1–5
191. A Ichigaya, Y Nishida, E Nakasu, Nonreference method for estimatingPSNR of MPEG-2 coded video by using DCT coefficients and pictureenergy. IEEE Trans. Circuits Syst. Video Technol. 18(6), 817–826 (2008)
192. A Ichigaya, M Kurozumi, N Hara, Y Nishida, E Nakasu, A method ofestimating coding PSNR using quantized DCT coefficients. IEEE Trans.Circuits Syst. Video Technol. 16(2), 251–259 (2006)
193. VQEG, Draft VQEG Testplan: Hybrid Perceptual/Bitstream Group (2012).http://www.its.bldrdoc.gov/vqeg/projects/hybrid-perceptual-bitstream/hybrid-perceptual-bitstream.aspx. Accessed 11 April 2014
194. C Keimel, J Habigt, K Diepold, Hybrid no-reference video quality metricbased on multiway PLSR, in Proceedings of the 20th European SignalProcessing Conference (EUSIPCO) (Bucharest, 27–31 August 2012),pp. 1244–1248
195. Z Wang, AC Bovik, Mean squared error: love it or leave it? A new look atsignal fidelity measures. IEEE Signal Process. Mag. 26(1), 98–117 (2009)
196. J You, T Ebrahimi, A Perkis, Attention driven foveated video qualityassessment. IEEE Trans. Image Process. 23(1), 200–213 (2014)
197. B Belmudez, S Möller, Audiovisual quality integration for interactivecommunications. EURASIP J. Audio Speech Music Process.2013(1) (2013). 10.1186/1687-4722-2013-24
198. AN Rimell, MP Hollier, RM Voelcker, The influence of cross-modalinteraction on audio-visual speech quality perception, in AudioEngineering Society Convention 105 (San Francisco, 26–29 September1998)
199. U Engelke, H Kaprykowsky, H-J Zepernick, P Ndjiki-Nya, Visual attentionin quality assessment. IEEE Signal Process. Mag. 28(6), 50–59 (2011)
200. P Kortum, M Sullivan, The effect of content desirability on subjectivevideo quality ratings. Hum. Factors: J. Hum. Factors Ergonom. Soc.52, 105–118 (2010)
201. A Rossholm, M Shahid, B Lövström, Analysis of the impact oftemporal, spatial, and quantization variations on perceptual video
Shahid et al. EURASIP Journal on Image and Video Processing 2014, 2014:40 Page 32 of 32http://jivp.eurasipjournals.com/content/2014/1/40
quality, in IEEE Network Operations and Management Symposium (NOMS)(Krakow, 5–9 May 2014), pp. 1–5
202. M Barkowsky, I Sedano, K Brunnström, M Leszczuk, N Staelens, Hybridvideo quality prediction: re-viewing video quality measurement forwidening application scope. Multimedia Tools Appl (2014).doi:10.1007/s11042-014-1978-2
203. J You, U Reiter, MM Hannuksela, M Gabbouj, A Perkis, Perceptual-basedquality assessment for audio-visual services: a survey. Signal Process.Image Commun. 25(7), 482–501 (2010)
doi:10.1186/1687-5281-2014-40Cite this article as: Shahid et al.: No-reference image and video qualityassessment: a classification and review of recent approaches. EURASIPJournal on Image and Video Processing 2014 2014:40.
Submit your manuscript to a journal and benefi t from: