12
1 © Nokia 2016 Nokia financial results Q4 2015 Conference call February 11, 2016 15:00 / Helsinki 08:00 / New York

1 © Nokia 2016
Nokia financial resultsQ4 2015
Conference call
February 11, 2016
15:00 / Helsinki
08:00 / New York

2 © Nokia 2016
Disclaimer
It should be noted that Nokia and its business are exposed to various risks and uncertainties, and certain statements herein that are not historical facts are forward-looking statements, including, without limitation, those regarding future business and the financial performance of Nokia and its industry and statements preceded by “believe,” “expect,” “anticipate,” “foresee,” “sees,” “target,” “estimate,” “designed,” “aim,” “plans,” “intends,” “focus,” “continue,” “will” or similar expressions. These statements are based on management's best assumptions and beliefs in light of the information currently available to it. Because they involve risks and uncertainties, actual results may differ materially from the results that we currently expect. Factors, including risks and uncertainties that could cause such differences can be both external, such as general, economic and industry conditions, as well as internal operating factors. We have identified these in more detail on pages 74 to 89 of Nokia’s annual report on Form 20-F for the year ended December 31, 2014 under “Operating and Financial Review and Prospects—Risk Factors“, our other filings with the U.S. Securities
and Exchange Commission and in our interim reports issued on April 30, 2015, July 30, 2015, October 29, 2015 and our report for Q4 and full year 2015 issued on February 11, 2016. Other unknown or unpredictable factors or underlying assumptions subsequently proven to be incorrect could cause actual results to differ materially from those in the forward-looking statements. Nokia does not undertake any obligation to publicly update or revise forward-looking statements, whether as a result of new information, future events or otherwise, except to the extent legally required.
In addition to information on our reported IFRS results, we provide certain information on a non-IFRS, or underlying business performance, basis. Non-IFRS results exclude all material special items for all periods. In addition, non-IFRS results exclude intangible asset amortization and other purchase price accounting related items arising from business acquisitions. We believe that our non-IFRS financial measures provide meaningful supplemental information to both management and investors regarding Nokia’s
underlying business performance by excluding the aforementioned items that may not be indicative of Nokia’s business operating results. These non-IFRS financial measures should not be viewed in isolation or as substitutes to the equivalent IFRS measure(s), but should be used in conjunction with the most directly comparable IFRS measure(s) in the reported results. A detailed explanation of the content of the non-IFRS information and a reconciliation between the non-IFRS and the reported information for historical periods can be found in Nokia’s respective results reports. Please see our issued interim reports for more information on our results and financial performance for the indicated periods as well as our operating and reporting structure.
Nokia is a registered trademark of Nokia Corporation. Other product and company names mentioned herein may be trademarks or trade names of their respective owners.
© Nokia 2016

3 © Nokia 2016
Contents
Introduction Slides 1-4
Quarterly business results
Nokia Group Slide 5
Nokia Networks Slides 6-8
Nokia Technologies Slide 9
Nokia Group cash and cash flow Slide 10
Capital Structure Optimization Program Slide 11

4 © Nokia 2016
Presented by
Rajeev Suri
President and CEO
Timo Ihamuotila
CFO

5 © Nokia 2016
Nokia’s continuing operations
0,00
0,05
0,10
0,15
0,20
0
2 000
4 000
Q4 2014 Q1 2015 Q2 2015 Q3 2015 Q4 2015
Q4 2015 Highlights
• Net sales of EUR 3.6 billion in Q4 2015 (EUR 3.5 billion in Q4 2014)
• Q4 2015 non-IFRS diluted EPS of EUR 0.15 (EUR 0.09 in Q4 2014), an increase of 67% year-on-year. Q4 2015 diluted EPS of EUR 0.13 (EUR 0.08 in Q4 2014).
• Nokia’s Board of Directors will propose a dividend of EUR 0.16 per share for 2015 and a special dividend of EUR 0.10 per share (dividend of EUR 0.14 per share for 2014).
Nokia Networks Nokia Technologies
EPS diluted (non-IFRS)
EUR
Net sales(EUR million)
EUR million Q4'15 Q4'14 YoY change Q3'15 QoQ change
Continuing operations
Net sales – constant currency (3)% 18%
Net sales 3 609 3 510 3% 3 036 19%
Nokia Networks 3 210 3 365 (5)% 2 877 12%
Nokia Technologies 403 149 170% 162 149%
Gross margin % (non-IFRS) 46.4% 40.8% 560bps 42.7% 370bps
Operating profit (non-IFRS) 734 503 46% 475 55%
Nokia Networks 468 470 0% 391 20%
Nokia Technologies 322 77 318% 94 243%
Group Common Functions (56) (44) (10)
Operating margin % (non-IFRS) 20.3% 14.3% 600bps 15.6% 470bps
Profit (non-IFRS) 575 331 74% 297 94%
Profit 499 325 54% 188 165%
EPS, EUR diluted (non-IFRS) 0.15 0.09 67% 0.08 87%
EPS, EUR diluted 0.13 0.08 63% 0.05 160%
Discontinued operations
Net sales 242 298 (19)% 283 (14)%
Profit 1 292 145 791% (37) (3 592)%
EPS, EUR diluted 0.33 0.03 1 000% (0.01) (3 400)%
6 © Nokia 2016
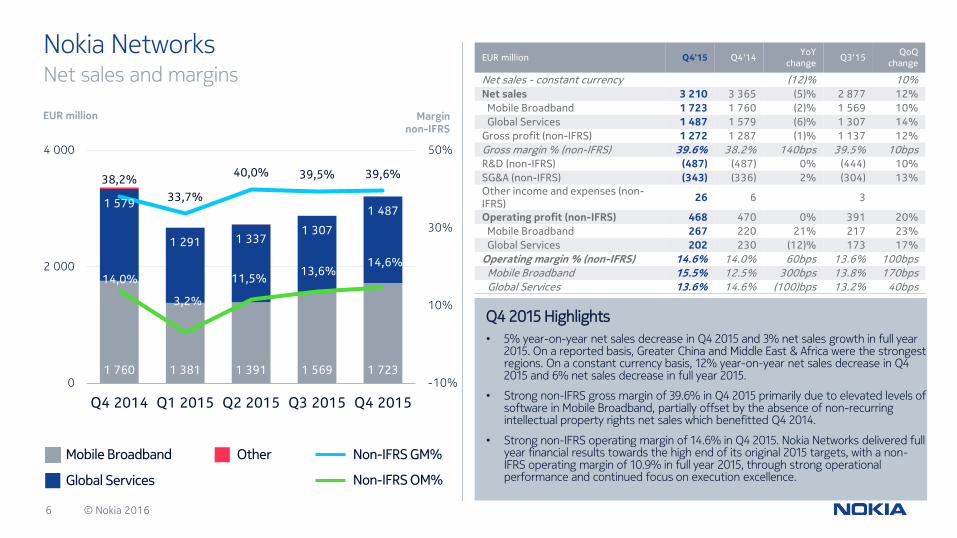
Nokia NetworksNet sales and margins
Mobile Broadband Other
Global Services
Non-IFRS GM%
Non-IFRS OM%
1 760 1 381 1 391 1 569 1 723
1 579
1 291 1 3371 307
1 487
38,2%
33,7%
40,0% 39,5% 39,6%
14,0%
3,2%
11,5%13,6%
14,6%
-10%
10%
30%
50%
0
2 000
4 000
Q4 2014 Q1 2015 Q2 2015 Q3 2015 Q4 2015
Q4 2015 Highlights
• 5% year-on-year net sales decrease in Q4 2015 and 3% net sales growth in full year 2015. On a reported basis, Greater China and Middle East & Africa were the strongest regions. On a constant currency basis, 12% year-on-year net sales decrease in Q4 2015 and 6% net sales decrease in full year 2015.
• Strong non-IFRS gross margin of 39.6% in Q4 2015 primarily due to elevated levels of software in Mobile Broadband, partially offset by the absence of non-recurring intellectual property rights net sales which benefitted Q4 2014.
• Strong non-IFRS operating margin of 14.6% in Q4 2015. Nokia Networks delivered full year financial results towards the high end of its original 2015 targets, with a non-IFRS operating margin of 10.9% in full year 2015, through strong operational performance and continued focus on execution excellence.
EUR million Q4'15 Q4'14YoY
changeQ3'15
QoQchange
Net sales - constant currency (12)% 10%
Net sales 3 210 3 365 (5)% 2 877 12%
Mobile Broadband 1 723 1 760 (2)% 1 569 10%
Global Services 1 487 1 579 (6)% 1 307 14%
Gross profit (non-IFRS) 1 272 1 287 (1)% 1 137 12%
Gross margin % (non-IFRS) 39.6% 38.2% 140bps 39.5% 10bps
R&D (non-IFRS) (487) (487) 0% (444) 10%
SG&A (non-IFRS) (343) (336) 2% (304) 13%
Other income and expenses (non-IFRS)
26 6 3
Operating profit (non-IFRS) 468 470 0% 391 20%
Mobile Broadband 267 220 21% 217 23%
Global Services 202 230 (12)% 173 17%
Operating margin % (non-IFRS) 14.6% 14.0% 60bps 13.6% 100bps
Mobile Broadband 15.5% 12.5% 300bps 13.8% 170bps
Global Services 13.6% 14.6% (100)bps 13.2% 40bps
EUR million Marginnon-IFRS

7 © Nokia 2016
Nokia Networks – Segments
1 760
1 381 1 3911 569
1 723
12,5%
(0,2%)
8,8%13,8%
15,5%
0%
10%
20%
0
1 000
2 000
Q4 2014 Q1 2015 Q2 2015 Q3 2015 Q4 2015
1 579
1 291 1 337 1 3071 487
14,6%
7,3%
13,8%13,2%
13,6%
0%
10%
20%
0
1 000
2 000
Q4 2014 Q1 2015 Q2 2015 Q3 2015 Q4 2015
Mobile Broadband Global Services
Operating marginnon-IFRS
Operating marginnon-IFRS
Net sales(EUR million)
Net sales(EUR million)
Net sales and margins
8 © Nokia 2016
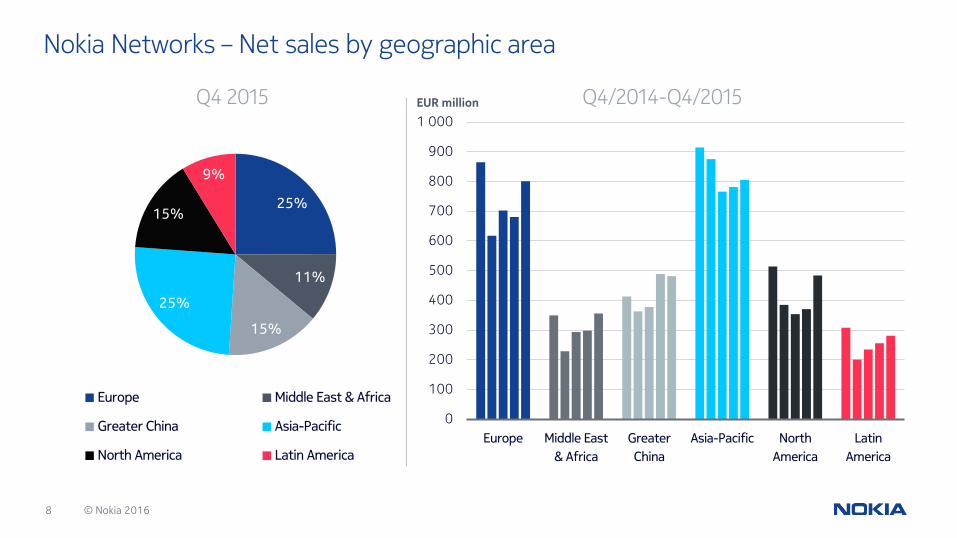
Nokia Networks – Net sales by geographic area
25%
11%
15%
25%
15%
9%
Europe Middle East & Africa
Greater China Asia-Pacific
North America Latin America
Q4 2015 Q4/2014-Q4/2015EUR million
0
100
200
300
400
500
600
700
800
900
1 000
Europe Middle East
& Africa
Greater
China
Asia-Pacific North
America
Latin
America
9 © Nokia 2016
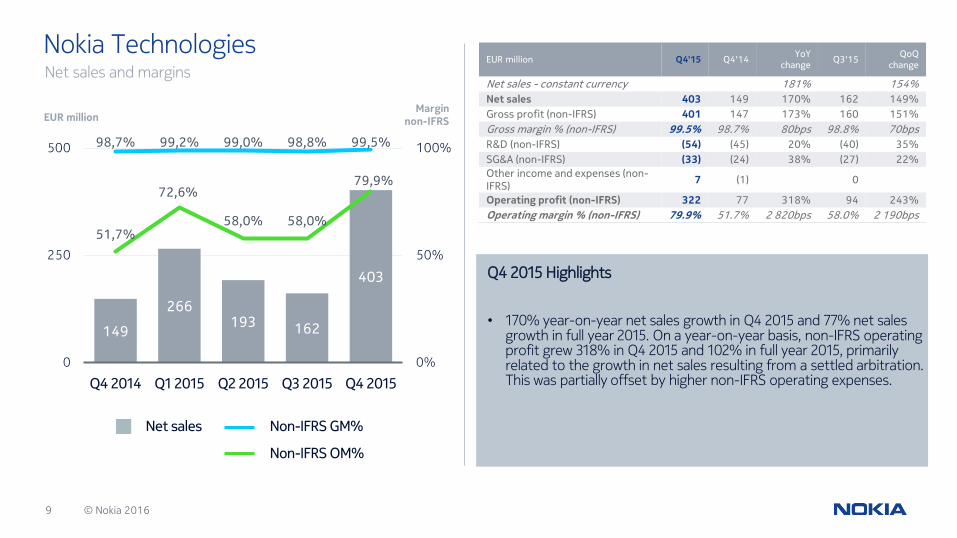
Nokia Technologies
Net sales Non-IFRS GM%
Non-IFRS OM%
149
266193 162
403
98,7% 99,2% 99,0% 98,8% 99,5%
51,7%
72,6%
58,0% 58,0%
79,9%
0%
50%
100%
0
250
500
Q4 2014 Q1 2015 Q2 2015 Q3 2015 Q4 2015
Q4 2015 Highlights
• 170% year-on-year net sales growth in Q4 2015 and 77% net sales growth in full year 2015. On a year-on-year basis, non-IFRS operating profit grew 318% in Q4 2015 and 102% in full year 2015, primarily related to the growth in net sales resulting from a settled arbitration. This was partially offset by higher non-IFRS operating expenses.
EUR million
EUR million Q4'15 Q4'14YoY
changeQ3'15
QoQchange
Net sales - constant currency 181% 154%
Net sales 403 149 170% 162 149%
Gross profit (non-IFRS) 401 147 173% 160 151%
Gross margin % (non-IFRS) 99.5% 98.7% 80bps 98.8% 70bps
R&D (non-IFRS) (54) (45) 20% (40) 35%
SG&A (non-IFRS) (33) (24) 38% (27) 22%
Other income and expenses (non-IFRS)
7 (1) 0
Operating profit (non-IFRS) 322 77 318% 94 243%
Operating margin % (non-IFRS) 79.9% 51.7% 2 820bps 58.0% 2 190bps
Net sales and margins
Marginnon-IFRS
10 © Nokia 2016
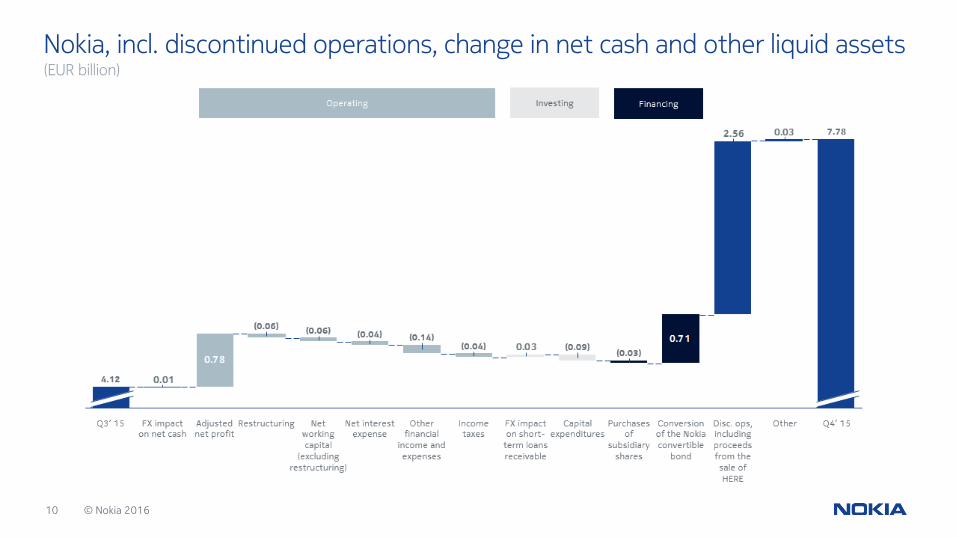
Nokia, incl. discontinued operations, change in net cash and other liquid assets (EUR billion)

11 © Nokia 2016
Nokia Group EUR 7 billion Capital Structure Optimization Programall figures approximately, in EUR billion, assuming share count of 6 billion
3,00
1,87
1,50
0,90
0,96
0,60
0,60
0,90
0,00
1,00
2,00
3,00
4,00
5,00
6,00
7,00
Total Program as
announced on
October 29, 2015
De-leveraging
actions announced*
2015 Dividend and
Special dividend
announced**
De-leveraging Share buyback 2015 Dividend Special dividend 2016 Dividend
~
~
>
EUR billion* Repayment of EUR 190 million Alcatel-Lucent bond on January 15, 2016 and the redemption of Alcatel-Lucent’s USD 1.85 billion senior notes on February 10, 2016. (EUR/USD=1.1)
** Board of Directors will propose to theAGM on June 16, 2016.
Progress as of February 11, 2016

Q&A


