19
NON-INSURANCE IN THE SMALL TO MEDIUM SIZED ENTERPRISE SECTOR JULY 2015
[Type text]
NON-INSURANCE IN THE
SMALL TO MEDIUM SIZED
ENTERPRISE SECTOR
JULY 2015

Contents
Summary findings ............................................................................................... 1
About the survey ................................................................................................. 3
Rate of non-insurance fall across industry .......................................................... 3
Under or inadequate insurance (by Insureds) appears minor. ............................ 4
The most commonly cited reasons for being inadequately insured were ............ 4
Insurance risks applicable and covered for? ....................................................... 5
Why insurable risk was not covered. ................................................................... 5
Around 10% of Businesses do not have sufficient cover for business assets. .... 7
Average Premiums .............................................................................................. 9
Claims ............................................................................................................... 10
Profit expectations and planned insurance coverage. ....................................... 11
Awareness of Government taxes and charges ................................................. 12
Increased insurance cover ................................................................................ 14
Small Businesses mostly purchase insurance through Brokers. ....................... 15
Comparison of sample populations 2007 and 2015 .......................................... 15
1
Summary findings
The rate of non-insurance in the small business sector appears to have fallen over recent years with the ICA’s 2015 survey reporting a non-insurance rate of 12.8%, compared with the 25.6% rate reported in the 2007 survey.
The Manufacturing, Construction, Retail trade, Finance & Insurance and Property & Business Services sectors recorded statistically significant falls in the non-insurance rates.
The Health and Community Services sector had the lowest rate of non-insurance at 6.3% while the Education sector had the highest rate of non-insurance at 25%.
Similar to the 2007 findings, Sole traders had the highest rate of non-insurance, at 24.0% while small businesses operating from home had a rate of non-insurance of 21.4%.
Only 1.9% of the firms that reported having insurance reported being inadequately insured. The most commonly cited reasons for being inadequately insured were;
o “I cannot afford to pay for more insurance”,
o “Premiums are too high” and a belief that
o “You can never be adequately insured”.
Respondents were asked to nominate the insurable risks that were applicable to their business and which of these risks they were covered for. On this basis the non-insurance rates by product type ranged from as low as 1.6% for Public and Product Liability to 14.6% for machinery breakdown. In general, the greater the proportion of respondents that nominated a particular risk as being applicable to their business the lower was the rate of non-insurance for that product type.
The most commonly cited reasons for not insuring against an identified risk were;
o “Too busy to arrange”
o “Too expensive” or
o “Risk too low/not worth it”.
Around 10% of small businesses admit to being underinsured with respect to the value of their business assets.
o 15% were over insured (Asset Value < Sum Insured)
o 63% were adequately Insured (Asset Value = Sum Insured)
o 10.4% were under insured (Asset Value > Sum Insured)
The average number of claims over past year was 1.9 per business.
The average claim size was $6,764 with Wholesale Trade having the largest average claim size of $15,314 and Personal and Other Services the smallest at $2,337
2
Excluding NSW small businesses, 65.7% of businesses were aware the state Government imposed a stamp duty charge on insurance premiums. If stamp duties were removed
o Around 25% indicated they were very to somewhat likely to increase insurance cover
o Around 25% were neutral and
o 50% indicated they were somewhat to very unlikely to increase insurance cover.
In NSW only 53% of small businesses were aware the Government charged ESL and Stamp duty on premiums. If both of these were removed
o Around 34% indicated they were very to somewhat likely to increase insurance cover
o 18% were neutral while
o 48.0% indicated they were somewhat to very unlikely to increase cover
Combining all the responses, if state government taxes and charges were removed from insurance premiums across Australia then,
o 50.0% of small business would be somewhat to very unlikely to increase their insurance cover
o Of the remaining 50%, a similar proportion of businesses would be very to somewhat likely to increase cover or be neutral.
Covering risk not currently insured was the most preferred option of increasing insurance cover with
o 56% of respondents selecting this option.
o A third indicated they would increase the sum insured and
o 11% preferred to decrease the excess level.
Just over 70% of respondents indicated they purchased insurance via a broker while 21% purchased directly from a company.
3
About the survey
The Insurance Council of Australia commissioned Woolcott Research and Engagement to conduct a survey of small businesses (businesses with less than 20 employees) to determine the rate of non-insurance, gauge the degree of underinsurance and investigate other aspects of small businesses insurance behaviour.
The survey was conducted by phone interview in May 2015 with a sample size of 1,000 covering 13 industry groups across all states and territories. The 2015 survey follows of a similar survey undertaken in 2007, with the only significant difference being the inclusion of the communications sector as a separate industry in the 2015 survey.
Rate of non-insurance fall across industry
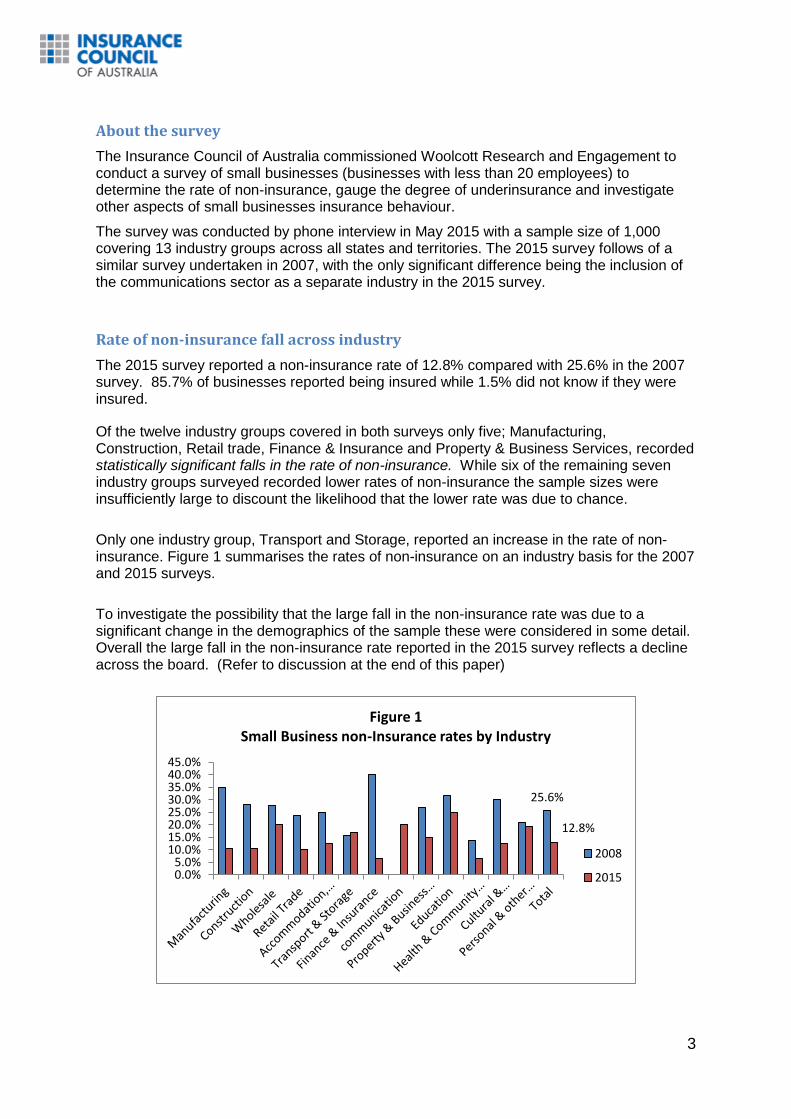
The 2015 survey reported a non-insurance rate of 12.8% compared with 25.6% in the 2007 survey. 85.7% of businesses reported being insured while 1.5% did not know if they were insured.
Of the twelve industry groups covered in both surveys only five; Manufacturing, Construction, Retail trade, Finance & Insurance and Property & Business Services, recorded statistically significant falls in the rate of non-insurance. While six of the remaining seven industry groups surveyed recorded lower rates of non-insurance the sample sizes were insufficiently large to discount the likelihood that the lower rate was due to chance.
Only one industry group, Transport and Storage, reported an increase in the rate of non-insurance. Figure 1 summarises the rates of non-insurance on an industry basis for the 2007 and 2015 surveys.
To investigate the possibility that the large fall in the non-insurance rate was due to a significant change in the demographics of the sample these were considered in some detail. Overall the large fall in the non-insurance rate reported in the 2015 survey reflects a decline across the board. (Refer to discussion at the end of this paper)
25.6%
12.8%
0.0%5.0%
10.0%15.0%20.0%25.0%30.0%35.0%40.0%45.0%
Figure 1Small Business non-Insurance rates by Industry
2008
2015
4
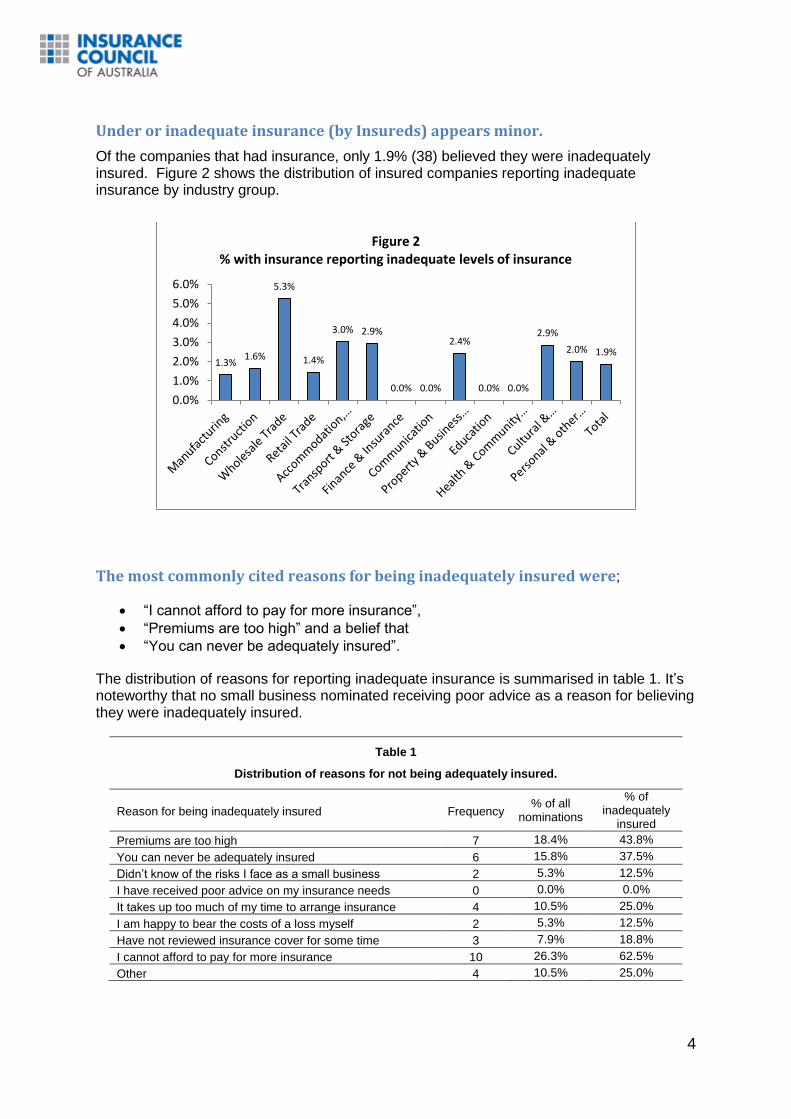
Under or inadequate insurance (by Insureds) appears minor.
Of the companies that had insurance, only 1.9% (38) believed they were inadequately insured. Figure 2 shows the distribution of insured companies reporting inadequate insurance by industry group.
The most commonly cited reasons for being inadequately insured were;
“I cannot afford to pay for more insurance”,
“Premiums are too high” and a belief that
“You can never be adequately insured”.
The distribution of reasons for reporting inadequate insurance is summarised in table 1. It’s noteworthy that no small business nominated receiving poor advice as a reason for believing they were inadequately insured.
Table 1
Distribution of reasons for not being adequately insured.
Reason for being inadequately insured Frequency % of all
nominations
% of inadequately
insured
Premiums are too high 7 18.4% 43.8%
You can never be adequately insured 6 15.8% 37.5%
Didn’t know of the risks I face as a small business 2 5.3% 12.5%
I have received poor advice on my insurance needs 0 0.0% 0.0%
It takes up too much of my time to arrange insurance 4 10.5% 25.0%
I am happy to bear the costs of a loss myself 2 5.3% 12.5%
Have not reviewed insurance cover for some time 3 7.9% 18.8%
I cannot afford to pay for more insurance 10 26.3% 62.5%
Other 4 10.5% 25.0%
1.3%1.6%
5.3%
1.4%
3.0% 2.9%
0.0% 0.0%
2.4%
0.0% 0.0%
2.9%
2.0% 1.9%
0.0%
1.0%
2.0%
3.0%
4.0%
5.0%
6.0%
Figure 2% with insurance reporting inadequate levels of insurance
5
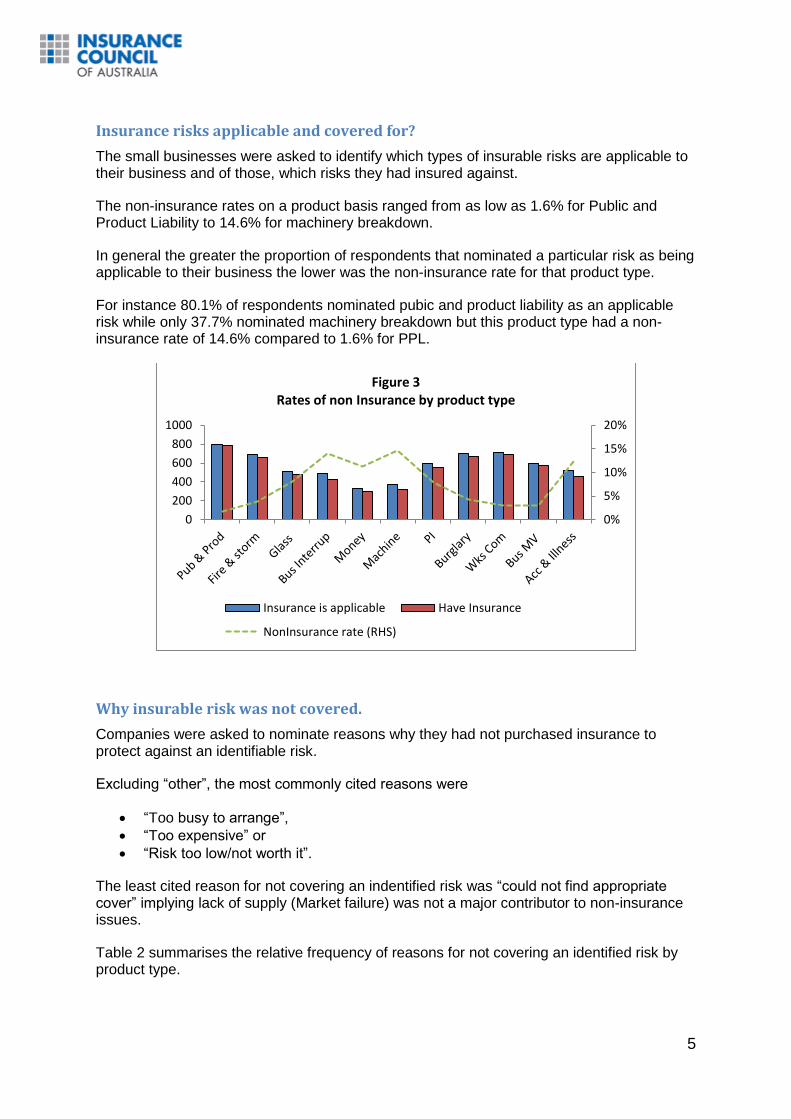
Insurance risks applicable and covered for?
The small businesses were asked to identify which types of insurable risks are applicable to their business and of those, which risks they had insured against.
The non-insurance rates on a product basis ranged from as low as 1.6% for Public and Product Liability to 14.6% for machinery breakdown.
In general the greater the proportion of respondents that nominated a particular risk as being applicable to their business the lower was the non-insurance rate for that product type.
For instance 80.1% of respondents nominated pubic and product liability as an applicable risk while only 37.7% nominated machinery breakdown but this product type had a non-insurance rate of 14.6% compared to 1.6% for PPL.
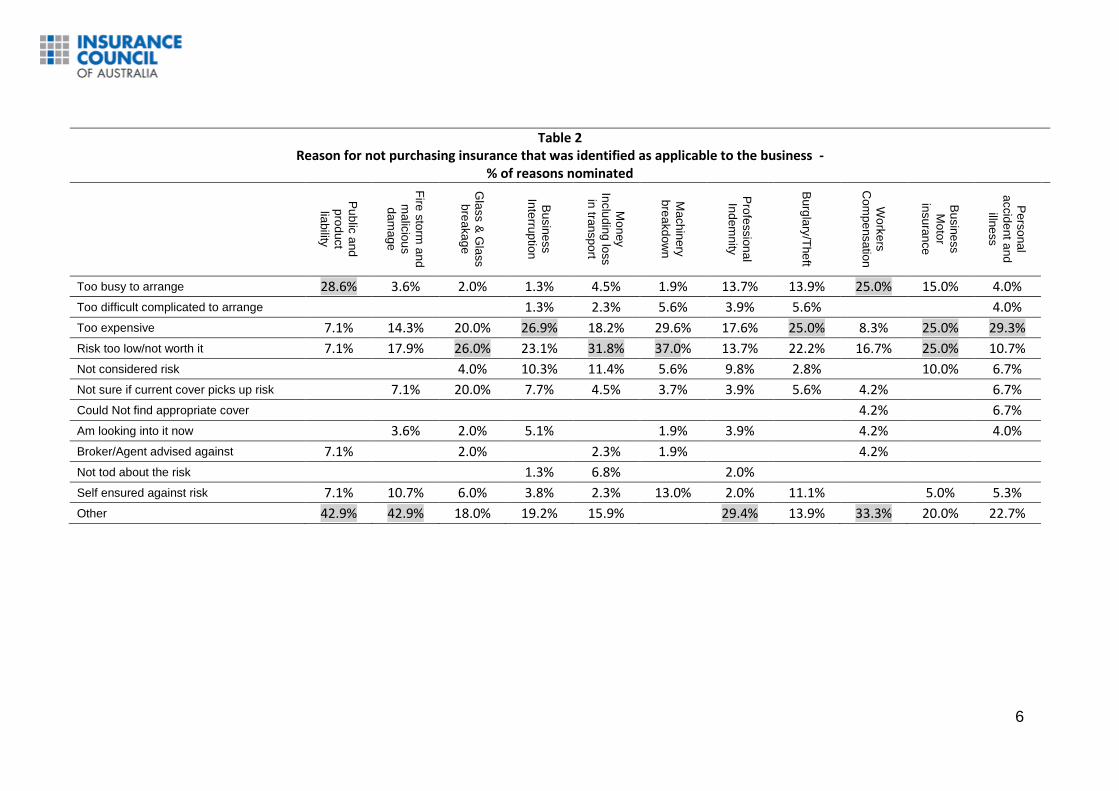
Why insurable risk was not covered.
Companies were asked to nominate reasons why they had not purchased insurance to protect against an identifiable risk.
Excluding “other”, the most commonly cited reasons were
“Too busy to arrange”,
“Too expensive” or
“Risk too low/not worth it”.
The least cited reason for not covering an indentified risk was “could not find appropriate cover” implying lack of supply (Market failure) was not a major contributor to non-insurance issues.
Table 2 summarises the relative frequency of reasons for not covering an identified risk by product type.
0%
5%
10%
15%
20%
0
200
400
600
800
1000
Figure 3Rates of non Insurance by product type
Insurance is applicable Have Insurance
NonInsurance rate (RHS)
6
Table 2 Reason for not purchasing insurance that was identified as applicable to the business -
% of reasons nominated
Pu
blic
and
pro
duct
liability
Fire
sto
rm a
nd
ma
licio
us
da
mag
e
Gla
ss &
Gla
ss
bre
aka
ge
Bu
sin
ess
Inte
rrup
tion
Mo
ney
Inclu
din
g lo
ss
in tra
nspo
rt
Ma
ch
inery
bre
akd
ow
n
Pro
fessio
na
l
Ind
em
nity
Bu
rgla
ry/T
he
ft
Wo
rke
rs
Com
pe
nsa
tion
Bu
sin
ess
Mo
tor
insu
ran
ce
Pe
rso
na
l a
ccid
ent a
nd
illne
ss
Too busy to arrange 28.6% 3.6% 2.0% 1.3% 4.5% 1.9% 13.7% 13.9% 25.0% 15.0% 4.0%
Too difficult complicated to arrange 1.3% 2.3% 5.6% 3.9% 5.6% 4.0%
Too expensive 7.1% 14.3% 20.0% 26.9% 18.2% 29.6% 17.6% 25.0% 8.3% 25.0% 29.3%
Risk too low/not worth it 7.1% 17.9% 26.0% 23.1% 31.8% 37.0% 13.7% 22.2% 16.7% 25.0% 10.7%
Not considered risk 4.0% 10.3% 11.4% 5.6% 9.8% 2.8% 10.0% 6.7%
Not sure if current cover picks up risk 7.1% 20.0% 7.7% 4.5% 3.7% 3.9% 5.6% 4.2% 6.7%
Could Not find appropriate cover 4.2% 6.7%
Am looking into it now 3.6% 2.0% 5.1% 1.9% 3.9% 4.2% 4.0%
Broker/Agent advised against 7.1% 2.0% 2.3% 1.9% 4.2%
Not tod about the risk 1.3% 6.8% 2.0%
Self ensured against risk 7.1% 10.7% 6.0% 3.8% 2.3% 13.0% 2.0% 11.1% 5.0% 5.3%
Other 42.9% 42.9% 18.0% 19.2% 15.9% 29.4% 13.9% 33.3% 20.0% 22.7%

7
Around 10% of Businesses do not have sufficient cover for business assets.
Of the 471 respondents that provided data on both the value of business assets and the sum insured;
15% were over insured (Asset Value < Sum Insured)
63% were adequately Insured (Asset Value = Sum Insured)
10.4% were under insured (Asset Value > Sum Insured)
The average asset value, sum insured and ratio of asset value to sum insured for each of the under, adequate and over insured cohorts are shown in table 3 below.
Table 3 Average of Assets and Sums Insured and ratio of Assets to Sum Insured
Asset Value Sum Insured Ratio of asset
value/ sum insured
Over Insured 711,143 2,656,764 0.55
Adequately Insured 1,481,019 1,481,019 1.00
Under Insured 1,401,683 644,000 12.91
Total 1,349,082 1,470,939 3.56
The insurance status (Over/Adequate/Under) on an industry basis is shown in figure 4
0.0%
20.0%
40.0%
60.0%
80.0%
100.0%
Figure 4Insurance Status by Industry
Over Ins Adeq Ins Under Ins

8
Figure 5 plots average asset values against average sum insured on an industry basis. The data is reproduced in table 4.
It should be noted the averages are for all the respondents that provided a response for both or only one of the variables “asset value” and “sum insured”. Consequently it is not appropriate to calculate the ratio of assets to sum insured as a measure of under or over insurance. The industry averages were potted against each other to confirm that in general there was a positive relationship between asset values and sums insured on an industry basis.
Table 4
Average Assets and Sums Insured for all respondents
Sector Asset Value Sum Insured
Communication 166,250 176,250
Personal & other services 422,130 386,778
Retail Trade 624,304 597,468
Education 300,000 630,000
Manufacturing 718,125 723,281
Health & Community Services 875,000 932,407
Wholesale Trade 1,024,762 1,013,333
Finance & Insurance 328,333 1,027,556
Construction 1,201,667 1,031,750
Transport & Storage 1,015,714 1,880,714
Property & Business Services 2,772,233 2,665,816
Accommodation, Cafes & Restaurants 1,160,007 3,127,074
Cultural & Recreational Services 2,559,565 3,616,957
-
500
1,000
1,500
2,000
2,500
3,000
3,500
4,000
- 500 1,000 1,500 2,000 2,500 3,000
Ave
rage
Su
m In
sure
d (
'00
0s)
Average Asset Values ('000s)
Figure 5Assets against sum insured (all respondents)
9
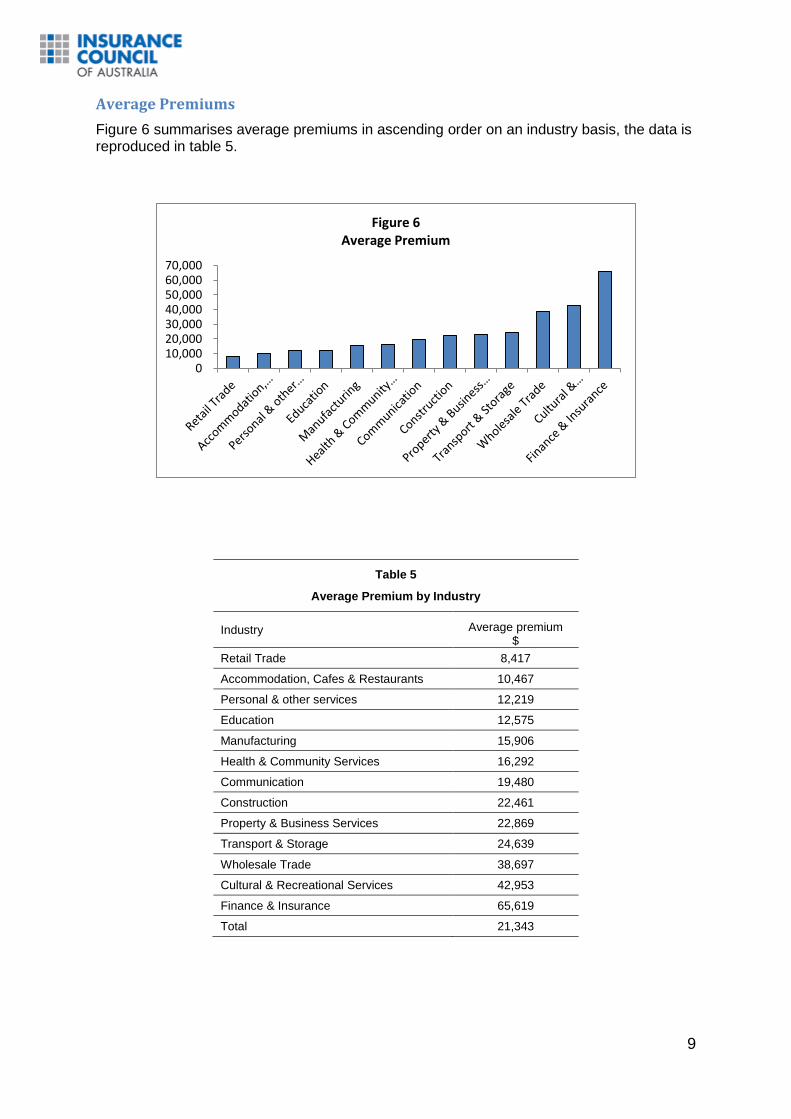
Average Premiums
Figure 6 summarises average premiums in ascending order on an industry basis, the data is reproduced in table 5.
Table 5
Average Premium by Industry
Industry Average premium $
Retail Trade 8,417
Accommodation, Cafes & Restaurants 10,467
Personal & other services 12,219
Education 12,575
Manufacturing 15,906
Health & Community Services 16,292
Communication 19,480
Construction 22,461
Property & Business Services 22,869
Transport & Storage 24,639
Wholesale Trade 38,697
Cultural & Recreational Services 42,953
Finance & Insurance 65,619
Total 21,343
010,00020,00030,00040,00050,00060,00070,000
Figure 6Average Premium

10
Claims
Average number of claims per business over past year was 1.9 with Health and Community Services averaging 2.5 and Accommodation, Cafes & Restaurants averaging 1.13 claims.
The average claim size across all industries was $6,764 with Wholesale Trade averaging the largest claim size of $15,314 and Personal and Other Services the smallest at $2,337
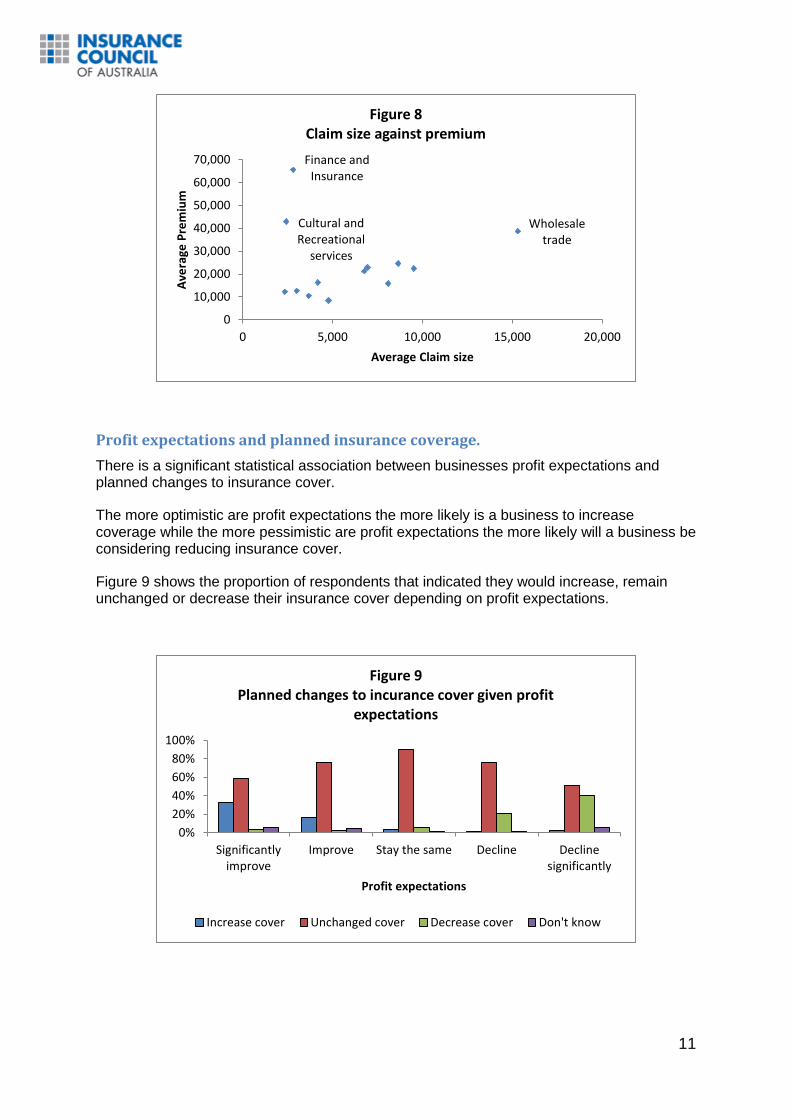
Table 7 summarises the average number of claims made, claims paid and claim size on an industry basis while figure 7 ranks the average claim by descending order and figure 8 plots average claim size against average premiums on an industry basis.
Table 7 Average number of claims made, claims paid and average claim size by Industry
Average Number of claims made
Average Number of claims paid
Average Claim size
Manufacturing 1.57 1.48 8,098
Construction 1.77 1.74 9,516
Wholesale Trade 2.11 2.11 15,314
Retail Trade 1.39 1.26 4,769
Accommodation, Cafes & Restaurants 1.13 1.13 3,659
Transport & Storage 1.82 1.73 8,651
Finance & Insurance 2.22 2.22 2,809
Property & Business Services 2.25 2.09 6,941
Education 1.50 1.50 3,000
Health & Community Services 2.50 2.44 4,186
Cultural & Recreational Services 1.75 1.63 2,432
Personal & other services 2.00 1.88 2,337
Total 1.87 1.79 6,764
02,0004,0006,0008,000
10,00012,00014,00016,00018,000
Figure 7Average claim by industry
11
Profit expectations and planned insurance coverage.
There is a significant statistical association between businesses profit expectations and planned changes to insurance cover.
The more optimistic are profit expectations the more likely is a business to increase coverage while the more pessimistic are profit expectations the more likely will a business be considering reducing insurance cover.
Figure 9 shows the proportion of respondents that indicated they would increase, remain unchanged or decrease their insurance cover depending on profit expectations.
Wholesale trade
Finance and Insurance
Cultural and Recreational
services
0
10,000
20,000
30,000
40,000
50,000
60,000
70,000
0 5,000 10,000 15,000 20,000
Ave
rage
Pre
miu
m
Average Claim size
Figure 8Claim size against premium
0%
20%
40%
60%
80%
100%
Significantlyimprove
Improve Stay the same Decline Declinesignificantly
Profit expectations
Figure 9Planned changes to incurance cover given profit
expectations
Increase cover Unchanged cover Decrease cover Don't know
12
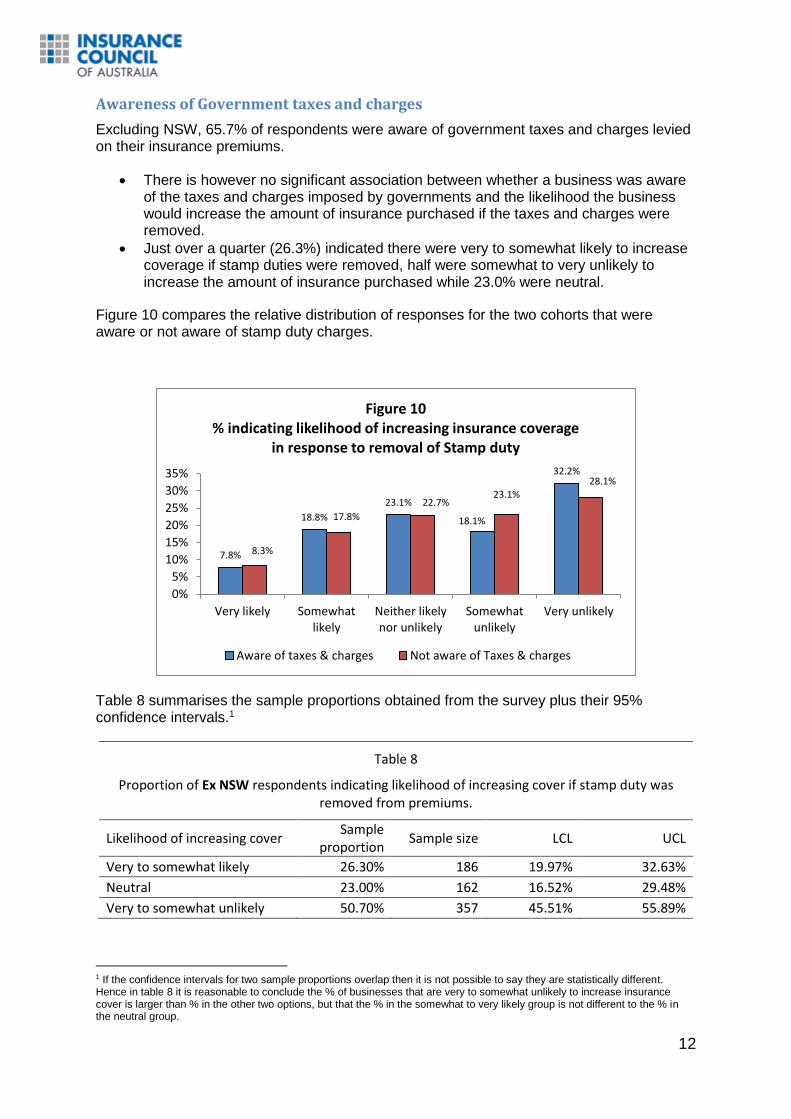
Awareness of Government taxes and charges
Excluding NSW, 65.7% of respondents were aware of government taxes and charges levied on their insurance premiums.
There is however no significant association between whether a business was aware of the taxes and charges imposed by governments and the likelihood the business would increase the amount of insurance purchased if the taxes and charges were removed.
Just over a quarter (26.3%) indicated there were very to somewhat likely to increase coverage if stamp duties were removed, half were somewhat to very unlikely to increase the amount of insurance purchased while 23.0% were neutral.
Figure 10 compares the relative distribution of responses for the two cohorts that were aware or not aware of stamp duty charges.
Table 8 summarises the sample proportions obtained from the survey plus their 95% confidence intervals.1
Table 8
Proportion of Ex NSW respondents indicating likelihood of increasing cover if stamp duty was removed from premiums.
Likelihood of increasing cover Sample
proportion Sample size LCL UCL
Very to somewhat likely 26.30% 186 19.97% 32.63%
Neutral 23.00% 162 16.52% 29.48%
Very to somewhat unlikely 50.70% 357 45.51% 55.89%
1 If the confidence intervals for two sample proportions overlap then it is not possible to say they are statistically different. Hence in table 8 it is reasonable to conclude the % of businesses that are very to somewhat unlikely to increase insurance cover is larger than % in the other two options, but that the % in the somewhat to very likely group is not different to the % in the neutral group.
7.8%
18.8%
23.1%
18.1%
32.2%
8.3%
17.8%
22.7%23.1%
28.1%
0%
5%
10%
15%
20%
25%
30%
35%
Very likely Somewhatlikely
Neither likelynor unlikely
Somewhatunlikely
Very unlikely
Figure 10% indicating likelihood of increasing insurance coverage
in response to removal of Stamp duty
Aware of taxes & charges Not aware of Taxes & charges
13
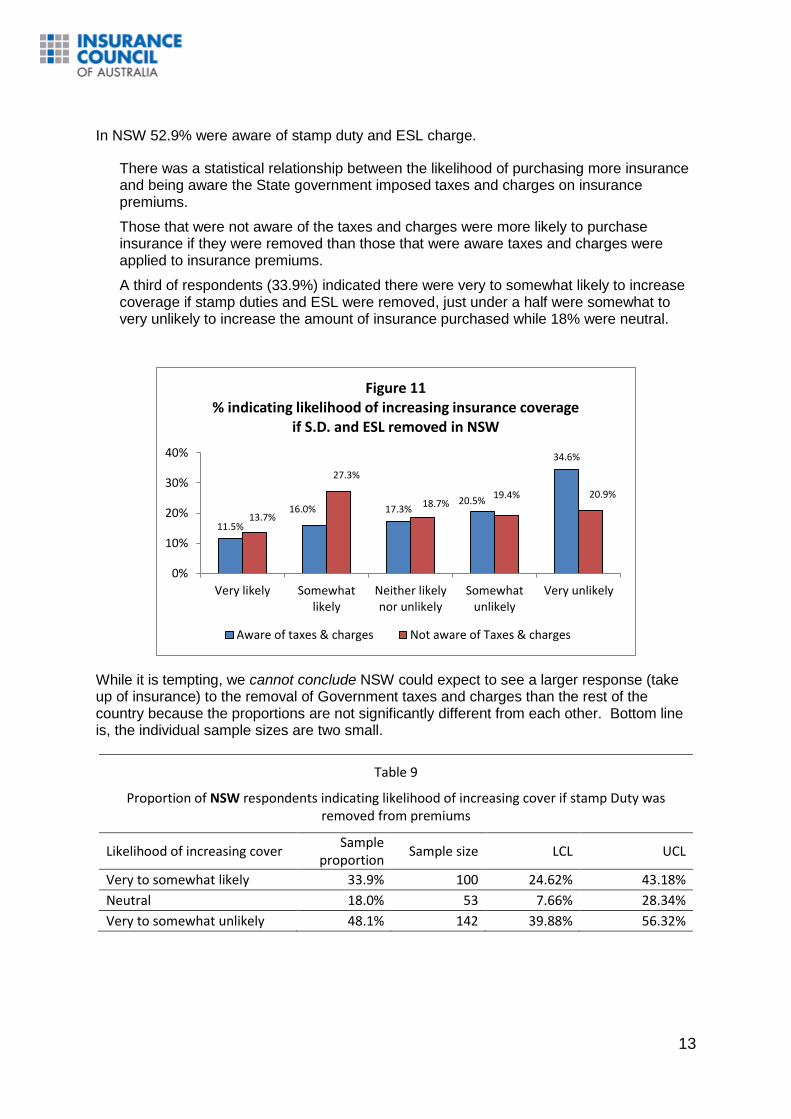
In NSW 52.9% were aware of stamp duty and ESL charge.
There was a statistical relationship between the likelihood of purchasing more insurance and being aware the State government imposed taxes and charges on insurance premiums.
Those that were not aware of the taxes and charges were more likely to purchase insurance if they were removed than those that were aware taxes and charges were applied to insurance premiums.
A third of respondents (33.9%) indicated there were very to somewhat likely to increase coverage if stamp duties and ESL were removed, just under a half were somewhat to very unlikely to increase the amount of insurance purchased while 18% were neutral.
While it is tempting, we cannot conclude NSW could expect to see a larger response (take up of insurance) to the removal of Government taxes and charges than the rest of the country because the proportions are not significantly different from each other. Bottom line is, the individual sample sizes are two small.
Table 9
Proportion of NSW respondents indicating likelihood of increasing cover if stamp Duty was removed from premiums
Likelihood of increasing cover Sample
proportion Sample size LCL UCL
Very to somewhat likely 33.9% 100 24.62% 43.18%
Neutral 18.0% 53 7.66% 28.34%
Very to somewhat unlikely 48.1% 142 39.88% 56.32%
11.5%
16.0% 17.3%20.5%
34.6%
13.7%
27.3%
18.7%19.4% 20.9%
0%
10%
20%
30%
40%
Very likely Somewhatlikely
Neither likelynor unlikely
Somewhatunlikely
Very unlikely
Figure 11 % indicating likelihood of increasing insurance coverage
if S.D. and ESL removed in NSW
Aware of taxes & charges Not aware of Taxes & charges

14
Figure 12 and table 10 summarise the aggregated response, that is, all states and territories combined.
It is reasonable to conclude that 50% of respondents would be somewhat to very unlikely to increase cover if state taxes and charges were removed, however roughly the same proportion of respondents would be very to somewhat likely to increase their cover as the proportion that would be neutral to buying more cover.
Table 10
Proportion of ALL respondents indicating likelihood of increasing cover if stamp Duty was removed from premiums
Likelihood of increasing cover Sample
proportion Sample size LCL UCL
Very to somewhat likely 28.6% 286 23.36% 33.84%
Neutral 21.5% 215 16.01% 26.99%
Very to somewhat unlikely 49.9% 499 45.51% 54.29%
Increased insurance cover
Of the respondents that indicated they were somewhat to very likely to increase insurance cover if rates and charges removed;
1/3rd indicated they would increase their insurance cover by increasing their sum insured
11% nominated reducing their excess and
56% nominated they would cover a risk not currently insured
28.6%
21.5%
49.9%
0.0%
10.0%
20.0%
30.0%
40.0%
50.0%
60.0%
Very to somewhat likely Neutral Very to somewhatunlikely
Figure 12% indicating likelihood of increasing insurance cover if
state taxes and charges removed
15
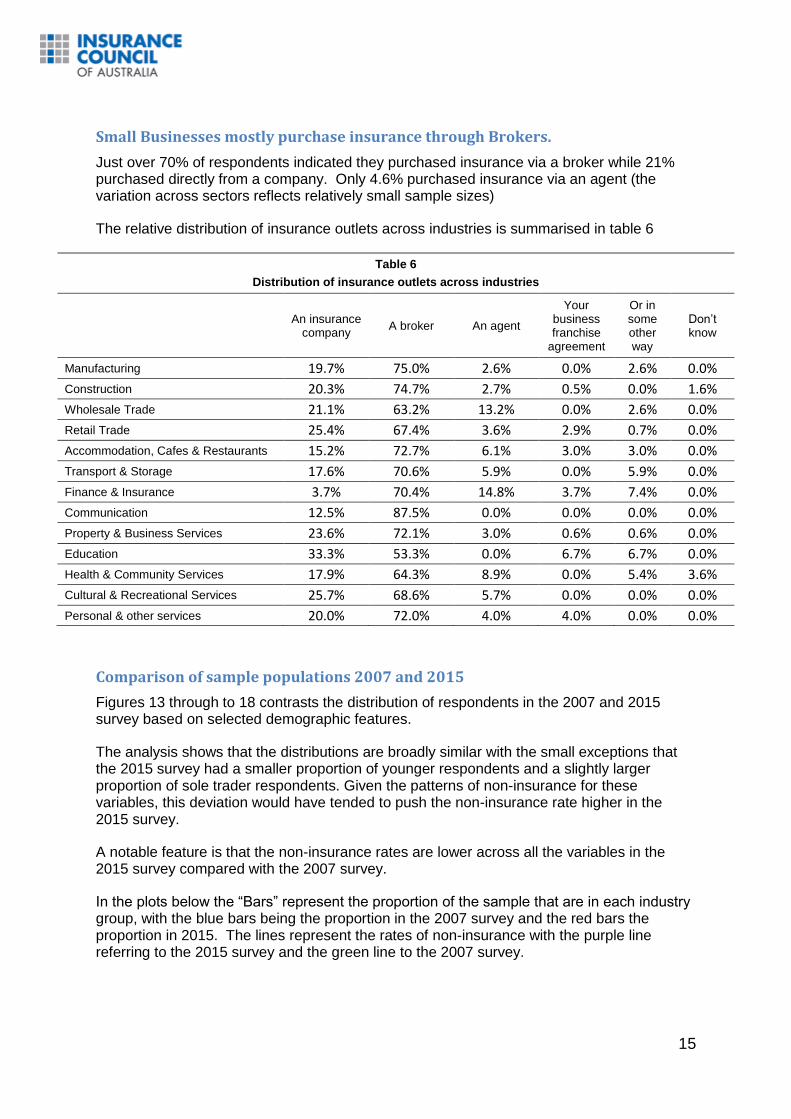
Small Businesses mostly purchase insurance through Brokers.
Just over 70% of respondents indicated they purchased insurance via a broker while 21% purchased directly from a company. Only 4.6% purchased insurance via an agent (the variation across sectors reflects relatively small sample sizes)
The relative distribution of insurance outlets across industries is summarised in table 6
Table 6
Distribution of insurance outlets across industries
An insurance company
A broker An agent
Your business franchise
agreement
Or in some other way
Don’t know
Manufacturing 19.7% 75.0% 2.6% 0.0% 2.6% 0.0%
Construction 20.3% 74.7% 2.7% 0.5% 0.0% 1.6%
Wholesale Trade 21.1% 63.2% 13.2% 0.0% 2.6% 0.0%
Retail Trade 25.4% 67.4% 3.6% 2.9% 0.7% 0.0%
Accommodation, Cafes & Restaurants 15.2% 72.7% 6.1% 3.0% 3.0% 0.0%
Transport & Storage 17.6% 70.6% 5.9% 0.0% 5.9% 0.0%
Finance & Insurance 3.7% 70.4% 14.8% 3.7% 7.4% 0.0%
Communication 12.5% 87.5% 0.0% 0.0% 0.0% 0.0%
Property & Business Services 23.6% 72.1% 3.0% 0.6% 0.6% 0.0%
Education 33.3% 53.3% 0.0% 6.7% 6.7% 0.0%
Health & Community Services 17.9% 64.3% 8.9% 0.0% 5.4% 3.6%
Cultural & Recreational Services 25.7% 68.6% 5.7% 0.0% 0.0% 0.0%
Personal & other services 20.0% 72.0% 4.0% 4.0% 0.0% 0.0%
Comparison of sample populations 2007 and 2015
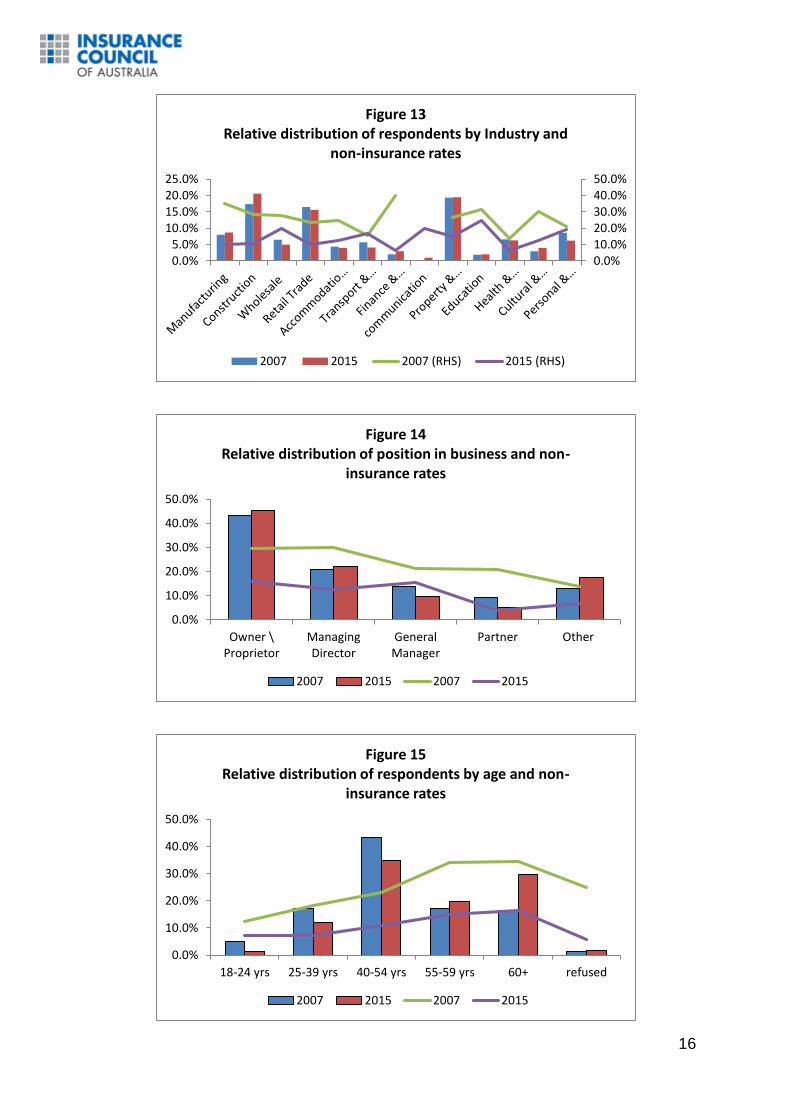
Figures 13 through to 18 contrasts the distribution of respondents in the 2007 and 2015 survey based on selected demographic features.
The analysis shows that the distributions are broadly similar with the small exceptions that the 2015 survey had a smaller proportion of younger respondents and a slightly larger proportion of sole trader respondents. Given the patterns of non-insurance for these variables, this deviation would have tended to push the non-insurance rate higher in the 2015 survey.
A notable feature is that the non-insurance rates are lower across all the variables in the 2015 survey compared with the 2007 survey.
In the plots below the “Bars” represent the proportion of the sample that are in each industry group, with the blue bars being the proportion in the 2007 survey and the red bars the proportion in 2015. The lines represent the rates of non-insurance with the purple line referring to the 2015 survey and the green line to the 2007 survey.
16
0.0%10.0%20.0%30.0%40.0%50.0%
0.0%5.0%
10.0%15.0%20.0%25.0%
Figure 13Relative distribution of respondents by Industry and
non-insurance rates
2007 2015 2007 (RHS) 2015 (RHS)
0.0%
10.0%
20.0%
30.0%
40.0%
50.0%
Owner \Proprietor
ManagingDirector
GeneralManager
Partner Other
Figure 14Relative distribution of position in business and non-
insurance rates
2007 2015 2007 2015
0.0%
10.0%
20.0%
30.0%
40.0%
50.0%
18-24 yrs 25-39 yrs 40-54 yrs 55-59 yrs 60+ refused
Figure 15Relative distribution of respondents by age and non-
insurance rates
2007 2015 2007 2015

17
0%
20%
40%
60%
80%
100%
Home Separate Premises
Figure 16Relative distribution of location of business and non-
insurance rates
2007 2015 2007 2015
0.0%
10.0%
20.0%
30.0%
40.0%
50.0%
Noemployees\sole
trader
1-4 employees 5-10 employees 11-19 employees
Figure 17Relative distribution by number of employees and non-
insurance rates
2007 2015 2007 2015
0.0%
5.0%
10.0%
15.0%
20.0%
25.0%
30.0%
35.0%
NSW WA SA QLD VIC TAS NT ACT
Figure 18Relative distribution by state and non-insurance rate
2007 2015 2007 2015


