25
NONPROFIT AMERICA: An Overview Lester M. Salamon National Academy of Sciences Workshop on NSF Survey of Nonprofit R and D Washington, D.C., June 30, 2014
NONPROFIT AMERICA:
An Overview
Lester M. Salamon
National Academy of Sciences Workshop on NSF Survey of Nonprofit R and D
Washington, D.C., June 30, 2014
Source: Lester M. Salamon, America’s Nonprofit Sector: A Primer, 3rd Edition, 2012, Foundation Center.
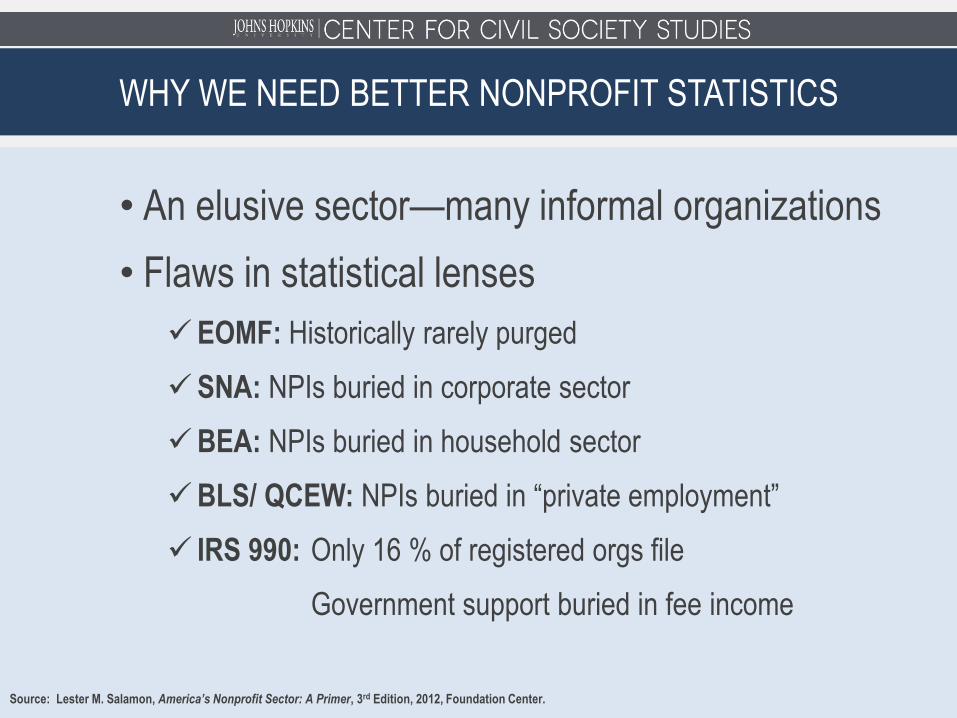
• An elusive sector—many informal organizations
• Flaws in statistical lenses
EOMF: Historically rarely purged
SNA: NPIs buried in corporate sector
BEA: NPIs buried in household sector
BLS/ QCEW: NPIs buried in “private employment”
IRS 990: Only 16 % of registered orgs file
Government support buried in fee income
WHY WE NEED BETTER NONPROFIT STATISTICS
FIXING THE STATISTICAL LENS ON NONPROFITS
ILO MANUAL ON THE MEASUREMENT OF VOLUNTEER WORK
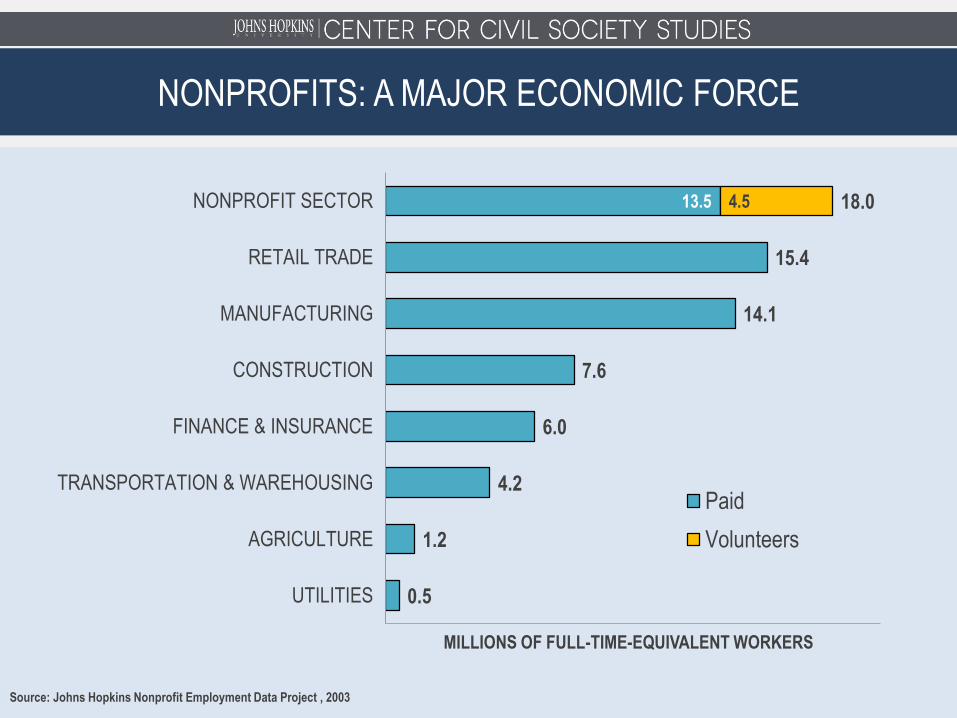
Source: Johns Hopkins Nonprofit Employment Data Project , 2003
13.5 4.5
0.5
1.2
4.2
6.0
7.6
14.1
15.4
18.0
UTILITIES
AGRICULTURE
TRANSPORTATION & WAREHOUSING
FINANCE & INSURANCE
CONSTRUCTION
MANUFACTURING
RETAIL TRADE
NONPROFIT SECTOR
MILLIONS OF FULL-TIME-EQUIVALENT WORKERS
Paid
Volunteers
NONPROFITS: A MAJOR ECONOMIC FORCE
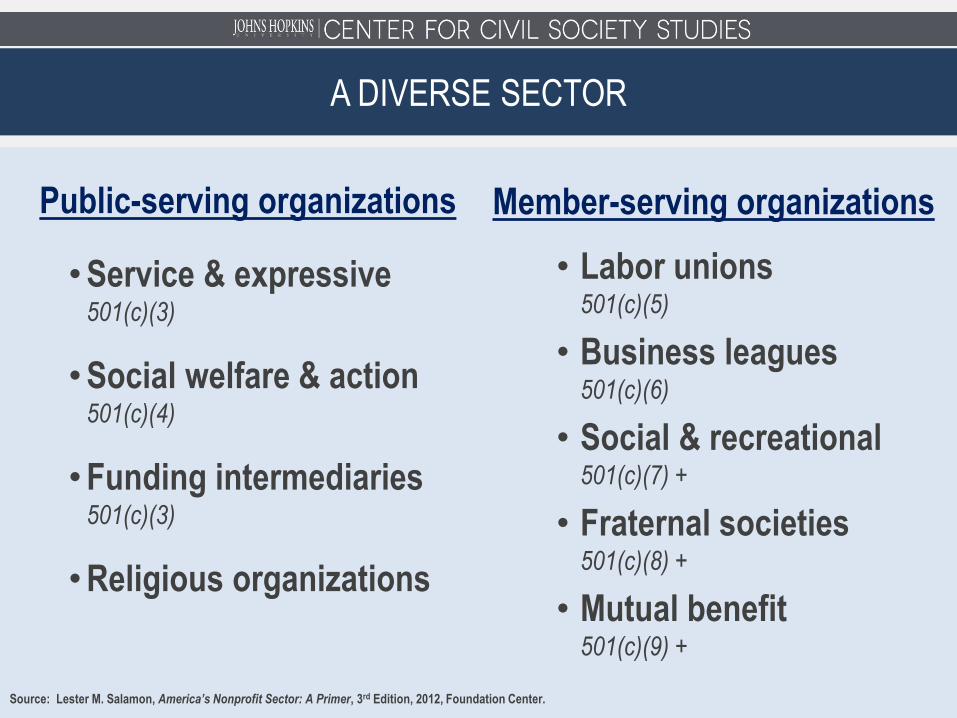
Member-serving organizations
• Labor unions 501(c)(5)
• Business leagues 501(c)(6)
• Social & recreational 501(c)(7) +
• Fraternal societies 501(c)(8) +
• Mutual benefit 501(c)(9) +
Public-serving organizations
•Service & expressive 501(c)(3)
•Social welfare & action 501(c)(4)
•Funding intermediaries 501(c)(3)
•Religious organizations
A DIVERSE SECTOR
Source: Lester M. Salamon, America’s Nonprofit Sector: A Primer, 3rd Edition, 2012, Foundation Center.
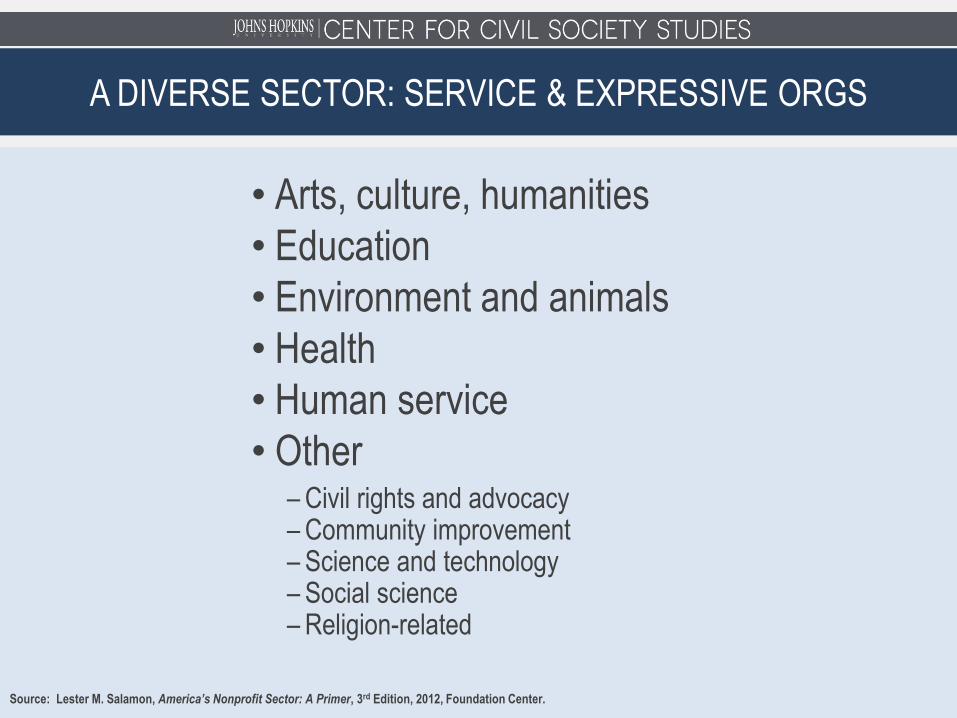
• Arts, culture, humanities
• Education
• Environment and animals
• Health
• Human service
• Other – Civil rights and advocacy – Community improvement – Science and technology – Social science – Religion-related
Source: Lester M. Salamon, America’s Nonprofit Sector: A Primer, 3rd Edition, 2012, Foundation Center.
A DIVERSE SECTOR: SERVICE & EXPRESSIVE ORGS
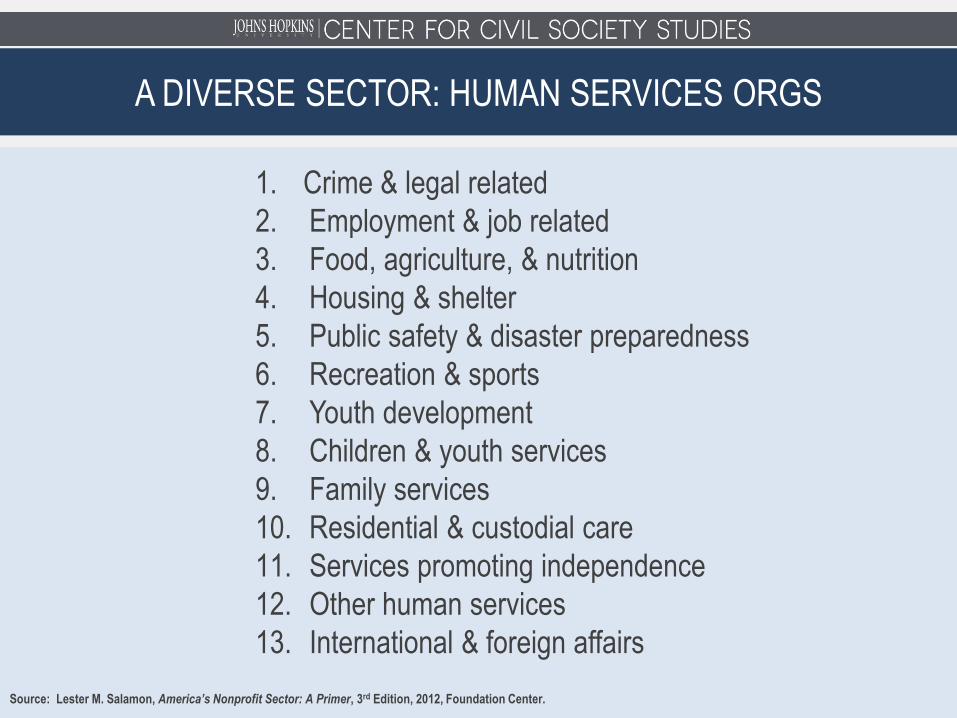
1. Crime & legal related
2. Employment & job related
3. Food, agriculture, & nutrition
4. Housing & shelter
5. Public safety & disaster preparedness
6. Recreation & sports
7. Youth development
8. Children & youth services
9. Family services
10. Residential & custodial care
11. Services promoting independence
12. Other human services
13. International & foreign affairs
Source: Lester M. Salamon, America’s Nonprofit Sector: A Primer, 3rd Edition, 2012, Foundation Center.
A DIVERSE SECTOR: HUMAN SERVICES ORGS
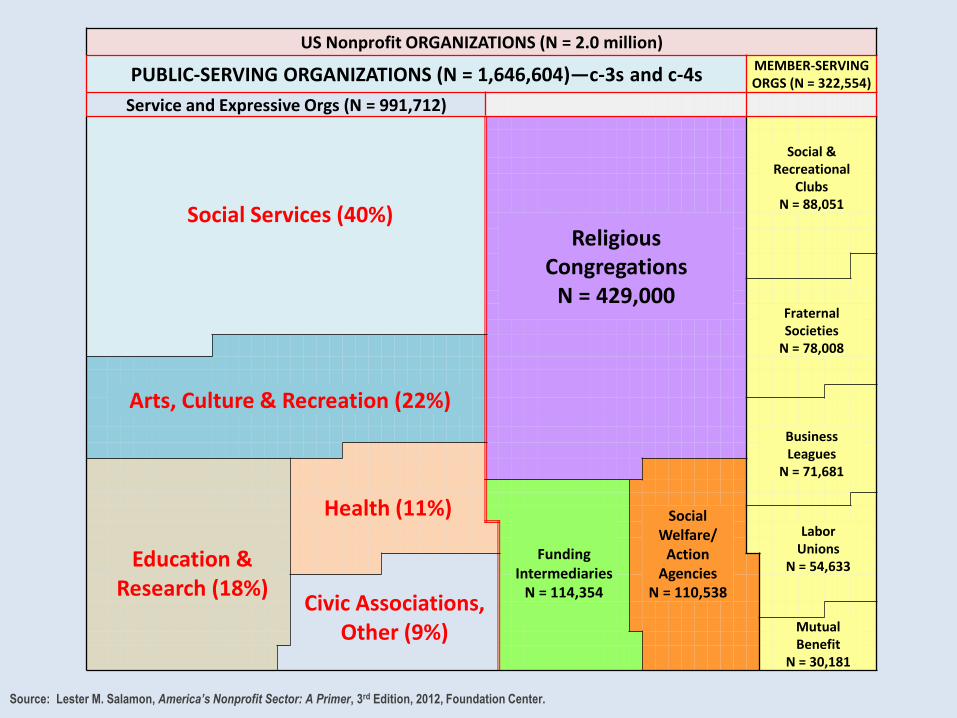
US Nonprofit ORGANIZATIONS (N = 2.0 million)
PUBLIC-SERVING ORGANIZATIONS (N = 1,646,604)—c-3s and c-4s MEMBER-SERVING ORGS (N = 322,554)
Service and Expressive Orgs (N = 991,712)
Social & Recreational
Clubs N = 88,051
Social Services (40%)
Religious Congregations
N = 429,000
Fraternal Societies
N = 78,008
Arts, Culture & Recreation (22%)
Business Leagues
N = 71,681
Health (11%)
Funding Intermediaries
N = 114,354
Social Welfare/
Action Agencies
N = 110,538
Education & Research (18%)
Labor Unions
N = 54,633
Civic Associations, Other (9%)
Mutual Benefit
N = 30,181
Source: Lester M. Salamon, America’s Nonprofit Sector: A Primer, 3rd Edition, 2012, Foundation Center.
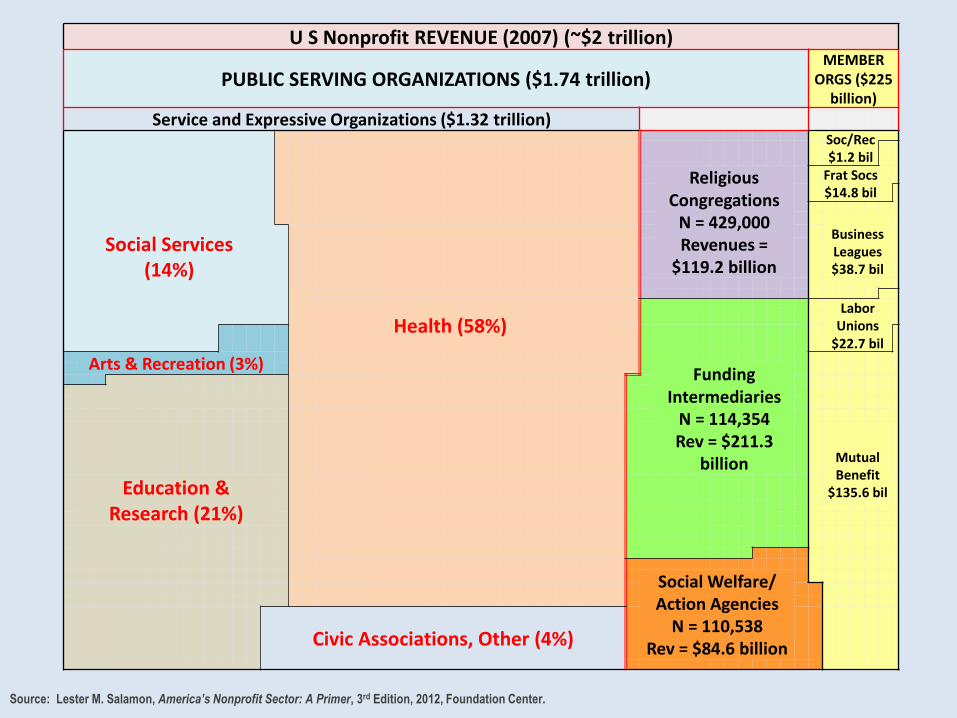
U S Nonprofit REVENUE (2007) (~$2 trillion)
PUBLIC SERVING ORGANIZATIONS ($1.74 trillion) MEMBER
ORGS ($225 billion)
Service and Expressive Organizations ($1.32 trillion)
Soc/Rec $1.2 bil
Religious Congregations
N = 429,000 Revenues =
$119.2 billion
Frat Socs $14.8 bil
Business Leagues $38.7 bil
Social Services (14%)
Health (58%) Labor
Unions $22.7 bil
Arts & Recreation (3%)
Funding Intermediaries
N = 114,354 Rev = $211.3
billion
Mutual Benefit
$135.6 bil
Education & Research (21%)
Social Welfare/ Action Agencies
N = 110,538 Rev = $84.6 billion
Civic Associations, Other (4%)
Source: Lester M. Salamon, America’s Nonprofit Sector: A Primer, 3rd Edition, 2012, Foundation Center.
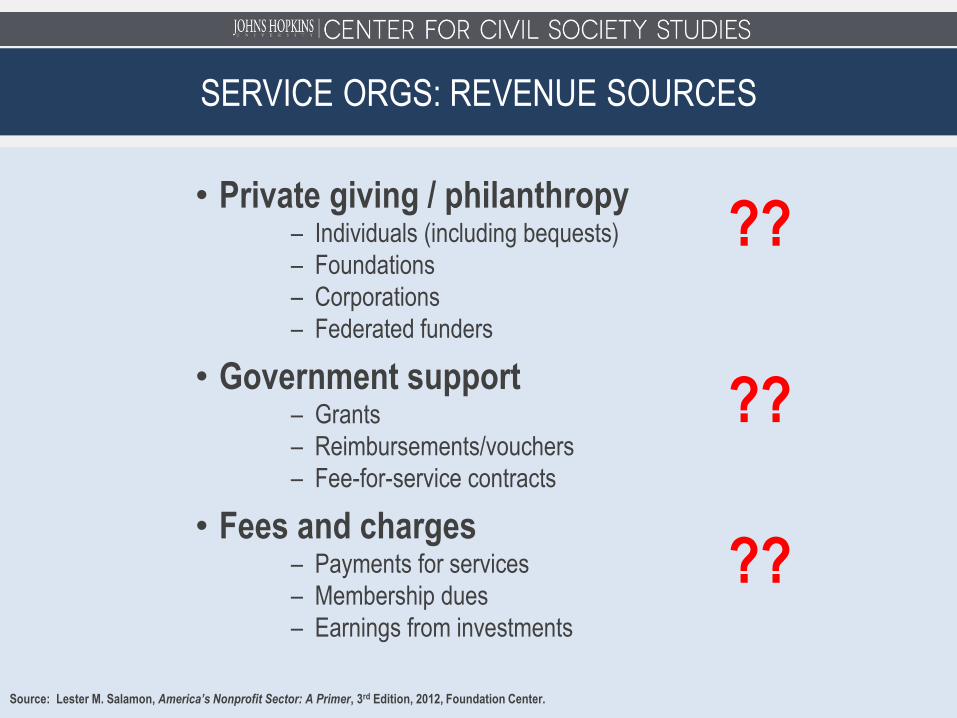
• Private giving / philanthropy – Individuals (including bequests)
– Foundations
– Corporations
– Federated funders
• Government support – Grants
– Reimbursements/vouchers
– Fee-for-service contracts
• Fees and charges – Payments for services
– Membership dues
– Earnings from investments
??
??
??
Source: Lester M. Salamon, America’s Nonprofit Sector: A Primer, 3rd Edition, 2012, Foundation Center.
SERVICE ORGS: REVENUE SOURCES
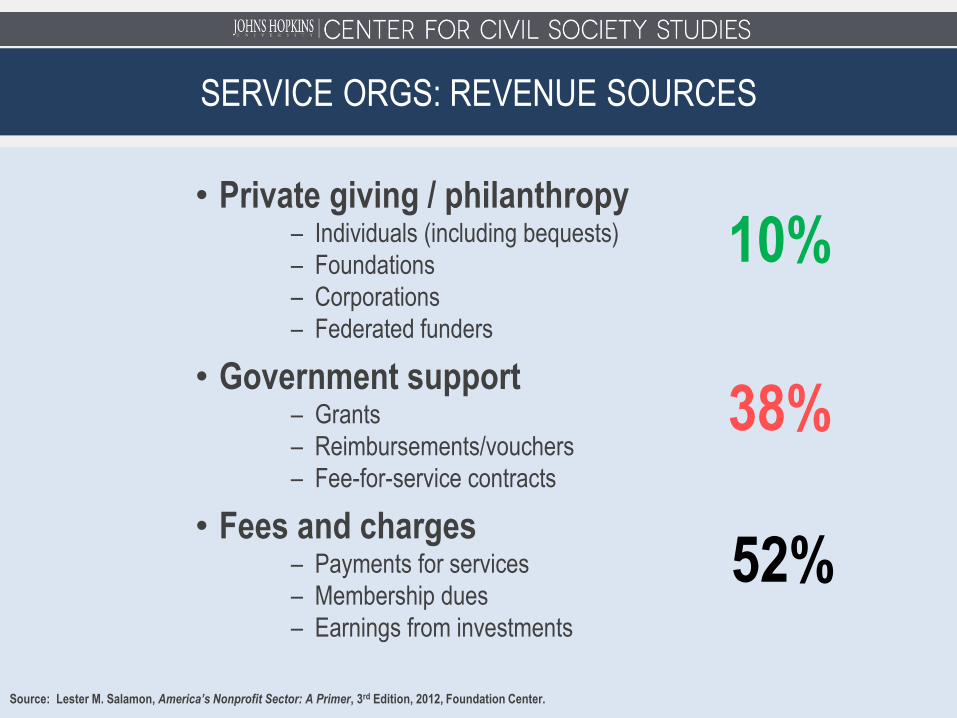
• Private giving / philanthropy – Individuals (including bequests)
– Foundations
– Corporations
– Federated funders
• Government support – Grants
– Reimbursements/vouchers
– Fee-for-service contracts
• Fees and charges – Payments for services
– Membership dues
– Earnings from investments
Source: Lester M. Salamon, America’s Nonprofit Sector: A Primer, 3rd Edition, 2012, Foundation Center.
SERVICE ORGS: REVENUE SOURCES
10%
38%
52%
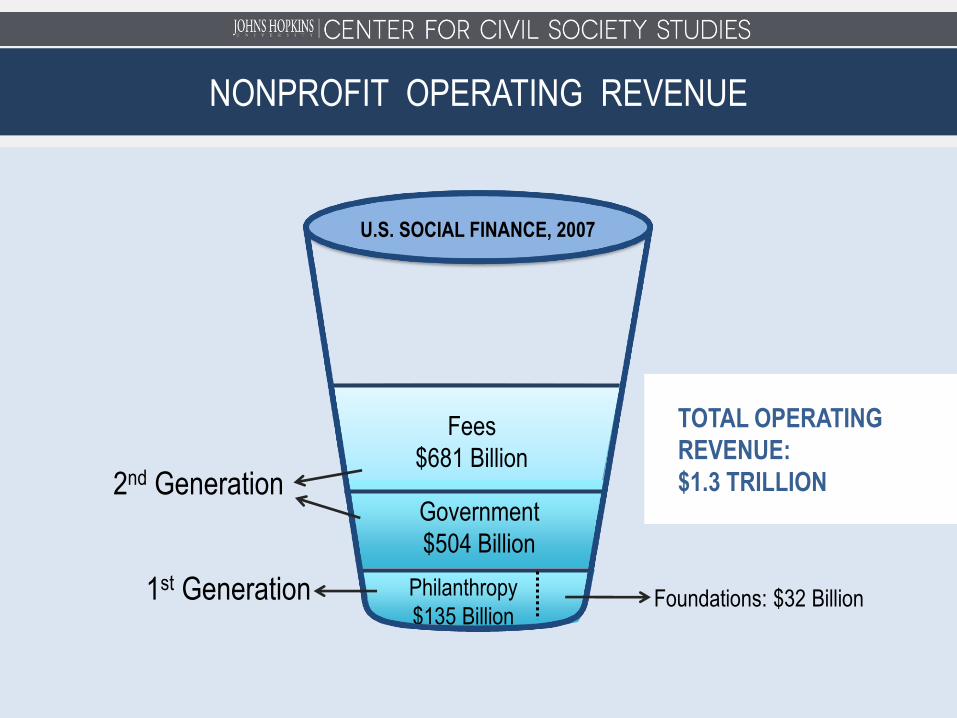
Fees
$681 Billion
Government
$504 Billion
$685 Billion Philanthropy
$135 Billion
U.S. SOCIAL FINANCE, 2007
2nd Generation
1st Generation Foundations: $32 Billion
TOTAL OPERATING
REVENUE:
$1.3 TRILLION
NONPROFIT OPERATING REVENUE
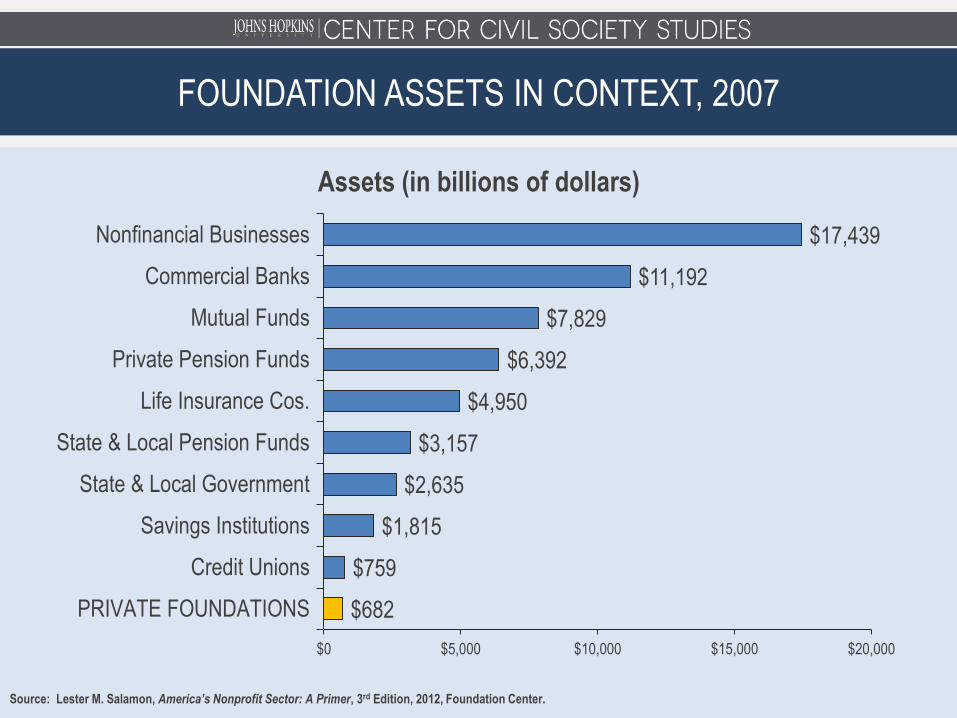
$682
$759
$1,815
$2,635
$3,157
$4,950
$6,392
$7,829
$11,192
$17,439
$0 $5,000 $10,000 $15,000 $20,000
PRIVATE FOUNDATIONS
Credit Unions
Savings Institutions
State & Local Government
State & Local Pension Funds
Life Insurance Cos.
Private Pension Funds
Mutual Funds
Commercial Banks
Nonfinancial Businesses
Assets (in billions of dollars)
Source: Lester M. Salamon, America’s Nonprofit Sector: A Primer, 3rd Edition, 2012, Foundation Center.
FOUNDATION ASSETS IN CONTEXT, 2007
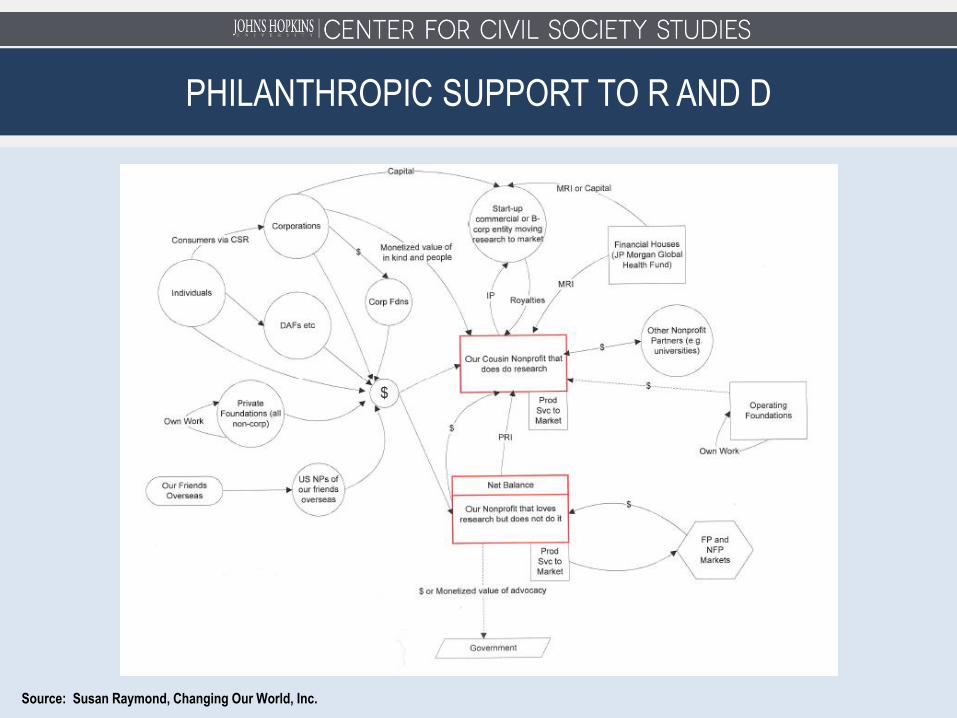
Source: Susan Raymond, Changing Our World, Inc.
PHILANTHROPIC SUPPORT TO R AND D
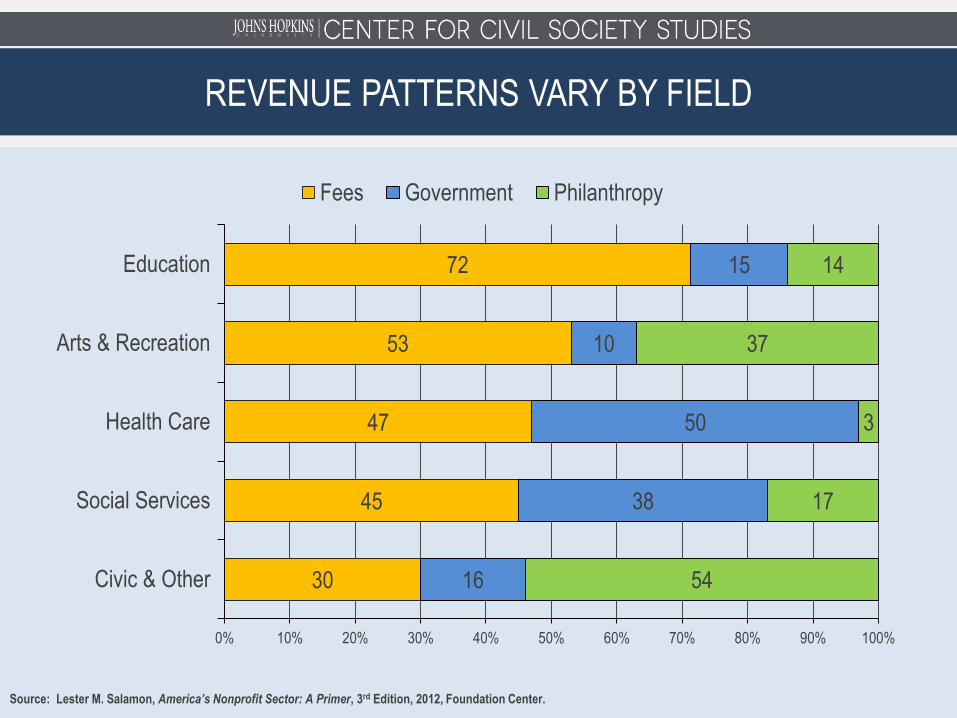
30
45
47
53
72
16
38
50
10
15
54
17
3
37
14
0% 10% 20% 30% 40% 50% 60% 70% 80% 90% 100%
Civic & Other
Social Services
Health Care
Arts & Recreation
Education
Fees Government Philanthropy
Source: Lester M. Salamon, America’s Nonprofit Sector: A Primer, 3rd Edition, 2012, Foundation Center.
REVENUE PATTERNS VARY BY FIELD
Source: Lester M. Salamon, The State of Nonprofit America, Second Edition, (Washington, D.C.: The Brookings Institution Press, 2012).
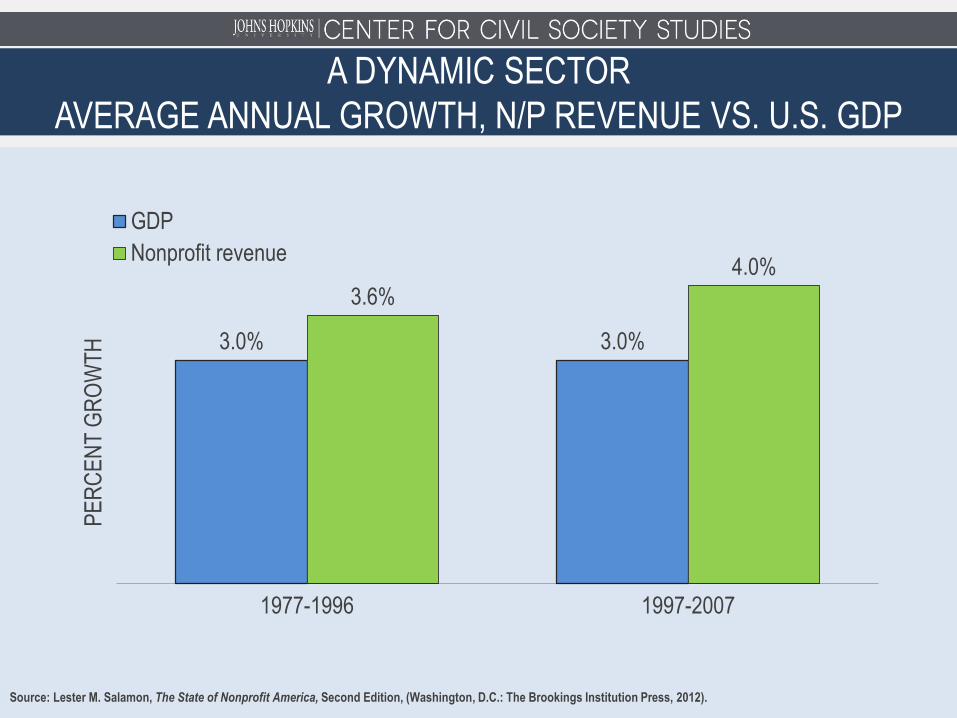
3.0% 3.0%
3.6%
4.0%
1977-1996 1997-2007
PE
RC
EN
T G
RO
WT
H
GDP
Nonprofit revenue
A DYNAMIC SECTOR
AVERAGE ANNUAL GROWTH, N/P REVENUE VS. U.S. GDP
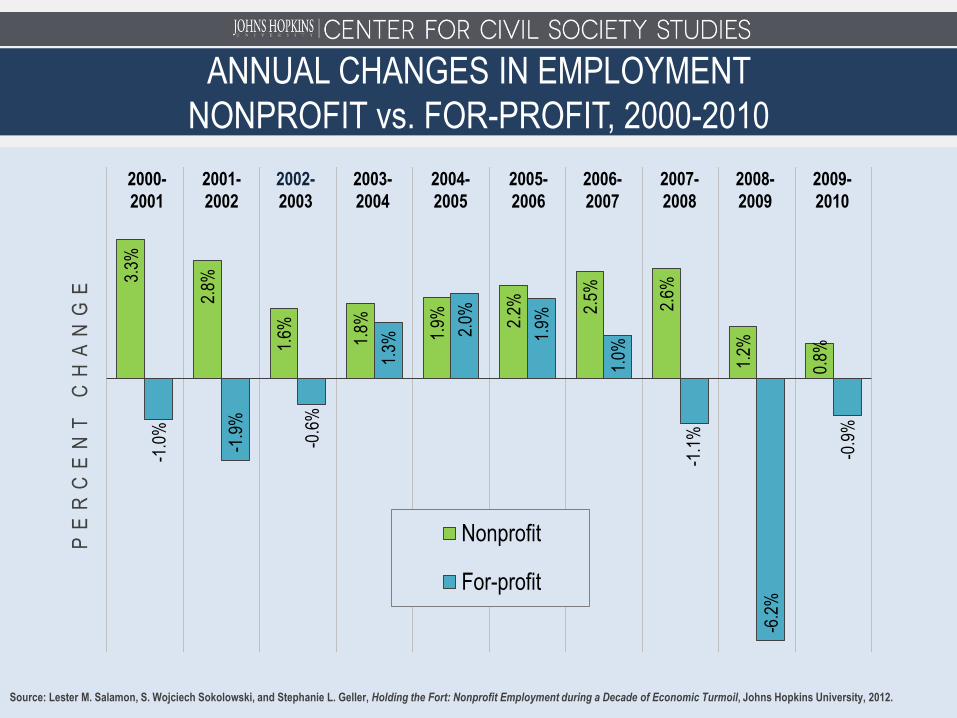
Source: Lester M. Salamon, S. Wojciech Sokolowski, and Stephanie L. Geller, Holding the Fort: Nonprofit Employment during a Decade of Economic Turmoil, Johns Hopkins University, 2012.
3.3%
2.8%
1.6%
1.8%
1.9%
2.2%
2.5%
2.6%
1.2%
0.8%
-1.0
%
-1.9
%
-0.6
%
1.3%
2.0%
1.9%
1.0%
-1.1
%
-6.2
%
-0.9
%
PE
RC
EN
T
CH
AN
GE
Nonprofit
For-profit
2000-
2001
2005-
2006
2004-
2005
2003-
2004
2002-
2003
2001-
2002
2009-
2010
2008-
2009
2007-
2008
2006-
2007
ANNUAL CHANGES IN EMPLOYMENT
NONPROFIT vs. FOR-PROFIT, 2000-2010
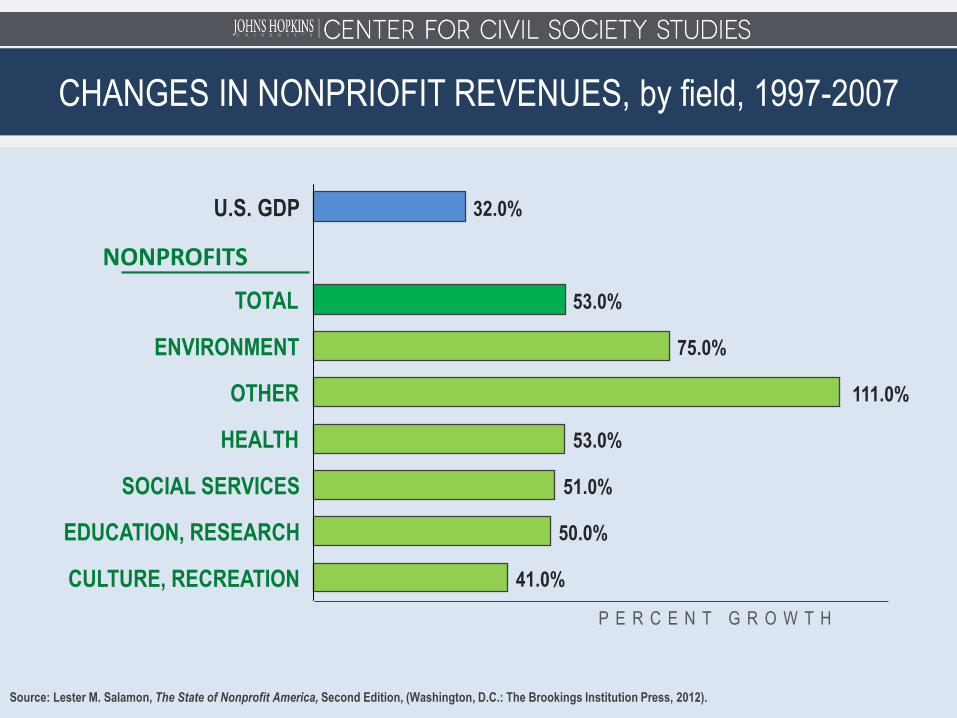
41.0%
50.0%
51.0%
53.0%
111.0%
75.0%
53.0%
CULTURE, RECREATION
EDUCATION, RESEARCH
SOCIAL SERVICES
HEALTH
OTHER
ENVIRONMENT
TOTAL
32.0% U.S. GDP
P E R C E N T G R O W T H
NONPROFITS
Source: Lester M. Salamon, The State of Nonprofit America, Second Edition, (Washington, D.C.: The Brookings Institution Press, 2012).
CHANGES IN NONPRIOFIT REVENUES, by field, 1997-2007
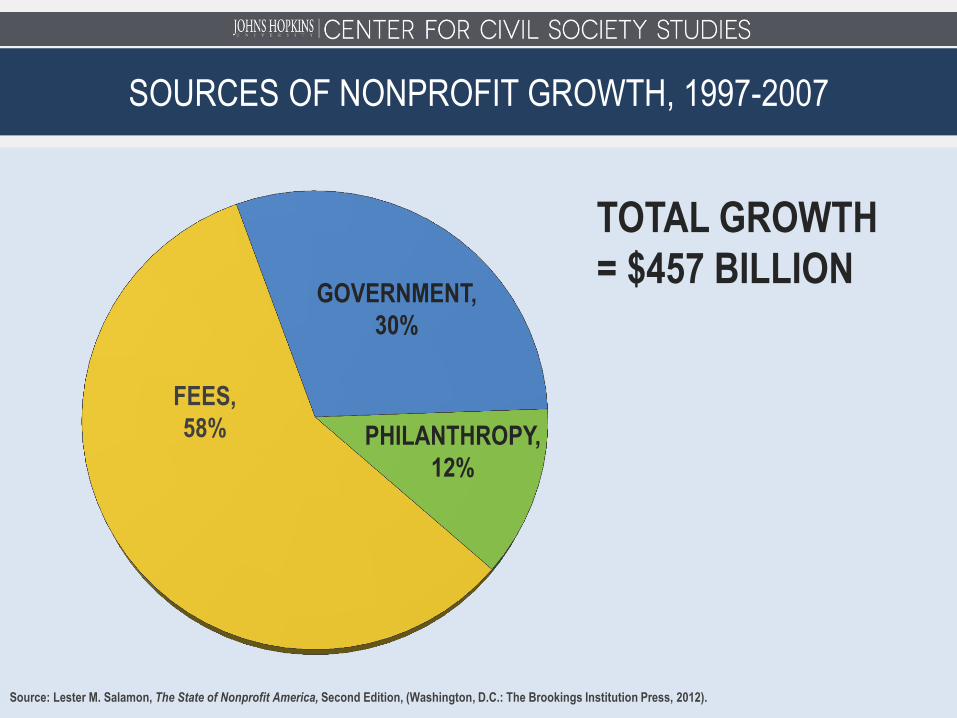
WHO WE ARE SOURCES OF NONPROFIT GROWTH, 1997-2007
FEES,
58%
GOVERNMENT,
30%
PHILANTHROPY,
12%
TOTAL GROWTH
= $457 BILLION
Source: Lester M. Salamon, The State of Nonprofit America, Second Edition, (Washington, D.C.: The Brookings Institution Press, 2012).
Source: Lester M. Salamon, The State of Nonprofit America, Second Edition, (Washington, D.C.: The Brookings Institution Press, 2012).
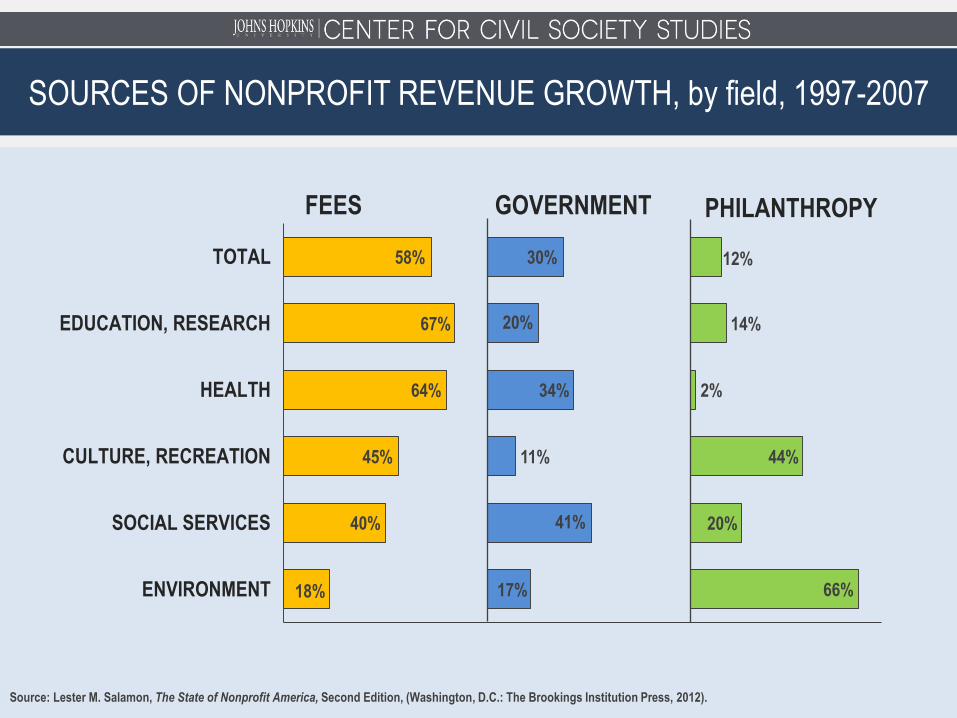
18%
40%
45%
64%
67%
58%
17%
41%
11%
34%
20%
30%
66%
20%
44%
2%
14%
12%
ENVIRONMENT
SOCIAL SERVICES
CULTURE, RECREATION
HEALTH
EDUCATION, RESEARCH
TOTAL
FEES GOVERNMENT PHILANTHROPY
SOURCES OF NONPROFIT REVENUE GROWTH, by field, 1997-2007
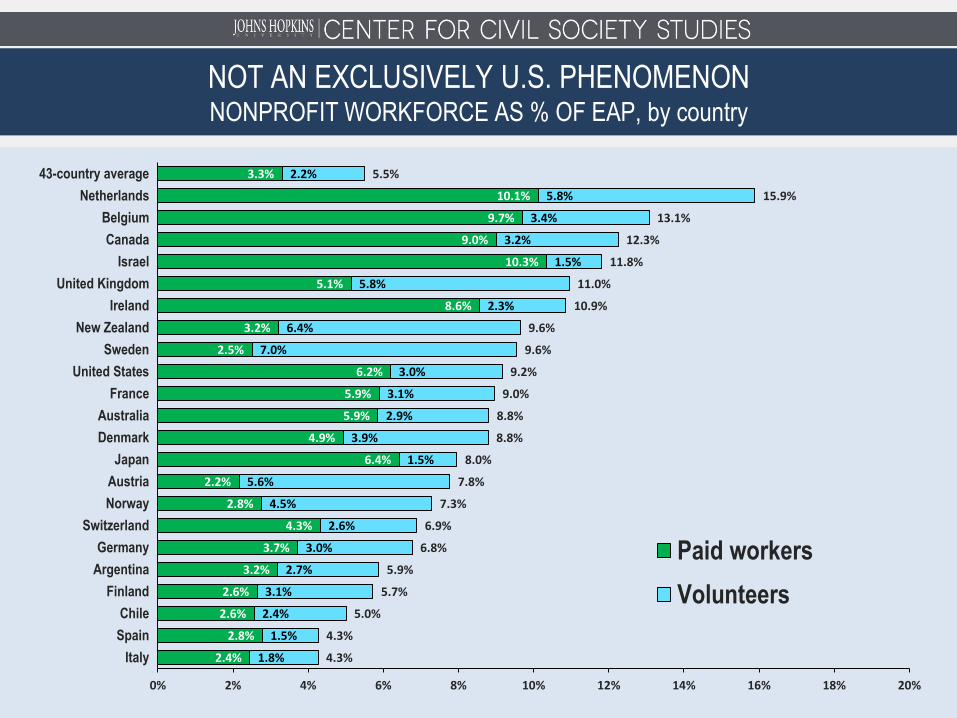
2.4%
2.8%
2.6%
2.6%
3.2%
3.7%
4.3%
2.8%
2.2%
6.4%
4.9%
5.9%
5.9%
6.2%
2.5%
3.2%
8.6%
5.1%
10.3%
9.0%
9.7%
10.1%
3.3%
1.8%
1.5%
2.4%
3.1%
2.7%
3.0%
2.6%
4.5%
5.6%
1.5%
3.9%
2.9%
3.1%
3.0%
7.0%
6.4%
2.3%
5.8%
1.5%
3.2%
3.4%
5.8%
2.2%
4.3%
4.3%
5.0%
5.7%
5.9%
6.8%
6.9%
7.3%
7.8%
8.0%
8.8%
8.8%
9.0%
9.2%
9.6%
9.6%
10.9%
11.0%
11.8%
12.3%
13.1%
15.9%
5.5%
0% 2% 4% 6% 8% 10% 12% 14% 16% 18% 20%
Italy
Spain
Chile
Finland
Argentina
Germany
Switzerland
Norway
Austria
Japan
Denmark
Australia
France
United States
Sweden
New Zealand
Ireland
United Kingdom
Israel
Canada
Belgium
Netherlands
43-country average
Paid workers
Volunteers
NOT AN EXCLUSIVELY U.S. PHENOMENON NONPROFIT WORKFORCE AS % OF EAP, by country
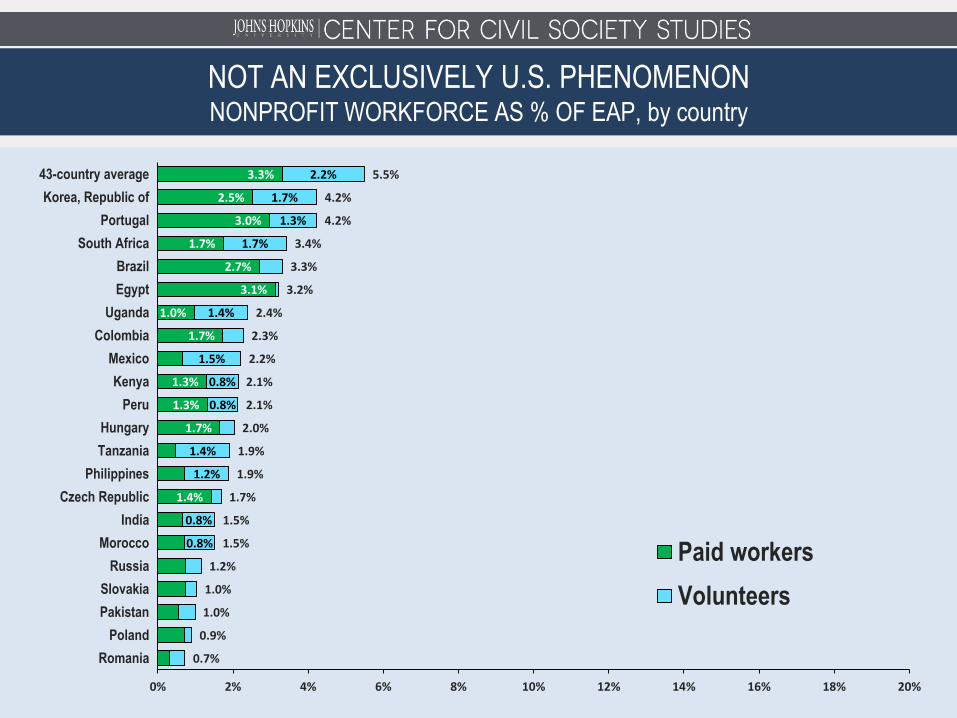
1.4%
1.7%
1.3%
1.3%
1.7%
1.0%
3.1%
2.7%
1.7%
3.0%
2.5%
3.3%
0.8%
0.8%
1.2%
1.4%
0.8%
0.8%
1.5%
1.4%
1.7%
1.3%
1.7%
2.2%
0.7%
0.9%
1.0%
1.0%
1.2%
1.5%
1.5%
1.7%
1.9%
1.9%
2.0%
2.1%
2.1%
2.2%
2.3%
2.4%
3.2%
3.3%
3.4%
4.2%
4.2%
5.5%
0% 2% 4% 6% 8% 10% 12% 14% 16% 18% 20%
Romania
Poland
Pakistan
Slovakia
Russia
Morocco
India
Czech Republic
Philippines
Tanzania
Hungary
Peru
Kenya
Mexico
Colombia
Uganda
Egypt
Brazil
South Africa
Portugal
Korea, Republic of
43-country average
Paid workers
Volunteers
NOT AN EXCLUSIVELY U.S. PHENOMENON NONPROFIT WORKFORCE AS % OF EAP, by country
WHO WE ARE FURTHER INFORMATION
LESTER M. SALAMON
Website: ccss.jhu.edu
Twitter: @JHUCCSS


