NORMAN Association Network of reference laboratories and related organisations for monitoring and bio-monitoring of emerging environmental substances Working Group on Prioritisation of Emerging Substances NORMAN Prioritisation framework for emerging substances April 2013 Edited by Valeria Dulio & Peter C. von der Ohe NORMAN Association N° W604002510 Rue Jacques Taffanel – Parc Technologique ALATA - 60550 VERNEUIL EN HALATTE (France) Internet : www.norman-network.net
Transcript
NORMAN Association
Network of reference laboratories and related organisations for monitoring and bio-monitoring of emerging environmental
substances
Working Group on Prioritisation of Emerging Substances
NORMAN Prioritisation framework for emerging substances
April 2013
Edited by Valeria Dulio & Peter C. von der Ohe
NORMAN Association N° W604002510
Rue Jacques Taffanel – Parc Technologique ALATA - 60550 VERNEUIL EN HALATTE (France)
Internet : www.norman-network.net
Published by : NORMAN Association ISBN : 978-2-9545254-0-2 April 2013
Leaders of the activity
Valeria Dulio - INERIS, FR Working Group leader
Anja Derksen - AD eco advice, NL Ecotoxicity sub-group leader
Working Group experts
Marlene Ågerstrand Stockholm University SE
Laurence Amalric BRGM FR
Sandrine Andres INERIS FR
Ludek Blaha Recetox CZ
Werner Brack UFZ DE
Eva Brostrom IVL SE
Hélène Budzinski University of Bordeaux FR
Stellan Fisher KEMI SE
James Franklin PlasticsEurope EU
Armelle Hebert VEOLIA Environnement FR
Juliane Hollender EAWAG CH
Valérie Ingrand VEOLIA Environnement FR
Alice James-Casas INERIS FR
Martin Keller BfG DE
Vera Ocenaskova T. G. Masaryk Water Research Inst. CZ
Page 7 NORMAN Network http://www.norman-network.net
Association N° W604002510
Executive Summary
The list of chemical compounds that are frequently discussed in the literature as “emerging substances” is ever growing. The „2010 NORMAN list‟ contains over 700 emerging substances, selected by NORMAN experts, drawing on expert judgment and the scientific literature. Existing knowledge gaps (e.g. insufficient information on the effects of a substance, inadequate performance of the analytical method for quantifying its level of occurrence in the environment) do not allow an emerging substance to be correctly evaluated and may lead to its being discarded or overlooked if conventional prioritisation methodologies are applied. To this purpose the NORMAN Working Group on “Prioritisation of emerging substances” was set up in 2010 to develop a prioritisation scheme designed for emerging substances and associated knowledge gaps. Unlike other prioritisation methods, which aim simply to rank all candidate substances against one single prioritisation objective, the NORMAN method combines the ranking process with a prior allocation of the substances into action categories, which allows substances to be managed on the basis of the level of available information, thereby avoiding the exclusion of substances for which there are limited data. The overall prioritisation procedure is carried out in two successive stages. In the first stage, the NORMAN prioritisation methodology uses a decision tree that classifies chemicals into six categories, based on identified (“categories” of) knowledge gaps and actions to be taken by the research community and public authorities to fill them. The second stage entails the prioritisation of the substances within each (action) category, on the basis of the criteria / indicators identified for each category. The overall process is an iterative process that involves a periodic revision of the priority substances in each category whenever e.g. new information / more reliable data are generated or feedback from applied reduction measures is available. The NORMAN scheme is addressed to water managers and competent authorities that are aiming to identify priority substances at national, river basin and European level. It provides decision-makers with a common framework for the creation and updating of the lists of chemical substances for which actions to reduce, monitor or gather scientific or technical data are to be undertaken as a matter of priority. This document will be updated according to the latest scientific findings whenever those are available.
Page 8 NORMAN Network http://www.norman-network.net
N° W604002510
1 Background and aim
The list of chemical compounds that are frequently discussed in the literature as “emerging substances” is ever growing. Some substances are already at quite an advanced stage of assessment and are likely to become regulated substances soon. Other substances have been discussed only recently and we know very little about them. And then there are the not-yet-identified emerging substances (e.g. compounds / transformation products which are present in the environment but which are not part of any monitoring programme). It is not possible to deal with all these substances in the same degree of detail. We need to identify the substances of high priority for monitoring and/or risk assessment, and for further research. But if we apply the conventional prioritisation methodologies, a large part (if not all) of these emerging substances would be discarded or left on stand-by because of a lack of data / information: i.e. insufficient evidence of risk. This limitation was clearly identified in the exercise carried out by DG ENV for revision of the list of Priority Substances under the Water Framework Directive (WFD) (INERIS, IOW, 2009) where about 50% of the compounds on the list of candidate substances were discarded because of a lack of data or insufficient data reliability. The final report of this exercise states that according to Art. 16 of the WFD, substances cannot be prioritised if there is no available evidence of risk to or via the aquatic environment, from completed, targeted or simplified risk assessments. On the other hand, because these emerging substances are not prioritised by the conventional methodologies, they are monitored less often or not at all: as a result, too few data are available to show evidence of risk. In other words, they are caught in a 'vicious circle'. It is therefore important to decide how these individual substances should be dealt with in terms of actions to be taken to fill the current gaps (e.g. development of more powerful analytical methods, EQS development, new ecotoxicity tests). The NORMAN Working Group on Prioritisation of emerging substances was therefore set up in 2010 with the aim of developing a prioritisation scheme for emerging substances, in which chemicals are prioritised by action needed, taking into account the current knowledge gaps. The present report describes the features of the NORMAN prioritisation methodology. Existing prioritisation methodologies (e.g. Fraunhofer Institute, 1999; OSPAR, 2006; INERIS, IOW, 2009; UK Environment Agency, 2007) have been used as a starting point, but the NORMAN scheme provides a framework that goes beyond the existing prioritisation methodologies to address the knowledge gaps and reflect what is 'emerging' or likely to emerge. Unlike other prioritisation methods, which aim simply to rank all candidate substances against one single prioritisation objective, the NORMAN method combines the ranking process with a prior allocation of the substances into action categories, which allows substances to be managed on the basis of the level of available information, thereby avoiding the exclusion of substances for which there are limited data. The NORMAN scheme is addressed to all water managers and competent authorities aiming to identify priority substances at national, river basin and European level. It provides decision-makers with a common framework for the creation and updating of the lists of
Page 9 NORMAN Network http://www.norman-network.net
N° W604002510
chemical substances for which actions to reduce, monitor or gather scientific or technical data are to be undertaken as a matter of priority. This document will be updated according to the latest scientific findings whenever those are available.
2 Scope
The present methodology deals with prioritisation of emerging substances in the aquatic compartment (i.e. water, sediment, suspended particulate matter and biota). NORMAN will evaluate the opportunity to extend the prioritisation methodology to the other compartments as part of its activities in future years. In terms of protection objectives, this prioritisation scheme is addressed to aquatic ecosystems and human health via the aquatic environment, in line with the objectives of the WFD. Human health risks associated with drinking water exposure (i.e. via inhalation, skin contact and ingestion) are not considered in the present study. The development of this part of the methodology will be the responsibility of a sub-group of experts with competencies in human health risk assessment and water treatment techniques for human consumption, which will be launched in 2013.
3 Candidate substances for prioritisation
As a first step, a list of candidate substances for prioritisation should be compiled. Although this methodology may in principle be applied to any list of compounds – emerging or not – the “natural” candidate compounds for this prioritisation scheme are the so-called emerging substances, for which a rather limited knowledge base is currently available. More than 700 “frequently discussed” emerging substances1 have been identified by the NORMAN experts, based on citations in the scientific literature and expert judgment, taking into account the definition of “emerging substances” and “emerging pollutants” given in the NORMAN Glossary of Terms (www.norman-network.net >> Glossary). Any list of emerging substances is therefore by definition a dynamic list that should be assessed by experts and regularly revised. Engineered nanoparticles, metals and inorganic metal compounds are not covered by the present prioritisation process.
4 Key principles of the methodology
The overall methodology (see Figure 1) is based on the following steps:
A) An initial categorisation of the substances into a defined number of action categories;
B) A subsequent ranking of the substances within each action category;
1 The latest version of the NORMAN list of “frequently discussed” emerging substances was compiled in 2010. It forms the basis of the first test run of this prioritisation scheme and it is regularly updated by the NORMAN experts based on the results of the prioritisation process and new input from research studies.
Page 10 NORMAN Network http://www.norman-network.net
N° W604002510
C) A review process to validate the results of the overall prioritisation exercise and allow constant upgrading of the overall process.
A) Categorisation (allocation of substances to action categories) A categorisation step before ranking is needed in order to allow the creation of more homogeneous groups of compounds which are characterised by similar knowledge gaps and which are therefore more comparable with each other for subsequent ranking. The action categories represent the actions to be taken by the research community and public authorities in collaboration with industry in order to reduce the current knowledge gaps. The categorisation process adopted in this methodology is described in Section 5. It includes the following steps: a) Definition of the action categories; b) Definition of the criteria and indicators to be used for the categorisation process and
derivation of a decision tree for allocation of each substance to the appropriate category;
c) Data gathering, including identification of data sources and procedures for data validation (i.e. reliability check);
d) Data treatment for allocation of the substances to the identified categories; e) Allocation of the substances to the identified action categories; f) Review and/or adjustment of the criteria / indicators, and improvement of supporting
data. B) Ranking of substances within each action category The ranking process allows the assignment of a score / level of priority to each substance within its action category. The ranking process is described in Section 6. It includes the following steps:
a) Definition of the indicators that should allow the evaluation of the level of priority within
each action category; b) Initial data collection and validation for the defined indicators; c) Definition of the prioritisation algorithm (scoring system); d) Application of the prioritisation algorithm and testing; e) Collection of additional data for high priority compounds. C) Review process Based on expert review of the results arising from the overall prioritisation exercise and input from latest research findings, the review process should trigger constant improvement of the supporting data, regular updating of the candidate substances for prioritisation and, whenever necessary, possible upgrading of the methodology. It is important to stress that the process of substance categorisation and prioritisation is by definition an iterative process which involves a periodic revision of the priority substances in each category whenever e.g. new information / more reliable data are generated or feedback from applied reduction measures is available.
Page 11 NORMAN Network http://www.norman-network.net
N° W604002510
PrioritySubst.by actioncategory
List of emerging substances
Exposure data Effect data
1 2 3 4 5 6
Data gathering & Assessment of the quality and relevance of the available data
Ranking of substances within each action category
3 4 5 621
Allocation of substances to action categories
Review processAdditional data gathering and validation
Figure 1: Flow chart of the methodology for categorisation and ranking of emerging substances
5 Categorisation into action categories
5.1 Action categories
Six categories – covering the whole spectrum of possible data gaps for emerging substances – are used for categorisation of candidate substances (Table 1). The aim is to allow water managers to focus on distinct actions according to the type of current knowledge gaps for a given substance / group of substances.
MPORTANT: ALL categories proposed below are intended to identify the action(s) needed and not a level of priority among substances (e.g. substances in Category 2 are on the same level of priority as Category 3). Table 1: Six action categories identified on the basis of the type of current knowledge gaps
Cat. Action category Current situation
1 Integration in routine monitoring and derivation of legally binding EQS
Sufficient evidence of exposure and adverse effects at environmental concentration
2 Screening studies for information about current exposure
Hazard assessment is based on experimental data BUT few monitoring data
3 Rigorous hazard assessment Evidence of exposure BUT hazard assessment is based on predicted toxicity (P-PNEC)
4 Improvement of analytical methods required
Hazard assessment is based on experimental data BUT analytical capabilities not yet satisfactory
5 Screening studies AND rigorous hazard assessment
No or few monitoring data AND hazard assessment is based on predicted toxicity (P-PNEC)
6 Monitoring efforts for these compounds could be reduced
Toxicity data are sufficient for the derivation of an EQS and there is evidence that the exposure does not pose a hazard to ecosystems
Page 12 NORMAN Network http://www.norman-network.net
N° W604002510
5.2 Indicators for allocation of substances to the action categories
The indicators to classify the emerging substances into the six action categories are organised into three groups:
- exposure indicators - hazard indicators - risk indicators. The general principles behind the proposed indicators are described in the following sections. Their description follows the sequential steps of the decision tree applied for the allocation of the substances into the action categories (see Figure 1 in Section 5.3).
5.2.1 Exposure indicators
The exposure indicators used in the categorisation phase are aimed at assessing whether the quantity and quality of the available monitoring data are sufficient to allow exposure assessment for the identified emerging substances. The indicators used for this assessment are the following: Consistency between the monitored matrix and the relevant matrix for a given substance This indicator describes the distribution of the substance among the different media as a result of the application of fugacity models, plus assessment of the octanol–water partition coefficient (Kow), the organic carbon–water partition coefficient (Koc) and water solubility (Sw). Number of countries and number of sites with analyses The number of countries and the number of sites in which the substance was looked for is used as an indicator of the level of investigation of the given substance (well monitored substances vs insufficiently monitored substances). Number of sites with quantified data (above the Limit of Quantification, LOQ) The number of sites at which the substance was detected above the LOQ indicates whether the exposure is widespread or only a “local problem”, knowing that the actions of NORMAN might address both compounds that are of concern at a river basin or local level and compounds that are of concern at the European level. Compatibility of the analytical performance with the target environmental threshold If the substance is not quantified (i.e. occurrence levels are reported to be below the Limit of Quantification, LOQ) but the LOQ is above the lowest effect threshold (i.e. “Lowest PNEC”, see Section 5.2.3.1 for detailed explanation of this term) the available monitoring data will not be sufficient to exclude a potential risk. For these chemicals, further monitoring is needed and analytical methods should be improved to assess the real risk of the substance.
NOTE:
As a complement to, or surrogate for, the above-listed indicators, the use pattern and consumed tonnage of a substance in society can also be used as a proxy for monitoring. (These indicators will be included in the future development of this guidance document).
Page 13 NORMAN Network http://www.norman-network.net
N° W604002510
5.2.1.1 Recommendations for data gathering
a) Fugacity models, Kow, Koc and Sw
Data sources are reported in Annex III. In particular, details can be found: - for Kow in Section 4.1 - for Sw in Section 4.2 - for Koc in Section 4.3 and - for fugacity models in Section 5.
b) Monitoring data
Monitoring data need to be available as raw data in order to allow correct application of the proposed indicators. The NORMAN EMPODAT database (www.norman-network.net >> Databases >> EMPODAT) is a privileged tool (see Annex III, Section 1) for assessing the level of investigation and quantification of the identified emerging substances in the associated relevant matrix(ces). The target matrices are: - surface water (whole water and filtered water samples) - sediment - biota - sewage effluents.
c) Limit of quantification associated with the monitoring data
The limits of quantification (LOQs) used for assessment of exposure data are, first of all, those associated with the datasets (i.e. monitoring data available in the EMPODAT database or other datasets) used for the prioritisation exercise. LOQliterature should be searched for in the literature when all LOQs available in the EMPODAT database or in other existing datasets for a given substance, are above the respective Lowest PNEC. Recommendations for collection of LOQs from the scientific literature and derivation of a “Min LOQliterature” benchmark value, for a given substance in a given matrix, are provided in Annex III, Section 2.
5.2.1.2 Explanations for data treatment
a) Defining the relevant matrix(ces) for a substance
The procedure adopted in this scheme for identifying – for each candidate substance – the relevant matrix(ces) (based on the results from fugacity models, Kow, Koc and water solubility) is illustrated in Annex I, Section 2.
b) Grouping of substances by degree of investigation and evidence of exposure
On the basis of the indicators described above, the candidate substances can be divided
into distinct groups, according to their level of investigation and evidence of exposure in the
relevant matrix(ces):
- Substances that are sufficiently monitored and sufficiently quantified in the relevant matrix;
- Substances that are sufficiently monitored in the relevant matrix, but with a low frequency of quantification;
Page 14 NORMAN Network http://www.norman-network.net
N° W604002510
- Substances for which no data are available in the EMPODAT database or other existing datasets (labelled as “never monitored”);
- Substances that are monitored in a matrix that is considered as “not relevant” for the given substance.
Allocation of the substances to the above-mentioned groups is carried out taking into account the matrix in which the compound is measured and the relevant matrix(ces).
This means that from the very beginning of the categorisation process, for a given compound, the datasets measured in water, sediment and biota are treated separately.
The applied cut-off values are identical for the different matrices. The recommended values for application of the methodology at the European scale2 are reported in Table 2.
Table 2: Cut-off values associated with the different indicators used for exposure assessment in the categorisation step
Indicators / Substances sub-groups
Analyses available in the relevant matrix(ces)
Number of countries with analyses
Number of sites with analyses
Number of sites with analyses > LOQ
Subst. suff. monitored and sufficiently quantif. in relevant matrix
Yes ≥4 countries ≥100 sites ≥20 sites
Subst. suff. monitored but with low frequency of quantification
Yes ≥4 countries ≥100sites <20 sites
(or all data <LOQ)
Subst. insufficiently monitored
Yes <4 countries AND / OR
<100 sites with analyses
Not relevant
Subst. never monitored (i.e. data not available in EMPODAT or other existing datasets)
Not relevant No data No data No data
Subst. monitored in a “not relevant matrix”
No Not relevant Not relevant Not relevant
c) Compatibility of the analytical performance with the target environmental threshold
(LOQ < Lowest PNEC ?)
For the application of the indicator “Compatibility of the analytical performance with the target environmental threshold”, an upper and a lower LOQ value are derived from the EMPODAT database or other available datasets for each substance in the respective relevant matrix(ces).
In addition “Max LOQliterature” and “Min LOQliterature“ values, found in the scientific literature or provided by expert laboratories, should be considered when all LOQs available in the EMPODAT database or other existing datasets for a given substance are above the respective Lowest PNEC.
2 Different cut-off values can be proposed for an application of the methodology at the national or river basin level. For an application at the river basin level, for example, it is recommended to consider a compound as “sufficiently monitored” when there are analyses available for more than 10% of the stations in the given river basin and as “sufficiently quantified” when more than 15% of the analyses are quantified (i.e. > LOQ).
Page 15 NORMAN Network http://www.norman-network.net
N° W604002510
The objective here is to check whether analytical (research) laboratories can achieve LOQ levels below the lowest environmental threshold, Lowest PNEC, (which guarantees a safe level of the substance in the aquatic environment), or there is an actual need for development of improved analytical methods.
LOQ values found in the scientific literature for each relevant matrix are reported as LOQwater literature, LOQsed literature, LOQbiota_literature .
These values are compared with the respective Lowest PNEC, as illustrated in Table 3.
Table 3: Procedure for derivation of LOQ min/ max values and comparison with Lowest PNEC for the respective matrices
Matrix Fraction analysed LOQEMPODAT or other datasets LOQliterature Lowest PNEC
Water Whole water
Min /Max / 90th
LOQ whole waterdatasets
Min /Max / 90th
LOQwhole waterliterat
PNECwater
Filtered water Min /Max / 90th LOQ filtered waterdatasets
Min /Max / 90th
LOQfiltered waterliterat
Sediment ≤2mm
Min /Max / 90th
LOQseddatasets Min /Max / 90
th
LOQsedliterature PNECsed ≤63µm
≤ 20µm
Biota Fish tissue
Min /Max / 90th
LOQbiotadatasets
Min /Max / 90th
LOQbiotaliterature
PNECbiota/ fish
Invertebrate Min /Max / 90
th
LOQbiotadatasets Min /Max / 90
th
LOQbiotaliterature
PNECbiota/ invertebr.
For the derivation of LOQ benchmark values, it is also important to note that: - No distinction is made between the different types of water bodies (freshwater, marine
water, groundwater, etc.) for the derivation of the LOQ min / max / 90th percentile values;
- Wastewater LOQ values are divided by a factor of 3 before aggregation with the other LOQ freshwater data. This is done in order to take into account that LOQs for freshwater are lower than for wastewater, because with freshwater higher volumes are used for enrichment and the matrix load is lower. A factor of 3 is adopted here from the more conservative end of the range between 3 and 5, which reflects normal practice in the laboratory for comparison of LOQs between fresh water and wastewater;
- If fewer than 10 LOQ values (in the same matrix) are available, then the maximum LOQ is used as a benchmark value. If more than 10 LOQ values are available the 90th percentile from all LOQs (in the same matrix) is calculated and used as a benchmark value;
- LOQs from the last six years‟ datasets / references are used by default, but if there are no recent data available, then LOQs from older datasets (<+6 years) are applied;
- If for a given analysis the LOD (Limit of Detection) is available, but not the LOQ, the LOD value x 3 can be used instead. The corresponding results should be flagged.
Additional explanations for data treatment are presented in Annex I, in particular as regards:
- Harmonisation of measurement units; - Data aggregation according to defined scenarios (i.e. aggregation of the monitoring
data by type of water body according to the selected scenario).
Page 16 NORMAN Network http://www.norman-network.net
N° W604002510
5.2.2 Hazard indicators
The hazard indicators used in the categorisation phase are aimed at assessing whether the quantity and the quality of the available effect data are sufficient to allow for hazard assessment for the identified emerging substances. The indicators used for this assessment are the following: Availability of sufficient effect data for PNEC derivation:
In the context of the Water Framework Directive, the protection targets are ecosystems and human health. The EU TGD-EQS Guidance (EU Commission, 2011), however, specifies that, whereas standards for the protection of pelagic communities (organisms inhabiting the water column) are required for all substances, standards for other protection targets are to be determined for certain substances only, depending on their properties (particularly bioaccumulation).
The aim is therefore to check, as a minimum, whether the available ecotoxicity data are sufficient to enable a PNEC (Predicted No Effect Concentration) to be calculated for protection of the aquatic environment. This condition is considered satisfied if at least one short-term L(E)C50 from each of the three trophic levels (fish, invertebrates [preferred Daphnia sp.] and algae), i.e. the base set, is available. Availability of effect data from in vitro assays and non-standard endpoints:
Besides effects on mortality and reproduction, chemical substances may also have a number of other ecotoxicological effects on biota. Respective toxicological endpoints are often tested with in vitro assays. Some examples are oestrogen receptor mediated effects (ER-CALUX, YES tests), androgen receptor mediated effects, (AR-CALUX, YAS tests, aryl hydrocarbon receptor (AhR) mediated effects (DR-CALUX, EROD induction tests), genotoxicity effects (AMES).
Moreover, besides these more “established” non-standard endpoints, other endpoints, such as nest holding, competition, egg production, heart rate, behaviour etc. (Boxall, 2008) as well as drift, immunotoxicity, enzyme activity, neurotoxicity etc. are currently studied for integration in regulatory risk assessment.
There might not always be a direct link between a non-standard endpoint in an organism and the final effect on the wellbeing of the population. For their use in hazard assessment, all proven or suspected non-standard endpoints will be reflected in the “NS effect” score (see Section 6.2). For integration of non-standard endpoints in the derivation of the Lowest PNEC value, (see Section 6.2.3), only endpoints with a clear link to the wellbeing of the population are taken into account and used together with the data from standard tests. This means that pure biomarkers are not used for deriving the Lowest PNEC. They are considered to have a signalling function only.
5.2.2.1 Recommendations for data gathering
A non-exhaustive list of the available sources for experimental ecotoxicity data is reported in (Annex III, Section 6.4).
Page 17 NORMAN Network http://www.norman-network.net
N° W604002510
5.2.3 Risk indicators
The indicator used for the identification of potential risks in the categorisation process is:
MEC95/Lowest PNEC (i.e. Exceedance of the lowest environmental threshold): this indicator is based on the PEC/PNEC ratio concept, where PEC (Predicted Environmental Concentration) and PNEC (Predicted No-Effect Concentration) correspond in this study to MEC95 and Lowest PNEC, respectively.
The definitions of the parameters:
- Lowest PNEC and
- MEC95
are given in the sections below.
5.2.3.1 Lowest PNEC
In this exercise, Lowest PNEC for a substance refers to the lowest available PNEC value that might be derived on the basis of acute, chronic or non-standard tests (see below) and is intended as a non-legally binding threshold value for the protection of the receptors at risk in, or via, the aquatic environment.
In order to be consistent with the scope of the WFD and its definition of Priority (Hazardous) Substances, both environmental risks to aquatic ecosystems and human health via the aquatic environment are considered in the derivation of the Lowest PNEC. However, the assessment of risks to human health from drinking water will be the responsibility of a sub-group of experts on human health risks which will be launched in 2013.
Lowest PNECs are derived for the water matrix and then converted to the corresponding PNECs, for sediment and biota, depending on the relevance of the substances in those matrices / compartments.
Lowest PNECwater
The general procedure for the derivation of the Lowest PNEC for the water matrix is illustrated in Figure 2.
Page 18 NORMAN Network http://www.norman-network.net
* back-calculated « PNECwater sec pois » and « PNECwater, hh food » expressed in µg/L
Water
Figure 2: Flowchart of the procedure adopted for the derivation of the Lowest PNEC value for water
Based on the available data, different types of PNEC values are used to derive the Lowest PNEC for water:
- Existing EQS: Environmental Quality Standards already available at the national level in at least one country or at the European level (to be used under the conditions described in Section “Recommendations for data gathering”, paragraph 4).
- “PNECL(E)C50_AF”: Predicted No-Effect Concentration derived from available experimental aquatic acute test data. PNECL(E)C50_AF is derived using at least one short-term EC50 or LC50 from each of the three trophic levels, plus a safety factor of 1000 applied to the lowest value, in line with the EC TGD-EQS Guidance (EU Commission, 2011)3.
- “P-PNEC”: Provisional Predicted No-Effect Concentration derived from QSARs. Where experimental data are missing, acute toxicity data are systematically predicted using read-across models based on the kNN (k Nearest Neighbours) read-across methodology developed by Schüürmann (2011) (Kühne, R. et al., 2013) (see Annex III, Section 6.5);
- “PNECNOEC_AF”: Predicted No-Effect Concentration derived from available experimental chronic data from standard- and non-standard endpoints, such as endocrine disrupting effects, neurotoxicity, immunotoxicity etc. (see also Section 5.2.2). PNECNOEC_AF is derived from the lowest NOEC value divided by a safety factor of 100, in line with the minimum requirements of the EC TGD-EQS Guidance (EU Commission, 2011)4. This increased safety factor is applied to chronic data in order to better consider indirect effects;
3 In the EC TGD-EQS Guidance it is stated that a safety factor of 1000 must be applied when only one short-term L(E)C50 from each of three trophic levels (fish, invertebrates [preferred Daphnia] and algae) is available. 4 In the EC TGD-EQS Guidance it is stated that a safety factor of 100 must be applied when only one long-term EC10 or NOEC (either fish or Daphnia) is available.
Page 19 NORMAN Network http://www.norman-network.net
N° W604002510
- “PNECbiota sec_pois”: Predicted No-Effect Concentration for secondary poisoning of predators (e.g. mammals or birds) from eating contaminated prey;
- “PNECbiota, hh food”: Predicted No-Effect Concentration for human health via the consumption of fishery products;
- “PNECdw”: Predicted No-Effect Concentration for human health via the consumption of drinking water. The procedure for assessment of risks to human health from drinking water will be set by a sub-group of experts on human health.
Lowest PNECsed
PNECsed5 values are derived from the Lowest PNECwater using the equilibrium partitioning
Kpsed (partition coefficient solid-water in sediment)
PNECsed ww = PNECsed wet weight (µg.kg-1)
PNECwater (µg.l-1)
Fair-sed (volume fraction air in sediment) = negligible (and thus Fair-sed * Kair-water = negligible)
Fwater-sed (volume fraction of water in sediment) = 0.8 (m3.m-3)
Fsolid-sed (volume fraction of solids in sediment) = 0.2 (m3.m-3)
Foc sed = 0.05 (kg oc.kg solid -1)
RHOsed (density of the sediment) = 1300 (kg.m-3)
RHOsolid (density of the solid phase) = 2500 kg solid * msolid -3
2.6 = conversion factor from concentration in sediment wet weight to concentration in sediment dry weight
It is important to stress that these PNEC values for sediment are not derived from ecotoxicity tests for benthic species. They represent the concentration of a given contaminant in sediment, equivalent to its concentration in the water column when the system is at the equilibrium. The EqP approach estimates which proportion of the substance is adsorbed on the solid phase of the sediment and which proportion is dissolved in the pore water under equilibrium conditions, normalised against total organic carbon (TOC). Adsorption is predicted from the Koc parameter using the minimum Koc value, among the range of available Koc values, in order to consider the most conservative scenario.
5 PNECsed are derived (for contaminants that are relevant in this matrix) in order to allow alternative monitoring of sediment when, for example, the PNEC in the water matrix cannot be measured with sufficient sensitivity.
Page 20 NORMAN Network http://www.norman-network.net
N° W604002510
In general, substances with an organic carbon adsorption coefficient (Koc) of <500–1000 l·kg–1 are not likely to be sorbed to sediment. Consequently, a log Koc or log Kow of ≥3 is used as a trigger value for sediment effects assessment, as stated in EC TGD-EQS Guidance (EU Commission, 2011). Therefore, a PNECsed value should usually be calculated only if log Koc or log Kow is ≥3 for a substance, otherwise this should be stated in the data sheet.
Lowest PNECbiota
PNECbiota6 values are derived using the bioconcentration factor (BCF) approach according
The PNEC values for biota represent the concentration of a given contaminant that accumulates in the biota, equivalent to its concentration in the water column when the system is at the equilibrium.
Recommendations for data gathering
1. Guidance on available sources for collection of experimental and modelled ecotoxicity data is given in Annex III, Section 6.4 and 6.5, respectively.
2. Data from tests that are performed under non-standard conditions (i.e. which do not completely follow the conditions described in the standard test protocol) may be included in the derivation of PNEC values after checking their relevance and reliability (see Annex III, Section 7 for guidance).
3. Besides PNEC values derived by the NORMAN expert group on ecotoxicity data, PNECs can also be collected from other sources, such as PNECs derived during the COMMPS (Fraunhofer Institute, 1999) or the INERIS (INERIS, IOW, 2009) prioritisation studies for the revision of the list of Priority Substances under the WFD or from literature reviews.
4. Background information supporting existing EQS values should be collected before use of these EQSs: new data might have become available and/or non-traditional endpoints might not have been taken into account. Moreover, EQS values can be based on either ecosystem health or human health. Hence the key studies and the assessment factors applied for the derivation of the existing EQSs should always be known in order to allow comparison with other available PNEC values and judgment about their relevance and reliability. It should also be noted that only the EQSs based on experimental toxicological data should be considered (e.g. existing EQSs derived from the 0.1 μg/l precautionary threshold value, applied for pesticides in drinking water, should not be taken into account for the derivation of the Lowest PNEC).
Explanations for data treatment
1. The selection of the Lowest PNEC for the water matrix is based on comparison of all the PNECs and existing EQS values mentioned above, but it should be noted that the Lowest PNEC is not simply based on the selection of the lowest value as such. The
6 PNECbiota are derived (for contaminants that are relevant in the biota matrix) in order to allow alternative monitoring of biota when, for example, the PNEC in the water matrix cannot be measured with sufficient sensitivity
Page 21 NORMAN Network http://www.norman-network.net
N° W604002510
derivation of the Lowest PNEC requires expert judgement of multiple criteria, including, among others, the relevance and reliability of the key study on which each PNEC is based. Guidance on criteria for judging relevance and reliability of the key studies is given in Annex III, Section 7.
2. In general, chronic data should be preferred over acute data, which should be preferred over modelled data. To avoid an underestimation of risks due to low assessment factors for chronic data, however the respective PNECNOEC_AF are compared to the PNECL(E)C50_AF or P-PNEC and, on a precautionary basis, the lowest value may be used for the hazard assessment, instead of preferring chronic over acute data per se (EU Commission, 2011).
This approach can be recommended on the basis of the following research findings:
- In a recent study (von der Ohe, 2011), 50% of the Lowest PNECs were based on the chronic PNECNOEC_AF data, even though a safety factor of 1000 was used for the respective acute-based PNECL(E)C50_AF .
- There is evidence that acute-based thresholds (PNECL(E)C50_AF) – using an AF of 1000 – correspond well with observed effect levels in field communities, when considering benthic invertebrates (Liess & von der Ohe, 2005) ; (Rasmussen & Wiberg-Larsen, 2012) ; (Schafer, R. B., T. Caquet, et al., 2007); (Schafer, R. B., V. Pettigrove, et al. , 2011); (von der Ohe, 2011).
- Compliance with a respective safety factor of 1000 should ensure only minor departures from reference conditions, as indicated in the publication by (Schafer, R. B., P. von der Ohe, et al. , 2012).
- The results of the study (von der Ohe, 2011) indicate that the EQS based on chronic or mesocosm data – with very low AFs (i.e. much higher than 1/1000 of the acute L(E)C50) – are most likely not protective in all cases.
3. Lowest PNEC values which appear as extremely low should be flagged, in particular when they result from the application of high assessment factors. In these cases, improvement of the ecotoxicity data used to derive the PNEC is desirable.
4. The final selection of the Lowest PNEC should in any case be explained and justified in the Substance Factsheet, where all exposure and effect data are collected. These Substance Factsheets will be regularly updated on the NORMAN website for use by all interested parties.
5.2.3.2 MEC95
The maximum concentration observed at a given site is referred to as measured Maximum Environmental Concentration (MEC). More specifically:
- MECsite refers to the measured Maximum Environmental Concentration at one site.
- MEC95 refers to the 95th percentile of all MECsite values, taking into account that data with real concentrations for at least 20 sites are needed for calculation of a MEC95 with acceptable confidence.
- MECsite_max refers to the measured Maximum Environmental Concentration among all sites with recent measurements (i.e. last 6 years). For substances that are sufficiently monitored (i.e. more than 4 countries and more than 100 sites) with satisfactory analytical performance (i.e. all LOQ values are below the Lowest PNEC), but for which there are less than 20 sites with measurements above LOQ (i.e. for most sites the concentration levels are below the LOQ), the MECsite_max value can be used to replace MEC95 in the calculation of the risk ratio. This is done in order to identify whether there is still a possible risk of exceedance of the Lowest PNEC at local level.
Page 22 NORMAN Network http://www.norman-network.net
N° W604002510
The justification for considering the maximum concentrations for exposure assessment at each site is to avoid underestimating the risks associated with substances released intermittently (e.g. pesticides), which have rather short-term peaks, as compared to average concentration values. As the general sampling procedure consists of monthly grab samples, an annual or quarterly average of these measurements cannot be seen as an appropriate representation of the real exposure situation. Concentrations are known to fluctuate much more, which means that even the maximum annual grab sample is highly unlikely to represent the maximum exposure situation, which is expected to have effects on the aquatic communities as shown in the publications by (Liess & von der Ohe, 2005); (Schafer, R. B., T. Caquet, et al., 2007); (Schafer, R. B., V. Pettigrove, et al. , 2011); (von der Ohe, 2011); (Rasmussen & Wiberg-Larsen, 2012) ; (Schafer, R. B., P. von der Ohe, et al. , 2012). The maximum concentration can also be used for substances with continuous exposure patterns, as a conservative approach. The maximum is often between 2- and 10-fold higher than the annual average in surface water. For emerging substances there are usually not enough data available to calculate a reliable annual average. Moreover, the use of the maximum concentration values avoids the uncertainty associated with the integration of “less than” values (i.e. non-quantified monitoring data <LOQ) in the calculation of the PEC and allows the identification of a potential risk at each site in a worst case scenario. Finally, the 95th percentile of the maximum concentrations at each site (MEC95) is preferred here, instead of the 90th percentile of the average concentrations (used in the DG ENV prioritisation exercises published by Fraunhofer Institute (1999) and INERIS, IOW (2009) for revision of the list of Priority Substances), because the 95th percentile allows for a more conservative approach to the identification of a potential risk.
Recommendations for data gathering
As already explained in other parts of this document, monitoring data need to be available as raw data in order to allow the derivation of MECsite, MEC95 and MECsite_max. The NORMAN EMPODAT database (www.norman-network.net >> Databases >> EMPODAT) is recommended as a source of exposure data on emerging substances (see Annex III, Section 1), but other available datasets can also be used for this purpose.
Explanations for data treatment
1. As regards the timeline, two different sets of MECsite and MEC95 are derived:
- MECsite/NEW, MECsite_max/NEW and MEC95/NEW are based on the most recent data: from the last 6 years;
- MECsite/OLD, MECsite_max/OLD and MEC95/OLD are based on the older data: before the last 6 years.
NOTE:
In the categorisation process, however, only the most recent data are considered for calculation of MEC95, MECsite and MECsite_max (i.e. only MECsite/NEW, MEC95/NEW and MECsite_max/NEW data are used).
2. MECsite, MECsite_max and MEC95 values need to be calculated for each combination matrix / fraction analysed, since concentration data in different fractions cannot be
Page 23 NORMAN Network http://www.norman-network.net
N° W604002510
directly compared. As a result, MECsite, MECsite_max and MEC95 values can be derived for each combination matrix / fraction analysed7, based on the available data, i.e.:
For the calculation of the MEC95/Lowest PNEC ratio in the respective relevant matrix(ces) and fraction(s) analysed, MECsite , MECsite_max and MEC95 values are derived for each substance, as illustrated in the table below.
Table 4: Procedure for calculation of MECsite and MEC95 for each substance in the relevant matrix
3. If wastewater concentration data are available, it is accepted that they can be used in
the categorisation exercise, provided that they are divided by a factor of 10 (which is considered as a standard dilution factor).
4. For the calculation of the overall MEC95/Lowest PNEC ratio for a given substance (i.e.
identification of a potential risk of exceedance of the Lowest PNEC in the categorisation process) the following rules are applied:
7 MEC95 and MECsite values still depend on the chosen aggregation scenario (see Annex I, Section 3). For
example, one scenario could consist of aggregating, for a given combination matrix / fraction analysed, all datasets from all types of waters (river, lake, wastewater, marine); a second scenario could consist of aggregating only the datasets for fresh waters (river, lake and wastewater), i.e. no marine waters. 8 Whole water is considered here as the preferred fraction for organics for derivation of MECsite and MEC95 values. This is in line with the WFD and the 2008/105/EC Directive (“EQS Directive”) which requires that concentration of organics in water should be measured in the whole water fraction. However, given that the practices of the laboratories are not fully harmonised and the provided metadata are often not exhaustive enough to allow a clear differentiation of the results between “whole water” and “filtered water” fractions, data measured in filtered water can be accepted – for organic compounds, too – for derivation of MECsite and MEC95.
Page 24 NORMAN Network http://www.norman-network.net
N° W604002510
- For water – organics:
MEC95/Lowest PNECwater = MEC95 water/Lowest PNECwater - For sediment:
MEC95/Lowest PNECbiota = MAX {MEC95 biota fish/Lowest PNEC ;MEC95
biota_inver/Lowest PNEC }
5.3 Decision tree for allocation of substances to the action categories
The process of categorisation of the substances into the identified six action categories is presented here and can be illustrated with the help of the flowchart in Figure 3.
The details of the specific queries in the decision tree for allocation of the substances to the action categories are described below.
As a first step, compounds are assessed according to the availability of occurrence data and, hence, evidence of exposure. The indicators proposed for this assessment are: the availability of monitoring data in at least 4 countries and 100 sites, plus the availability of exposure data above the limit of quantification (at least 20 sites > LOQ).
An additional condition must be met: the compound must be analysed in the correct matrix (as defined on the basis of its physico-chemical properties, i.e. Koc, Kow and water solubility data and the results of fugacity models (refer to Annex I, Section 2 for details). By doing so, three groups are generated which differentiate with regard to clear evidence of exposure (Figure 3):
- Substances that are sufficiently monitored and sufficiently quantified in the relevant matrix;
- Substances that are sufficiently monitored in the relevant matrix, but with a low level of quantification;
- Substances that are insufficiently monitored OR “never monitored” (i.e. insufficient or no data are available in the EMPODAT database) OR the only monitoring data available correspond to a “non-relevant matrix”.
The two sub-groups on the left side of the decision tree (i.e. Substances that are sufficiently monitored in the relevant matrix, but with a low level of quantification and Substances that are insufficiently monitored OR which have been monitored in a matrix that is considered as a “non-relevant matrix”) are characterised by a lack of evidence of exposure, while the third group (Substances that are sufficiently monitored and sufficiently quantified in the relevant matrix) consists of compounds for which there are sufficient data to indicate environmental exposure.
The latter group is further split into new groups based on the availability of sufficient effect data for PNEC derivation. Those compounds which do not comply with this requirement (i.e. insufficient experimental data for PNEC derivation) fall into Category 3. For compounds in this category, a rigorous hazard assessment is recommended in view of the derivation of robust environmental thresholds.
Page 25 NORMAN Network http://www.norman-network.net
N° W604002510
In turn, the substances for which there are sufficient data for PNEC derivation can be allocated to Category 1 OR Category 6, depending on the identification of a potential risk, calculated as the ratio of the exposure level (MEC95) and the effect level (Lowest PNEC).
A MEC95/Lowest PNEC ratio above 1 would trigger the substance‟s classification into Category 1: these compounds should be included in the list of river basin-specific pollutants according to Annex VIII of the WFD and / or should be part of the candidate substances for the revision of the list of Priority Substances (PS) at EU level according to Article 6 of the WFD.
A MEC95/PNEC ratio below 1, in turn, would lead to the conclusion that the exposure does not pose any threat to ecosystems at the observed concentrations: these compounds form Category 6. For these chemicals, monitoring efforts could be reduced, unless studies on non-standard endpoints (e.g. behavioural changes) show evidence of effects, in which case they would go back to Category 3 for further assessment.
Going back to the first two groups at the beginning of the decision tree, these compounds, for which the available data are not sufficient to draw conclusions on the level of exposure, are submitted to further steps of evaluation of the knowledge gaps.
For substances that are sufficiently monitored in the relevant matrix, but with a low level of quantification, the first step consists of checking the adequacy of the analytical performance of the available monitoring data.
For compounds for which analytical methods show sufficient performance (i.e. the LOQmax is below the Lowest PNEC) it is necessary to check whether there are sufficient experimental ecotoxicity data for EQS derivation. If the answer is positive, then they are submitted to risk assessment (MEC95/Lowest PNEC ratios below or above 1) to define whether there is a possible risk for these substances at local level (which will lead the substance to either Category 1 or Category 6, depending on the result of this assessment). If, on the contrary, the answer is negative, then the substances will be allocated to Category 3.
One specific case is represented by compounds for which available monitoring data are always below the LOQ, and for which analytical performance is sufficient (i.e. LOQmax <Lowest PNEC). In order to fall under this specific case it is recommended that a high number of sites (> 200) and high number of analytical measurements (> 10000) are available. If these conditions are satisfied and there are sufficient experimental ecotoxicity data to derive an EQS, then these compounds should be allocated to Category 6 (i.e. sufficient evidence that exposure does not pose a hazard to ecosystems unless knowledge of non-standard relevant endpoints is brought forward). In turn, compounds for which the analytical methods show insufficient performance, for all data available in the database, fall into Category 4: for these chemicals analytical methods have to be improved before an assessment of the real risk of the substance is possible. Information in the scientific literature showing the availability of analytical methods with sufficiently low LOQs can, however, allow these compounds to be considered for Category 2 (screening studies). Compounds for which the analytical performance is sufficient only for a portion of the available data (i.e. only the LOQmin is below the Lowest PNEC) deserve additional monitoring to assess the “real” risk of the substance. They fall into Category 2. For substances that are insufficiently monitored OR “never monitored” (no data are available in the EMPODAT database) OR which have been investigated in a matrix that is considered as a “not relevant matrix”) similarly to the group above, additional monitoring
Page 26 NORMAN Network http://www.norman-network.net
N° W604002510
data are needed before conclusions can be drawn about the exposure level and associated risk for these substances.
These compounds will be allocated to Category 2 or to Category 4, depending on the adequacy of the analytical performance of the available monitoring data (for substances for which data, although insufficient, are available in the database) AND / OR the availability of appropriate analytical methods (information retrieved from the literature when monitoring data in the database are insufficient or not available).
Finally, Category 5 represents a sub-group of Category 2. Compounds that deserve further environmental monitoring and / or improved analytical methods but for which experimental effect data are insufficient for hazard assessment comprise Category 5: for these compounds, further exposure data and a rigorous effect assessment are required before final conclusions can be drawn.
Page 27 NORMAN Network http://www.norman-network.net
N° W604002510
LIST OF EMERGING SUBSTANCES
(NORMAN list)
Risk of exceedance of the
Lowest PNEC ?
yes
Suff. monitored. & quantif. in
relevant matrix
Suff. monitored but low
frequency of quantificationInsuff. (or never) monitored OR
monitored in not relevant matrix
Sufficient experimental data for
hazard assesment?
Sufficient experimental data for
hazard assesment?
yes
yes
LOQmin (EMPODAT) OR
LOQ expert labs < PNEC ?
LOQmax< PNEC (existing
data in EMPODAT)?
no
Cat. 2:
Watch list
Cat. 3:
Action (eco)tox
no
Cat. 6:
Non-priorityfor regularmonitoring
Cat. 4:
Action analytical
no
noyes
Cat. 1:
Priorityregular
monitoring
yesno
Cat. 5 Novel end points
≥ 4 countries AND ≥ 100 sites with analysis
≥ 20 sites analysis > LOQ in the relevant matrix(ces) +
Recent data (last 6 years) ?
Figure 3: Complete flow chart of the procedure for classification of emerging substances into six action categories (Cat.). For details about the six categories, please refer to Table 1. The starting point is represented by the different sources of data from environmental observations.
The overall list of queries and cut-off values applied for the allocation of the candidate substances to the six action categories is also illustrated in Table 5 and Table 6. These queries are programmed into the NORMAN EMPODAT database. This allows easy updating of the categorisation and subsequent prioritisation of the substances in the event of inclusion of new substances or new data in the database. Indeed, the results need to be exported at each update in order to allow for a critical expert review. It can be seen that each category has been split into two or more sub-categories. This is in line with the structure of the decision tree, where it appears that different pathways are possible to reach the same category, as illustrated in Figure 4. This split within the same category is not meant to create new action categories, but only to provide further details for interpretation of the results of the categorisation process for the individual substances.
Page 28 NORMAN Network http://www.norman-network.net
N° W604002510
Table 5: Details of the features of the identified action categories
Category
Description
1 1A Sufficiently monitored and sufficiently quantified substances for which a risk is identified
1B Sufficiently monitored substances, with a low level of quantification, but for which a risk is identified at the local level (i.e. MECsite_max > Lowest PNEC)
2 2A
Insufficiently monitored substances for which further monitoring data are needed
2B Sufficiently monitored substances, with a low level of quantification, for which further monitoring data are needed and for which a part of the non-quantified data has LOQs that are lower than the Lowest PNEC
2F No occurrence data are available in EMPODAT (or other datasets) but the literature data show that the LOQs associated with existing analytical methods are lower than the Lowest PNEC
3 3 Sufficiently monitored and sufficiently quantified substances for which there are insufficient experimental ecotoxicity data for hazard assessment
4 4A Insufficiently monitored substances for which analytical methods need to be improved (LOQs associated with current analytical methods are above the Lowest PNEC)
4B Sufficiently monitored substances, with low level of quantification, for which analytical methods need to be improved (LOQs associated with current analytical methods are above the Lowest PNEC)
4F No monitoring data are available in EMPODAT (or other datasets) and no LOQ data retrieved from the literature to define whether existing analytical methods are compatible or not with the Lowest PNEC, OR Monitoring data available in EMPODAT show that the LOQs associated with the available data are above the Lowest PNEC BUT no LOQ data have been retrieved from the literature to define whether the LOQs associated with current analytical methods are above or below the Lowest PNEC
5 5A Insufficiently monitored substances for which analytical methods compatible with the Lowest PNEC are available, but there is no hard evidence of potential effects on ecosystems (i.e. insufficient experimental effect data for the derivation of PNEC / EQS)
5B Sufficiently monitored substances, with a low frequency of quantification, for which analytical methods compatible with the Lowest PNEC are available, but further monitoring and effect data are needed. Further monitoring is needed because a part of the LOQs, associated with the non-quantified measurements, are above the Lowest PNEC. Moreover, there is no hard evidence of potential effects on ecosystems (i.e. insufficient experimental effect data are available for hazard assessment)
5F No occurrence data are available in EMPODAT (or other datasets) but the literature data show that the LOQs associated with existing analytical methods are lower than the Lowest PNEC. Compared to category 2F, for substances in category 5F there is no hard evidence of potential effects on ecosystems (i.e. insufficient experimental effect data are available for hazard assessment)
6 6A Sufficiently monitored and sufficiently quantified substances for which no risk is identified
6B Sufficiently monitored substances, with low level of quantification, for which the LOQs associated with the non-quantified data are lower than the Lowest PNEC AND no risk is identified (either at wide or at local level i.e. MECsite_max < Lowest PNEC)
Page 29 NORMAN Network http://www.norman-network.net
N° W604002510
LIST OF EMERGING SUBSTANCES
(NORMAN list)
Risk of exceedance of the
Lowest PNEC ?
yes
Suff. monitored. & quantif. in
relevant matrix
Suff. monitored but low
frequency of quantificationInsuff. (or never) monitored OR
monitored in not relevant matrix
Sufficient experimental data for
hazard assesment?
Sufficient experimental data for
hazard assesment?
yes
yes
LOQmin (EMPODAT) OR
LOQ expert labs < PNEC ?
LOQmax< PNEC (existing
data in EMPODAT)?
no
Cat. 2:
Watch list
Cat. 3:
Action (eco)tox
no
Cat. 6:
Non-priorityfor regularmonitoring
Cat. 4:
Action analytical
no
no
yes Cat. 1:
Priorityregular
monitoring
yesno
Novel end points
≥ 4 countries AND ≥ 100 sites with analysis
≥ 20 sites analysis > LOQ in the relevant matrix(ces) +
Recent data (last 6 years) ?
1B 6B2B 4B 6A31A
1A 6A
3
1A1B6A4A 4B
5A 5B2B2A
2B2A
2B 4B
2A 5A
4A
6B
1B
1B
4F
2F
Cat. 5
Figure 4: Complete flow chart of the procedure for classification of emerging substances into six action categories (Cat.). The scheme also provides a detailed illustration of the different possible pathways to reach the given categories. For details about the six categories, please refer to Table 1.
Page 30 NORMAN Network http://www.norman-network.net
Association N° W604002510
Table 6: List of indicators and cut-off values applied for the allocation of the candidate substances to action categories 1 to 6
Yes Yes9 - - No data - - - No data - - No data No No9
9 For Category 1B and Category 6B, MECsite_max is used instead of MEC95 to calculate the risk ratio
Page 31 NORMAN Network http://www.norman-network.net
Association N° W604002510
6 Ranking within each action category
This section describes the procedure for ranking the substances within each action category. First the prioritisation indicators are described and recommendations about the data to be collected are provided. Then the rules for application of a score to each indicator and calculation of the final score are explained. The categorisation and prioritisation algorithm are built into the NORMAN EMPODAT database, enabling automated prioritisation of emerging substances within the various categories, but can also be applied manually to other datasets. The final results of the categorisation and prioritisation should be exported into an Excel table or equivalent software. In this way they can be checked “manually” by experts for plausibility.
6.1 Indicators for evaluation of the level of priority within each action category
Specific indicators are adopted for ranking of substances within each action category. The list of indicators for the ranking process is presented in Table 7 and explained below. There are indicators related to Exposure Assessment, Hazard Assessment and Risk Assessment. NOTE:
- Some of the indicators listed below have already been applied in the previous categorisation phase. They are also used for prioritisation and they are highlighted in the notes below;
- Since the objectives differ from one category to another, the prioritisation indicators may differ from one category to another as well (e.g. Category 4 identifies substances for which there is a need to improve analytical performance, while Category 3 identifies substances for which there is a need to perform toxicity tests; the prioritisation indicators for each category should be defined accordingly);
- As soon as data for new indicators become available, they might be included in the methodology (based on a WG decision).
6.1.1 Exposure (monitoring data)
A) Frequency of quantification (i.e. frequency of observations > LOQ): Besides the mere presence of a substance in one or more countries (or different matrices), the number of positive observations compared to the total number of measurements (samples) for each matrix is a good indicator for the assessment of the potential temporal and spatial exposure.
B) Number of countries with positive measurements (>LOQ): This indicator reflects the geographical spread of the interest in an emerging compound and the spatial distribution of the potential hazard at the European level. For an application of the prioritisation methodology at the level of a single country, this indicator can be replaced by the number of river basins with positive observations.
Page 32 NORMAN Network http://www.norman-network.net
N° W604002510
C) Number of sites with positive measurements? (>LOQ): This indicator has already been applied in the previous categorisation phase (> 20 sites) and it is re-proposed here as an indicator of the spatial distribution of the potential hazard. Compounds that are found at many sites are in general of higher potential concern.
D) Concentration trend: For some compounds that have been measured for a long time (> 5 years), it might be possible to assess a trend (i.e. concentrations increase, stay the same or decrease). In the case of a significantly increasing trend, a higher priority might be justified. For this purpose, for each compound we propose to calculate the 95th percentile of the maximum concentrations (at each site) per year (MEC95a) and analyse potential trends in the concentration development. By doing so, we want to make sure that compounds with intermittent release (i.e. pesticides) are appropriately considered. We also require that only sites which have data for at least five years are used for the calculation, so that sites for which the compound has been rarely measured do not bias the trend. To allow for a relatively representative average, at least six sites are required. The MEC95a for each year are then used as the response variable in a correlation, with the years as factors. Only significant correlations (p < 0.05) are considered to have a “real” trend and are used for the prioritisation. However, all correlation plots need to be inspected visually to account for outlier concentrations in certain years or single low concentrations in final years. By checking for outliers, some compounds will show a significant trend, while for others the trends may disappear, and the compounds will not be used for this indicator.
E) Observations in groundwater (Yes / No): If a compound has already been found in groundwater, this would raise particular concern. For this reason, evidence of occurrence of the substance in groundwater is taken into account as an additional indicator of exposure.
6.1.2 Exposure (usage data)
F) Production volume / Use: Substances that are produced, transported and used in very high quantities are obviously more likely to end up in the environment (e.g. by accident) than those with low production volumes.
G) Usage pattern: Besides the information about production volumes, the way a substance is used is also relevant for the potential hazard it might present. For example, pesticides that are deliberately put into the environment pose a high risk of diffuse input via run-off or spray-drift, and get a high score. As a second example, pharmaceuticals are used in relatively lower quantities but they are mainly released via municipal treatment plants, which results in local risks from point sources. The following types of use patterns are considered:
- Controlled system – isolated intermediate, no direct release to the environment (e.g. substances that are used in industry but in a controlled process without direct release to the environment);
- Non-dispersive use – small number of releases to the environment – e.g. used at industrial or other identifiable sites resulting in controlled point source emission, local releases to the environment;
- Wide dispersive use – many mainly diffuse source releases to the environment (e.g. substances present in personal care products, pharmaceuticals, etc. and which are regularly discharged to the environment via WWTP);
Page 33 NORMAN Network http://www.norman-network.net
N° W604002510
- Used in the environment – batch releases within the environment (e.g. pesticides).
6.1.3 Hazardous properties
H) PBT / vPvB criteria: Substances that are Persistent, Bioaccumulative and Toxic (PBT) or very Persistent and very Bioaccumulative (vPvB) pose an additional risk to the environment. Besides their toxicity, they can remain present in the environment for a long time and / or, once they are in the environment, they can quickly accumulate in biota. The first source of information for the allocation of a substance as PBT, or vPvB is its classification as a PBT, or vPvB compound in the international conventions and legislation (Stockholm Convention, Aarhus Convention – UNECE and Annex XIII10 of the REACH Regulation No 1907/2006). Any new development / revision in the PBT criteria should be taken into account. In addition to this, the P, B and T criteria should be assessed individually in order to identify substances with PBT or vPvB potential, even if they are not classified as PBT/vPvB compounds in the international lists. For all compounds, half-life data in water and in sediment, bioaccumulation data (BCF) and Lowest PNEC values should be compared with the cut-off values defined under Annex XIII of REACH (European Commission, 2011)11 as illustrated in Annex II, Section 1. For this assessment, experimental data, when available, plus estimated data based on QSAR models, should be compiled from available sources (see Annex III, Section 6.1).
I) Potential for Long Range Air Transport (LRAT): Evidence for long-range transport and
deposition is taken into consideration as a prioritisation indicator. The parameters that are commonly applied to screen substances for Long-Range Transport and Deposition Potential are the atmospheric oxidation (AO) t1/2, which identifies the potential for a substance to undergo long-range transport12 and the Henry‟s Law constant (H)13 or the air-water partition coefficient (log Kaw), which describe the solubility of a substance in air and water and may therefore be used to estimate the potential for the substance to partition from the atmosphere to the biosphere in remote areas. The UNECE POP Protocol under the LRTAP Convention (UNECE, 1998) defines t1/2 > 2 days and vapour pressure (VP) < 1000 Pa or monitoring data as threshold values for assessment of substances with potential for long-range transboundary air pollution. The same criteria are adopted here for calculation of the LRAT indicator.
J) Non standard endpoints: The presence of novel effects should be taken into
consideration in the prioritisation process (see Section 5.2.2). K) Carcinogenicity, Mutagenicity and Reprotoxicity (CMR) properties: CMRs are
substances that are Carcinogenic, Mutagenic, or toxic to Reproduction and which therefore have inherent properties that can cause cancer, alter DNA or damage reproductive systems. These properties correspond to article 57 a-c of REACH. The classification of a substance as carcinogenic, mutagenic or reprotoxic under the EU
10 A revised version of Annex XIII was published in the Official Journal of the European Union in March 2011 (European Commission, 2011) 11 The criteria and the cut-off values defined in REACh and main existing regulations are used here as a reference for the assessment of the PBT criteria. However, it is acknowledged that recent research studies propose alternative innovative approaches for holistic screening of substances for their potential environmental persistence and bioaccumulation in the food chain (Arnot & Mackay, 2008), (RIVM, 2011). 12 Atmospheric oxidation is considered primarily for practical reasons. In reality both chemical transformation and physical removal (wet and dry deposition) should be considered when assessing atmospheric half-life. 13 The Henry‟s Law constant (H) is the ratio of the substance‟s solubility in air (which is represented by the vapor pressure) to the substance‟s solubility in water. The potential for a substance to partition from air to water decreases with increasing H.
Page 34 NORMAN Network http://www.norman-network.net
N° W604002510
Regulation on Classification, Labelling and Packaging (EC, CLP, 2008) or the other international classification systems (USEPA, IARC) is used here as an indicator of toxicity to human health.
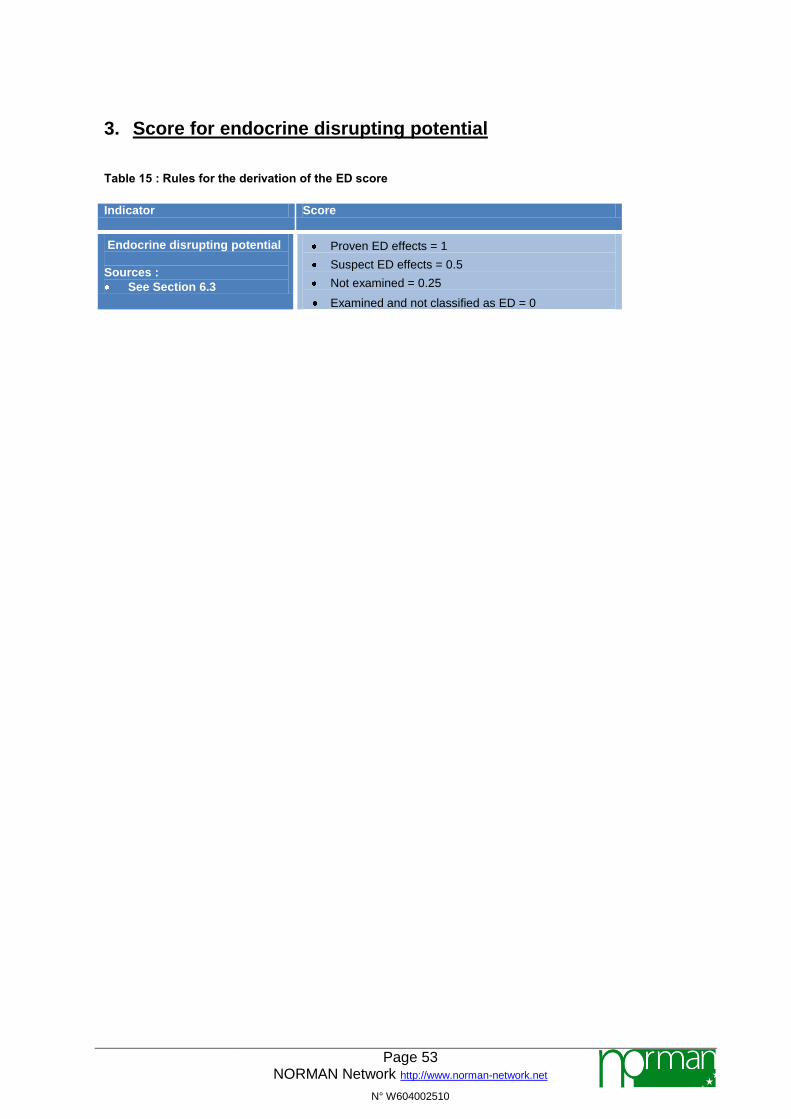
L) Potential for Endocrine disrupting effects (ED): Evidence of endocrine disrupting
effects14 for the candidate substances is taken into consideration in the final score. Substances identified as endocrine disruptors or suspected of having endocrine disrupting potential should be checked via the sources identified in Section 6.3. Any new development / revision in the assessment of ED properties should be taken into account.
6.1.4 Risk
Two main indicators are applied to decide which compounds have the highest priority in terms of potential risk according to the data available: M) Spatial Frequency of exceedance of the Lowest PNEC, to address the spatial aspect of
exposure N) Extent of exceedance of the Lowest PNEC, to address the intensity of impacts15. The two indicators are based on measured Maximum Environmental Concentrations (MEC), rather than the commonly used statistically-based averages (Predicted Environmental Concentration, PEC), and compared to the Lowest PNEC.
M) Spatial Frequency of Exceedance of the Lowest PNEC = n / N where:
- n is the number of sites with MECsite/Lowest PNEC ratios above 1
- N is the total number of sites with analytical measurements for the respective compound.
This first indicator (M) considers the spatial distribution of potential effects of a certain compound, i.e. the frequency of sites with observations above a certain effect threshold. For the calculation of this indicator, the compound‟s maximum observed concentration at each site (MECsite) is compared to the Lowest PNEC. Subsequently, the number of sites where the threshold was exceeded is divided by the total number of sites where the respective compound was monitored. This index can be applied irrespective of the number of sites with concentration above the LOQ. The resulting value indicates the share of sites where potential effects are expected and lies between 0 and 1. These values can therefore be used directly for the overall prioritisation.
N) Extent of Exceedance of the Lowest PNEC = MEC95 / Lowest PNEC
The second indicator (N) ranks compounds with regard to the extent of the expected effects. While the previous indicator considers that some compounds might be widely distributed, it may overlook the fact that some of these chemicals occur only
14 Endocrine disrupting effects can be considered to be part of “Non standard endpoints”. However, they are kept as separate components of the final score in the present prioritisation algorithm 15 This indicator was already applied in the previous categorisation phase
Page 35 NORMAN Network http://www.norman-network.net
N° W604002510
in rather low concentrations close to their effect threshold. These compounds might be still of concern, but with regard to local impacts (i.e. effects on the ecological status), other compounds might be much more relevant. In this way, compounds that have a somewhat narrower spatial distribution might reveal their “local importance”.
For this reason the ratio of the 95th percentile of all MECsite values per compound (MEC95) is calculated and divided by the Lowest PNEC. NOTE: At least 20 sites with analysis above the LOQ are required to calculate the MEC95.
The resulting hazard ratio is then scaled from 0 to 1: exceedances greater than 1 but below 10 are assigned 0.1 points, while compounds exceeding 10 but staying below 100 are assigned 0.2 points. Substances with MEC95 exceeding the Lowest PNEC by a factor of more than 100 but below 1000 are assigned 0.5 points, while substances with exceedances greater than 1000 receive 1 point. As regards the timeline, different sets of MECsite and MEC95 are derived: - MECsite/NEW and MEC95/NEW, based on the most recent data from the last 6 years
- MECsite/ALL YEARS and MEC95/ALL YEARS, based on all data (recent + old data) MECsite/NEW and MEC95/NEW are used for ranking substances under Categories 1, 3 and 6. MECsite/ALL YEARS and MEC95/ALL YEARS (all data) are used for ranking substances in Categories 2, 4 and 5.
Recommendations for identification of data sources and rules for data preference for all the above-mentioned indicators are provided in Annex III. The rules for derivation of the scores for the prioritisation indicators described in this section are reported in Annex II. The final score for each substance is then derived on the basis of the scoring system presented in Section 6.2.
6.2 Prioritisation algorithm (scoring system)
As explained earlier, a specific set of indicators can be defined for each action category, in order to address the peculiarities of each category concerning differences in knowledge gaps / data availability, etc. This is also to avoid indicators which might not be available for “most” substances, introducing bias into the results. In the final ranking, three main components can be applied: 1. The exposure score (sum of “observed exposure” – based on monitoring data – and
“predicted exposure” – based on production data and use pattern);
2. The hazardous properties score (sum of PBT, CMR, LRAT, ED effects and non-standard effects);
3. The risk of Lowest PNEC exceedance score (sum of Extent of Exceedance and Spatial Frequency of Exceedance of the Lowest PNEC).
Page 36 NORMAN Network http://www.norman-network.net
N° W604002510
The following equations are applied for the calculation of the scores for the above-mentioned components:
(3) Riskscore = [score “Spatial frequency of exceedance” + score “Extent of exceedance”] /2
where:
- Score “Spatial frequency of exceedance”: refer to 6.1.4, equation (M).
- Score “Extent of exceedance”: refer to 6.1.4, equation (N).
All details for the calculation of the individual scores are reported in Table 7 and in Annex II. The final score is calculated on the basis of the following two equations, depending on the type of action category:
Page 37 NORMAN Network http://www.norman-network.net
N° W604002510
- Final score (Cat. 2, 4, 5) = Exposcore (predicted) + Hazard score + Risk score(all = old + new data)
NOTE: Using the equations reported above, each sub-score is normalised to 1 and as a result the final score is a value between 0 and 3, regardless of the type of action category.
Page 38 NORMAN Network http://www.norman-network.net
Association N° W604002510
Table 7 : Prioritisation indicators and corresponding scores and weighting factors by action category
Indicators
Sub-category indicators Value Sub-score Sub- score
Sub-score Final score
Exp
osur
e
Obs
erve
d E
xpos
ure
(m
onito
ring
data
)
A) Frequency of observations with concentration >LOQ
Fraction of analyses >LOQ = value as a decimal number rounded to two decimals
No. of countries with concentr. >LOQ Value between 0 and 1 0 countries (or no data) = 0 ≥1 country = 0.10 ≥ 2 countries = 0.20 ≥ 5 countries = 0.50 ≥ 10 countries = 1
C) N° of sites with concentration >LoQ No. of sites with concentration >LOQ Value between 0 and 1 0 sites (or no data) = 0 ≥1 site = 0.10 ≥ 10 sites = 0.20 ≥ 100 sites = 0.50 ≥ 1000 sites = 1
D) Concentration trend Trend Regression of MEC95/a for > 5 years and > 6 sites
Significant positive trend = 1 Positive trend = 0.5 No trend = 0.25 No data = 0.1 Negative trend = 0
E) Observation in groundwater Yes = 1 No = 0
= value
Pre
dict
ed
Exp
osur
e
(usa
ge)
data
)
F) Annual usage Production in t < 1 t = 0.1 1 -10 t = 0.2 10-100 t = 0.5 >100 t = 1
EXPOpredict = (F+G) / 2
Page 39 NORMAN Network http://www.norman-network.net
N° W604002510
Indicators
Sub-category indicators Value Sub-score Sub- score
Sub-score Final score
G) Use pattern Used in the environment: 1 Wide dispersive use (diffuse sources and substances in urban wastewater) = 0.75 Non-dispersive use (industrial, controlled point sources) = 0.5 Not known = 0.25 Controlled system (isolated intermediate) = 0.1
See Table 9 and Table 10 in Annex II HAZ = (H+I+J+K + L) / 5
HAZ
I) LRAT (long range air transport) Half-life (t1/2) in air >2 days and Vapour Pressure (VP) < 1000 Pa
t1/2 in air >2 days and VP <1000 Pa = 1 t1/2in air ≤2 days and /or VP ≥ 1000 Pa = 0
J)Non-standard endpoints Examples: hatch size
Non standard endpoints present = 1 Under examination = 0.5 Not examined = 0.25 Evaluated and classified not toxic = 0
K) CMR = Max («Carcinogenicity», «Mutagenicity», «Reprotoxicity »)
The CMR final score is then derived as the highest value between the individual carcinogenicity, mutagenicity and reprotoxicity scores.
CMR, category 1 = 1 CMR, category 2 = 0.75 CMR, categorie 3 = 0.5 Under examination = 0.5 Examined and info not suff. = 0.25 Not examined = 0.25 Examined and not classified = 0
L) Endocrine disrupting properties Proven ED = 1 Suspect ED = 0.5 Not examined = 0.25 Not proven ED = 0
Page 40 NORMAN Network http://www.norman-network.net
N° W604002510
Indicators
Sub-category indicators Value Sub-score Sub- score
Sub-score Final score
Ris
k
Spa
tial f
requ
ency
of e
xcee
danc
e
M) Spatial frequency of exceedance of Lowest PNEC
= number of sites where MECsite >Lowest PNEC divided by total number of sites, where the substance was measured –for category 1, 3, 6 (recent data) –for category 2, 4, 5 (all data = all years)
Page 41 NORMAN Network http://www.norman-network.net
Association N° W604002510
7 Data gathering, general remarks
The gathering of data (on occurrence, effects, physico-chemical properties etc.) occurs throughout the whole process of categorisation and prioritisation of the emerging substances on the starting list. The gathering of data is an iterative process that should allow the lists to be updated as better quality data become available. Questions therefore arise about the data collected, particularly in respect of the evaluation of their quality and relevance and the rules to be followed in using them. Generally speaking, because the main objective of this methodology is to identify as soon as possible substances posing a potential risk to the environment, no information is discarded immediately. The adopted strategy prioritises the best use of all the information available with the aim not of assessing the risks per se, but of identifying series of substances for which specific actions need to be taken. The use of already banked data may therefore be accepted without the quality of every dataset being individually evaluated. Moreover, missing measured data can be supplemented by modelled data. It is, nevertheless, important to be able to describe the robustness of the datasets to be able to select, in respect of each prioritisation objective, the level of information required for allocating a substance to a category. The collection and preparation of data therefore inherently leads to methodological decisions which are illustrated at each step of the process (see previous sections). Recommendations for data sources and rules for data preference are also provided in Annex III.
Page 42 NORMAN Network http://www.norman-network.net
N° W604002510
8 Review process and conclusions
The NORMAN prioritisation methodology represents an important step forward in the way emerging substances, for which data are often lacking, may systematically be taken into account in environmental risk assessment and in risk control programmes. Instead of simply ranking all candidate substances against one single prioritisation objective, the NORMAN method combines the ranking process with a prior allocation of the substances into action categories, which allows substances to be managed on the basis of the level of available information and avoids the exclusion of substances for which there are limited data. A number of axes of improvement can, however, still be identified and in this sense the NORMAN scheme has to be regarded as a dynamic process which will be systematically tested and revised. The NORMAN Working Group on Prioritisation has identified the following topics as the main issues for improvement. First of all, the list of emerging substances representing the conventional universe of chemicals to be considered for prioritisation needs to be regularly and systematically reviewed and updated, on the basis of the results of test runs and of the outcomes of research studies and monitoring programmes (non-target screening, EDA studies, etc.). Particular attention should be given to the integration in the universe of chemicals of relevant metabolites and transformation products, which may be more toxic than the parent compounds and which may have been previously overlooked. An important source of information on transformation products that occur in the environment but are not among target compounds in monitoring programmes, are the outcomes of monitoring studies applying non-target screening analytical techniques. A novel approach for identification of candidate priority emerging substances from non-target screening data based on the assessment of (i) derived provisional PNEC (P-PNEC) values and (ii) estimated concentrations of tentatively identified substances has recently been published (Slobodnik, J., L. Mrafkova, et al. , 2012) and will be studied by the WG experts as part of the improvement of the current methodology. The current methodology relies heavily on raw monitoring data: the system suffers from data gaps as regards the data collected in the EMPODAT database. Although the size mass of collected monitoring datasets is regularly increasing, there is a lack of raw data for half of the substances on the NORMAN list. It is therefore proposed to integrate annual consumption data, where available, to improve assessment of predicted exposure. The SPIN database www.spin2000.net (product register information), which includes the SPIN Exposure Toolbox and annual amount of consumed substances, and the IUCLID database will be used to supplement and integrate the monitoring-based indications on exposure (action leader: KEMI, SE). The improvement of collection and validation of ecotoxicity data, including data from non-standard tests and tests on novel (i.e. non-standard) endpoints is a crucial aspect for the assessment of emerging substances, which often show specific modes of action not considered in standard tests on conventional endpoints. This action is intended to allow constant revision and improvement of the Lowest PNEC values, which are initially derived using available standard test data and predicted data from QSARs models.
Page 43 NORMAN Network http://www.norman-network.net
N° W604002510
Improvement is also sought as regards the criteria for validation of (eco)toxicity tests from open literature, and in particular for non-standard tests. The present framework focuses on the protection of ecosystems in the aquatic environment. Future developments of the NORMAN prioritisation methodology should address the aspects related to effects of emerging substances in drinking water and protection of human health. An ad hoc WG dealing with Prioritisation of Emerging Substances in Drinking water will be launched in 2013. Another important issue is that mixtures effects are not considered in the current prioritisation methodology. Cumulative risks that may result from co-exposure to numerous pollutants should be considered for the improvement of this prioritisation methodology.
Page 44 NORMAN Network http://www.norman-network.net
Association N° W604002510
ANNEX I – Data treatment for substance categorisation
The steps involved in the process of data preparation for prioritisation are described in detail in the following sections. These steps are necessary to answer the decision tree queries described in Section 5.3.
1 Harmonisation of units
In order to allow data aggregation and computing, all measurements are converted to a common unit for a given matrix.
For water For water, the reference measurement unit is µg/l for all data, regardless of the type of analysed fraction (whole water, filtered water, etc.).
For sediment For sediment, the reference measurement unit is µg/kg (dry weight) for all data, regardless of the type of analysed fraction. Concentrations and LOQ values shall be multiplied by 4.6 wherever the data are provided as “wet weight” (i.e. µg/kg wet weight x 4.6 ≈ µg/kg dry weight).
For biota For biota the reference measurement unit is µg/kg (wet weight) for all data, regardless of the type of species. Concentrations and LOQ values shall be multiplied by the factors indicated in the table below whenever measurement data are provided in a different unit.
Table 8: Unit conversion for biota
Species group Basis for measurement Factor
Fish Wet weight 1
Dry weight 0.2
Lipid weight 0.05
Molluscs (invertebrates) Wet weight 1
Dry weight 0.1
For wastewater In order to allow aggregation of data measured in wastewater with data measured in surface water, data are converted as follows: - concentration values for wastewater are multiplied by 0.1 (corresponding to a dilution
factor of 10 between surface water and wastewater) - LOQ values for wastewater are divided by a factor of 3 in order to take into account that
LOQs for freshwater are lower than for wastewater (because higher volumes are used for enrichment and the matrix load is lower).
Page 45 NORMAN Network http://www.norman-network.net
N° W604002510
2 Check of the relevant matrix
Check of the relevant matrix means checking the consistency between the investigated medium / matrix and the medium / matrix which is relevant for that substance. It is based on the use of fugacity models, log Kow, Koc and water solubility for the given substance. The cut-off values applied for each of the above-mentioned indicators are as follows:
2.1 Multimedia models based on the fugacity concept by MACKAY et al. applied at 10°C
- A cut-off of 10% partitioning to a medium is considered for a substance to have a
“realistic presence” in that medium.
- Chosen scenario: Level III model, emission to water.
- Water is considered to be the relevant matrix if the hydrosolubility is >1 mg/l.
2.4 Koc
- Sediment is considered to be the relevant matrix if Koc_max is >1000 l/kg.
The overall procedure adopted for the definition of the relevant matrix for each substance is illustrated in Tables 15 and 16 below, where: - the first three columns report the results obtained from: Log Kow, fugacity models and
water solubility (for water) or Koc (for sediment);
- “Conclusion” (4th column): is the conclusion proposed for water and sediment,
respectively;
- “Level of confidence” (5th column): is the level of confidence of the proposed conclusion.
In several cases, as shown in the tables, the conclusion differs for the different
indicators. In this case, the result is flagged as “to be checked”;
- “Relevant matrix WATER / SEDIMENT – operational result”: the results in this column
can be: i) “water / sediment”, when the relevant matrix is confirmed; ii) “water? /
sediment? ”, when water is proposed as the relevant matrix but the result needs to be
confirmed; iii) “not relevant”, when the matrix is confirmed as a non-relevant matrix; iv)
“not found”: no information found, not possible to derive a conclusion.
All possible different cases and the final conclusions are reported in the tables below for water and sediment, respectively.
Page 46 NORMAN Network http://www.norman-network.net
N° W604002510
Table 15: Rules for assignment of the substance to the relevant matrix - water
Log / water Fugacity / water Solubility /
water Conclusion Level of confidence Relevant matrix WATER
- operational result
Water Water Water Water Confirmed Water
Not relevant Water Confirmed Water
Not relevant Not relevant Water To be checked Water ?
Not applicable Water Water To be checked Water ?
Not relevant Water To be checked Water ?
Not found Water Water To be checked Water ?
Not relevant Water To be checked Water ?
Not found Water To be checked Water ?
Not relevant Water Not relevant Water To be checked Water ?
Not relevant Not relevant Not relevant Confirmed Not relevant
Not applicable Not relevant Not relevant To be checked Not relevant
Not found Water Water To be checked Water ?
Not relevant Not relevant To be checked Not relevant
Not found Not relevant To be checked Not relevant
Not found Not found Not found Not found Confirmed Not found
Table 16: Rules for assignment of the substance to the relevant matrix – sediment
LogKow / sediment
Fugacity / sediment
Koc/ sediment
Conclusion Level of confidence Relevant Matrix SED –operational result
Not relevant Sediment Sediment To be checked Sediment ?
Not relevant Sediment To be checked Sediment ?
Not applicable Sediment Sediment To be checked Sediment ?
Not relevant Sediment To be checked Sediment ?
Not found Sediment Sediment To be checked Sediment ?
Not relevant Sediment To be checked Sediment ?
Not found Sediment To be checked Sediment ?
Not relevant Sediment Sediment Sediment To be checked Sediment ?
Not relevant Sediment To be checked Sediment ?
Not relevant Sediment Sediment To be checked Sediment ?
Not relevant Not relevant Confirmed Not relevant
Not applicable Sediment Sediment To be checked Sediment ?
Not relevant Not relevant To be checked Not relevant
Not found Sediment Sediment To be checked Sediment ?
Not relevant Not relevant To be checked Not relevant
Not found Not relevant To be checked Not relevant
Not found Not found Sediment Sediment To be checked Sediment ?
Not relevant Not relevant To be checked Not relevant
Not found Not found Confirmed Not found
Page 47 NORMAN Network http://www.norman-network.net
N° W604002510
3 Data aggregation
Data treatment involves a step of aggregation of the datasets as regards the types of water bodies in which the substance has been measured and the matrices. Since the choice of the level of aggregation is critical for further categorisation and prioritisation of substances, the following different scenarios are suggested: Scenario A): Aggregation of marine and fresh waters (except groundwater)
Water
- Fresh water (river/lake/reservoirs/ wastewater effluents)
- Marine water (coastal/territorial/transitional)
- Wastewater (all) Sediment
- Sediments (all matrices) Biota
- Biota (all biota matrices – fish and invertebrates)
Scenario B): Aggregation of all types of fresh water (except groundwater)
Water
- Water-fresh water: River /lake /reservoir /wastewater effluents Sediment
- Sediments-freshwater : River sediments / lake sediments Biota
- Biota-freshwater: River biota / lake biota
Scenario C): Aggregation of all types of marine waters
Page 48 NORMAN Network http://www.norman-network.net
Association N° W604002510
ANNEX II – Rules for derivation of the scores associated with the prioritisation indicators
All prioritisation indicators and corresponding scores are illustrated in Section 6.2, Table 7. In this Annex the rules for the derivation of the PBT/vPvB, CMR and ED scores are described in further detail.
1. Score for PBT / vPvB properties
1.1. Score for individual P, B and T criteria
Chemicals are screened on the basis of P, B and T properties taken singularly and compared to cut-off values. The proposed criteria and cut-off values are compatible with those adopted in current regulations and in Annex XIII of REACH (European Commission, 2011). Table 9 : Cut-off values for derivation of P, B and T criteria and corresponding individual P, B and T scores
Indicator Cut-off values Score
Persistence :
T1/2 (half-life) in water and in
sediments16
Source :
See Annex III Section 6.1
vP : T1/2 (fresh or marine water )>60 days OR T1/2 (fresh or marine sediment) >180 days
1
P : T1/2 (fresh or marine water) >40 days OR T1/2 (fresh or marine water sed.) >120 days
1
Suspect P : T1/2 (fresh or marine water) >20 days OR T1/2 (fresh or marine water sed.) >60 days
0.5
No data
0.1
Not P
0
Bioaccumulation :
BCF Source :
See Section Annex III Section 6.1
vB : BCF > 5000 1
B : BCF>2000 1
Suspect B : BCF >500 0.5
No data 0.1
Not B 0
Toxicity : T+ : Lowest PNEC < <0.01 µg/L 1
T: Lowest PNEC < 0.1 µg/L 1
16 If a threshold for half-life in any one of the compartments is exceeded, a substance fulfils the (screening) requirements for classification as persistent in the environment.
Page 49 NORMAN Network http://www.norman-network.net
N° W604002510
Indicator Cut-off values Score
Lowest PNEC17
Source :
See Sections 6.4 and 6.5
Potentially T: Lowest PNEC <1 µg/L 0.5
Presumably not T: Lowest PNEC < 10 µg/L 0.1
Not soluble 0.1
No data 0.1
Not T: Lowest PNEC≥10 µg/L 0
1.2. Score for PBT / vPvB classification
This additional score is attributed to substances classified as PBT and /or vPvB chemicals in the international PBT/POP lists according to the instructions in the table below. Since different criteria may be used in the existing conventions and regulations for assessing a chemical as a PBT compound (Moermond, et al., 2011), the most conservative classification should be used here for the allocation of the PBT/vPvB score, in line with the objectives of this prioritisation methodology, Table 10 : Rules for the derivation of the PBT / vPvB global score
Indicator Score
PBT or vPvB criteria
PBT = 1
vPvB = 1
not PBT, not vPvB = 0
NOTE: The same score ( = 1) can also be attributed to substances which, although they do not appear as PBT/vPvB substances in the international lists, can be classified as PBT or vPvB according to the rules explained above (provided that the P, B and T data are available for all three criteria).
1.3. Overall PBT / vPvB score
The overall score for PBT / vPvB properties is finally calculated by summing up the individual P, B and T scores, plus the score for PBT/vPvB classification. As a result the possible combinations are as follows: PBT: vP or P (1) + vB or B (1) + T+ or T (1) + vPvB or PBT (1) = 4. vPvBT+: vP or P (1) + vB or B (1) + T+ or T (1) + vPvB or PBT (1) = 4. vPvB: vP or P (1) + vB or B (1) + T+ or T (0) + vPvB or PBT (1) = 3.
17 This methodology adopts the Lowest PNEC as screening criterion for the assessment of the Toxicity criterion. It has however, to be stressed that according to the REACH legislation (Annex XIII), a substance fulfils the toxicity criterion (T) in any of the following situations: a. the long-term no-observed effect concentration (NOEC) or EC10 for marine or freshwater organisms is less
than 0.01 mg/l; b. the substance meets the criteria for classification as carcinogenic (category 1A or 1B), mutagenic (category
1A or 1B), or toxic for reproduction (category 1A, 1B, or 2) according to Regulation EC No 1272/2008; c. there is other evidence of chronic toxicity, as identified by the substance meeting the criteria for
classification: specific target organ toxicity after repeated exposure (STOT RE cat 1 or 2) according to Regulation EC No 1272/2008.
Page 50 NORMAN Network http://www.norman-network.net
N° W604002510
PB: vP or P (1) + vB or B (1) + T+ or T (0) + vPvB or PBT (0) = 2. PT+: vP or P (1) + vB or B (0) + T+ or T (1) + vPvB or PBT (0) = 2. ….. The sum score is then normalised to 1 (i.e. sum score divided by 4).
2. Score for CMR properties
Each individual component of the CMR indicator receives a score (as shown in Table 11), as a result of the rules explained in the tables below (Table 12, Table 13, Table 14) for the classification of a substance according to its carcinogenicity, mutagenicity and reprotoxicity effects. The CMR final score is then derived as the highest value between the individual carcinogenicity, mutagenicity and reprotoxicity scores according to the following equation:
- Score “CMR” = Max (“Carcinogenicity”, “Mutagenicity”, “Reprotoxicity”) individual scores Table 11: Rules for the allocation of the CMR score
Indicator
Score
Carcinogenicity
Sources : Annex III Section 6.2
Category 1 = 1
Category 2 = 0.75
Category 3 = 0.5
Under examination = 0.5
Examined and info not sufficient = 0.25
Not examined = 0.25
Examined and not classified = 0
Mutagenicity
Sources : Annex III Section 6.2
Category 1 = 1
Category 2 = 0.75
Category 3 = 0.5
Under examination = 0.5
Not examined = 0.25
Examined and not classified = 0
Reprotoxicity
Sources : Annex III Section 6.2
Category 1 = 1
Category 2 = 0.75
Category 3 = 0.5
Under examination = 0.5
Not examined = 0.25
Examined and not classified =0
Page 51 NORMAN Network http://www.norman-network.net
N° W604002510
2.1 Carcinogenicity
Table 12 presents the rules defined in the different officially classification systems (EU, IARC and USEPA) for classification of chemical compounds for carcinogenic effects and the corresponding scores adopted in this methodology. Table 12: Rules for classification of the substances for carcinogenic effects
Carcinogenicity : classification systems Classification
Weight of evidence IARC USEPA EU
Human carcinogen 1 CH** A* 1A (known human carcinogens based on
human evidence)
Category 1
Probable human
carcinogen
2A LH**B1-
B2
1B (presumed human carcinogens based
on animal evidence)
Category 2
Possible human
carcinogen
2B SE**C* 2 (suspected human carcinogens based
on the evidence obtained from human and/or animal studies, but which is not sufficiently convincing to place the substance in Category 1A or 1B)
Table 13 presents the criteria and the rules in the EU system for classification of chemical compounds for their mutagenicity effects (EU) and the corresponding score adopted in this methodology.
Table 13: Rules for classification of the substances for mutagenic effects
Mutagenicity (EU description)) Classification
1A
based on positive evidence from human epidemiological studies
evidence of induced heritable mutations in the germ cells of humans
Category 1
1B
positive result(s) from in vivo heritable germ cell
Page 52 NORMAN Network http://www.norman-network.net
N° W604002510
Mutagenicity (EU description)) Classification
mutagenicity tests in mammals
positive result(s) from in vivo somatic cell mutagenicity tests in mammals
positive results from tests showing mutagenic effects in the germ cells of humans
2
may induce heritable mutations in the germ cells of humans
Category 3
Examined and not classified
Not examined
Classification EU : http ://eur-lex.europa.eu/LexUriServ/LexUriServ.do?uri=OJ:L:2008:353:0001:1355:EN:PDF
2.3 Reprotoxicity
Table 14 presents the different officially recognised systems for classification of chemical compounds for their reprotoxicity effects (EU) and the corresponding score adopted in this methodology.
Table 14: Rules for classification of the substances for reprotoxicity effects
Reprotoxicity (EU description) Classification
1A
Known human reproductive toxicant, based on evidence from humans.
Category 1
1B
Presumed human reproductive toxicant, based on data from animal studies.
Category 2
2
Suspected human reproductive toxicant, based on some evidence from humans or experimental animals, but not sufficiently convincing to place the substance in Category 1.
Category 3
Not examined
Examined and not classified
Classification EU : http ://eur-lex.europa.eu/LexUriServ/LexUriServ.do?uri=OJ:L:2008:353:0001:1355:EN:PDF
Page 53 NORMAN Network http://www.norman-network.net
N° W604002510
3. Score for endocrine disrupting potential
Table 15 : Rules for the derivation of the ED score
Indicator Score
Endocrine disrupting potential Sources :
See Section 6.3
Proven ED effects = 1
Suspect ED effects = 0.5
Not examined = 0.25
Examined and not classified as ED = 0
Page 54 NORMAN Network http://www.norman-network.net
Association N° W604002510
ANNEX III – Data sources and procedures for data validation
1. Exposure data
The NORMAN EMPODAT database http://www.normandata.eu/ is recommended as a privileged source of exposure data for the application of this prioritisation methodology at the national, river basin or European level, depending on the geographical scale at which the prioritisation study is performed. In principle, however, any monitoring datasets may be used to apply this prioritisation methodology.
The NORMAN database is especially focused on emerging substances and it is regularly upgraded and maintained by the NORMAN network with raw monitoring data collected from all over Europe and beyond, resulting from national monitoring campaigns, research projects, peer-reviewed literature, etc. This database is publicly available and can therefore be used by other interested parties. All data in this database are validated by the data owners and on this basis they are considered suitable for this prioritisation exercise. In addition, a scoring system is provided by NORMAN for classifying data according to the level of QA/QC information supporting the data (four categories are identified, with Category 1 being assigned to “data adequately supported by QA/QC info”). The details of this scoring system are available in the NORMAN EMPODAT database (http://www.normandata.eu/empodat_index.php?menu_type=2 ). It is, however, important to stress that, because there are still significant gaps in the collection of data on emerging substances, this database cannot be considered exhaustive in terms of substances or matrices covered. As a result, where necessary, monitoring data available in EMPODAT should be integrated with data from other sources (e.g. data from recent monitoring campaigns, data from research projects and information from the scientific literature). The application of the methodology requires, however, that the datasets should be available as raw data in databases. As a general rule, official governmental information (monitoring data), if available, and peer-reviewed literature should be preferred over project data which have not been quality-checked. Expert judgement about the reliability of data not sufficiently supported by QA/QC information may be accepted for the categorisation process only. However, only data adequately supported by QA/QC information should be used for assessment of top priority substances, in particular for Category 1 compounds.
2. Limit of quantification (LOQ) associated with exposure data
The limits of quantification (LOQ) used for assessment of exposure data are, first of all, the LOQs associated with the datasets used for the prioritisation exercise (i.e. monitoring data available in the EMPODAT database or other datasets).
Page 55 NORMAN Network http://www.norman-network.net
N° W604002510
In addition, LOQliterature are collected from publications available in the scientific literature. LOQliterature are the limits of quantification derived from bibliographic research. They can be obtained by using scientific publications or search engines of the “ISI web of knowledge” type or by directly consulting the appropriate scientific journals of the “Journal of Chromatography A” or “Environmental Science & Technology” type. The search may be conducted by using the name of the relevant substance together with terms such as “analysis” and “water”, “sediment”, “biota” or “fish”, according to the matrix under consideration. With the ISI database, the search extends not only to the titles, but also to the body of the texts, which ensures that this protocol is exhaustive. The publications found are then considered by their title and by their abstract, if there is one. The selected publications are then consulted individually in order to verify: - whether LOQ values have been determined - whether the LOQ values relate to fixed criteria (validation in the matrix, for example) - what type of matrix/sample has been analysed (filtered water, for example). When several LOQ values from different publications are available, the lowest LOQ is used to define the LOQliterature to be used as the benchmark minimum value. In certain cases, if several LOQ values are available, the analytical approach adopted may be taken into account in selecting the reference value. In this way, the results obtained with widely used (and commercially available) techniques are prioritised over those obtained with less accessible techniques (e.g. sample pre-concentration with SPME fibre specially made for an application).
3. Use pattern
The assignment of substances to “use pattern” categories, such as “pesticides” or “pharmaceuticals”, is in most cases obvious and straightforward and information can be easily found via internet search. For industrial chemicals, however, the definition of the “use pattern” is less immediate since a distinction can be made between industrial chemicals which are present in formulations / products in domestic use such as detergents, personal care products, etc. (“dispersive use/ diffuse sources”) and chemicals which are used exclusively in industrial processes and which are therefore emitted in the environment via “controlled point sources” or even chemicals used in closed systems (i.e. controlled system – isolated intermediate, with no direct release to the environment). For industrial chemicals, data on use patterns can be obtained from the following sources: - ECHA database (ECHA CHEM http://apps.echa.europa.eu/registered/registered-
Under the “Manufacture, Use & Exposure > Identified uses”18 section on the ECHA CHEM http://apps.echa.europa.eu/registered/registered-sub.aspx website, it is possible to find for a given molecule the following codes: 18 It is important to take into account that the information under the "Manufacture, Use & Exposure" section can be considered as confidential by the supplier (registrant), in which case it will not be accessible on the ECHA website
Page 56 NORMAN Network http://www.norman-network.net
N° W604002510
- “ERC” (“Environmental Releases Category”). Note: This information was not compulsory in the previous versions of IUCLID and therefore it is not always available for all substances.
- “PROC” (“Process Category”; this code refers to the type of production process used). - “PC” (“Product Category”). This code refers to use type of the chemical product (e.g.
PC24 = “Lubricants, greases, release products”; PC39=“Cosmetics, personal care products.
- “SU” (“Sector of Use”). This code refers to the sector of the society where a specific substance use occurs (e.g. SU1= “Agriculture, forestry, fishery”; SU5= “Manufacture of textiles, leather, fur”).
The PROC, PC and SU categories are obligatory for all compounds. Although they are to some extent addressed to the assessment of workers‟ exposure, they can be used as a “surrogate” for the “ERC” information when this is not available. For the chemicals for which different types of use are possible, the score corresponding to the most critical use pattern (in terms of environmental impact) should be attributed (following a “worst case scenario” approach). The information allowing assignment of a compound used in the chemical industry to the “wide dispersive use”, “controlled point sources” and “used in closed systems” categories is presented in the table below19. Table 16: Data for classification of compounds used in the chemical industry Use pattern Classification data (Manufacture, Use and Exposure section
– ECHA CHEM site)
Wide dispersive use ERC 2, or ERC 5, or ERC 8a, or ERC 8c, or ERC 8d, or ERC 8f, or ERC 10b, or ERC 11b, or ERC 12B
Controlled point sources ERC 8b, or ERC 8c, or ERC 8e, or ERC 9a, or ERC 9b, or ERC 10a, or ERC 11a PROC 10, or PROC 11, or PROC 13, or PROC 15, or PROC 17, or PROC 18, or PROC 19
4. Physico-chemical properties
The physico-chemical parameters used in the process of categorisation and prioritisation of the candidate emerging substances and the purpose(s) for which they are applied are listed in the table below.
19 Reference documents available on the ECHA website:
Page 57 NORMAN Network http://www.norman-network.net
N° W604002510
Table 17: Physico-chemical parameters applied for substance categorisation and priorisation
Parameter Application / purpose
Kow Assessment of the relevant matrix
Derivation of predicted PNECs
Water solubility (Sw) Assessment of the relevant matrix
Derivation of predicted PNECs
Koc Assessment of the relevant matrix
Derivation of predicted PNECs
Details of the data sources that can be used for the retrieval of the above-mentioned physico-chemical parameters (i.e. experimental data as well as the procedures applied for the derivation of the corresponding data by QSAR) are described below. Information about the rules adopted for data preference is also provided in this section.
In all models mentioned below, where available, the chemical structure of each predicted compound is compared to the training set of the QSAR model, via atom-centred fragments (ACFs) and the following rules / coding are applied to check whether the compound lies within the application domain of the given model (Kühne, 2009):
3 = In All ACFs are matching, including the number of occurrences. 2 = Borderline in Either the frequency of at least one sub-structure of the
compound exceeds the range of occurrences in the training set, or one sub-structure is not in the training set at all.
1 = Borderline out Two or more sub-structures are not in the training set at all, but all 1st order ACFs are matching (without regard to the frequencies).
0 = Out There is a mismatch even with 1st order ACFs.
4.1. Octanol-water partition factor (Kow)
Class-based model selection 25°C
Experimental data from the EPI suite software (Environmental Protection Agency, 2009) and other literature sources are preferred. When experimental data are not available, the ChemProp software attributes a result to each compound separately, by applying the QSAR methods in the order listed below. The first valid result is accepted. The default order may, however, be altered for certain compounds, compound classes or values, if the application domain of certain models (via atom-centred fragments) is more appropriate. There are 24 rules implemented. The default order of use is: 1. (Hou & Xu, 2003) 2. (Marrero & Gani, 2002) 3. (Dubost, Kummer, Gaudin, Carpy, & Baranton, 2005) 4. (Wang, Gao, & Lai, 2000) 5. (Broto, Moreau, & Vandycke, 1984) 6. (Ghose, Viswanadhan, & Wendoloski, 1998) 7. (Klopman, Li, Wang, & Dimayuga, 1994)
Page 58 NORMAN Network http://www.norman-network.net
N° W604002510
4.2. Water solubility (Sw)
ACF-based model selection
For each compound, the method with the lowest average error for the most similar compounds of a data set with known estimation errors is selected. The similarity is detected by structure comparison via atom centered fragments (Kühne, 2006). Methods to be considered: a) From Kow (either estimated or experimental)
1. (Meylan, Howard, & Boethling, 1996) b) From structure (purely theoretical models)
1. (Hou, Xia, Zhang, & Xu, 2004)
2. (Tekto, Tanchuk, Kascheva, & Villa, 2001)
3. (Marrero & Gani, 2002)
4. (Klopman & Zhu, 2001)
5. (Huuskonen, 2001)
c) From LSER descriptors (either estimated or experimental)
1. (Abraham & Le, 1999)
4.3. Organic carbon adsorption coefficient (Koc)
Decision tree model (Sabljic et al. 1995, Sabljic et al. 1996)
The log Koc is estimated by a hierarchical decision tree, offering 20 different equations in total (for the equations, please refer to Sabljic et al. 1995, Sabljic et al. 1996). The first equation applies to Rule 1, while the other 19 equations correlate log Koc to log Kow.
- (Sabljic A, Güsten H, Verhaar H, Hermens J., 1995)
- (Sabljic A, Güsten H, Verhaar H, Hermens J., 1996)
For non-polar compounds, the more precise but also restricted model is Eq. 1. If this cannot be applied, Eq. 2 (more general, less precise) is used. For polar compounds, a 3-level scheme is applied: - First, there is an attempt to apply one of the 4 models (Eq. 7–20) for particular
compound classes. The usage is restricted by a log Kow domain, a chemical domain, and a substituent domain. Moreover, assignment must be unique, i.e., no assignment to more than one compound class.
- If assignment to Eq. 7–20 is not possible, a more general system of 3 equations (Eq. 4–6) will be used. Here, the three domains are defined less strictly.
- If this still fails, the general equation for polar compounds (Eq. 3) will be tried. There is no substituent domain, the chemical domain is defined to be all compounds not classified as non-polar, and the Kow domain is larger.
Page 59 NORMAN Network http://www.norman-network.net
N° W604002510
5. Fugacity modelling
If a substance has been looked for in a medium where there is little chance of finding it, a lack of positive detection cannot be used as a justification for absence of the substance in the environment / evidence of no exposure. This indicator is therefore used to check whether the available data are suitable for judging the level of exposure to a given substance and to confirm the matrix(ces) in which the action needs to take place.
Multimedia models based on the fugacity concept developed by Mackay et al at 10°C are one of the indicators considered for the calculation of distribution between environmental compartments and thus the assessment of the „relevant‟ matrix for a given substance. Depending on the complexity of the environment and the exchange between the compartments there are different levels of fugacity calculations.
LEVEL I:
It is particularly useful for assessing the likely general fate in an evaluative environment. It calculates the equilibrium distribution of 1000kg of a chemical without consideration of emissions into special compartment(s), flow in or out of the environment, transport between the compartments at all, and reaction. It results in an overall fugacity.
LEVEL II:
This level introduces advection and reaction terms into the model. Advection as a process of movement of a chemical by virtue of its presence in a medium is possible into the main compartments: air, water and sediment. Emission is handled as in Level I as unspecified emission into the whole environment Reactions are treated as first-order processes. Reaction rates may be defined for all compartments. The basic concept behind the model is the assumption of the CSTR (continuously stirred tank reactor), with no resistance to inter-media transport, and thus the environmental media are assumed to be in equilibrium. It results in an overall fugacity.
LEVEL III:
To overcome the weakness of Level II, in that it assumes the environmental media to be in equilibrium, the Level III approach incorporates transport or transfer between the media occurring at finite rates. The processes may be non-diffusive as wet and dry deposition or diffusive as the interphase transfer. For a detailed introduction to the definition and handling of mass transfer coefficients, see Mackay (1991).
The mass balance is formulated for all main compartments and the linear equation system is solved. It results in as many fugacities as main compartments exist. At the moment it is handled as a four (main) compartment model, which proves to be the best choice at the moment (Mackay, 1991). The resulting fugacities and the concentrations represent the steady state.
In the categorisation scheme described in this report the following rules are adopted as regards fugacity models:
- Chosen scenario: Level III model, “emissions to water”;
- A cut-off of 10% partitioning to a medium is considered for a substance to have a “realistic presence” in that medium.
NOTE:
Page 60 NORMAN Network http://www.norman-network.net
N° W604002510
The “emissions to water” scenario (100% emissions to water) also tends to accentuate the estimated fraction of the substance in water for chemicals that are in reality emitted to air and have low water solubility. This assumption can, however, be justified here as “worst case scenario”, since the assessment of risk in this methodology is based on water exposure.
6. Hazard data
6.1. PBT properties
The following conventions or regulations are used as the primary reference to check whether a candidate substance is already classified as a PBT or vPvB compound: - Stockholm Convention (Stockholm Convention, 2011) - Aarhus Convention – UNECE (UNECE, 1998) - REACH – Annex XIII of the REACH Regulation No 1907/2006 (European Commission,
2011) In addition to that, assessment of the P, B and T criteria and comparison with the thresholds provided in Table 9 should be carried out. Indications on available data sources (experimental data and QSAR models) for this assessment are provided in the following sections.
Persistence
In line with REACH, individual half-lives in air, water soil and sediment are used in this methodology for assessing the persistency of a chemical in the environment. Experimental data used for derivation of the half-life of a chemical compound in a given matrix are those obtained from biodegradation studies (OECD 301 A-F, simulation tests as described in OECD 307, 308 and 309, etc.). The number of experimental data available in the scientific literature on degradation half-lives is, however, remarkably small (Strempel et al., 2012) and the use of models (see sections below) is recommended for the derivation of this parameter. a) The Kühne R, et al. (2007) model
Half-life data at 25°C are estimated from 3 out of ca. 300 most similar compounds from the database of half-life classes. The weighted average is then reclassified, and the result is the mean value of the respective class. Finally, a simple temperature dependence approach on the basis of the Arrhenius equation is applied to derive the corresponding values for 10°C.
b) Other models
- Mackay D, Shiu W.Y., Ma K.C. (1992). Illustrated Handbook of Physical-Chemical Properties and Environmental Fate for Organic Chemicals. Lewis Publishers, Chelsea (MI, USA)
- Papa, E. and P. Gramatica (2010)
Bioaccumulation
In line with the current regulatory frameworks, the bioconcentration factor (BCF) of a substance is the indicator which is used for assessment of the B criterion (bioaccumulation). Available data sources for derivation of BCF values are listed below.
Page 61 NORMAN Network http://www.norman-network.net
N° W604002510
a) The EUSES model (European Commission, 1996), (Veit, de Foe & Bergstaed, 1979)
The EUSES model estimates the BCF for compounds up to log Kow of 6 by:
In this methodology the toxicity criterion (T) is assessed by comparing the value of the Lowest PNEC with the thresholds reported in Table 9. Please refer to Section 5.2.3.1 for explanation of the procedure for derivation of the Lowest PNEC and to Sections 6.4 and 6.5 for recommended sources for retrieval of experimental and modelled data.
6.2. CMR properties
The main available sources to identify CMR substances are:
- the EU Regulation on Classification, Labelling and Packaging (CLP, EC 1272/2008) which contains a register of all officially classified substances including CMR substances category 1A or 1B. These substances are recognised under REACH as by default meeting the criteria of SVHCs (article 57 a–c of REACH).
- The IARC Report (http://monographs.iarc.fr/ENG/Monographs/PDFs/index.php) on carcinogens.
6.3. ED properties
The main available sources for the allocation of a chemical as a substance with endocrine disrupting potential are:
- the reviews by the EU: E.C. (2007). Commission staff working document on implementation of the “Community Strategy for Endocrine Disrupters” – a range of substances suspected of interfering with the hormone systems of humans and wildlife
Page 62 NORMAN Network http://www.norman-network.net
N° W604002510
(COM(1999) 706), COM(2001) 262) and SEC (2004) 1372) SEC(2007) 1635. European Commission, Brussels. 30.11.2007 (EU Commission, 2007)
- the “SIN List” (Substitute It Now!) (Chem Sec – SIN List 2.0) available at http://www.sinlist.org/
- the IEH Report on Chemicals purported to be endocrine disrupters. A compilation of published lists. MRC Institute for Environment and Health, Leicester, UK, IEH Web Report W20 (IEH Report, 2005) http://www.cranfield.ac.uk/health/researchareas/environmenthealth/ieh/ieh%20publications/w20.pdf
Other sources, as well as evidence from the scientific literature, should also be used when available.
6.4. Ecotoxicity data (experimental data)
The following sources can be used as reference for retrieval of experiment data for Lowest PNEC derivation: The COMMPS report (Fraunhofer Institute, 1999) and the follow-up report by INERIS
(INERIS, IOW, 2009) for the available acute and chronic-based PNEC values Acute toxicity data to Daphnia magna can be retrieved from:
- von der Ohe, P. C., R. Kuhne, et al. (2005) - Pesticide Manual (Tomlin, C. D. S., 2003) - ECOTOX database (USEPA, 2008), - RIVM e-toxbase database (De Zwart, 2002), - Screening information datasets (IPCS, INCHEM) - Pesticides Properties database – former Footprint database (PPDB, Hertfordshire
University), - Etox database from the German Federal Environmental Agency
(http://webetox.uba.de/webETOX/public/search/ziel/open.do). and from further open literature. Acute toxicity data for green algae (S. capricornutum) can be derived from the above-
mentioned databases. Acute toxicity data for P. Promelas can be retrieved from the so-called Duluth database
(Geiger, Brooke et al. 1990) as well as from the above-mentioned databases.
NOTE:
Data sources for the compilation of experimental ecotoxicity data and existing PNEC values need to be regularly updated throughout the whole prioritisation process.
6.5. Ecotoxicity data (modelled data) – derivation of P-PNEC
The recommended approach for derivation of predicted PNECs (P-PNEC) when experimental ecotoxicity data are not sufficient, is the novel read-across method published by Schüürmann (2011) and Kühne R. et al. (2013), which allows prediction of acute toxicity to three standard test organisms, namely Daphnia magna, Selenastrum capricornutum and
Page 63 NORMAN Network http://www.norman-network.net
N° W604002510
Pimephales promelas to predict the toxicity of as yet untested substances (Schafer, R. B., V. Pettigrove, et al. , 2011); (von der Ohe, 2011). The decision for choosing this method is based on the expected better performance of the method, compared to commonly recommended QSAR models, which are usually based on log Kow and simple molecular descriptors. For the three test organisms, a huge number of chemicals are available for read-across: about 1300 chemicals for D. magna, about 550 for S. capricornutum and about 700 for P. promelas. Structurally similar compounds in a reference set are looked up via comparison of ACF (see above). The experimental values of the similar compounds are weighted by their similarity. The final result is a weighted average of different runs. Optionally, the results of the individual runs can be displayed using a read-across code:
4 = compound found in training set and value used, no read-across necessary
3 = 1st order result equal to 2nd order result (no weighting required)
2 = full model – weighted average of 1st and 2nd order model applied
1 = 1st order model only, no sufficient 2nd order similarity
0 = no sufficient 1st order similarity – no valid read-across result.
In this way, this method allows the applicability of the model (chemical domain of the training set) to be verified, something that is not available for all the other QSARs. Furthermore, compounds with a specific toxicity (e.g. insecticides) can also be predicted with reasonable accuracy, which is not possible with the commonly used baseline QSARs. When sufficiently similar compounds are not available, the baseline toxicity estimated from the octanol-water partitioning coefficient (Kow) is used, employing established QSAR models ((von der Ohe, P. C., R. Kuhne, et al., 2005) and (USEPA, 2008)). This is especially the case for S. capricornutum, with a somewhat smaller database. For this species, baseline EC50 are estimated as:
log EC50 = -0.9965 x log Kow - 1.2533 in mol/l LC50 (96h) to Pimephales promelas are calculated according to van Leeuwen et al. (1992):
log LC50 = -0.85 x log Kow - 1.41 in mol/l LC50 (48h) to Daphnia magna are calculated according to von der Ohe et al. 2005):
log EC50 = -0.857 x log Kow - 1.281 in mol/l If the predicted value is more than 10-fold higher than the expected baseline toxicity of the compound, the 10-fold baseline toxicity value is used. Compounds with a predicted toxicity 10 times higher than the estimated water solubility (USEPA, 2008) should be excluded from the assessment.
Page 64 NORMAN Network http://www.norman-network.net
N° W604002510
7. Evaluation of the reliability and relevance of ecotoxicity data
Before using ecotoxicity data in risk assessment it is important to evaluate the reliability and relevance of the data. Reliability is the inherent quality of a test relating to test methodology and the way that the performance and results of the test are described. Basically this evaluation should answer the question: Has the experiment generated and reported a true and correct result? The relevance evaluation should answer whether a test is appropriate for a particular hazard or risk assessment. There are several evaluation methods available in the public literature; the majority of them focus on reliability. Amongst them, the Klimisch approach (Klimisch et al., 1997) is adopted under REACH. Other published methods include: Hobbs et al., 2005; Durda & Preziosi, 2000; Schneider et al., 2009; Küster et al., 2009; Mensink et al., 2008; Ågerstrand et al., 2011a. The evaluation methods differ in scope, type of criteria, and user-friendliness. All of them require some degree of expert judgement. It is important to remember that the choice of evaluation method affects the result of the evaluation (Ågerstrand et al., 2011b). A major advantage of using a more structured way of evaluating data is increased transparency and predictability of the risk assessment process. For instance, both a check-list and pre-defined criteria will contribute to ensuring that at least a minimum and similar set of aspects are considered in each evaluation. Pre-defined evaluation criteria may also contribute to increased transparency of the evaluation process to the extent that these criteria are clearly reported to the relevant actors. Disadvantages of using pre-defined evaluation criteria and check-lists are reduced flexibility and a focus on the general aspects of a study. Ecotoxicity studies published in the public literature are in many cases not reported in a way that coincide with the reporting requirements for standard tests (Ågerstrand et al., 2011b). This has led to a situation where studies from the public literature are not used in regulatory risk assessment to the extent they should be. Since there is a lack of data for many substances, it is important in the NORMAN prioritisation process to make use of all available data. The use of public literature is therefore encouraged. It is, however, important to be aware of the strengths and weaknesses of each study and to be transparent about this, i.e. provide clear description and justification of the selection and evaluation process. The evaluation method described by Ågerstrand et al. (2011a) is based on four previously published evaluation methods, the OECD reporting requirements for chronic ecotoxicity studies and experiences from researchers and regulators working in the ecotoxicology field. It consists of 62 reliability criteria and 12 relevance criteria. The reliability criteria can be used as guidance for researchers in the design, performance and reporting of experimental tests to ensure that regulatory risk assessment criteria are met. For risk assessors and regulators evaluating ecotoxicity studies, reliability and relevance evaluation criteria provided by M. Ågerstrand, R. Kase, C. Moermond and M. Korkaric are recommended (see Tables 18 and 19). These evaluation criteria are currently being tested by risk assessors from Europe and North America. Results from the test and future updates of the evaluation criteria can be found at www.scirap.org.
Page 65 NORMAN Network http://www.norman-network.net
N° W604002510
Table 18: Reliability evaluation criteria
Reliability evaluation criteria Critical criteria
General information
Before evaluating the test, check the physicochemical characteristics of your compound (handbooks/general sources). What is the solubility, log KOW, pKa, is the compound volatile, does it hydrolyse, photolyse, etc.?
Is a description of endpoints and methodology available? Yes
Protocol
Is a standard method (e.g., OECD/ISO) or modified standard used?
No
Is the test performed under GLP conditions? No
If applicable, are validity criteria fulfilled (e.g. control survival, growth)?
Yes. Criteria depend on test organism.
Are appropriate controls performed (e.g. solvent control, negative and positive control)
Yes. Type of control depends on test substance and protocol.
Test Compound
Is the tested substance identified clearly with name or CAS-number? Are test results reported for the appropriate compound?
Yes
Is the purity or the source reported? Is there information on the formulation available (if appropriate)?
Yes
Test Organism
Are the organisms well described (e.g. scientific name, weight, length, growth, age/life stage, strain/clone)?
Yes. Necessary details depend on test organism.
Are the test organisms from a trustworthy source and acclimatised to test conditions?
Yes
Has the pre-exposure of the organisms to the test compound or other unintended stressors been avoided?
Yes
Exposure Conditions
Is the experimental system appropriate for the test substance and are appropriate test vessels used (e.g. static, flow-through, renewal; light/dark conditions; open/closed systems)?
Yes
Is the experimental system appropriate for the test organism; e.g., choice of medium or test water, feeding, water characteristics, temperature, light/dark conditions, pH, oxygen content?
No. Exceptions possible.
Are the exposure concentrations equal to or less than water solubility? Or, if a solvent is used, is the solvent within the appropriate range and is a solvent control included?
Yes
Is a correct spacing between exposure concentrations applied? Is exposure duration defined?
Yes
Page 66 NORMAN Network http://www.norman-network.net
N° W604002510
Reliability evaluation criteria Critical criteria
Has a chemical analysis been performed to verify substance concentration at different points in time? Is the analytical method stated?
Yes. Exceptions possible.
Is the loading of the organisms within the appropriate range (< 1 g/L)?
Yes, for hydrophobic compounds.
Statistical Design and Biological Response
Is a sufficient number of replicates used? Is a sufficient number of organisms per replicate used for all controls and test concentrations?
Yes
Are appropriate statistical methods used? Yes. Can also be recalculated by assessor afterwards if enough information is provided.
Is a dose response curve observed? Is the response statistically significant?
Yes. Can also be recalculated by assessor afterwards if enough information is provided.
Are raw data available? No
Table 19: Relevance evaluation criteria
Relevance evaluation criteria
General
Before evaluating the test for relevance, check why you are evaluating this study. The relevance of the study might be different for different purposes (e.g., EQS derivation, PBT assessment, dossier evaluation for marketing authorisation), also depending on the framework for which the evaluation is requested. Where reliability is an intrinsic property of the study (and should not differ between frameworks), the relevance depends strongly on the framework for which a study is evaluated.
Biological relevance
Is the tested species relevant for the aquatic compartment and the tested compound?
Are the reported endpoints appropriate for the investigated effects or the mode of action?
Is the effect population relevant?
Is the magnitude of effect (e.g., EC1, EC5, EC10, EC50) relevant according to the guideline?
Are appropriate life-stages studied?
Are the experimental conditions relevant for the tested species?
Is the time of exposure relevant and appropriate for the studied endpoints and species?
If recovery is studied, is this relevant for the framework for which the study is evaluated?
Exposure relevance
Is the tested substance representative and relevant for the substance being assessed?
Is the tested exposure scenario relevant for the substance?
Do the tested concentrations relate to measured or predicted environmental concentrations (if available)
Page 67 NORMAN Network http://www.norman-network.net
N° W604002510
Acronyms and abbreviations
ACF Atom-centred fragments
AF Assessment factori
BCF Bioconcentration factor
CMR Carcinogenic, Mutagenic and Reprotoxic substances
DT50 Disappearance half-life
ECHA European Chemical Agency http://echa.europa.eu
EC50 Half maximal effective concentration
ED Endocrine Disruptor
EMPODAT EMPODAT: database of geo-referenced monitoring and bio-monitoring data on emerging substances in air, water and soil http://www.normandata.eu/empodat_index.php
EQS Environmental Quality Standard
JRC Joint Research Centre of the European Commission http://ec.europa.eu
Koc Organic carbon adsorption coefficient
Kow Octanol / water partitioning factor
LC50 Lethal Concentration 50 (concentration in water having 50% chance of causing death to aquatic life)
LOD Limit of Detection
LOQ Limit of Quantification
LRTAP Long-Range Transboundary Air Pollution (Convention)
MECsite Measured Maximum Environmental Concentration at one site
MEC95 95th percentile of all MECsite
MECsite_max Measured Maximum Environmental Concentration among all sites with recent measurements
NOEC No Observed Effect Concentration
NORMAN Network of reference laboratories, research centres and related organisations for monitoring of emerging environmental substances http://www.norman-network.net
OSPAR Oslo-Paris Convention (The Convention for the Protection of the Marine Environment of the North-East Atlantic) http://www.ospar.org/
PEC Predicted Environmental Concentration
PNEC Predicted No Effect Concentration (based on experimental data)
P-PNEC Provisional Predicted No Effect Concentration (based on modelled data)
PBT Persistent, Bioccumulative and Toxic substances (Annex XIII of REACH Regulation)
POP Persistent Organic Pollutant
QSAR Quantitative Structure-Activity Relationship
REACH European Regulation (EC 1907/2006) for Registration, Evaluation, Authorisation and Restriction of Chemical substances
SVHC Substances of Very High Concern (as defined in REACH Regulation)
UNECE United Nations Economic Commission for Europe
vPvB Very Persistent and very Bioaccumulative substances (Annex XIII of REACH regulation)
Page 68 NORMAN Network http://www.norman-network.net
N° W604002510
References
1) Abraham, M., & Le, J. (1999). The correlation and prediction of the solubility of compounds in water using an amended solvation energy relationship. J. Pharm. Sci. , 88, 868-880.
2) Ågerstrand, M. et al. (2011). Reporting and evaluation criteria as means towards a transparent use of ecotoxicity data for environmental risk assessment of pharmaceuticals. , 159(10). Environmental Pollution , 159 (10), 2487–2492.
3) Ågerstrand, M., Breitholz M., Ruden C. (2011b). Comparison of four different methods for reliability evaluation of ecotoxicity data – Acase study of non-standard test data used in environmental risk assessments of pharmaceutical substances. Environmental Sciences Europe, 23 (17).
4) Arnot, J., & Mackay, D. (2008). Policies for chemical hazard and risk priority setting: can persistence, bioaccumulation, toxicity and quantity information be combined. Environmental Science and Technology , 42 (13), 4648.
5) Boxall, A. (2008). Report on environmental impact and health effects of PPs – KNAPPE Project - Contract n° 036864, Deliverable D4.2.
6) Broto, P., Moreau, G., & Vandycke, C. (1984). Molecular structures: perception, autocorrelation descriptor and SAR studies. Eur. J. Med. Chem. - Chim. Ther. , 19, 71-78.
7) Chem Sec - SIN List 2.1. (n.d.). SIN database - SIN List 2.1. Retrieved February 21, 2013, from ChemSec -
bridging the gap between regulators, business, investors, NGOs and science: http://www.chemsec.org/what-we-do/sin-list/sin-database
8) D.L. Geiger, L. B. (1988). Acute Toxicities of Organic Chemicals to Fathead Minnows (Pimephales promelas) (Vol. 4). Superior WI 355: Centre for Lake Superior Environmental Studies.
9) Dimitrov, S., Breton, R., MacDonald, D., Walker, J., & Mekenyan, O. (2002). Quantitative prediction of biodegradability, metabolite distribution and toxicity of stable metabolites. SAR QSAR Environ. Res. , 13, 445-455.
10) Dubost, J.-P., Kummer, E., Gaudin, K., Carpy, A., & Baranton, J. (2005). Determination of a new set of lipophilicity fragmental contributions highlights the problem of indetermination due to phenomena: Fragmental induction and fragmental isofrequency. QSAR Comb. Sci. , 24, 853-862.
11) Durda, J., & Preziosi, D. (2000). Data Quality Evaluation of Toxicological Studies Used to Derive Ecotoxicological Benchmarks. Human and Ecological Risk Assessment: An International Journal , 6 (5),
747–765. 12) EC, CLP. (2008). Regulation (EC) No 1272/2008 on classification, labelling and packaging of substances
and mixtures. 13) EMPODAT, NORMAN. (s.d.). EMPODAT: database of geo-referenced monitoring and bio-monitoring data
on emerging substances in air, water and soil. Consulté le jan 25, 2013, sur http://www.normandata.eu/empodat_index.php
14) Environment Canada - Existing Substances Branch. (2003). Environment Canada Guidance Manual for the Categorization of Organic and Inorganic Substances on Canada's Domestic Substances List.
15) Environmental Protection Agency. (2009). Estimation Programs Interface SuiteTM for Microsoft Windows, v 4.00. Washington, United States.
16) EU Commission. (2007). Comm. Staff Work. Doc. on the implement. of the "Community Strat. for Endocrine Disrupters" - a range of subst. suspected of interfering with the hormone systems of humans and wildlife (COM (1999) 706), (COM (2001) 262) and (SEC (2004) 1372) SEC 2007 1635. Retrieved from http://ec.europa.eu/environment/endocrine/documents/sec_2007_1635_en.pdf
17) EU Commission. (2011). WFD-CIS Guidance Document No. 27 Technical Guidance For Deriving Environmental Quality Standards. Luxembourg: Office for Official Publications of the European Communities.
18) European Chemicals Agency. (2008). Guidance on information requirements and chemical safety assessment - Chapter R.11: PBT Assessment. ECHA.
19) European Chemicals Agency. (2012). Guidance on information requirements and chemical safety assessment: Chapter R.16: Environmental Exposure Estimation. ECHA-10-G-06-EN.
20) European Commission. (2011). COMMISSION REGULATION (EU) No 253/2011of 15 March 2011 amending Regulation (EC) No 1907/2006 of the European Parliament and of the Council on the Registration, Evaluation, Authorisation and Restriction of Chemicals (REACH) as regards Annex XIII. Official Journal of the European Union.
21) European Commission. (1996). Technical guidance document in support of the Commission regulation (EC) 1488/94 on risk assessment for existing chemicals, Part III. Luxembourg (L): Office for Official Publications of the European Communities.
22) Fraunhofer Institute. (1999). Revised proposal for a list of priority substances in the context of the Water Framework Directive (COMMPS procedure). Available at http://ec.europa.eu/environment/water/water-dangersub/pdf/commps_report.pdf.
23) Ghose, A., Viswanadhan, V., & Wendoloski, J. (1998). Prediction of hydrophobic (lipophilic) properties of small organic molecules using fragmental methods: An analysis of ALOGP and CLOGP methods. J. Phys. Chem. A. , 102, 3762-3772.
Page 69 NORMAN Network http://www.norman-network.net
N° W604002510
24) Hobbs, D., & Markich, S. (2005). Evaluation of criteria used to assess the quality of aquatic toxicity data. Integrated Environmental Assessment and Management , 1 (3), 174–180.
25) Hou, T., & Xu, X. (2003). ADME evaluation in drug discovery. Prediction of partition coefficient by atom-additive approach based on atom-weighted solvent accessible surface areas. J. Chem. Inform. Comput. Sci. , 43, 1058-1067.
26) Hou, T., Xia, K., Zhang, W., & Xu, X. (2004). ADME evaluation in drug discovery. 4. Prediction of aqueous solubility based on atom contribution approach. 44:. J. Chem. Inform. Comput. Sci. , 44 (1), 266-275.
27) Huuskonen, J. (2001). Estimation of water solubility from atom-type electrotopological state indices. Environ. Toxicol. Chem. , 20, 491-7.
28) IEH Report. (2005). IEH Report. Chemicals purported to be endocrine disrupters. A compilation of published lists. IEH Web Report W20. http://www.cranfield.ac.uk/health/researchareas/environmenthealth/ieh/ieh%20publications/w20.pdf. Leicester, UK: MRC Institute for Environment and Health.
29) INERIS, IOW. (2009). Implementation of requirements on Priority substances within the context of the Water Framework Directive. Prioritization process: Monitoring-based ranking.
30) IPCS INCHEM. (n.d.). OECD Screening Information DataSet (SIDS) High Production Volume Chemicals.
Retrieved Feb 4, 2013, from INCHEM, Chemical Safety Information from Intergovernmental Organizations: http://www.inchem.org/pages/sids.html
31) Klimisch, H., Andreae, M., & Tillmann, U. (1997). A Systematic Approach for Evaluating the Quality of Experimental Toxicological and Ecotoxicological Data. Regulatory Toxicology and Pharmacology , 25 (1),
1-5. 32) Klopman, G., & Zhu, H. (2001). Estimation of the aqueous solubility of organic molecules by the group
contribution approach. J. Chem. Inform. Comput. Sci. , 41, 439-445. 33) Klopman, G., Li, J., Wang, S., & Dimayuga, M. (1994). Computer automated log P calculations based on an
extended group contribution approach. J. Chem. Inform. Comput. Sci. , 34, 752-781. 34) Kühne R, E. R.-U. (2007). Estimation of compartmental half-lives of organic compounds - structural
similarity versus EPI-Suite. QSAR Comb. Science , 26: 542-549. 35) Kühne R, Ebert R-U, Schüürmann G. . (2007). Estimation of compartmental half-lives of organic
compounds - structural similarity versus EPI-Suite. QSAR Comb. Sci. (26), 542-549. 36) Kühne R, Ebert R-U, Schüürmann G. (2009). Chemical domain of QSAR models from atom-centered
fragments. J. Chem. Inf. Model. , 96, 2660-2669. 37) Kühne R, Ebert R-U, Schüürmann G. (2006). Model selection based on structural similarity – method
description and application to water solubility prediction. J. Chem. Inf. Model. , 46, 636-641. 38) Kühne, R., R.-U. Ebert, et al. (2013). Read-across prediction of the acute toxicity of organic compounds
toward the water flea Daphnia magna. Molecular Informatics , 32, 108-120. 39) Küster, A. et al. (2009). Regulatory demands on data quality for the environmental risk assessment of
pharmaceuticals. Regulatory Toxicology and Pharmacology , 55 (3), 276-280. 40) LANUV NRW, V. F. (2010). Identification of River Basin Specific Pollutants in Germany - NORMAN - JRC
Workshop on River Basin Specific Pollutants: Identification and Monitoring, 10-11 June 2010, Stresa. 41) Liess, M., & von der Ohe, P. C. (2005). Analyzing effects of pesticides on invertebrate communities in
streams. Environmental Toxicology and Chemistry , 24 (4), 954-965. 42) Mackay D., P. S. (1991). Evaluating the multimedia fate of organic chemicals: A level III fugacity model.
Environ Sci Technol , 25: 427–436. 43) Marrero, J., & Gani, R. (2002). Group-contribution-based estimation of octanol/water partition coefficient
and aqueous solubility. Ind. Eng. Chem. Res. , 41, 6623-6633. 44) Mensink, B., Smit, C., & Montforts, M. (2008). Manual for summarizing and evaluating aspects of plant
protection products. 45) Meylan, W., Howard, P., & Boethling, R. (1996). Improved method for estimating water solubility from
46) Moermond, C., Janssen, M., de Knecht, J., Montfort, M., Peijnenburg, W., Zweers, P., et al. (2011). PBT Assessement using revised Annex XIII of REACH: a comparison with other regulatory frameworks. Integrated Environmental Assessment and Management , 8 (2), 359-371.
47) OSPAR. (2006). Dynamic Selection and Prioritisation Mechanism for Hazardous Substances – New Dynamec Manual.
48) Papa, E. and P. Gramatica. (2010). QSPR as a support for the EU REACH regulation and rational design of environmentally safer chemicals: PBT identification from molecular structure. Green Chemistry , 12 (5), 836-843.
49) PPDB, Hertfordshire University. (n.d.). PPDB - Pesticide Properties Database. Retrieved Jan 25, 2013, from PPDB website: http://sitem.herts.ac.uk/aeru/footprint/index2.htm
50) Rasmussen, J. J., & Wiberg-Larsen, P. (2012). Stream habitat structure influences macroinvertebrate response to pesticides. Environ Pollut , 164, 142-149.
51) RIVM. (2011). Identifying potential POP and PBT substances - Development of a new Persistence/Bioaccumulation-score. National Institute for Public Health and the Environment - Report 601356001/2011.
52) Sabljic A, Güsten H, Verhaar H, Hermens J. (1996). QSAR modelling of soil sorption. Improvements and systematics of log Koc vs log Kow correlations. Chemosphere , 33, 2577.
Page 70 NORMAN Network http://www.norman-network.net
N° W604002510
53) Sabljic A, Güsten H, Verhaar H, Hermens J. (1995). QSAR modelling of soil sorption. Improvements and systematics of log Koc vs. log Kow correlations. Chemosphere (31), 4489-4514.
54) Schafer, R. B., P. von der Ohe, et al. . (2012). Thresholds for the effects of pesticides on invertebrate communities and leaf breakdown in stream ecosystems. Environ Sci Technol. , 46 (9), 5134-5142.
55) Schafer, R. B., V. Pettigrove, et al. . (2011). Effects of Pesticides Monitored with Three Sampling Methods in 24 Sites on Macroinvertebrates and Microorganisms. Environ Sci Technol. , 45 (4), 1665-1672.
56) Schafer, R. B., T. Caquet, et al. (2007). Effects of pesticides on community structure and ecosystem functions in agricultural streams of three biogeographical regions in Europe. Science of the Total Environment 382(2-3): , 382 (2-3), 272-285.
57) Schneider, K. et al. (2009). “ToxRTool”, a new tool to assess the reliability of toxicological data. Toxicology Letters , 189 (2), 138–144.
58) Schüürmann, G. R. (2011). Quantitative Read-Across for Predicting the Acute Fish Toxicity of Organic Compounds. Environ Sci Technol , 45(10): 4616-4622.
59) Slobodnik, J., L. Mrafkova, et al. (2012). Identification of river basin specific pollutants and derivation of environmental quality standards: A case study in the Slovak Republic. Trends in Analytical Chemistry , 41, 133-145.
60) Stockholm Convention (2011). Geneva, Switzerland: UNECE. http://chm.pops.int/Convention/ConventionText/tabid/2232/Default.aspx.
61) Strempel, S., Scheringer, M., Carla, A. N., & Hungerbuhler, K. (2012). Screening for PBT Chemicals among the “Existing” and “New” Chemicals of the EU dx.doi.org/10.1021/es3002713. Environ. Sci. Technol. , 46, 5680−5687.
62) Tekto, I., Tanchuk, V., Kascheva, T., & Villa, A. (2001). Estimation of aqueous solubility of chemical compounds using E- state indices. J. Chem. Inform. Comput. Sci. , 41, 1488-1493.
63) Tomlin, C. D. S. (2003). The pesticide manual, a world compendium . Hampshire, UK: BCPC Publications. 64) UK Environment Agency. (2007). Prioritising chemicals for standard derivation under Annex VIII of the
Water Framework Directive. Science Report –SC040038/SR. 65) UNECE. (1998). Protocol to the 1979 Convention on Long-range transboundary air pollution on persistent
organic pollutants. Available at http://www.unece.org/fileadmin/DAM/env/lrtap/full%20text/1998.POPs.e.pdf. Geneva, Switzerland: United Nations Economic Commission for Europe.
66) USEPA. (2008). ECOTOX 4.0 Ecotoxicology Database. Retrieved Feb 4, 2013, from ECOTOX Database: http://cfpub.epa.gov/ecotox
67) van Leeuwen, C., van der Zandt, P., Aldenberg, T., Verhaar, H., & Hermens, J. (1992). Application of QSARs, extrapolation and equilibrium partitioning in aquatic effects assessment. 1. Narcotic industrial pollutants. Environ. Toxicol. Chem. , 11, 267-282.
68) Veit, G., de Foe, D., & Bergstaed, D. (1979). Measuring and estimating the bioconcentration factor of chemicals in fish. J. Fish Res. Board Can. (36), 1040-1048.
69) von der Ohe, P. C. (2011). A new risk assessment approach for the prioritization of 500 classical and emerging organic microcontaminants as potential river basin specific pollutants under the European Water Framework Directive. Science of the Total Environment , 409(11): 2064-2077.
70) von der Ohe, P. C., R. Kuhne, et al. (2005). Structural alerts - A new classification model to discriminate excess toxicity from narcotic effect levels of organic compounds in the acute daphnid assay. Chemical Research in Toxicology , 18 (3), 536-555.
71) Wang, R., Gao, Y., & Lai, L. (2000). Calculating partition coefficient by atom-additive method. Perspect. Drug. Discovery Des. , 19, 47-66.
72) Zwart, D. D. (2002). Observed regularities in species sensitivity distributions for aquatic species. In L. Posthuma, G. Suter, & T. Traas, Species-Sensitivity Distributions in Ecotoxicology (pp. 133-154). Boca