23
September, 2016 North America Canada, USA and Mexico: Working Together for a Promising Future
| Date post: | 15-Apr-2017 |
| Category: |
Business |
| Upload: | juan-saldivar-v-wuthenau |
| View: | 247 times |
| Download: | 1 times |
September, 2016
North AmericaCanada, USA and Mexico: Working Together for a Promising Future

Content
GEOGRAPHY
ECONOMY
REGIONALISM
INTEGRATION
INTRA-REGIONALTRADE
MACHINERYAND ELECTRICAL
CONNECTEDSOCIETY
THE LEADERS’PERSPECTIVE
COMPETITIVENESS
LABOR MARKET
AUTOMOTIVE
AEROSPACE
AGRICULTURE
TOURISM
DEMOGRAPHY
EDUCATION
ENTREPRENEURSHIP
ENERGY
BORDER
TPP
1Source: 1) World Atlas, 2016. 2) World Bank, 2016. 3) CIA World Factbook, 2016.
of globalreserves330%
of world’sforests218%
Coal
Woods
Territory SizeEurope2.4x
of theworld212%
Arable Land
of globalreserves314%
Oil
= times world’sper capita average24x
Fresh Water
OUR REGION IS GEOGRAPHICALLY AND RESOURCE PRIVILEGED
China + India + Brazil1
GEOGRAPHY
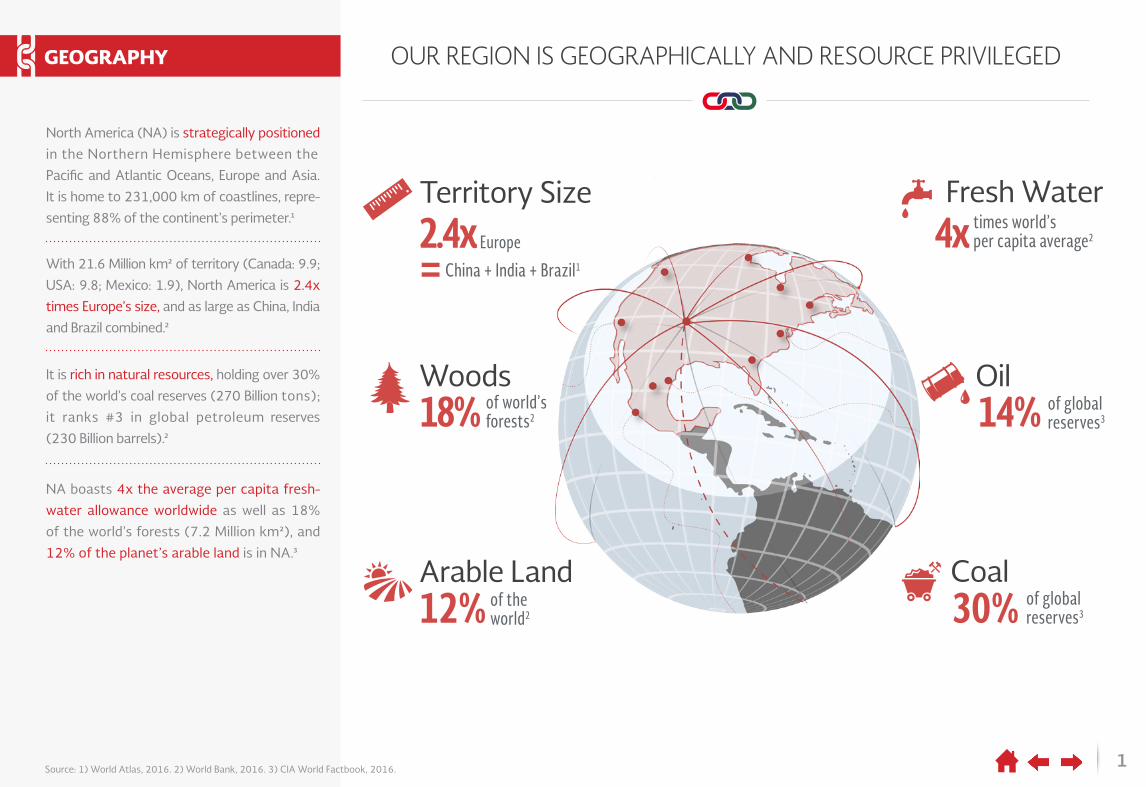
North America (NA) is strategically positioned
in the Northern Hemisphere between the
Pacific and Atlantic Oceans, Europe and Asia.
It is home to 231,000 km of coastlines, repre-
senting 88% of the continent’s perimeter.1
NA boasts 4x the average per capita fresh-
water allowance worldwide as well as 18%
of the world’s forests (7.2 Million km2), and
12% of the planet’s arable land is in NA.3
It is rich in natural resources, holding over 30%
of the world’s coal reserves (270 Billion tons);
it ranks #3 in global petroleum reserves
(230 Billion barrels).2
With 21.6 Million km2 of territory (Canada: 9.9;
USA: 9.8; Mexico: 1.9), North America is 2.4x
times Europe’s size, and as large as China, India
and Brazil combined.2
2Source: SAI Law and Economics with information from the World Bank, 2015. * The European Union considered as a single economy.
World Rankings*(2015)
ExportsGDP
TRADE MAKES US ONE OF THE STRONGEST ECONOMIC REGIONS
1 3
7 7
11 11
ECONOMY
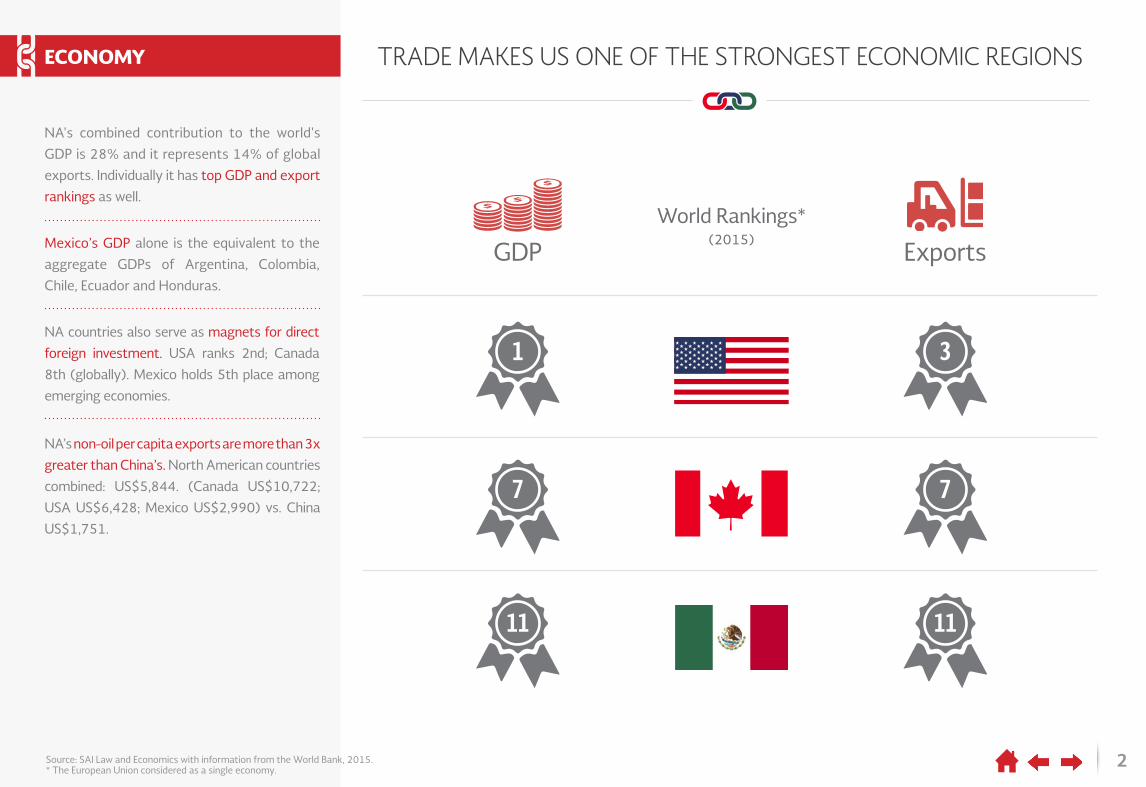
NA's combined contribution to the world's
GDP is 28% and it represents 14% of global
exports. Individually it has top GDP and export
rankings as well.
Mexico’s GDP alone is the equivalent to the
aggregate GDPs of Argentina, Colombia,
Chile, Ecuador and Honduras.
NA’s non-oil per capita exports are more than 3x
greater than China’s. North American countries
combined: US$5,844. (Canada US$10,722;
USA US$6,428; Mexico US$2,990) vs. China
US$1,751.
NA countries also serve as magnets for direct
foreign investment. USA ranks 2nd; Canada
8th (globally). Mexico holds 5th place among
emerging economies.
3
VALUE CHAINS HAVE BECOME MORE REGIONAL THAN GLOBAL
Source: SAI Law and Economics with information from: 1) Secretariat of Economy of Mexico (TradeMap, 2015). 2) COMTRADE, 2015. 3) WTO, 2015. 4) WTO, “World Trade Report, 2011- The WTO and Preferential Trade Agreements: From coexistance to coherence”, 2011. 5) World Trade Organization, 2016.
More than 50% of World Trade: Regional Trade Agreements5
is intra-regional(2014)3
42
1994 2016
+6x 279
of merchandise happens underpreferential trade agreements(2008)4
is of intermediategoods (2015)2
REGIONALISM
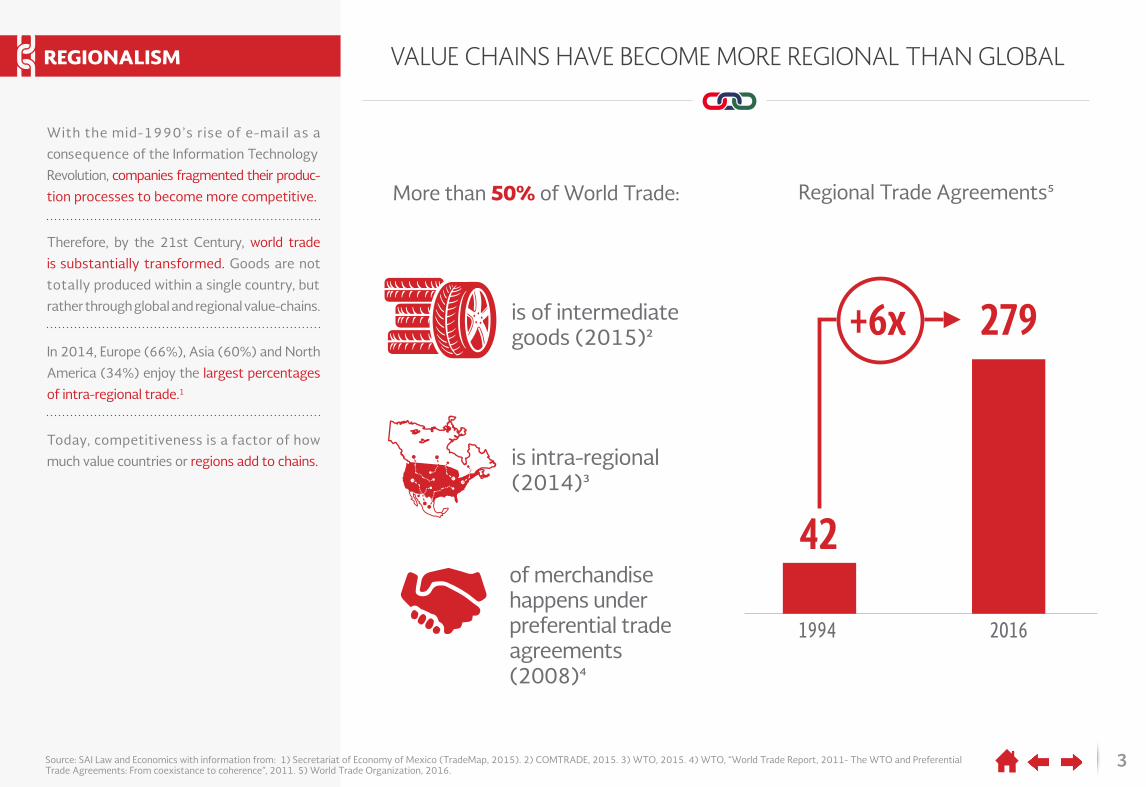
With the mid-1990’s rise of e-mail as a
consequence of the Information Technology
Revolution, companies fragmented their produc-
tion processes to become more competitive.
In 2014, Europe (66%), Asia (60%) and North
America (34%) enjoy the largest percentages
of intra-regional trade.1
Therefore, by the 21st Century, world trade
is substantially transformed. Goods are not
totally produced within a single country, but
rather through global and regional value-chains.
Today, competitiveness is a factor of how
much value countries or regions add to chains.
4Source: SAI Law and Economics with information from the World Bank, 2015. * Tn = Trillion, Bn = Billion, K = Thousands.
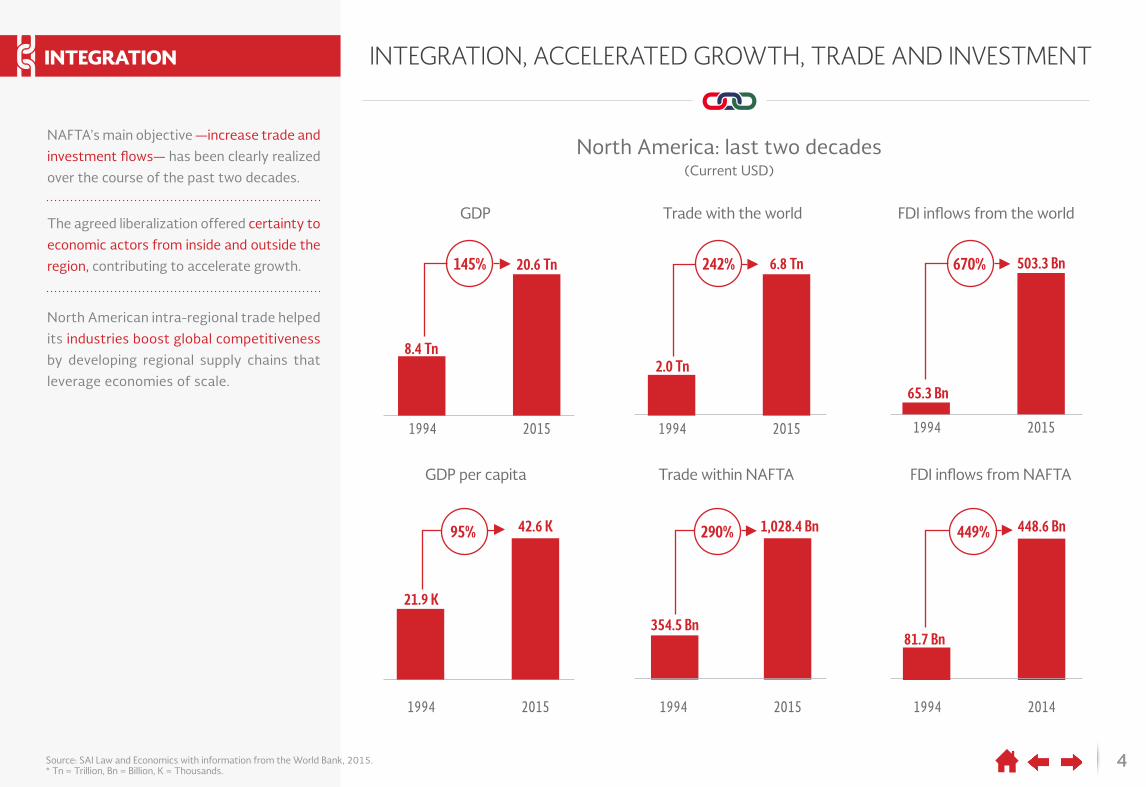
INTEGRATION, ACCELERATED GROWTH, TRADE AND INVESTMENT
North America: last two decades(Current USD)
GDP
1994 2015
20.6 Tn145%
8.4 Tn
Trade within NAFTA
1994 2015
1,028.4 Bn290%
354.5 Bn
FDI inflows from the world
1994 2015
503.3 Bn670%
65.3 Bn
FDI inflows from NAFTA
1994 2014
448.6 Bn449%
81.7 Bn
GDP per capita
1994 2015
42.6 K95%
21.9 K
Trade with the world
1994 2015
6.8 Tn242%
2.0 Tn
INTEGRATION
NAFTA’s main objective —increase trade and
investment flows— has been clearly realized
over the course of the past two decades.
North American intra-regional trade helped
its industries boost global competitiveness
by developing regional supply chains that
leverage economies of scale.
The agreed liberalization offered certainty to
economic actors from inside and outside the
region, contributing to accelerate growth.
5Source: 1) Koopman et al., “Give Credit where Credit is Due: Tracing Value Added in Global Production Chains”, National Bureau of Economic Research, 2010. 2) U.S. Energy Information (EIA), U.S. Imports by country of origin, Total crude oil and products, Historic data, 2015-2016. Data Analisis SENER with base info: U.S. Imports country origin. 3) INEGI, 2016. 4) SAI Law and Economics with data from World Integrated Trade Solutions (WITS), 2015. 5) SAI Law and Economics with information from the Secretariat of Economy of Mexico (TradeMap, 2015).
“MADE IN NORTH AMERICA”: JOINING FORCES TO PRODUCE
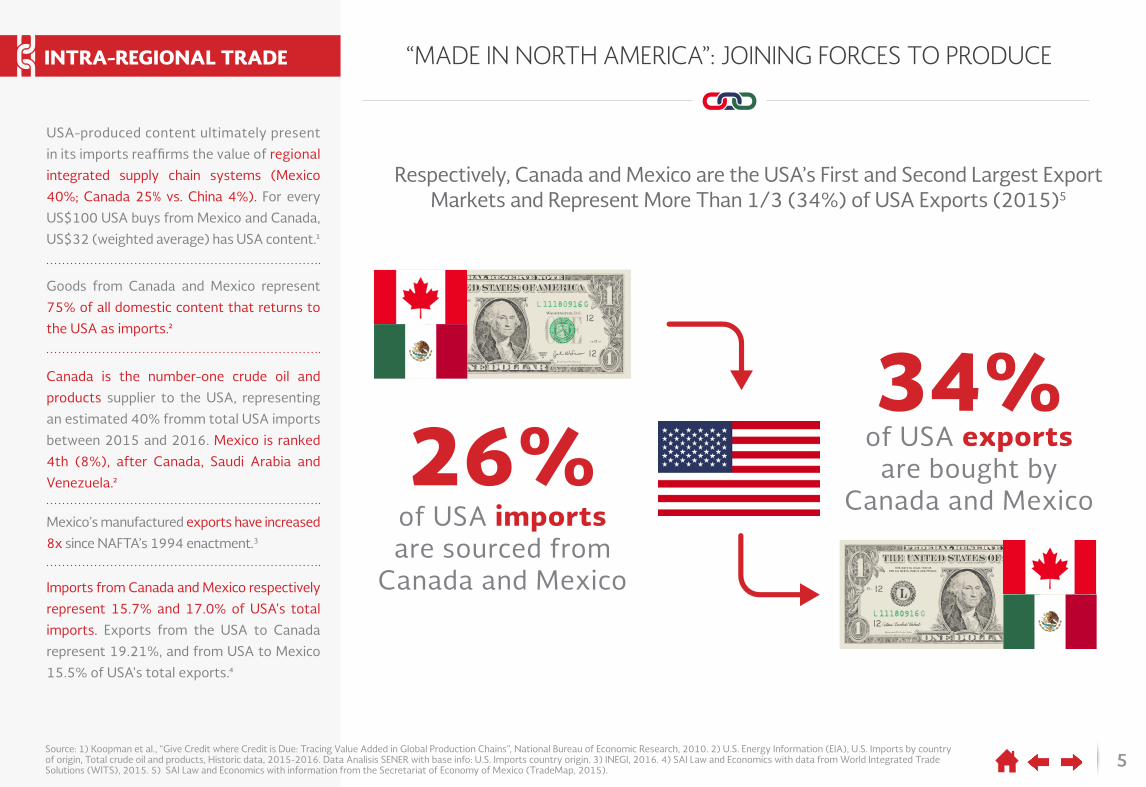
of USA importsare sourced from
Canada and Mexico
of USA exportsare bought by
Canada and Mexico
Respectively, Canada and Mexico are the USA’s First and Second Largest Export Markets and Represent More Than 1/3 (34%) of USA Exports (2015)5
INTRA-REGIONAL TRADE
Canada is the number-one crude oil and
products supplier to the USA, representing
an estimated 40% fromm total USA imports
between 2015 and 2016. Mexico is ranked
4th (8%), after Canada, Saudi Arabia and
Venezuela.2
Imports from Canada and Mexico respectively
represent 15.7% and 17.0% of USA's total
imports. Exports from the USA to Canada
represent 19.21%, and from USA to Mexico
15.5% of USA's total exports.4
Goods from Canada and Mexico represent
75% of all domestic content that returns to
the USA as imports.2
Mexico’s manufactured exports have increased
8x since NAFTA’s 1994 enactment.3
USA-produced content ultimately present
in its imports reaffirms the value of regional
integrated supply chain systems (Mexico
40%; Canada 25% vs. China 4%). For every
US$100 USA buys from Mexico and Canada,
US$32 (weighted average) has USA content.1
26%34%
6
MEXICO/CANADA: USA’S MOST COMPETITIVE PRODUCTION CHOICE
Business Costs Advantage Relative to the USA (within a group of developed economies)3
Source: 1) Deloitte Touche Tohmatsu Limited and US Council on Competitiveness, “Global Manufacturing Competitiveness Index”. Deloitte, 2016. 2) COFECE, 2016. 3) KPMG, “Competitive Alternatives: KPMG’s guide to international business locations costs”, 2016 edition.
COMPETITIVENESS
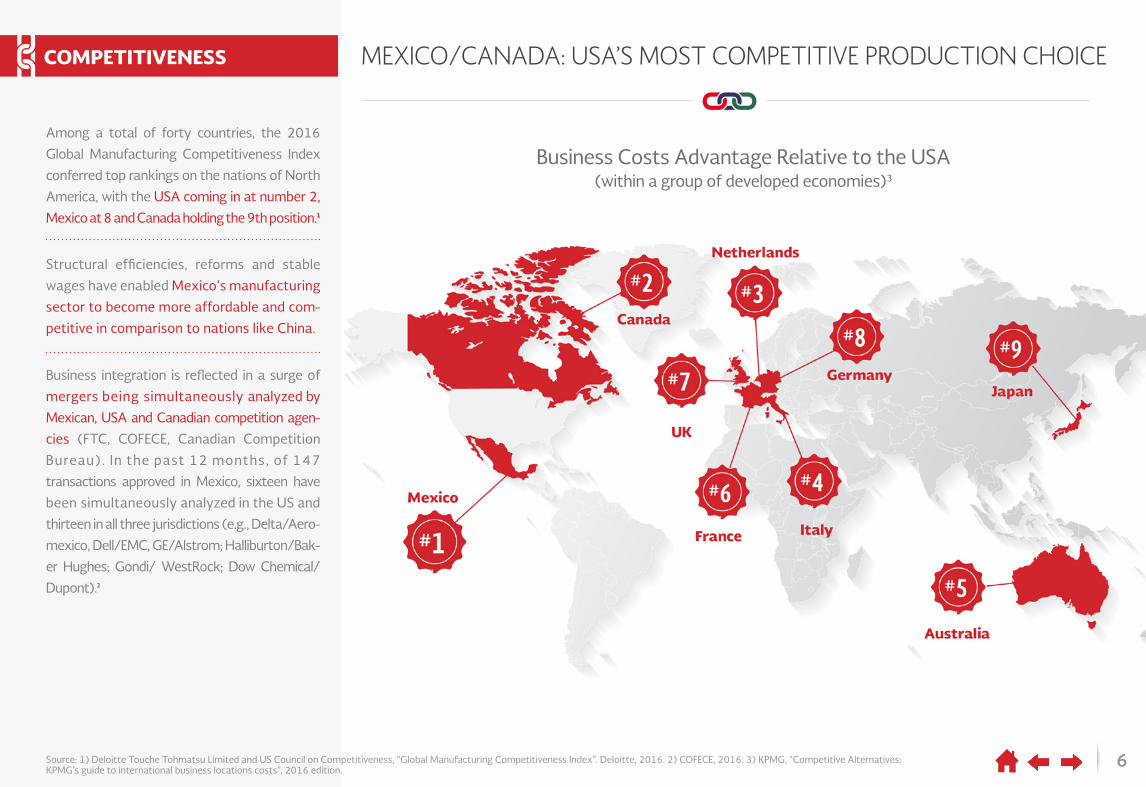
Among a total of forty countries, the 2016
Global Manufacturing Competitiveness Index
conferred top rankings on the nations of North
America, with the USA coming in at number 2,
Mexico at 8 and Canada holding the 9th position.1
Business integration is reflected in a surge of
mergers being simultaneously analyzed by
Mexican, USA and Canadian competition agen-
cies (FTC, COFECE, Canadian Competition
Bureau). In the past 12 months, of 147
transactions approved in Mexico, sixteen have
been simultaneously analyzed in the US and
thirteen in all three jurisdictions (e.g., Delta/Aero-
mexico, Dell/EMC, GE/Alstrom; Halliburton/Bak-
er Hughes; Gondi/ WestRock; Dow Chemical/
Dupont).2
Structural efficiencies, reforms and stable
wages have enabled Mexico’s manufacturing
sector to become more affordable and com-
petitive in comparison to nations like China.
7
INTRA-REGIONAL BUSINESS HAS BOOSTED JOBS CREATION
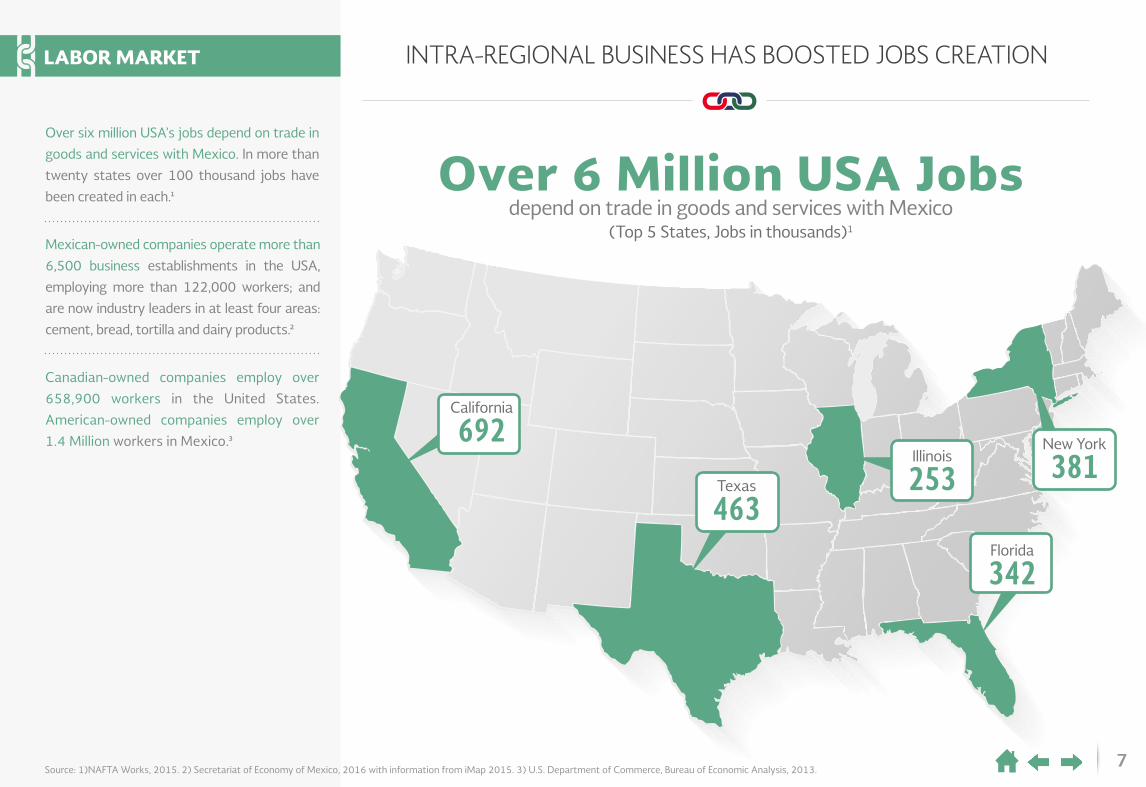
Over 6 Million USA Jobsdepend on trade in goods and services with Mexico
(Top 5 States, Jobs in thousands)1
California
692Texas
463
Illinois
253
Florida
342
New York
381
LABOR MARKET
Over six million USA’s jobs depend on trade in
goods and services with Mexico. In more than
twenty states over 100 thousand jobs have
been created in each.1
Canadian-owned companies employ over
658,900 workers in the United States.
American-owned companies employ over
1.4 Million workers in Mexico.3
Mexican-owned companies operate more than
6,500 business establishments in the USA,
employing more than 122,000 workers; and
are now industry leaders in at least four areas:
cement, bread, tortilla and dairy products.2
Source: 1)NAFTA Works, 2015. 2) Secretariat of Economy of Mexico, 2016 with information from iMap 2015. 3) U.S. Department of Commerce, Bureau of Economic Analysis, 2013.
8
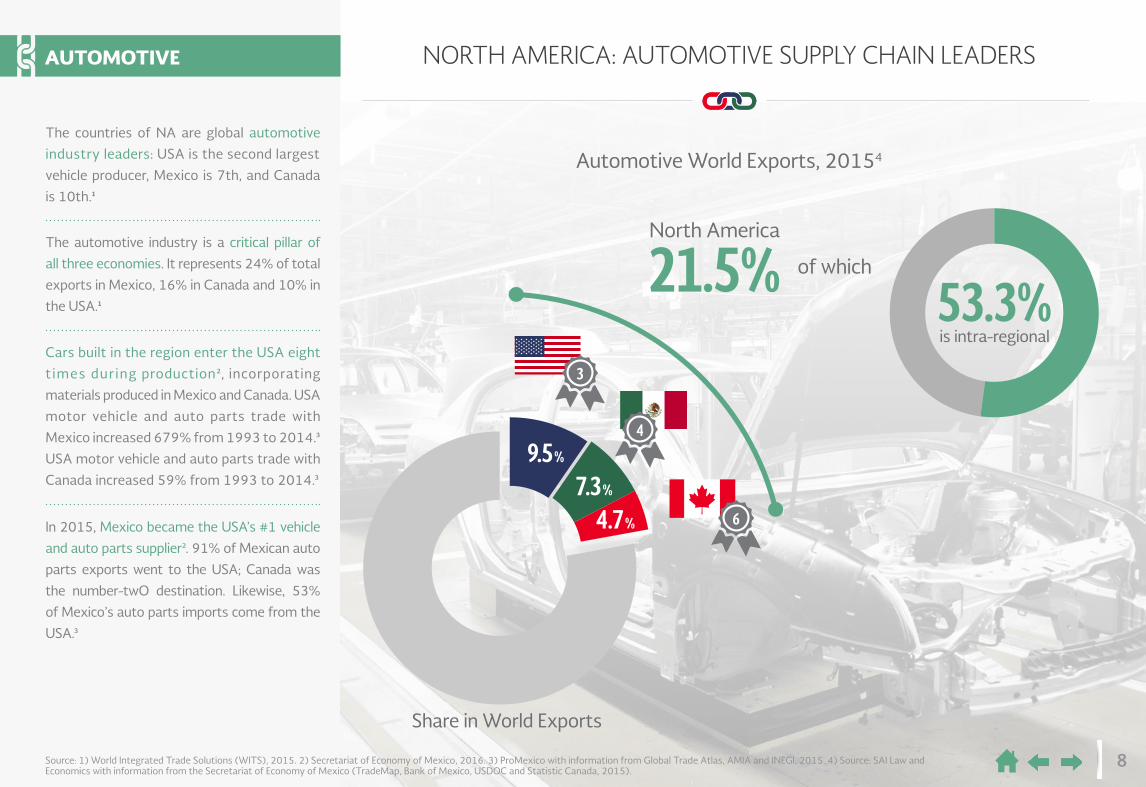
NORTH AMERICA: AUTOMOTIVE SUPPLY CHAIN LEADERS
9.5%
7.3%
4.7%
4
6
3
North America
21.5%
Automotive World Exports, 20154
53.3%is intra-regional
Share in World Exports
of which
AUTOMOTIVE
The countries of NA are global automotive
industry leaders: USA is the second largest
vehicle producer, Mexico is 7th, and Canada
is 10th.1
Cars built in the region enter the USA eight
t imes during production2, incorporating
materials produced in Mexico and Canada. USA
motor vehicle and auto parts trade with
Mexico increased 679% from 1993 to 2014.3
USA motor vehicle and auto parts trade with
Canada increased 59% from 1993 to 2014.3
The automotive industry is a critical pillar of
all three economies. It represents 24% of total
exports in Mexico, 16% in Canada and 10% in
the USA.1
In 2015, Mexico became the USA’s #1 vehicle
and auto parts supplier2. 91% of Mexican auto
parts exports went to the USA; Canada was
the number-twO destination. Likewise, 53%
of Mexico’s auto parts imports come from the
USA.3
Source: 1) World Integrated Trade Solutions (WITS), 2015. 2) Secretariat of Economy of Mexico, 2016. 3) ProMexico with information from Global Trade Atlas, AMIA and INEGI, 2015. 4) Source: SAI Law and Economics with information from the Secretariat of Economy of Mexico (TradeMap, Bank of Mexico, USDOC and Statistic Canada, 2015).
8
9
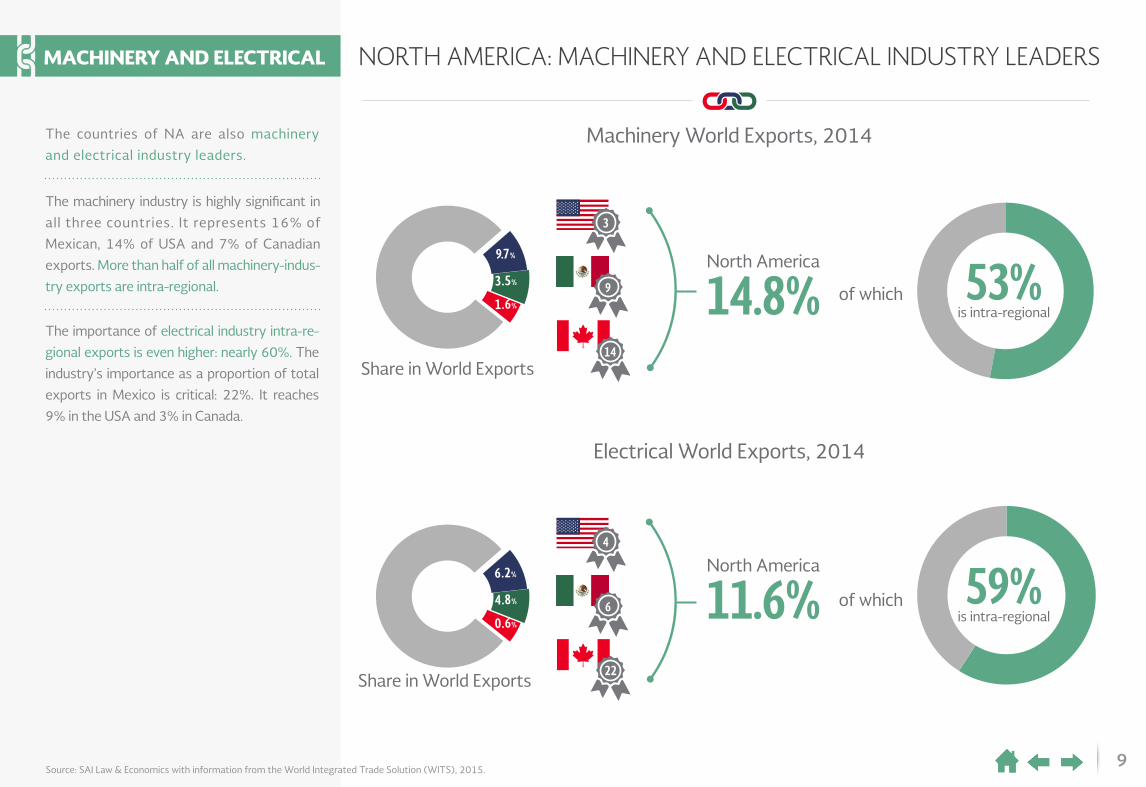
NORTH AMERICA: MACHINERY AND ELECTRICAL INDUSTRY LEADERS
Source: SAI Law & Economics with information from the World Integrated Trade Solution (WITS), 2015.
9.7%
6.2%
3.5%
4.8%
1.6%
0.6%
9
6
14
3
North America
14.8%
North America
11.6% of which
of which
Share in World Exports
Share in World Exports
Machinery World Exports, 2014
Electrical World Exports, 2014
53%is intra-regional
59%is intra-regional
22
MACHINERY AND ELECTRICAL
The countries of NA are also machinery
and electrical industry leaders.
The importance of electrical industry intra-re-
gional exports is even higher: nearly 60%. The
industry’s importance as a proportion of total
exports in Mexico is critical: 22%. It reaches
9% in the USA and 3% in Canada.
The machinery industry is highly significant in
all three countries. It represents 16% of
Mexican, 14% of USA and 7% of Canadian
exports. More than half of all machinery-indus-
try exports are intra-regional.
4
10
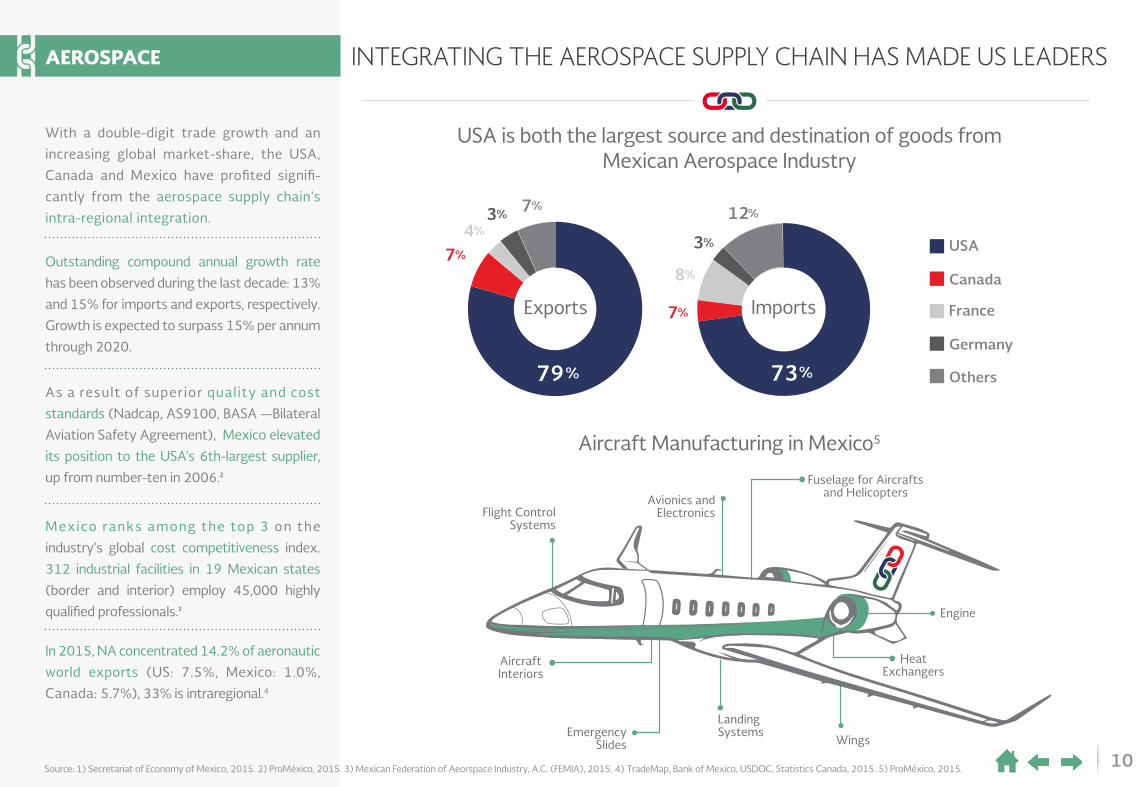
INTEGRATING THE AEROSPACE SUPPLY CHAIN HAS MADE US LEADERS
Source: 1) Secretariat of Economy of Mexico, 2015. 2) ProMéxico, 2015. 3) Mexican Federation of Aeorspace Industry, A.C. (FEMIA), 2015. 4) TradeMap, Bank of Mexico, USDOC, Statistics Canada, 2015. 5) ProMéxico, 2015.
Exports
USA is both the largest source and destination of goods fromMexican Aerospace Industry
Imports
79 73% %
7% 12%
7%
7%
3%
3%4%
8%
USA
Canada
Germany
Others
France
Aircraft Manufacturing in Mexico5
Flight ControlSystems
Engine
HeatExchangers
AircraftInteriors
EmergencySlides
LandingSystems
Wings
Avionics andElectronics
Fuselage for Aircraftsand Helicopters
AEROSPACE
With a double-digit trade growth and an
increasing global market-share, the USA,
Canada and Mexico have profited signifi-
cantly from the aerospace supply chain’s
intra-regional integration.
As a result of superior quality and cost
standards (Nadcap, AS9100, BASA —Bilateral
Aviation Safety Agreement), Mexico elevated
its position to the USA’s 6th-largest supplier,
up from number-ten in 2006.2
Outstanding compound annual growth rate
has been observed during the last decade: 13%
and 15% for imports and exports, respectively.
Growth is expected to surpass 15% per annum
through 2020.
Mexico ranks among the top 3 on the
industry’s global cost competitiveness index.
312 industrial facilities in 19 Mexican states
(border and interior) employ 45,000 highly
qualified professionals.3
In 2015, NA concentrated 14.2% of aeronautic
world exports (US: 7.5%, Mexico: 1.0%,
Canada: 5.7%), 33% is intraregional.4
11Source: 1) TradeMap, 2015. 2) TradeMap, Banxico, USDOC, Statistics Canada, 2015. 3) Citizenship and Immigration Canada, 2015. 4) Food and Agriculture Organization of the United Nations, Statistics Division, 2014. 5) SAGARPA, 2016. 6) World Trade Organization, 2014.
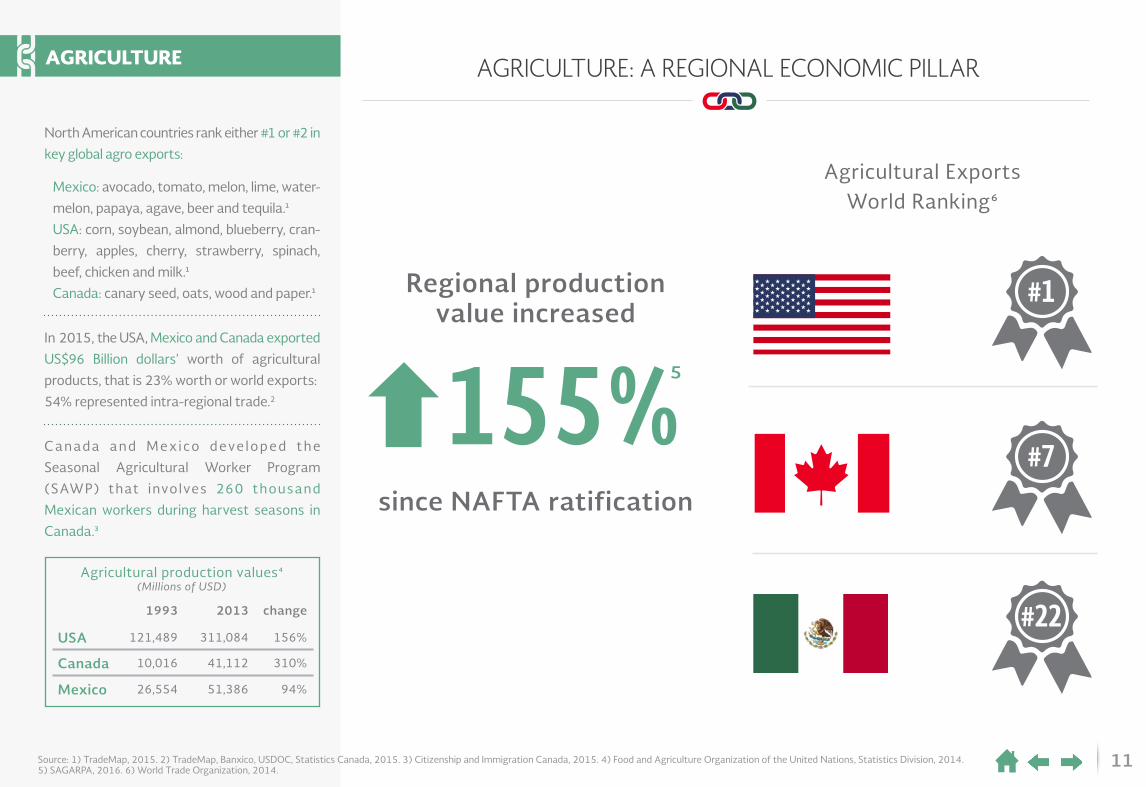
AGRICULTURE: A REGIONAL ECONOMIC PILLAR
Regional productionvalue increased
since NAFTA ratification
Agricultural ExportsWorld Ranking6
#1
#7
#22
155%5
AGRICULTURE
1993 2013 change
USA 121,489 311,084 156%
Canada 10,016 41,112 310%
Mexico 26,554 51,386 94%
Agricultural production values4 (Millions of USD)
North American countries rank either #1 or #2 in
key global agro exports:
Mexico: avocado, tomato, melon, lime, water-
melon, papaya, agave, beer and tequila.1
USA: corn, soybean, almond, blueberry, cran-
berry, apples, cherry, strawberry, spinach,
beef, chicken and milk.1
Canada: canary seed, oats, wood and paper.1
In 2015, the USA, Mexico and Canada exported
US$96 Billion dollars’ worth of agricultural
products, that is 23% worth or world exports:
54% represented intra-regional trade.2
Canada and Mexico deve loped the
Seasonal Agricultural Worker Program
(SAWP) that involves 260 thousand
Mexican workers during harvest seasons in
Canada.3
12
TOURISM IS KEY IN NORTH AMERICA - NUMBERS REFLECT IT
International Tourists Global Tourism Ranking
WorldHeritage Sites2 Nature3 Culture3
10
6
16
3
8
10
5
21
16
GlobalRank*
Regional Tourists1
2
9
17
53%
US #1Canada #2
US #1Mexico #2
Canada #1Mexico#2
69%
71%
Source: 1) Secretariat of Tourism of Mexico, 2016. World Bank, 2015. 2) ProMéxico, 2015. 3) Secretariat of Tourism of Mexico, 2016. World Tourism Organization, 2014. 4) UNESCO, 2015. World Bank, 2014. 5) National Travel and Tourism Office, 2015.* Ranking for USA and Canada is from 2015, Ranking from Mexico is from 2016.
TOURISM
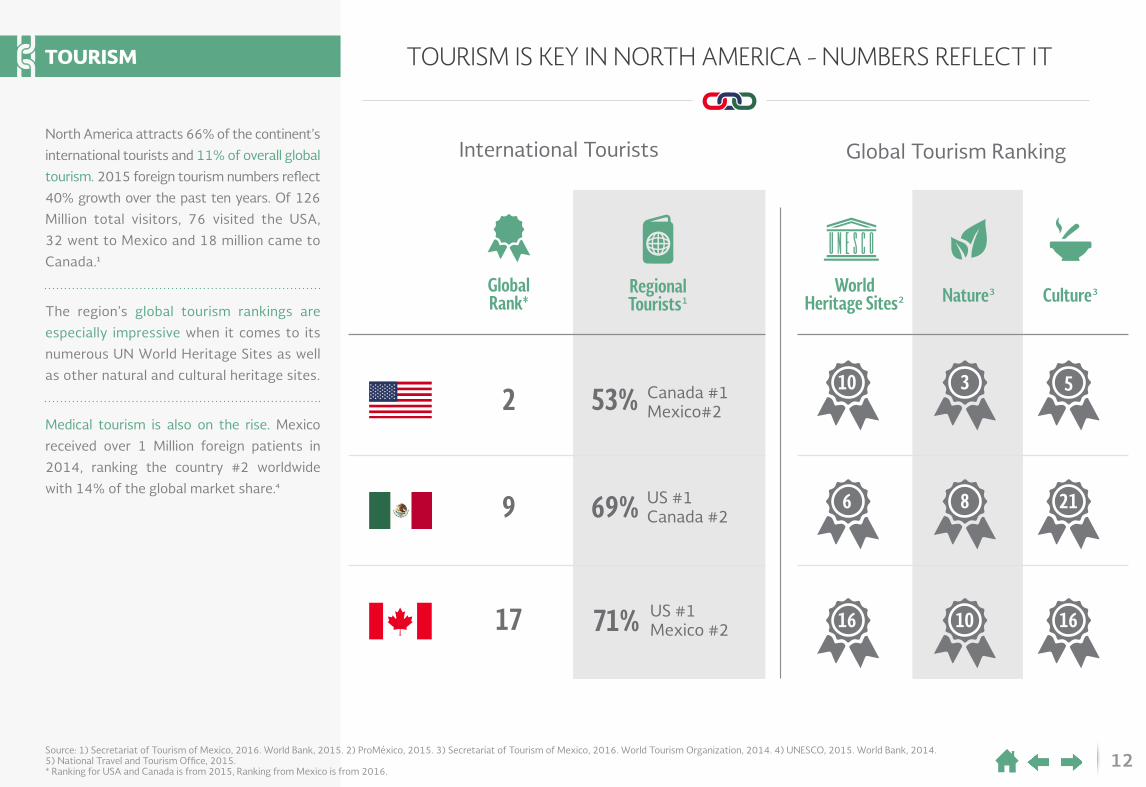
North America attracts 66% of the continent’s
international tourists and 11% of overall global
tourism. 2015 foreign tourism numbers reflect
40% growth over the past ten years. Of 126
Million total visitors, 76 visited the USA,
32 went to Mexico and 18 million came to
Canada.1
Medical tourism is also on the rise. Mexico
received over 1 Million foreign patients in
2014, ranking the country #2 worldwide
with 14% of the global market share.4
The region’s global tourism rankings are
especially impressive when it comes to its
numerous UN World Heritage Sites as well
as other natural and cultural heritage sites.
13
COMPLEMENTARY AGING STRENGTHEN FUTURE GROWTH
Mexico, USA and Canada Population by Age, 2030
66% 62% 61%Working Age
Population
6M 12M6M 12M0 0 02M 4M4M4M 8M 1M2M4M 8M 1M 2M
Ages85 or more
80 to 8475 to 7970 to 7465 to6960 to 6455 to 5950 to 5445 to 4940 to 4435 to 3930 to 3425 to 2920 to 2415 to 1910 to 14
5 to 9o to 4
Source: 1) United Nations Data, “Population Pyramid”, 2030. 2) INEGI, 2016. United States Census Bureau, “Interim Population Projections”, 2014-2060. Statistics Canada, “Census of Population”, 2011. CONAPO, “Datos de proyecciones”, 2010-2050. 3) CONAPO, “Population Projections”, 2010-2050. 4) United States Census Bureau, “Interim Population Projections”, 2014-2060. 5) United Nations Data, “Population Pyramid”, 2030.* M = Million.
2 3 4
2M
DEMOGRAPHY
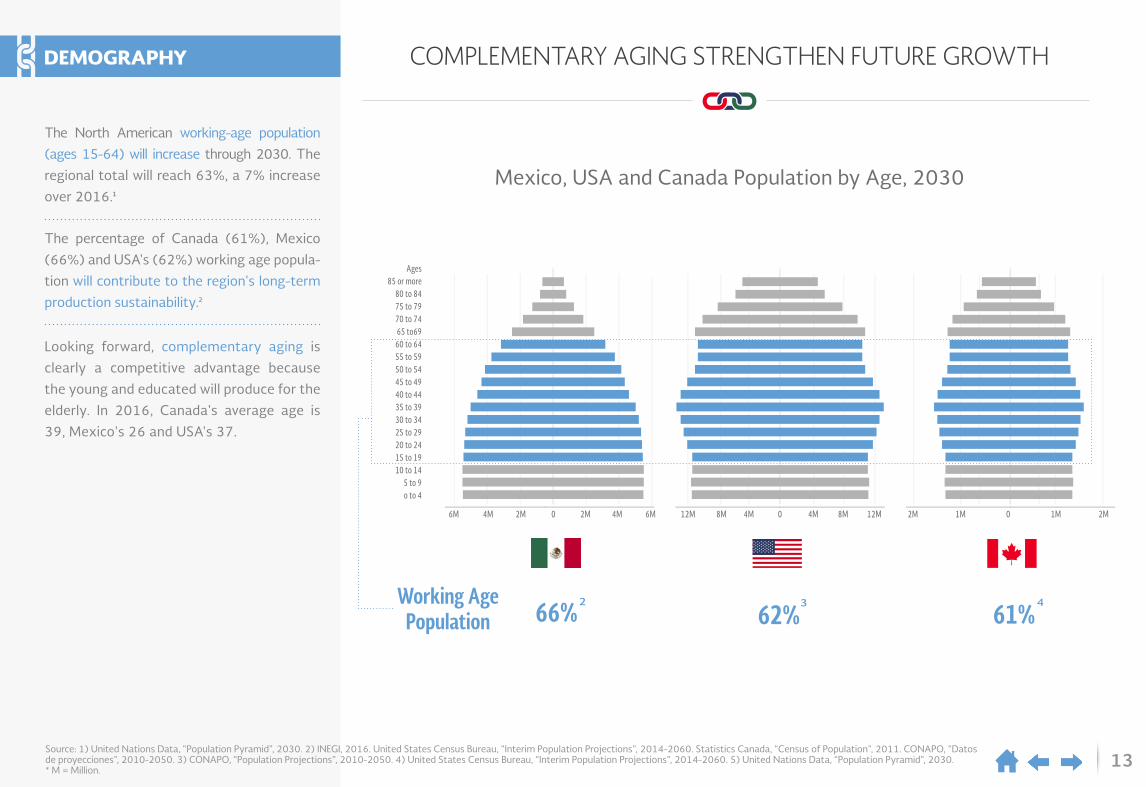
The North American working-age population
(ages 15-64) will increase through 2030. The
regional total will reach 63%, a 7% increase
over 2016.1
Looking forward, complementary aging is
clearly a competitive advantage because
the young and educated will produce for the
elderly. In 2016, Canada's average age is
39, Mexico's 26 and USA's 37.
The percentage of Canada (61%), Mexico
(66%) and USA's (62%) working age popula-
tion will contribute to the region's long-term
production sustainability.2
14
NORTH AMERICA: HIGHLY CONNECTED AND COMPETITIVE
Source: 1) ITU, “Internet World Stats”, 2016. 2) Dataxis, 2015, TMT Consulting, 2015. National Commission for the Protection and Defense of Users of Financial Services (CONDUSEF), 2015. 3) eMarketer, April 2016. 4) Dataxis, 2015. TMT Consulting, 2015. CONDUSEF, 2015. Secretariat of Communication and Transport of Mexico with data from INEGI, "Encuesta Nacional sobre Disponibilidad y Uso de Tec-nologías de Información en los Hogares", 2015.* Note: Total household penetration.
6257%
10032%
28188%
1412%
1233%
11927%
3393%
38280%
5147% 230
72% 2467%
29858%
Internet Users1(Millions)
Smartphones3(Millions)
*PayTV4(Millions)
CONNECTED SOCIETY
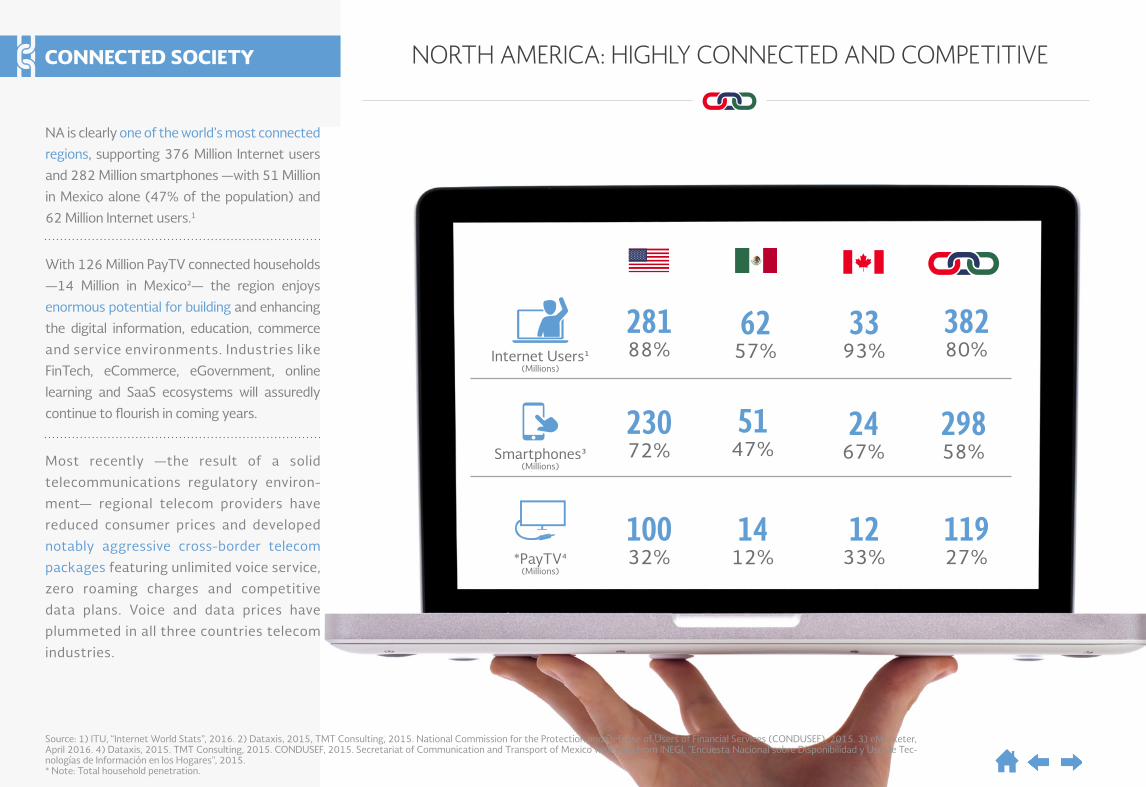
NA is clearly one of the world’s most connected
regions, supporting 376 Million Internet users
and 282 Million smartphones —with 51 Million
in Mexico alone (47% of the population) and
62 Million Internet users.1
Most recently —the result of a solid
telecommunications regulatory environ-
ment— regional telecom providers have
reduced consumer prices and developed
notably aggressive cross-border telecom
packages featuring unlimited voice service,
zero roaming charges and competitive
data plans. Voice and data prices have
plummeted in all three countries telecom
industries.
With 126 Million PayTV connected households
—14 Million in Mexico2— the region enjoys
enormous potential for building and enhancing
the digital information, education, commerce
and service environments. Industries like
FinTech, eCommerce, eGovernment, online
learning and SaaS ecosystems will assuredly
continue to flourish in coming years.
15
Korea
Poland
Czech Republic
United Kingdom
Netherlands
Germany
#7 USA
Spain
#9 Canada
#10 Mexico
NORTH AMERICA: MAJOR GLOBAL EDUCATION HUB
Engineering Graduates6(thousands)
Computer Science Graduates7(thousands)
Russia
Ukraine
Iran
South Korea
France
Japan
Vietnam
#8 Mexico
#9 USA
Indonesia
Per CapitaPer Capita TotalTotal
454
130
234
148
105
168
100
114
238
140
14
19
2
26
5
21
70
9
5
13
5.53.24.93.0
4.13.0
4.02.9
3.01.62.61.3
1.1 2.22.0
0.61.3
0.9
1.1
0.7
EDUCATION
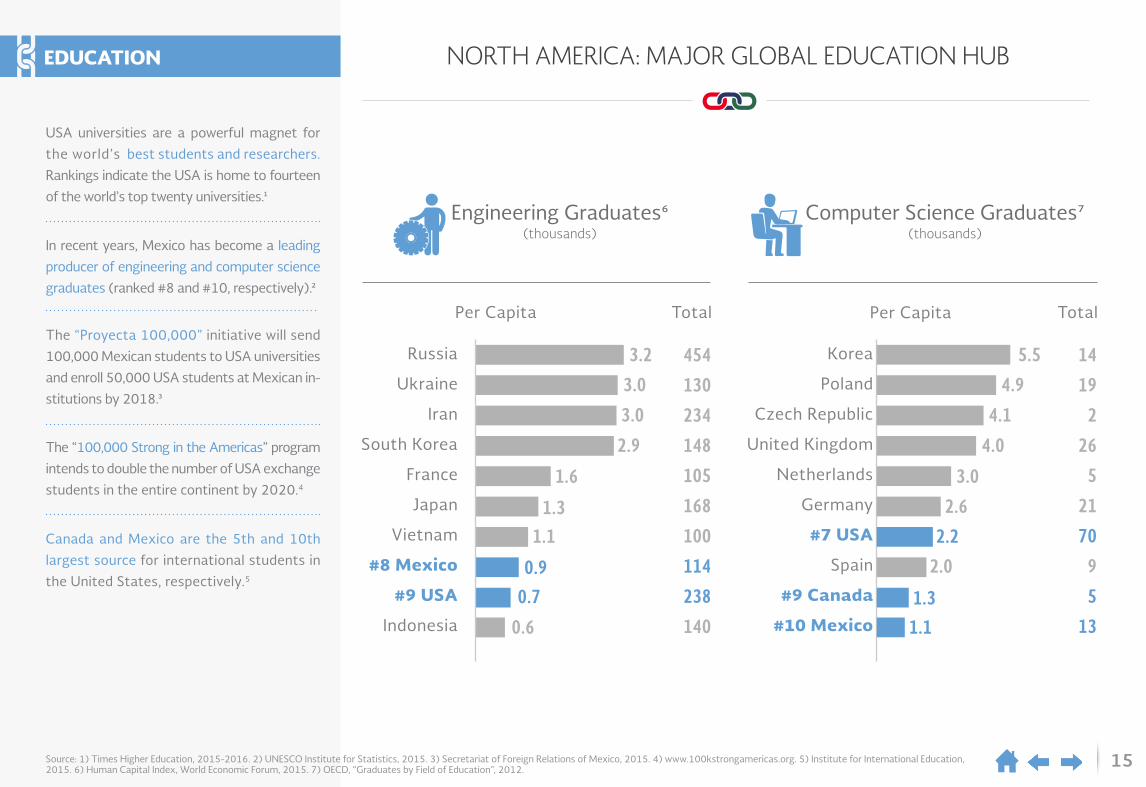
USA universities are a powerful magnet for
the world’s best students and researchers.
Rankings indicate the USA is home to fourteen
of the world’s top twenty universities.1
The “Proyecta 100,000” initiative will send
100,000 Mexican students to USA universities
and enroll 50,000 USA students at Mexican in-
stitutions by 2018.3
Canada and Mexico are the 5th and 10th
largest source for international students in
the United States, respectively.5
In recent years, Mexico has become a leading
producer of engineering and computer science
graduates (ranked #8 and #10, respectively).2
The “100,000 Strong in the Americas” program
intends to double the number of USA exchange
students in the entire continent by 2020.4
Source: 1) Times Higher Education, 2015-2016. 2) UNESCO Institute for Statistics, 2015. 3) Secretariat of Foreign Relations of Mexico, 2015. 4) www.100kstrongamericas.org. 5) Institute for International Education, 2015. 6) Human Capital Index, World Economic Forum, 2015. 7) OECD, “Graduates by Field of Education”, 2012.
16
0.0
0.2
0.4
0.6
0.8
1.0
1. Opportunity Perception
2. Startup Skills
3. Risk Acceptance
4. Networking
5. Cultural Support
6. Opportunity Startup
7. Technology Absorption
North AmericaWorld average 2015
8. Human Capital
9. Competition
10. Product Innovation
11. Process Innovation
12. High Growth
13. Internationalization
14. Risk Capital
North America Entrepreneurship Ecosystem3
FROM PRODUCING TO CREATING TOGETHERENTREPRENEURSHIP
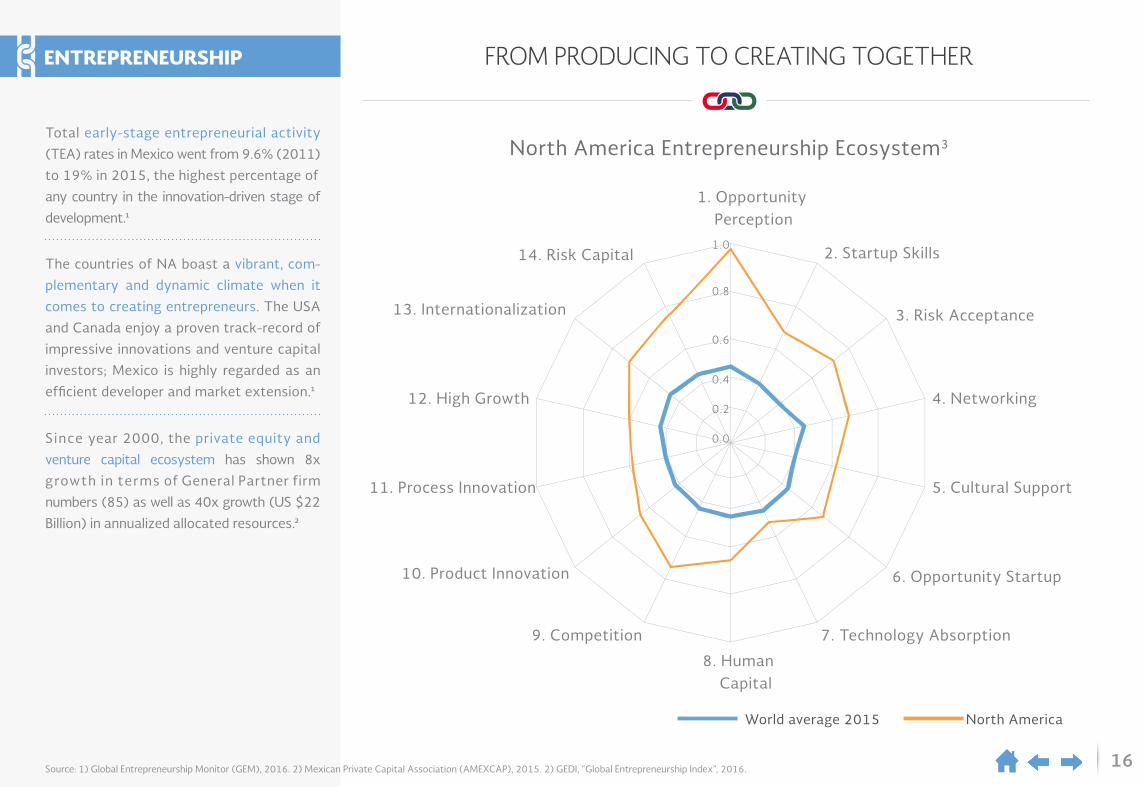
Total early-stage entrepreneurial activity
(TEA) rates in Mexico went from 9.6% (2011)
to 19% in 2015, the highest percentage of
any country in the innovation-driven stage of
development.1
The countries of NA boast a vibrant, com-
plementary and dynamic climate when it
comes to creating entrepreneurs. The USA
and Canada enjoy a proven track-record of
impressive innovations and venture capital
investors; Mexico is highly regarded as an
efficient developer and market extension.1
Since year 2000, the private equity and
venture capital ecosystem has shown 8x
growth in terms of General Partner firm
numbers (85) as well as 40x growth (US $22
Billion) in annualized allocated resources.2
Source: 1) Global Entrepreneurship Monitor (GEM), 2016. 2) Mexican Private Capital Association (AMEXCAP), 2015. 2) GEDI, “Global Entrepreneurship Index”, 2016.
17
NORTH AMERICA HAS COMPLEMENTARY ENERGY RESOURCES
Energy flows between Canada, Mexico and USA6
PetroleumCoke
NaturalGas
CrudeOil
Gasoline
LiquefiedNatural Gas
LiquefiedNatural Gas
Gasolineblending
components
UnfinishedOils
ENERGY
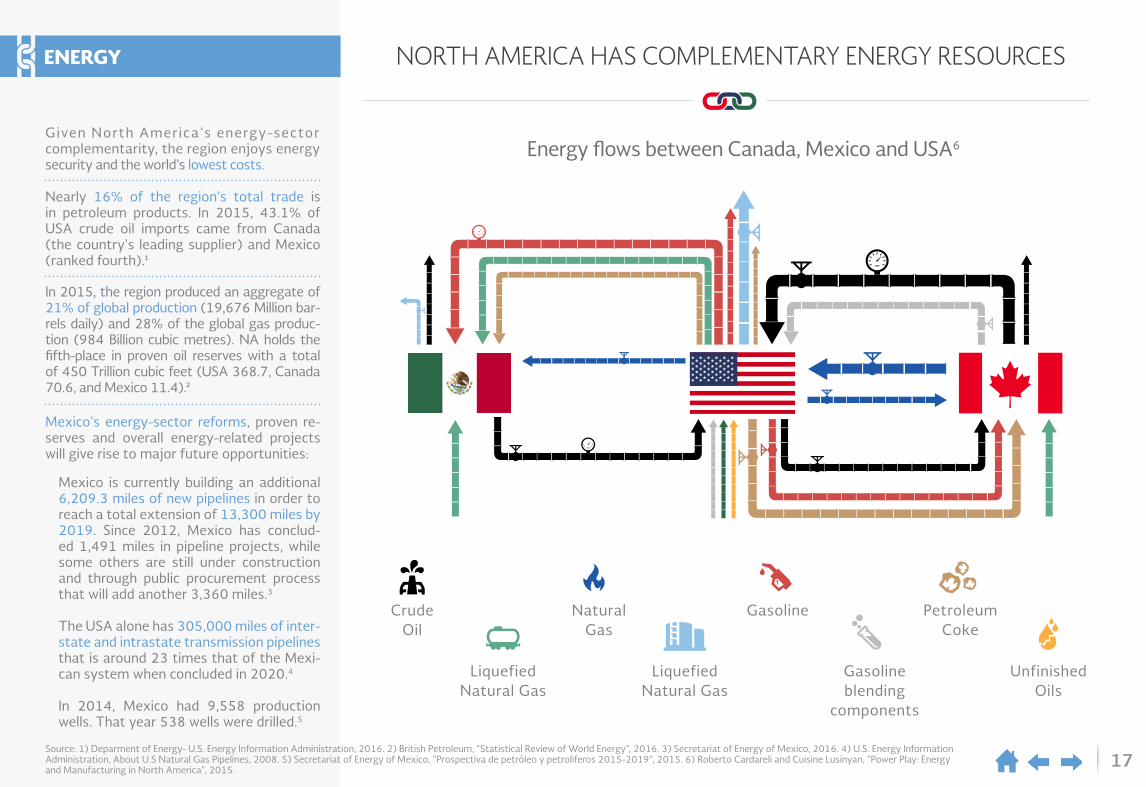
Given North America’s energy-sectorcomplementarity, the region enjoys energysecurity and the world’s lowest costs.
Nearly 16% of the region’s total trade is in petroleum products. In 2015, 43.1% of USA crude oil imports came from Canada (the country's leading supplier) and Mexico (ranked fourth).1
Mexico's energy-sector reforms, proven re-serves and overall energy-related projects will give rise to major future opportunities:
Mexico is currently building an additional 6,209.3 miles of new pipelines in order to reach a total extension of 13,300 miles by 2019. Since 2012, Mexico has conclud-ed 1,491 miles in pipeline projects, while some others are still under construction and through public procurement process that will add another 3,360 miles.3
The USA alone has 305,000 miles of inter-state and intrastate transmission pipelines that is around 23 times that of the Mexi-can system when concluded in 2020.4
In 2014, Mexico had 9,558 production wells. That year 538 wells were drilled.5
In 2015, the region produced an aggregate of 21% of global production (19,676 Million bar-rels daily) and 28% of the global gas produc-tion (984 Billion cubic metres). NA holds the fifth-place in proven oil reserves with a total of 450 Trillion cubic feet (USA 368.7, Canada 70.6, and Mexico 11.4).2
Source: 1) Deparment of Energy- U.S. Energy Information Administration, 2016. 2) British Petroleum, “Statistical Review of World Energy”, 2016. 3) Secretariat of Energy of Mexico, 2016. 4) U.S. Energy Information Administration, About U.S Natural Gas Pipelines, 2008. 5) Secretariat of Energy of Mexico, "Prospectiva de petróleo y petroliferos 2015-2019", 2015. 6) Roberto Cardareli and Cuisine Lusinyan, "Power Play: Energy and Manufacturing in North America", 2015.
18
BORDERS: A NEXUS OF INTEGRATION, CULTURE AND POTENTIAL
Tijuana/Tecate
San Diego
2.7
2.3
1.7
1.3
1.1
.9
.9
.71.2
1.3
2.1El Paso
Juarez
Phoenix
Houston
Albuquerque
San LuisRio Colorado
Chihuahua
Hermosillo
San Antonio
MonterreyReynosa
McAllen
Mexicali
Nogales
Tucson
Calexico/El Centro/Yuma
Matamoros
Brownsville
N. Laredo
LaredoPiedrasNegras
Ojinaga
PresidioCd.Acuña
Del RioAguaPrieta
Naco
Source: 1) Based on figures by Mexico´s National Statistics and Geography Institute (INEGI) and the US’ Customs and Border Protection (CBP), 2015. 2) Based on figures by the Bureau of Transportation Statistics of the US Department of Transportation, 2015. 3) SE-Washington with data from USDOT, BTS. 4) Cross Border Xpress, 2016. 5) CONAPO, “Population Projections”, 2010-2050. 6) Nielsen, “US Hispanic Popula-tion Estimates by DMA”, 2016.* CAGR = Compound Annual Growth Rate.
USA-Mexico Border Latino Population(millions, 2016)
Douglas
370 thousandvehicles
1 millionpeople
US $1 millionin products traded
every minute
Daily Border Crossings
BORDER
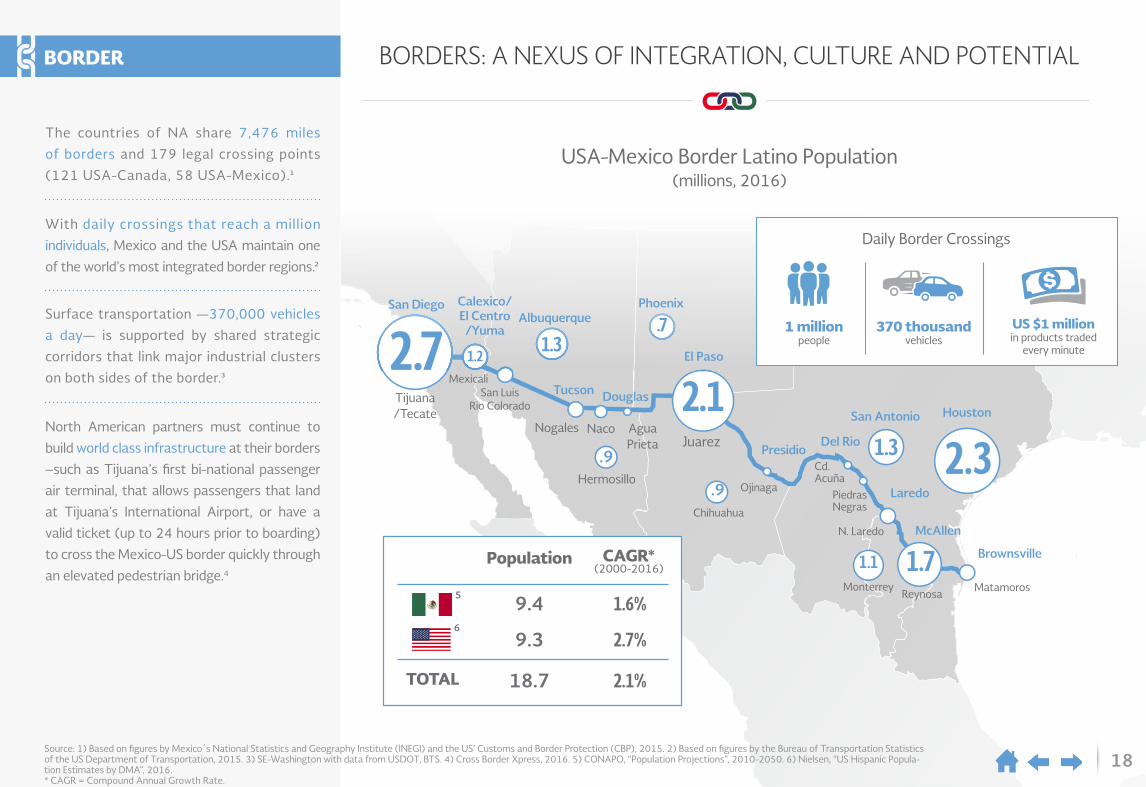
The countries of NA share 7,476 miles
of borders and 179 legal crossing points
(121 USA-Canada, 58 USA-Mexico).1
With daily crossings that reach a million
individuals, Mexico and the USA maintain one
of the world’s most integrated border regions.2
North American partners must continue to
build world class infrastructure at their borders
–such as Tijuana’s first bi-national passenger
air terminal, that allows passengers that land
at Tijuana’s International Airport, or have a
valid ticket (up to 24 hours prior to boarding)
to cross the Mexico-US border quickly through
an elevated pedestrian bridge.4
Surface transportation —370,000 vehicles
a day— is supported by shared strategic
corridors that link major industrial clusters
on both sides of the border.3
Population
9.45
69.3
18.7TOTAL
CAGR*(2000-2016)
1.6%
2.7%
2.1%
19Source: 1) SAI Law and Economics with information from the World Bank, 2014. 2) SAI Law and Economics with information from the Secretariat of Economy of Mexico (World Bank, IMF, WTO and UNCTAD, 2015).
TPP partners represent,worldwide:2
North America represents,of TPP:2
TPP: RAISING THE BAR ON ECONOMIC INTEGRATIONTRANS-PACIFIC PARTNERSHIP
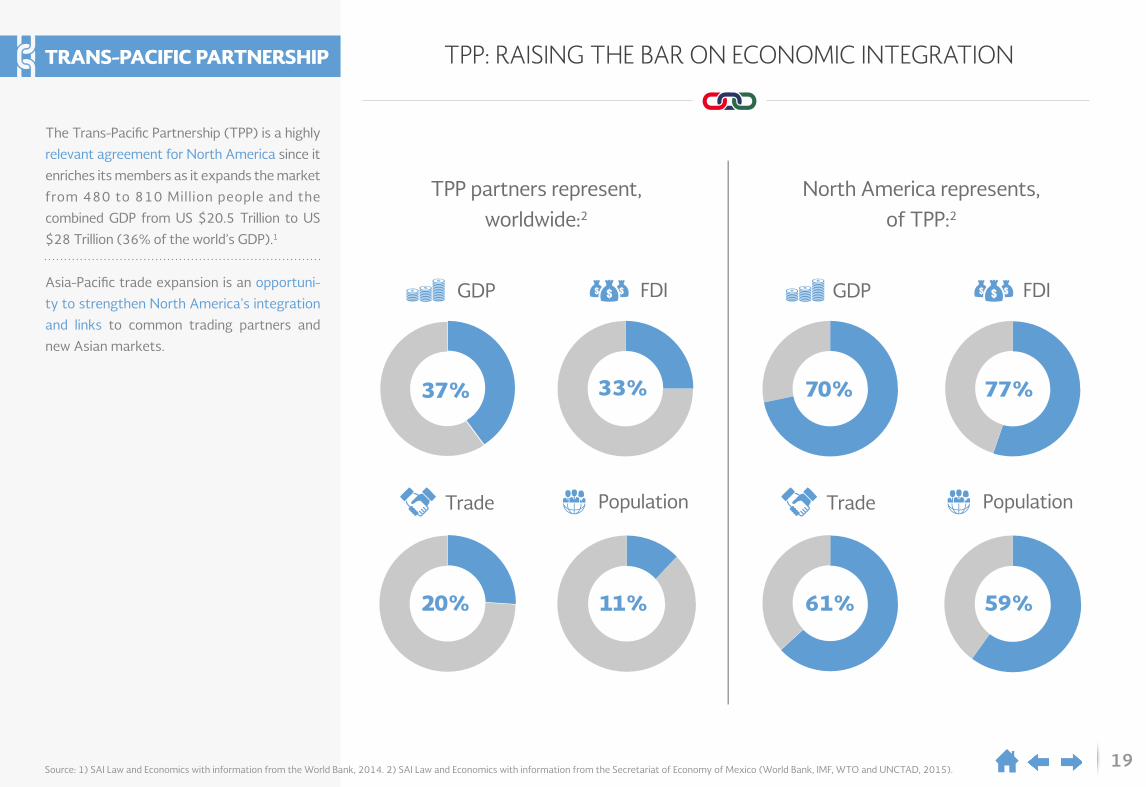
The Trans-Pacific Partnership (TPP) is a highly
relevant agreement for North America since it
enriches its members as it expands the market
from 480 to 810 Million people and the
combined GDP from US $20.5 Trillion to US
$28 Trillion (36% of the world’s GDP).1
Asia-Pacific trade expansion is an opportuni-
ty to strengthen North America's integration
and links to common trading partners and
new Asian markets.
11%20%
Population Population
FDI FDI
33%37% 77%
59%
TradeTrade
61%
GDPGDP
70%

“We're going to continue to deepen our trilateral cooperation in this hemisphere and around the world. And, in short, we're
going to do more to speak with one, united North American voice on the world stage [...]
I'm confident that we're going to continue to advance regional copperation and
integration, and that's not just going to be good for our own people, that will be good for
the world, as well.”
Barack ObamaNALS, 2016
“It's gratifying that once againwe are able to come together as
leaders of three truly great nationsto honor that enduring friendship and
to once again deliver real results for the people of Canada, Mexico, the United States
and, indeed, the entire global community.”
Justin TrudeauNALS, 2016
“The North American Leaders Summit bears witness that isolated national efforts are insufficient. If we
want favorable results for the benefit of our societies, it is better to work together as a region. We all know
these global challenges -- isolationism is not thesolution. In contrast, with what happens in other
corners of the world, the countries in North America, we have decided to be closer, to work as a team, and
to complement each other and to make progress together as the most competitive region
in the world.”
Enrique Peña NietoNALS, 2016
THE LEADERS’ PERSPECTIVE
sws.ms sai.com.mx
Source: Secretariat of Economy of Mexico


