North Carolina Replacement Medicaid Management Information System (MMIS) PROPOSAL TITLE: North Carolina Replacement Medicaid Management Information System (MMIS) PREPARED FOR: North Carolina Department of Health and Human Services Office of Medicaid Management Information System Services RFP Number: 30-DHHS-1228-08-R SUBMITTED BY: CSC 13 October 2008 Response to State Letter of 8 October 2008, Addendum 11 Redacted Version With Confidential Pages Removed
Transcript
North Carolina Replacement Medicaid Management Information System (MMIS)PROPOSAL TITLE:North Carolina Replacement Medicaid Management Information System (MMIS)
PREPARED FOR:North Carolina Department of Health and Human ServicesOffice of Medicaid Management Information System ServicesRFP Number: 30-DHHS-1228-08-R
SUBMITTED BY:CSC
13 October 2008
Response to State Letter of 8 October 2008, Addendum 11
Redacted VersionWith Confidential Pages Removed
Line Item
IMS Traceability Proposed Milestone/Deliverable Milestone (M) or
Deliverable (D)
Proposed % To Be Paid upon
Achievement or Acceptance
$ Amount
Anticipated Invoice Date
(Month Relative to Contract Award)
1 1.3.1.1.1 Review & Update Business Direction D 0.024% 16,452.58$ 12 1.3.1.2.1 Develop Enterprise Information System Requirements D 0.151% 104,224.94$ 93 1.3.1.2.2 Architecture Documentation D 0.311% 215,023.56$ 104 1.3.1.2.3 Refine Data & Application Distribution for New Functionality D 0.042% 29,307.24$ 115 1.3.1.2.4 Validate All Environments D 0.041% 28,363.78$ 26 1.3.1.2.5 Define Data Integration Approach D 0.054% 37,143.67$ 77 1.3.1.2.6 Plan Enterprise Transition D 0.048% 33,283.79$ 128 1.3.1.3.1 Establish Security D 0.059% 40,751.80$ 69 1.3.1.3.2 Establish Security Roles D 0.038% 26,239.41$ 9
10 1.3.1.4.1 Revise Scope of Performance Engineering D 0.055% 37,790.40$ 511 1.3.1.4.2 Update Predictive Model or Benchmark for Current Level of Design D 0.055% 37,790.40$ 512 1.3.1.4.3 Adjust Model Based on Actual Performance D 0.055% 37,790.40$ 613 1.3.1.4.4 Rerun Model or Benchmark D 0.027% 18,894.18$ 614 1.3.1.4.5 Review PE Results D 0.009% 6,319.89$ 615 1.3.1.4.6 Adjust Application & Database Design Based on Results D 0.028% 19,274.85$ 616 1.3.1.5 Create LDM through Implement Data Changes D 0.072% 49,728.19$ 817 1.3.1.6 Architecture On-going Support D 0.000%18 1.3.1.7.1 Revise Scope of Performance Engineering D 0.060% 41,204.12$ 519 1.3.1.7.2 Update Predictive Model or Benchmark for Current Level of Design D 0.064% 43,979.28$ 520 1.3.1.7.3 Adjust Model Based on Actual Performance D 0.191% 131,942.00$ 721 1.3.1.7.4 Rerun Model or Benchmark D 0.020% 13,961.88$ 722 1.3.1.7.5 Review PE Results D 0.012% 8,196.60$ 723 1.3.1.7.6 Adjust Application & Database Design Based on Results D 0.069% 47,949.68$ 724 1.3.1.8.1 Revise Scope of Performance Engineering D 0.029% 20,181.48$ 1125 1.3.1.8.2 Update Predictive Model or Benchmark for Current Level of Design D 0.054% 37,536.60$ 1126 1.3.1.8.3 Adjust Model Based on Actual Performance D 0.244% 168,919.88$ 1427 1.3.1.8.4 Rerun Model or Benchmark D 0.032% 22,309.96$ 1428 1.3.1.8.5 Review PE Results D 0.014% 9,864.60$ 1429 1.3.1.8.6 Adjust Application & Database Design Based on Results D 0.079% 54,707.55$ 1430 1.3.1.9.1 Define Scope of Performance Engineering D 0.035% 24,487.52$ 1531 1.3.1.9.2 Create Predictive Model or Benchmark for Current Level of Design D 0.054% 37,536.60$ 16
32 1.3.1.9.3 Adjust Model Based on Actual Performance D 0.218% 151,159.52$ 17
33 1.3.1.9.4 Rerun Model or Benchmark D 0.032% 22,309.96$ 17
34 1.3.1.9.5 Review PE Results D 0.012% 8,198.68$ 1735 1.3.1.9.6 Adjust Application & Database Design Based on Results D 0.062% 43,037.88$ 1836 1.3.1.10.1 Revise Scope of Performance Engineering D 0.033% 22,745.88$ 1837 1.3.1.10.2 Update Predictive Model or Benchmark for Current. Level of Design D 0.055% 37,804.72$ 1838 1.3.1.10.3 Adjust Model Based on Actual Performance D 0.074% 51,105.56$ 1939 1.3.1.10.4 Rerun Model or Benchmark D 0.033% 22,625.12$ 1940 1.3.1.10.5 Review PE Results D 0.013% 9,293.60$ 1941 1.3.1.10.6 Adjust Application & Database Design Based on Results D 0.069% 47,818.72$ 1942 1.3.2.1.1.1 Development Environment (DEVL ENV) Infrastructure Build (Build 3-10) M 0.026% 18,047.70$ 543 1.3.2.1.1.2 DEVL ENV Build (Build 11-18) M 0.026% 18,047.70$ 1944 1.3.2.1.1.3 String Test Environment (STEST ENV) Infrastructure Build (build 3-10) M 0.026% 18,047.70$ 1745 1.3.2.1.1.4 String Test Environment (build 11-18) M 0.026% 18,047.70$ 19
46 1.3.2.1.1.5 Initial Portal Environment (PORT ENV) Infrastructure for Build 1 & Build 4 M 0.017% 12,031.81$ 147 1.3.2.1.1.6 Training / Demo Environment (DEMO ENV) Infrastructure M 0.026% 18,047.70$ 248 1.3.2.1.1.7 Conversion Environment (CONV ENV) Infrastructure M 0.030% 21,055.67$ 349 1.3.2.1.1.8 UBAT Environment Infrastructure M 0.017% 12,031.81$ 750 1.3.2.1.1.9 Systems Integration Test Environment (SIT ENV) Infrastructure M 0.016% 11,229.69$ 751 1.3.2.1.1.10 User Acceptance Test Environment (UAT ENV) Infrastructure Build M 0.016% 11,029.15$ 22
52 1.3.2.1.1.11Production Simulation Test / Production Environment (PST / PROD ENV) Infrastructure Build M 0.017% 12,031.81$ 18
53 1.3.2.2.1 Conduct Orientations & Overviews D 0.180% 124,514.90$ 354 1.3.2.2.2 Define Business System Design Approach D 0.100% 69,166.76$ 355 1.3.2.2.3 Prepare & Conduct Initiation Workshop D 0.032% 21,890.38$ 356 1.3.2.2.4 Develop Logical Entity Model (partial) D 0.098% 68,020.66$ 457 1.3.2.3.1 Start Development Preparation D 0.009% 6,366.96$ 258 1.3.2.3.2 Create Initial Physical Database D 3.811% 2,637,677.38$ 1659 1.3.2.3.3 Establish Development Environment D 0.000%60 1.3.2.3.4 Establish String Testing Environment D 0.000%61 1.3.2.4.1 Update IT Systems Management & Support Processes D 0.106% 73,642.68$ 262 1.3.2.4.2 Identify DLPs for Systems Management & Support Processes D 0.051% 35,547.32$ 463 1.3.2.4.3 Update User System Interface Standards for NC DHHS D 0.021% 14,868.52$ 364 1.3.2.4.4 Identify or Refine Interfaces to Other Applications D 0.077% 53,530.76$ 465 1.3.2.4.5 Define Derived Logical Process Detail D 0.125% 86,808.40$ 6
Replacement Medicaid Management Information System (MMIS) RFP 30‐DHHS‐1228‐08‐R
Page 2 of 36
Line Item
IMS Traceability Proposed Milestone/Deliverable Milestone (M) or
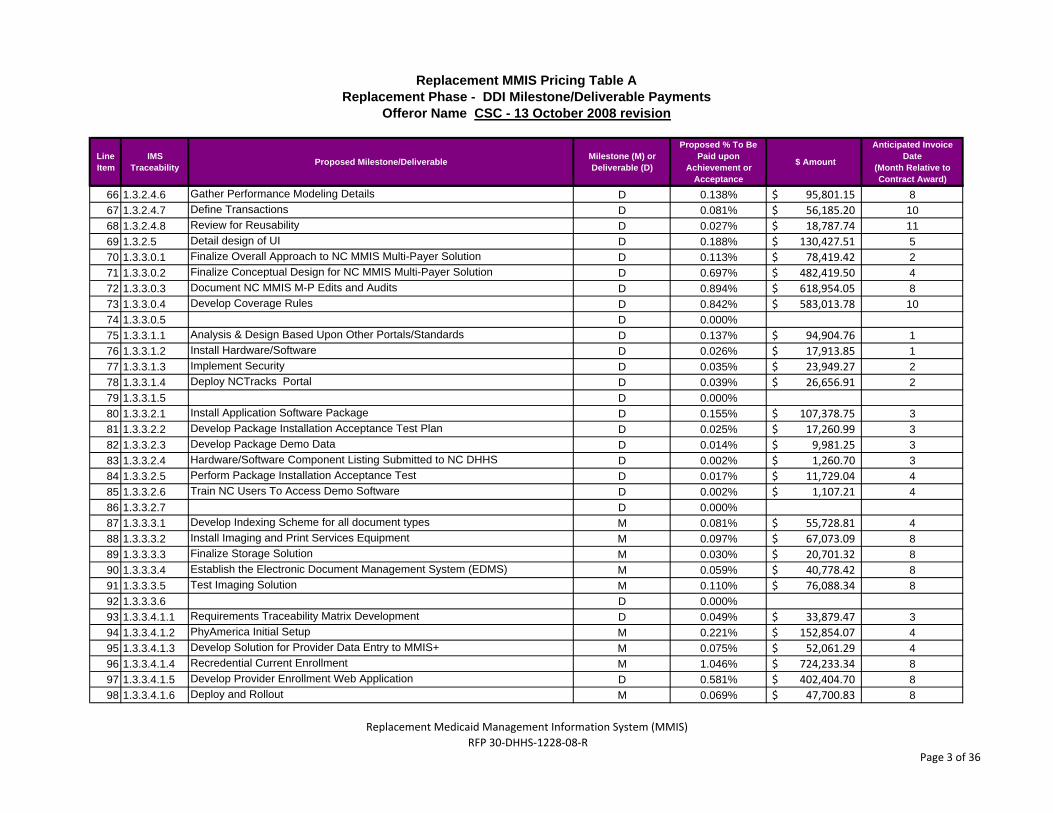
66 1.3.2.4.6 Gather Performance Modeling Details D 0.138% 95,801.15$ 867 1.3.2.4.7 Define Transactions D 0.081% 56,185.20$ 1068 1.3.2.4.8 Review for Reusability D 0.027% 18,787.74$ 1169 1.3.2.5 Detail design of UI D 0.188% 130,427.51$ 570 1.3.3.0.1 Finalize Overall Approach to NC MMIS Multi-Payer Solution D 0.113% 78,419.42$ 271 1.3.3.0.2 Finalize Conceptual Design for NC MMIS Multi-Payer Solution D 0.697% 482,419.50$ 472 1.3.3.0.3 Document NC MMIS M-P Edits and Audits D 0.894% 618,954.05$ 873 1.3.3.0.4 Develop Coverage Rules D 0.842% 583,013.78$ 1074 1.3.3.0.5 D 0.000%75 1.3.3.1.1 Analysis & Design Based Upon Other Portals/Standards D 0.137% 94,904.76$ 176 1.3.3.1.2 Install Hardware/Software D 0.026% 17,913.85$ 177 1.3.3.1.3 Implement Security D 0.035% 23,949.27$ 278 1.3.3.1.4 Deploy NCTracks Portal D 0.039% 26,656.91$ 279 1.3.3.1.5 D 0.000%80 1.3.3.2.1 Install Application Software Package D 0.155% 107,378.75$ 381 1.3.3.2.2 Develop Package Installation Acceptance Test Plan D 0.025% 17,260.99$ 382 1.3.3.2.3 Develop Package Demo Data D 0.014% 9,981.25$ 383 1.3.3.2.4 Hardware/Software Component Listing Submitted to NC DHHS D 0.002% 1,260.70$ 384 1.3.3.2.5 Perform Package Installation Acceptance Test D 0.017% 11,729.04$ 485 1.3.3.2.6 Train NC Users To Access Demo Software D 0.002% 1,107.21$ 486 1.3.3.2.7 D 0.000%87 1.3.3.3.1 Develop Indexing Scheme for all document types M 0.081% 55,728.81$ 488 1.3.3.3.2 Install Imaging and Print Services Equipment M 0.097% 67,073.09$ 889 1.3.3.3.3 Finalize Storage Solution M 0.030% 20,701.32$ 890 1.3.3.3.4 Establish the Electronic Document Management System (EDMS) M 0.059% 40,778.42$ 891 1.3.3.3.5 Test Imaging Solution M 0.110% 76,088.34$ 892 1.3.3.3.6 D 0.000%93 1.3.3.4.1.1 Requirements Traceability Matrix Development D 0.049% 33,879.47$ 394 1.3.3.4.1.2 PhyAmerica Initial Setup M 0.221% 152,854.07$ 495 1.3.3.4.1.3 Develop Solution for Provider Data Entry to MMIS+ M 0.075% 52,061.29$ 496 1.3.3.4.1.4 Recredential Current Enrollment M 1.046% 724,233.34$ 897 1.3.3.4.1.5 Develop Provider Enrollment Web Application D 0.581% 402,404.70$ 898 1.3.3.4.1.6 Deploy and Rollout M 0.069% 47,700.83$ 8
Replacement Medicaid Management Information System (MMIS) RFP 30‐DHHS‐1228‐08‐R
Page 3 of 36
Line Item
IMS Traceability Proposed Milestone/Deliverable Milestone (M) or
99 1.3.3.4.3.1 Requirements Traceability Matrix Development D 0.072% 49,602.47$ 2100 1.3.3.4.3.2 Retro DUR COTS Product Initial Setup M 0.084% 58,135.30$ 2101 1.3.3.4.3.3 System Test Retro DUR COTS Implementation M 0.063% 43,820.59$ 3102 1.3.3.4.3.4 User Acceptance Test Retro DUR COTS Implementation M 0.042% 29,213.72$ 4103 1.3.3.4.3.5 Deploy Retro DUR COTS Solution for North Carolina M 0.042% 29,274.59$ 4104 1.3.3.5.1.1 Business Process Prework D 0.223% 154,557.86$ 4105 1.3.3.5.1.2 Design Business Processes D 0.346% 239,442.76$ 6106 1.3.3.5.1.3 Prepare & Deliver Business System Design Documentation D 0.046% 31,701.20$ 8107 1.3.3.5.2.1 Technical Design D 0.362% 250,739.06$ 10108 1.3.3.5.2.2 Code & Unit Test/String Test D 1.903% 1,317,460.17$ 14109 1.3.3.5.2.3 Application Development Review (ADR) D 0.066% 45,634.66$ 14110 1.3.3.5.3.1 Analyze Data Conversion Processes D 0.060% 41,804.32$ 4111 1.3.3.5.3.2 Design Data Conversion Processes D 0.112% 77,806.62$ 6112 1.3.3.5.3.3 Code & Test Conversion Processes D 1.109% 767,414.32$ 9113 1.3.3.5.3.4 Obtain Data from Legacy System D 0.043% 29,753.96$ 10114 1.3.3.5.3.5 Data Conversion Pre-Test Run #1 D 0.034% 23,803.18$ 11115 1.3.3.5.3.6 Data Conversion Pre-Test Run #2 D 0.034% 23,803.18$ 11116 1.3.3.5.4.1 Review & Update System Integration Test Environment D 0.214% 148,284.20$ 14117 1.3.3.5.4.2 Systems Integration Test Execution D 1.431% 990,780.90$ 18118 1.3.3.5.5.1 Review & Update UBAT Environment D 0.013% 8,976.62$ 16119 1.3.3.5.5.2 UBAT Test Execution D 0.048% 33,455.46$ 19120 1.3.3.6.1.1 Business Process Prework D 0.133% 91,752.84$ 4121 1.3.3.6.1.2 Design Business Processes D 0.212% 146,578.84$ 6122 1.3.3.6.1.3 Prepare & Deliver Business System Design Documentation D 0.024% 16,625.20$ 8123 1.3.3.6.2.1 Technical Design D 0.305% 210,930.61$ 11124 1.3.3.6.2.2 Code & Unit Test/String Test D 0.948% 656,131.06$ 3125 1.3.3.6.2.3 Application Development Review D 0.043% 30,012.49$ 15126 1.3.3.6.3.1 Analyze Data Conversion Processes D 0.060% 41,658.19$ 4127 1.3.3.6.3.2 Design Data Conversion Processes D 0.108% 74,415.76$ 6128 1.3.3.6.3.3 Code & Test Conversion Processes D 0.523% 362,267.31$ 9129 1.3.3.6.3.4 Obtain Data from Legacy System D 0.043% 29,652.02$ 10130 1.3.3.6.3.5 Data Conversion Pre-Test Run #1 D 0.034% 23,723.06$ 11131 1.3.3.6.3.6 Data Conversion Pre-Test Run #2 D 0.033% 23,130.16$ 11
Replacement Medicaid Management Information System (MMIS) RFP 30‐DHHS‐1228‐08‐R
Page 4 of 36
Line Item
IMS Traceability Proposed Milestone/Deliverable Milestone (M) or
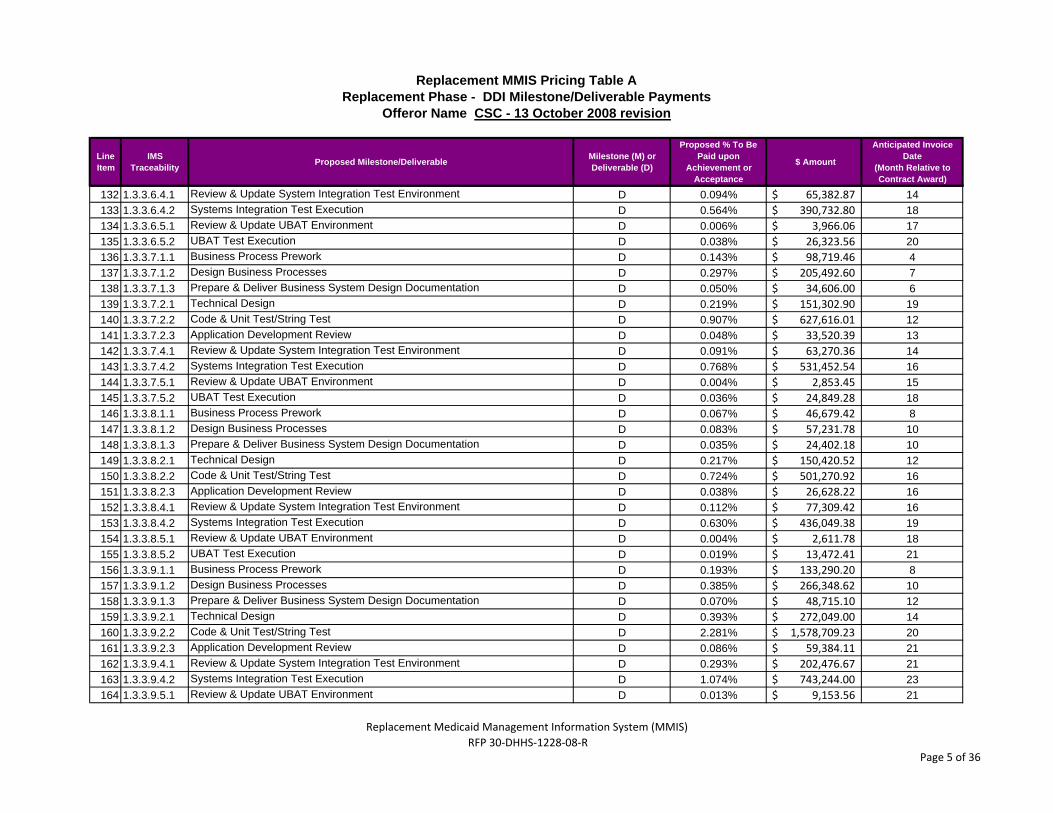
132 1.3.3.6.4.1 Review & Update System Integration Test Environment D 0.094% 65,382.87$ 14133 1.3.3.6.4.2 Systems Integration Test Execution D 0.564% 390,732.80$ 18134 1.3.3.6.5.1 Review & Update UBAT Environment D 0.006% 3,966.06$ 17135 1.3.3.6.5.2 UBAT Test Execution D 0.038% 26,323.56$ 20136 1.3.3.7.1.1 Business Process Prework D 0.143% 98,719.46$ 4137 1.3.3.7.1.2 Design Business Processes D 0.297% 205,492.60$ 7138 1.3.3.7.1.3 Prepare & Deliver Business System Design Documentation D 0.050% 34,606.00$ 6139 1.3.3.7.2.1 Technical Design D 0.219% 151,302.90$ 19140 1.3.3.7.2.2 Code & Unit Test/String Test D 0.907% 627,616.01$ 12141 1.3.3.7.2.3 Application Development Review D 0.048% 33,520.39$ 13142 1.3.3.7.4.1 Review & Update System Integration Test Environment D 0.091% 63,270.36$ 14143 1.3.3.7.4.2 Systems Integration Test Execution D 0.768% 531,452.54$ 16144 1.3.3.7.5.1 Review & Update UBAT Environment D 0.004% 2,853.45$ 15145 1.3.3.7.5.2 UBAT Test Execution D 0.036% 24,849.28$ 18146 1.3.3.8.1.1 Business Process Prework D 0.067% 46,679.42$ 8147 1.3.3.8.1.2 Design Business Processes D 0.083% 57,231.78$ 10148 1.3.3.8.1.3 Prepare & Deliver Business System Design Documentation D 0.035% 24,402.18$ 10149 1.3.3.8.2.1 Technical Design D 0.217% 150,420.52$ 12150 1.3.3.8.2.2 Code & Unit Test/String Test D 0.724% 501,270.92$ 16151 1.3.3.8.2.3 Application Development Review D 0.038% 26,628.22$ 16152 1.3.3.8.4.1 Review & Update System Integration Test Environment D 0.112% 77,309.42$ 16153 1.3.3.8.4.2 Systems Integration Test Execution D 0.630% 436,049.38$ 19154 1.3.3.8.5.1 Review & Update UBAT Environment D 0.004% 2,611.78$ 18155 1.3.3.8.5.2 UBAT Test Execution D 0.019% 13,472.41$ 21156 1.3.3.9.1.1 Business Process Prework D 0.193% 133,290.20$ 8157 1.3.3.9.1.2 Design Business Processes D 0.385% 266,348.62$ 10158 1.3.3.9.1.3 Prepare & Deliver Business System Design Documentation D 0.070% 48,715.10$ 12159 1.3.3.9.2.1 Technical Design D 0.393% 272,049.00$ 14160 1.3.3.9.2.2 Code & Unit Test/String Test D 2.281% 1,578,709.23$ 20161 1.3.3.9.2.3 Application Development Review D 0.086% 59,384.11$ 21162 1.3.3.9.4.1 Review & Update System Integration Test Environment D 0.293% 202,476.67$ 21163 1.3.3.9.4.2 Systems Integration Test Execution D 1.074% 743,244.00$ 23164 1.3.3.9.5.1 Review & Update UBAT Environment D 0.013% 9,153.56$ 21
Replacement Medicaid Management Information System (MMIS) RFP 30‐DHHS‐1228‐08‐R
Page 5 of 36
Line Item
IMS Traceability Proposed Milestone/Deliverable Milestone (M) or
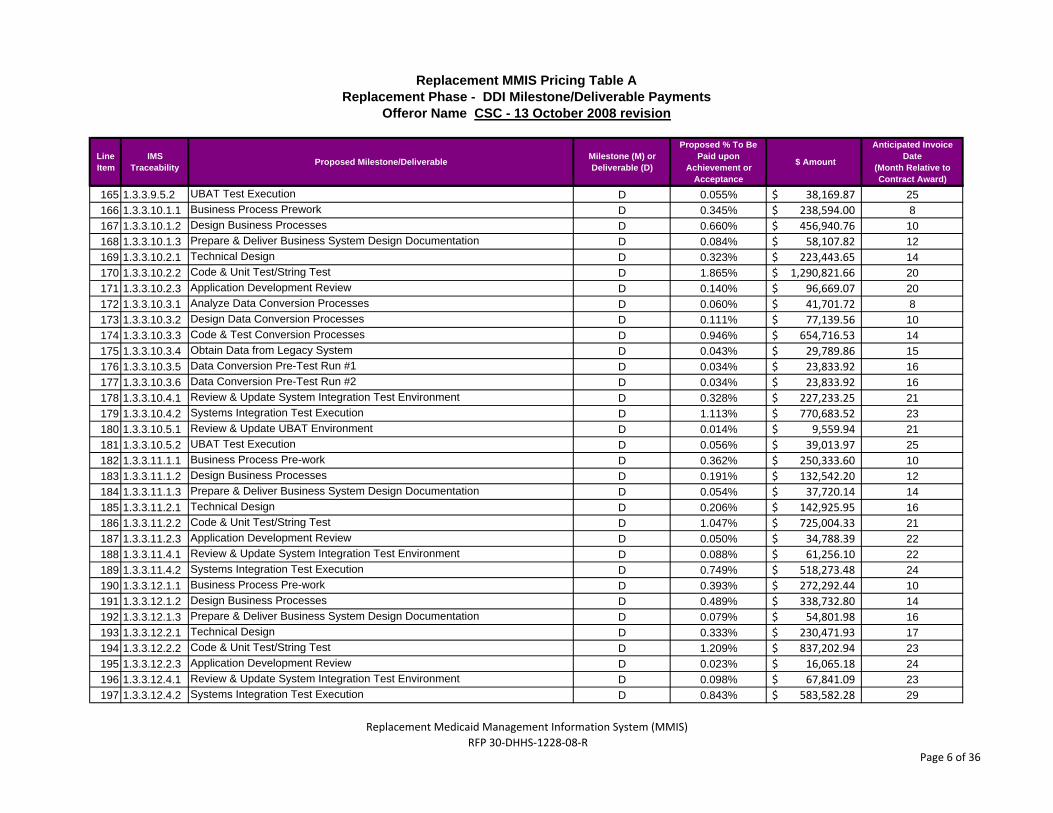
165 1.3.3.9.5.2 UBAT Test Execution D 0.055% 38,169.87$ 25166 1.3.3.10.1.1 Business Process Prework D 0.345% 238,594.00$ 8167 1.3.3.10.1.2 Design Business Processes D 0.660% 456,940.76$ 10168 1.3.3.10.1.3 Prepare & Deliver Business System Design Documentation D 0.084% 58,107.82$ 12169 1.3.3.10.2.1 Technical Design D 0.323% 223,443.65$ 14170 1.3.3.10.2.2 Code & Unit Test/String Test D 1.865% 1,290,821.66$ 20171 1.3.3.10.2.3 Application Development Review D 0.140% 96,669.07$ 20172 1.3.3.10.3.1 Analyze Data Conversion Processes D 0.060% 41,701.72$ 8173 1.3.3.10.3.2 Design Data Conversion Processes D 0.111% 77,139.56$ 10174 1.3.3.10.3.3 Code & Test Conversion Processes D 0.946% 654,716.53$ 14175 1.3.3.10.3.4 Obtain Data from Legacy System D 0.043% 29,789.86$ 15176 1.3.3.10.3.5 Data Conversion Pre-Test Run #1 D 0.034% 23,833.92$ 16177 1.3.3.10.3.6 Data Conversion Pre-Test Run #2 D 0.034% 23,833.92$ 16178 1.3.3.10.4.1 Review & Update System Integration Test Environment D 0.328% 227,233.25$ 21179 1.3.3.10.4.2 Systems Integration Test Execution D 1.113% 770,683.52$ 23180 1.3.3.10.5.1 Review & Update UBAT Environment D 0.014% 9,559.94$ 21181 1.3.3.10.5.2 UBAT Test Execution D 0.056% 39,013.97$ 25182 1.3.3.11.1.1 Business Process Pre-work D 0.362% 250,333.60$ 10183 1.3.3.11.1.2 Design Business Processes D 0.191% 132,542.20$ 12184 1.3.3.11.1.3 Prepare & Deliver Business System Design Documentation D 0.054% 37,720.14$ 14185 1.3.3.11.2.1 Technical Design D 0.206% 142,925.95$ 16186 1.3.3.11.2.2 Code & Unit Test/String Test D 1.047% 725,004.33$ 21187 1.3.3.11.2.3 Application Development Review D 0.050% 34,788.39$ 22188 1.3.3.11.4.1 Review & Update System Integration Test Environment D 0.088% 61,256.10$ 22189 1.3.3.11.4.2 Systems Integration Test Execution D 0.749% 518,273.48$ 24190 1.3.3.12.1.1 Business Process Pre-work D 0.393% 272,292.44$ 10191 1.3.3.12.1.2 Design Business Processes D 0.489% 338,732.80$ 14192 1.3.3.12.1.3 Prepare & Deliver Business System Design Documentation D 0.079% 54,801.98$ 16193 1.3.3.12.2.1 Technical Design D 0.333% 230,471.93$ 17194 1.3.3.12.2.2 Code & Unit Test/String Test D 1.209% 837,202.94$ 23195 1.3.3.12.2.3 Application Development Review D 0.023% 16,065.18$ 24196 1.3.3.12.4.1 Review & Update System Integration Test Environment D 0.098% 67,841.09$ 23197 1.3.3.12.4.2 Systems Integration Test Execution D 0.843% 583,582.28$ 29
Replacement Medicaid Management Information System (MMIS) RFP 30‐DHHS‐1228‐08‐R
Page 6 of 36
Line Item
IMS Traceability Proposed Milestone/Deliverable Milestone (M) or
198 1.3.3.13.1.1 Business Process Pre-work D 0.209% 144,685.76$ 23199 1.3.3.13.1.2 Design Business Processes D 0.341% 235,736.80$ 14200 1.3.3.13.1.3 Prepare & Deliver Business System Design Documentation D 0.069% 48,101.90$ 16201 1.3.3.13.2.1 Technical Design D 0.311% 215,178.01$ 17202 1.3.3.13.2.2 Code & Unit Test/String Test D 1.361% 942,246.13$ 23203 1.3.3.13.2.3 Application Development Review D 0.058% 40,153.72$ 24204 1.3.3.13.3.1 Analyze Data Conversion Processes D 0.065% 45,304.82$ 10205 1.3.3.13.3.2 Design Data Conversion Processes D 0.122% 84,295.87$ 12206 1.3.3.13.4.1 Review & Update System Integration Test Environment D 0.148% 102,639.65$ 25207 1.3.3.13.4.2 Systems Integration Test Execution D 0.854% 591,273.28$ 27208 1.3.3.14.1.1 Business Process Pre-work D 0.143% 98,929.06$ 7209 1.3.3.14.1.2 Design Business Processes D 0.555% 384,336.26$ 12210 1.3.3.14.1.3 Prepare & Deliver Business System Design Documentation D 0.194% 134,000.30$ 15211 1.3.3.14.2.1 Technical Design D 0.392% 271,671.69$ 16212 1.3.3.14.2.2 Code & Unit Test/String Test D 2.325% 1,609,647.50$ 23213 1.3.3.14.2.3 Application Development Review D 0.050% 34,918.79$ 23214 1.3.3.14.4.1 Review & Update System Integration Test Environment D 0.256% 176,927.63$ 24215 1.3.3.14.4.2 Systems Integration Test Execution D 1.462% 1,012,113.18$ 26216 1.3.3.15.1.1 Business Process Prework D 0.143% 98,657.54$ 10217 1.3.3.15.1.2 Design Business Processes D 0.585% 404,612.96$ 13218 1.3.3.15.1.3 Prepare & Deliver Business System Design Documentation D 0.049% 34,177.88$ 15219 1.3.3.15.2.1 Technical Design D 0.399% 276,245.14$ 17220 1.3.3.15.2.2 Code & Unit Test/String Test D 1.663% 1,151,437.42$ 23221 1.3.3.15.2.3 Application Development Review D 0.083% 57,661.04$ 24222 1.3.3.15.3.1 Analyze Data Conversion Processes D 0.113% 78,333.27$ 10223 1.3.3.15.3.2 Design Data Conversion Processes D 0.105% 72,582.50$ 12224 1.3.3.15.3.3 Code & Test Conversion Processes D 0.731% 506,262.97$ 16225 1.3.3.15.3.4 Obtain Data from Legacy System D 0.041% 28,335.10$ 17226 1.3.3.15.3.5 Data Conversion Pre-Test Run #1 D 0.041% 28,223.44$ 17227 1.3.3.15.3.6 Data Conversion Pre-Test Run #2 D 0.040% 27,916.35$ 18228 1.3.3.15.4.1 Review & Update System Integration Test Environment D 0.282% 195,033.27$ 24229 1.3.3.15.4.2 Systems Integration Test Execution D 1.197% 828,598.08$ 26230 1.3.3.16.1.1 Business Process Prework D 0.340% 235,357.78$ 11
Replacement Medicaid Management Information System (MMIS) RFP 30‐DHHS‐1228‐08‐R
Page 7 of 36
Line Item
IMS Traceability Proposed Milestone/Deliverable Milestone (M) or
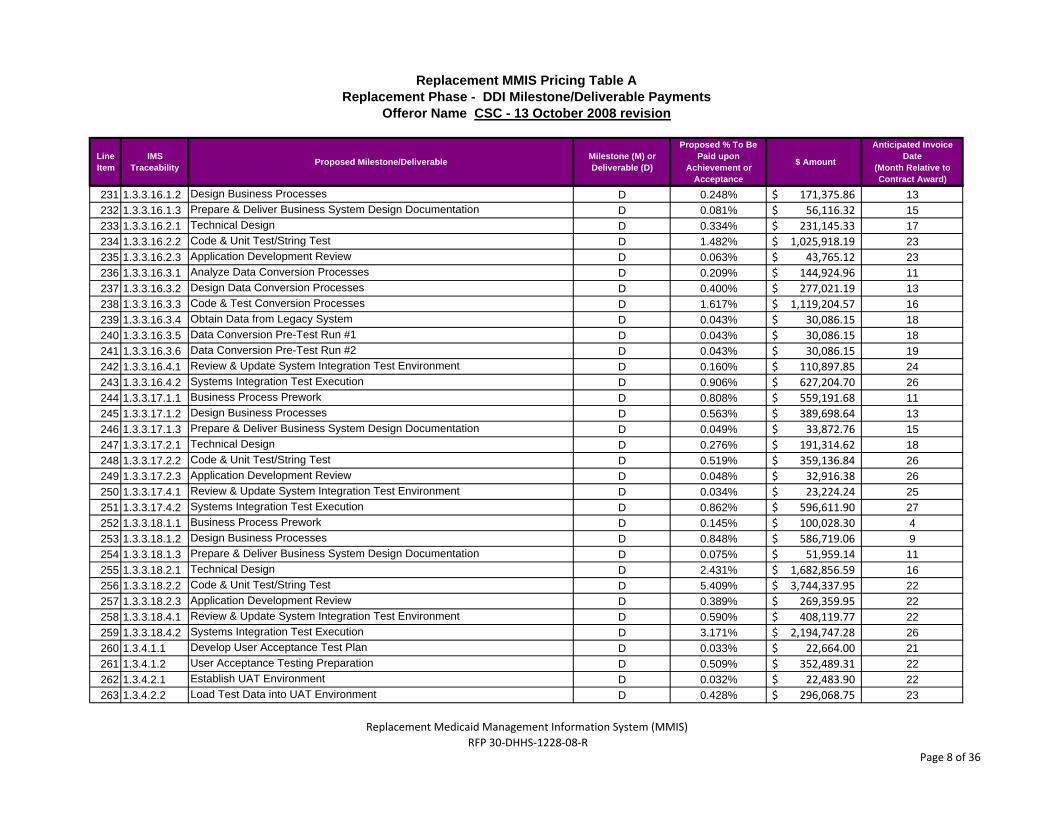
231 1.3.3.16.1.2 Design Business Processes D 0.248% 171,375.86$ 13232 1.3.3.16.1.3 Prepare & Deliver Business System Design Documentation D 0.081% 56,116.32$ 15233 1.3.3.16.2.1 Technical Design D 0.334% 231,145.33$ 17234 1.3.3.16.2.2 Code & Unit Test/String Test D 1.482% 1,025,918.19$ 23235 1.3.3.16.2.3 Application Development Review D 0.063% 43,765.12$ 23236 1.3.3.16.3.1 Analyze Data Conversion Processes D 0.209% 144,924.96$ 11237 1.3.3.16.3.2 Design Data Conversion Processes D 0.400% 277,021.19$ 13238 1.3.3.16.3.3 Code & Test Conversion Processes D 1.617% 1,119,204.57$ 16239 1.3.3.16.3.4 Obtain Data from Legacy System D 0.043% 30,086.15$ 18240 1.3.3.16.3.5 Data Conversion Pre-Test Run #1 D 0.043% 30,086.15$ 18241 1.3.3.16.3.6 Data Conversion Pre-Test Run #2 D 0.043% 30,086.15$ 19242 1.3.3.16.4.1 Review & Update System Integration Test Environment D 0.160% 110,897.85$ 24243 1.3.3.16.4.2 Systems Integration Test Execution D 0.906% 627,204.70$ 26244 1.3.3.17.1.1 Business Process Prework D 0.808% 559,191.68$ 11245 1.3.3.17.1.2 Design Business Processes D 0.563% 389,698.64$ 13246 1.3.3.17.1.3 Prepare & Deliver Business System Design Documentation D 0.049% 33,872.76$ 15247 1.3.3.17.2.1 Technical Design D 0.276% 191,314.62$ 18248 1.3.3.17.2.2 Code & Unit Test/String Test D 0.519% 359,136.84$ 26249 1.3.3.17.2.3 Application Development Review D 0.048% 32,916.38$ 26250 1.3.3.17.4.1 Review & Update System Integration Test Environment D 0.034% 23,224.24$ 25251 1.3.3.17.4.2 Systems Integration Test Execution D 0.862% 596,611.90$ 27252 1.3.3.18.1.1 Business Process Prework D 0.145% 100,028.30$ 4253 1.3.3.18.1.2 Design Business Processes D 0.848% 586,719.06$ 9254 1.3.3.18.1.3 Prepare & Deliver Business System Design Documentation D 0.075% 51,959.14$ 11255 1.3.3.18.2.1 Technical Design D 2.431% 1,682,856.59$ 16256 1.3.3.18.2.2 Code & Unit Test/String Test D 5.409% 3,744,337.95$ 22257 1.3.3.18.2.3 Application Development Review D 0.389% 269,359.95$ 22258 1.3.3.18.4.1 Review & Update System Integration Test Environment D 0.590% 408,119.77$ 22259 1.3.3.18.4.2 Systems Integration Test Execution D 3.171% 2,194,747.28$ 26260 1.3.4.1.1 Develop User Acceptance Test Plan D 0.033% 22,664.00$ 21261 1.3.4.1.2 User Acceptance Testing Preparation D 0.509% 352,489.31$ 22262 1.3.4.2.1 Establish UAT Environment D 0.032% 22,483.90$ 22263 1.3.4.2.2 Load Test Data into UAT Environment D 0.428% 296,068.75$ 23
Replacement Medicaid Management Information System (MMIS) RFP 30‐DHHS‐1228‐08‐R
Page 8 of 36
Line Item
IMS Traceability Proposed Milestone/Deliverable Milestone (M) or
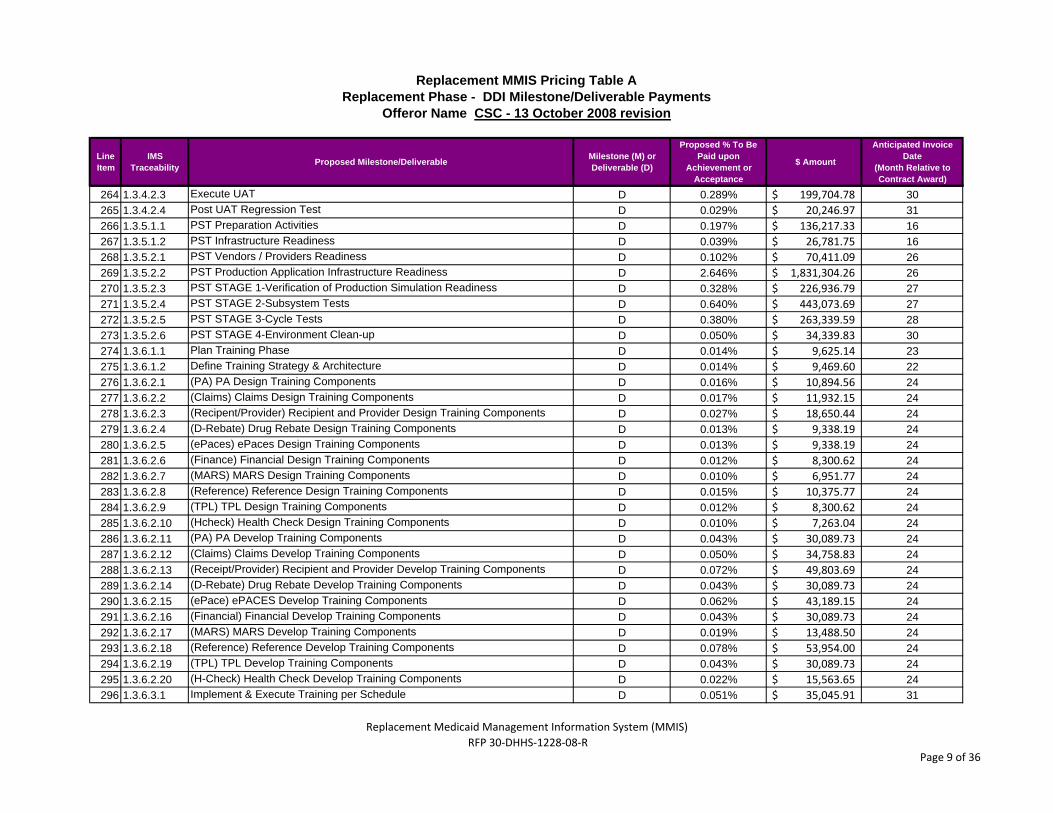
264 1.3.4.2.3 Execute UAT D 0.289% 199,704.78$ 30265 1.3.4.2.4 Post UAT Regression Test D 0.029% 20,246.97$ 31266 1.3.5.1.1 PST Preparation Activities D 0.197% 136,217.33$ 16267 1.3.5.1.2 PST Infrastructure Readiness D 0.039% 26,781.75$ 16268 1.3.5.2.1 PST Vendors / Providers Readiness D 0.102% 70,411.09$ 26269 1.3.5.2.2 PST Production Application Infrastructure Readiness D 2.646% 1,831,304.26$ 26270 1.3.5.2.3 PST STAGE 1-Verification of Production Simulation Readiness D 0.328% 226,936.79$ 27271 1.3.5.2.4 PST STAGE 2-Subsystem Tests D 0.640% 443,073.69$ 27272 1.3.5.2.5 PST STAGE 3-Cycle Tests D 0.380% 263,339.59$ 28273 1.3.5.2.6 PST STAGE 4-Environment Clean-up D 0.050% 34,339.83$ 30274 1.3.6.1.1 Plan Training Phase D 0.014% 9,625.14$ 23275 1.3.6.1.2 Define Training Strategy & Architecture D 0.014% 9,469.60$ 22276 1.3.6.2.1 (PA) PA Design Training Components D 0.016% 10,894.56$ 24277 1.3.6.2.2 (Claims) Claims Design Training Components D 0.017% 11,932.15$ 24278 1.3.6.2.3 (Recipent/Provider) Recipient and Provider Design Training Components D 0.027% 18,650.44$ 24279 1.3.6.2.4 (D-Rebate) Drug Rebate Design Training Components D 0.013% 9,338.19$ 24280 1.3.6.2.5 (ePaces) ePaces Design Training Components D 0.013% 9,338.19$ 24281 1.3.6.2.6 (Finance) Financial Design Training Components D 0.012% 8,300.62$ 24282 1.3.6.2.7 (MARS) MARS Design Training Components D 0.010% 6,951.77$ 24283 1.3.6.2.8 (Reference) Reference Design Training Components D 0.015% 10,375.77$ 24284 1.3.6.2.9 (TPL) TPL Design Training Components D 0.012% 8,300.62$ 24285 1.3.6.2.10 (Hcheck) Health Check Design Training Components D 0.010% 7,263.04$ 24286 1.3.6.2.11 (PA) PA Develop Training Components D 0.043% 30,089.73$ 24287 1.3.6.2.12 (Claims) Claims Develop Training Components D 0.050% 34,758.83$ 24288 1.3.6.2.13 (Receipt/Provider) Recipient and Provider Develop Training Components D 0.072% 49,803.69$ 24289 1.3.6.2.14 (D-Rebate) Drug Rebate Develop Training Components D 0.043% 30,089.73$ 24290 1.3.6.2.15 (ePace) ePACES Develop Training Components D 0.062% 43,189.15$ 24291 1.3.6.2.16 (Financial) Financial Develop Training Components D 0.043% 30,089.73$ 24292 1.3.6.2.17 (MARS) MARS Develop Training Components D 0.019% 13,488.50$ 24293 1.3.6.2.18 (Reference) Reference Develop Training Components D 0.078% 53,954.00$ 24294 1.3.6.2.19 (TPL) TPL Develop Training Components D 0.043% 30,089.73$ 24295 1.3.6.2.20 (H-Check) Health Check Develop Training Components D 0.022% 15,563.65$ 24296 1.3.6.3.1 Implement & Execute Training per Schedule D 0.051% 35,045.91$ 31
Replacement Medicaid Management Information System (MMIS) RFP 30‐DHHS‐1228‐08‐R
Page 9 of 36
Line Item
IMS Traceability Proposed Milestone/Deliverable Milestone (M) or
297 1.3.6.3.2 Conduct Training As Required D 0.013% 9,123.72$ 34298 1.3.6.4.1 Develop Fiscal Agent Desk Procedure Strategy & Model D 0.009% 6,154.11$ 23299 1.3.6.4.2 Fiscal Agent Design Desk Procedures D 0.009% 6,035.41$ 24300 1.3.6.4.3 Develop / Document Fiscal Agent Desk Procedures D 0.008% 5,495.11$ 26301 1.3.6.4.4 Incorporate Fiscal Agent Desk Procedures into Training Program D 0.013% 8,851.53$ 27302 1.3.6.5 Update Technical Documentation D 0.127% 87,880.83$ 24303 1.3.7.1.1 Data Conversion & Migration Plan D 0.425% 294,320.96$ 14304 1.3.7.1.2 Establish Conversion Environment D 0.053% 36,396.66$ 13305 1.3.7.2.1 Execute Conversion By Build (See CWBS for Each Build) D 0.000%306 1.3.7.2.2 Prepare for Final Data Conversion D 0.034% 23,672.97$ 20307 1.3.7.2.3 Data Conversion Test Run #1 D 0.334% 231,253.06$ 21308 1.3.7.2.4 Data Conversion Test Run #2 D 0.334% 231,253.06$ 21309 1.3.7.2.5 Data Conversion Final Run for UAT/PST D 0.390% 269,796.60$ 23310 1.3.7.2.6 Data Conversion Final Run for Production Cutover D 0.456% 315,773.38$ 32311 1.3.8.1 Deployment Approach/Schedule D 0.995% 688,906.70$ 28312 1.3.8.2 Execute Deployment Dry Run #1 D 0.145% 100,489.91$ 29313 1.3.8.3 Execute Deployment Dry Run #2 D 0.071% 49,390.50$ 29314 1.3.8.4 Prepare Software Release Package D 0.041% 28,177.53$ 30315 1.3.8.5.1-16 Cutover Activities D 0.210% 145,066.81$ 33316 1.3.8.5.17 Update Plans D 0.021% 14,665.90$ 30317 1.3.9 Milestone: System Operational D 0.000%318 1.3.10 Post Deployment / Warranty D 0.000%319 1.2.2.1 Team CSC Program Office IT Services Environment M 0.505% 349,687.23$ 1320 1.2.2.1 Baseline System Replica Environment M 0.119% 82,117.00$ 2321 1.2.2.1 Development Environment M 2.236% 1,547,762.66$ 2322 1.2.2.9.2 Early Implementation Environment M 0.000%323 1.2.2.9.2 Conversion Environment M 0.195% 135,127.00$ 6324 1.2.2.9.2 Performance/PreProduction Environment M 0.304% 210,282.00$ 10325 1.2.2.9.2 UBAT/UAT Environment M 0.195% 135,127.00$ 12326 1.2.2.9.2 Training Environment M 0.195% 135,127.00$ 12327 1.2.2.9.2 Production Environment M 3.106% 2,149,636.00$ 27328 1.2.2.9.4 COOP/Disaster Recovery Environment M 0.846% 585,494.00$ 29329 1.2.2.8 Network Services DDI Environment M 0.244% 168,981.00$ 1330 1.2.2.1 Network Services Early Implementation Environment M 0.244% 168,981.00$ 6331 1.2.2.9.4 Network Services Production Environment M 0.153% 106,222.00$ 31332 1.2.2.6 Common IT Service Environment DDI M 0.375% 259,582.00$ 1
Replacement Medicaid Management Information System (MMIS) RFP 30‐DHHS‐1228‐08‐R
Page 10 of 36
Line Item
IMS Traceability Proposed Milestone/Deliverable Milestone (M) or
333 1.2.2.6 Common IT Service Environment Production M 0.074% 37,463.00$ 33Totals Dollars and Percent Total Percent -> 100.00% 69,219,040.87$ <- Total Dollars
Replacement Medicaid Management Information System (MMIS) RFP 30‐DHHS‐1228‐08‐R
Page 11 of 36
Line Item Business Area Requirements
Marginal Price of Non-Title XIX/XXI
Requirements1 General Requirements N/A2 Recipient Requirements 243,994.83$ 3 Eligibility Verification System Requirements N/A4 Automated Voice Response System Requirements 365,261.13$ 5 Provider Requirements 570,491.52$ 6 Reference Requirements 72,058.44$ 7 Prior Approval Requirements 238,084.88$ 8 Claims Processing Requirements 61,734.64$ 9 Managed Care Requirements N/A10 Health Check Requirements N/A11 Third-Party Liability Requirements 243,886.48$ 12 Drug Rebate Requirements N/A13 Management Administrative and Reporting System Requirements N/A14 Financial Management and Accounting Requirements 44,406.79$
Total Marginal Price for Non-Title XIX/XXI Requirements for Replacement Phase 1,839,918.73$
Replacement Medicaid Management Information System (MMIS) RFP 30‐DHHS‐1228‐08‐R
Page 12 of 36
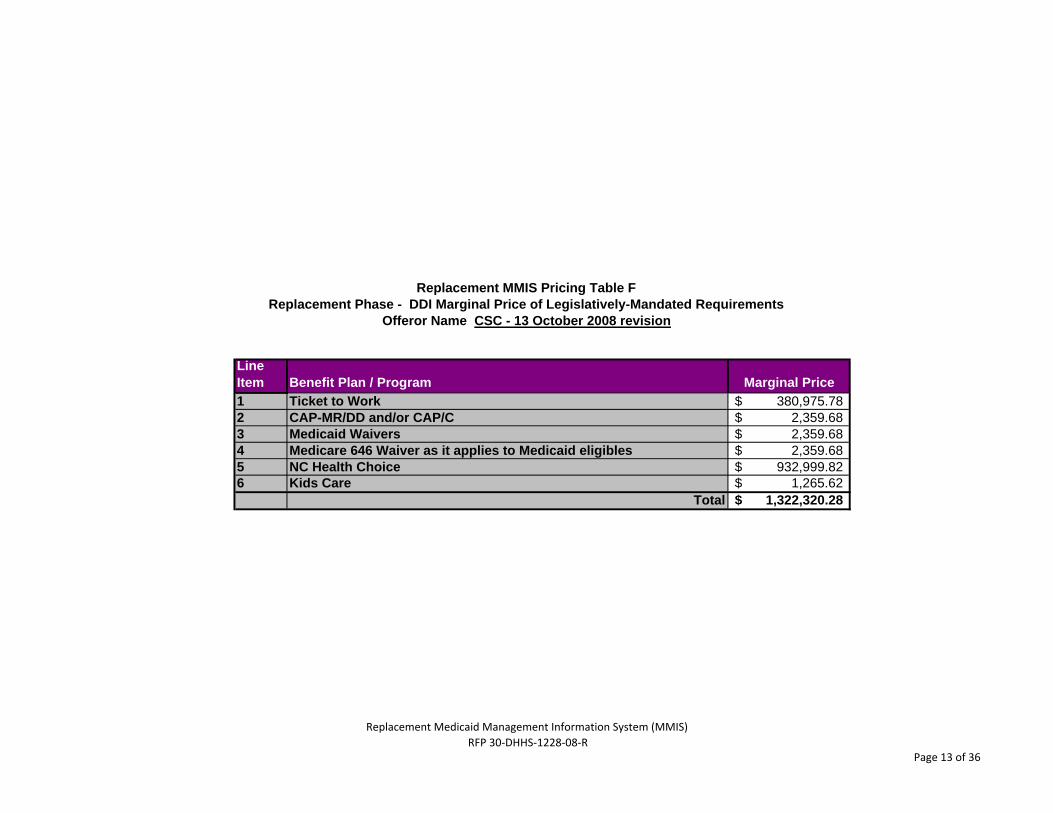
Line Item Benefit Plan / Program Marginal Price1 Ticket to Work 380,975.78$ 2 CAP-MR/DD and/or CAP/C 2,359.68$ 3 Medicaid Waivers 2,359.68$ 4 Medicare 646 Waiver as it applies to Medicaid eligibles 2,359.68$ 5 NC Health Choice 932,999.82$ 6 Kids Care 1,265.62$
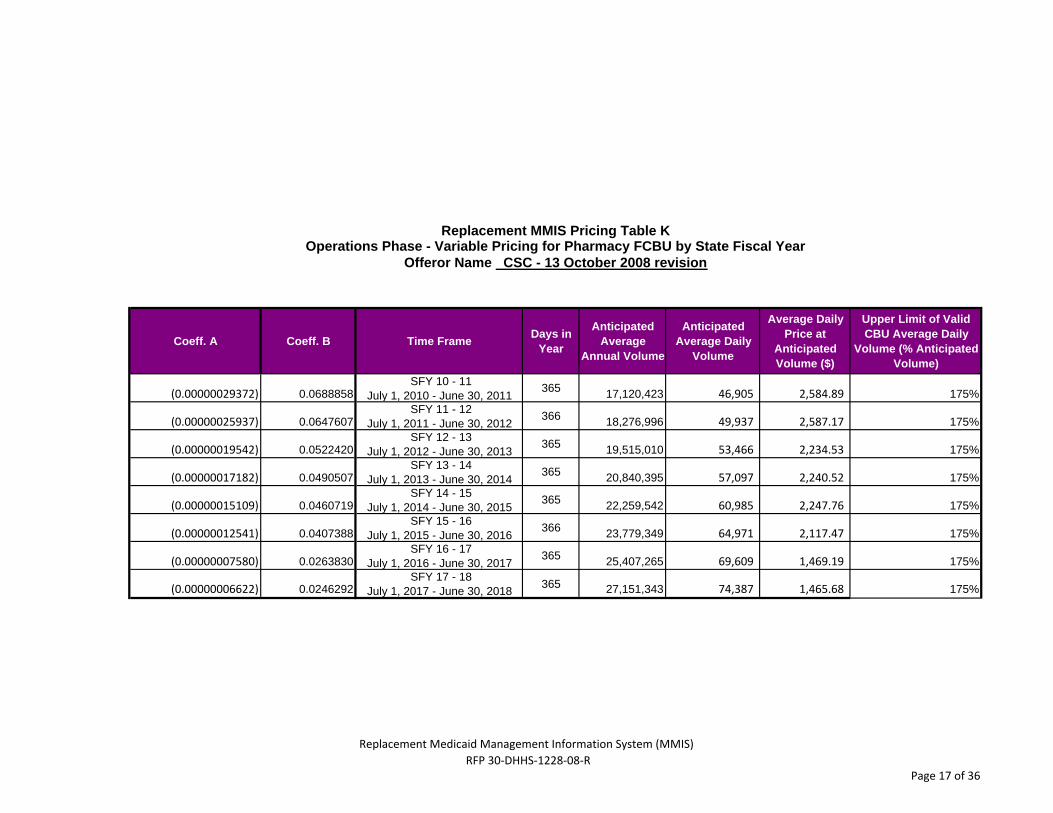
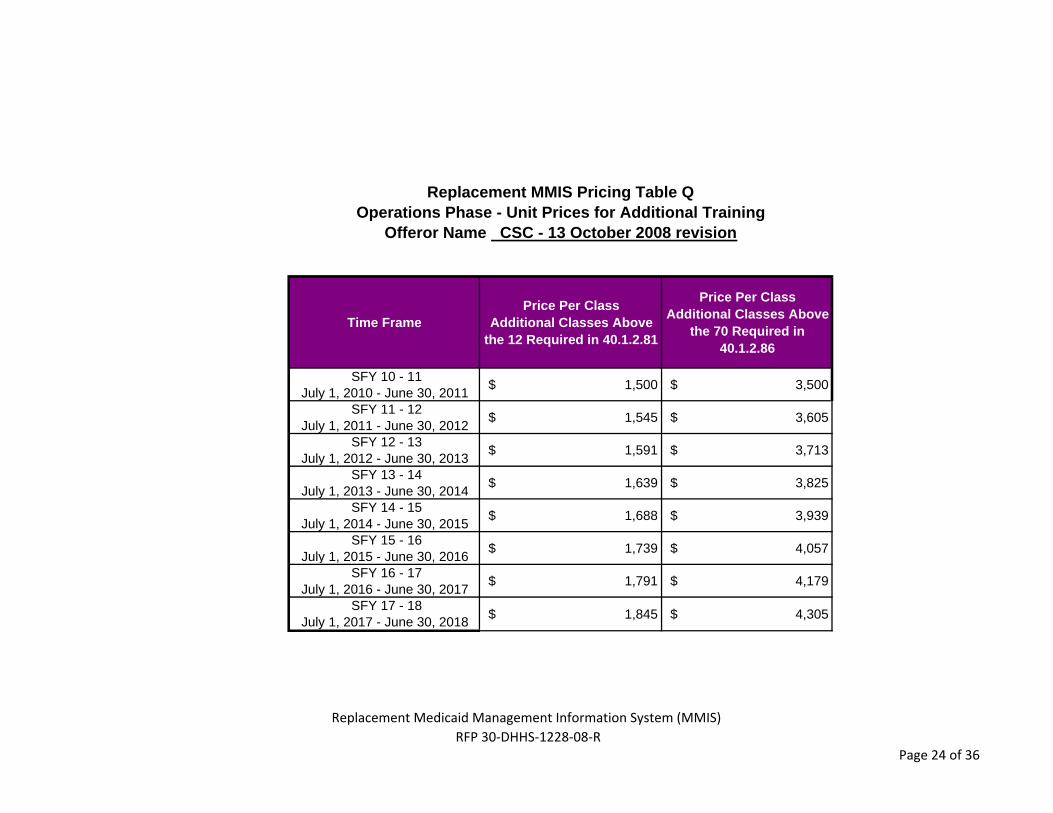
Replacement MMIS Pricing Table POperations Phase - Size of Operations Phase Modification Pool
Offeror Name CSC - 13 October 2008 revision
Replacement Medicaid Management Information System (MMIS) RFP 30‐DHHS‐1228‐08‐R
Page 23 of 36
Time FramePrice Per Class
Additional Classes Above the 12 Required in 40.1.2.81
Price Per ClassAdditional Classes Above
the 70 Required in 40.1.2.86
SFY 10 - 11 July 1, 2010 - June 30, 2011 $ 1,500 $ 3,500
SFY 11 - 12 July 1, 2011 - June 30, 2012 $ 1,545 $ 3,605
SFY 12 - 13 July 1, 2012 - June 30, 2013 $ 1,591 $ 3,713
SFY 13 - 14 July 1, 2013 - June 30, 2014 $ 1,639 $ 3,825
SFY 14 - 15 July 1, 2014 - June 30, 2015 $ 1,688 $ 3,939
SFY 15 - 16 July 1, 2015 - June 30, 2016 $ 1,739 $ 4,057
SFY 16 - 17 July 1, 2016 - June 30, 2017 $ 1,791 $ 4,179
SFY 17 - 18 July 1, 2017 - June 30, 2018 $ 1,845 $ 4,305
Replacement MMIS Pricing Table QOperations Phase - Unit Prices for Additional Training
Offeror Name CSC - 13 October 2008 revision
Replacement Medicaid Management Information System (MMIS) RFP 30‐DHHS‐1228‐08‐R
Page 24 of 36
Line Item
IMS Traceability Proposed Milestone/Deliverable Milestone (M) or
Deliverable (D)
Proposed % To Be Paid upon
Achievement or Acceptance
$ Amount
Anticipated Invoice Date
[Month Relative to Turnover Start]
1 4.4 Turnover plan includes WBS and Schedule M 16.17% 75,000$ 1
2 4.5Transfer of Electronic Files - all subsystems/business units M 10.78% 50,000$ 2
3 4.9 Deliver images and indices D 3.23% 15,000$ 24 4.9 Transfer of Hard copy Files M 10.78% 50,000$ 25 4.9 Transfer of Hardware/software ‐ M 2.16% 10,000$ 26 4.9 Transfer of work in progress D 1.72% 8,000$ 27 4.9 Notifications M 1.08% 5,000$ 28 4.9 Assignment of PO Boxes, telephone number, etc. D 1.08% 5,000$ 29 4.10 Post Turnover support - 90 days of effort D 52.69% 244,444$ 4
10 4.10 Post turnover report D 0.32% 1,500$ 4Total Dollars and Percent 100% 463,944$
Replacement MMIS Pricing Table SEstimated Provider Enrollment, Credentialing, and Verification Itemized Prices by State Fiscal Year
Offeror Name CSC - 13 October 2008 revision
38000
Price Per Provider
$133.97Anticipated Volume
Note that ongoing Credentialing and Verification identified in the shaded cells will only begin after completion of the initial Credentialing and Verification required in the first 12 months of the contract
Summation of Anticipated Services
Initial Credentialing
and Verification
Est. Quantity
Initial Credentialing
and Verification
Price
Ongoing Enrollment
Est. Quantity
Ongoing Enrollment
Price
Ongoing CredentialingEst. Quantity
Ongoing Credentialing
Price
Ongoing Verification
Est. Quantity
Ongoing Verification
Price
Total Annual Price
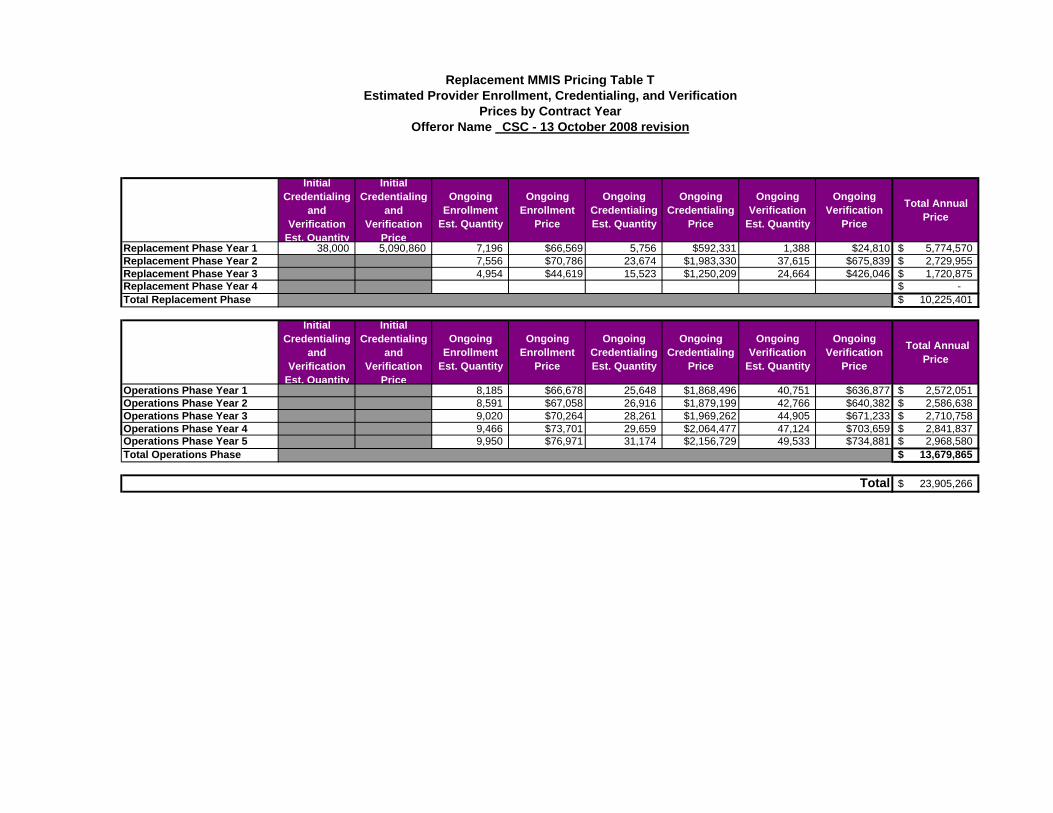
Replacement Phase Year 1 38,000 5,090,860 7,196 $66,569 5,756 $592,331 1,388 $24,810 5,774,570$ Replacement Phase Year 2 7,556 $70,786 23,674 $1,983,330 37,615 $675,839 2,729,955$ Replacement Phase Year 3 4,954 $44,619 15,523 $1,250,209 24,664 $426,046 1,720,875$ Replacement Phase Year 4 -$ Total Replacement Phase 10,225,401$
Initial Credentialing
and Verification
Est. Quantity
Initial Credentialing
and Verification
Price
Ongoing Enrollment
Est. Quantity
Ongoing Enrollment
Price
Ongoing CredentialingEst. Quantity
Ongoing Credentialing
Price
Ongoing Verification
Est. Quantity
Ongoing Verification
Price
Total Annual Price
Operations Phase Year 1 8,185 $66,678 25,648 $1,868,496 40,751 $636,877 2,572,051$ Operations Phase Year 2 8,591 $67,058 26,916 $1,879,199 42,766 $640,382 2,586,638$ Operations Phase Year 3 9,020 $70,264 28,261 $1,969,262 44,905 $671,233 2,710,758$ Operations Phase Year 4 9,466 $73,701 29,659 $2,064,477 47,124 $703,659 2,841,837$ Operations Phase Year 5 9,950 $76,971 31,174 $2,156,729 49,533 $734,881 2,968,580$ Total Operations Phase 13,679,865$
23,905,266$ Total
Replacement MMIS Pricing Table TEstimated Provider Enrollment, Credentialing, and Verification
Prices by Contract YearOfferor Name CSC - 13 October 2008 revision
Time Frame Price Per Month for RetroDUR Services Contract Year Price Per Contract Year for
RetroDUR Services
SFY 08 - 09 July 1, 2008 - June 30, 2009 $ 43,540 Replacement Phase
Year 1 $ 537,308
SFY 09 - 10 July 1, 2009 - June 30, 2010 $ 45,668 Replacement Phase
Year 2 $ 560,773
SFY 10 - 11 July 1, 2010 - June 30, 2011 $ 47,499 Replacement Phase
Year 3 $ 326,891
SFY 11 - 12 July 1, 2011 - June 30, 2012 $ 38,224 Replacement Phase
Year 4 SFY 12 - 13
July 1, 2012 - June 30, 2013 $ 31,841 Operations PhaseYear 1 $ 443,995
SFY 13 - 14 July 1, 2013 - June 30, 2014 $ 32,796 Operations Phase
Year 2 $ 384,486
SFY 14 - 15 July 1, 2014 - June 30, 2015 $ 33,780 Operations Phase
Year 3 $ 395,814
SFY 15 - 16 July 1, 2015 - June 30, 2016 $ 31,314 Operations Phase
Year 4 $ 399,681
SFY 16 - 17 July 1, 2016 - June 30, 2017 $ 18,142 Operations Phase
Year 5 $ 345,453
SFY 17 - 18 July 1, 2017 - June 30, 2018 $ 18,142 Total $ 3,394,401
Replacement MMIS Pricing Table URetrospective Drug Utilization Review - Prices for RetroDUR by State Fiscal Year and Contract Year
Offeror Name CSC - 13 October 2008 revision
Replacement Medicaid Management Information System (MMIS) RFP 30‐DHHS‐1228‐08‐R
Page 28 of 36
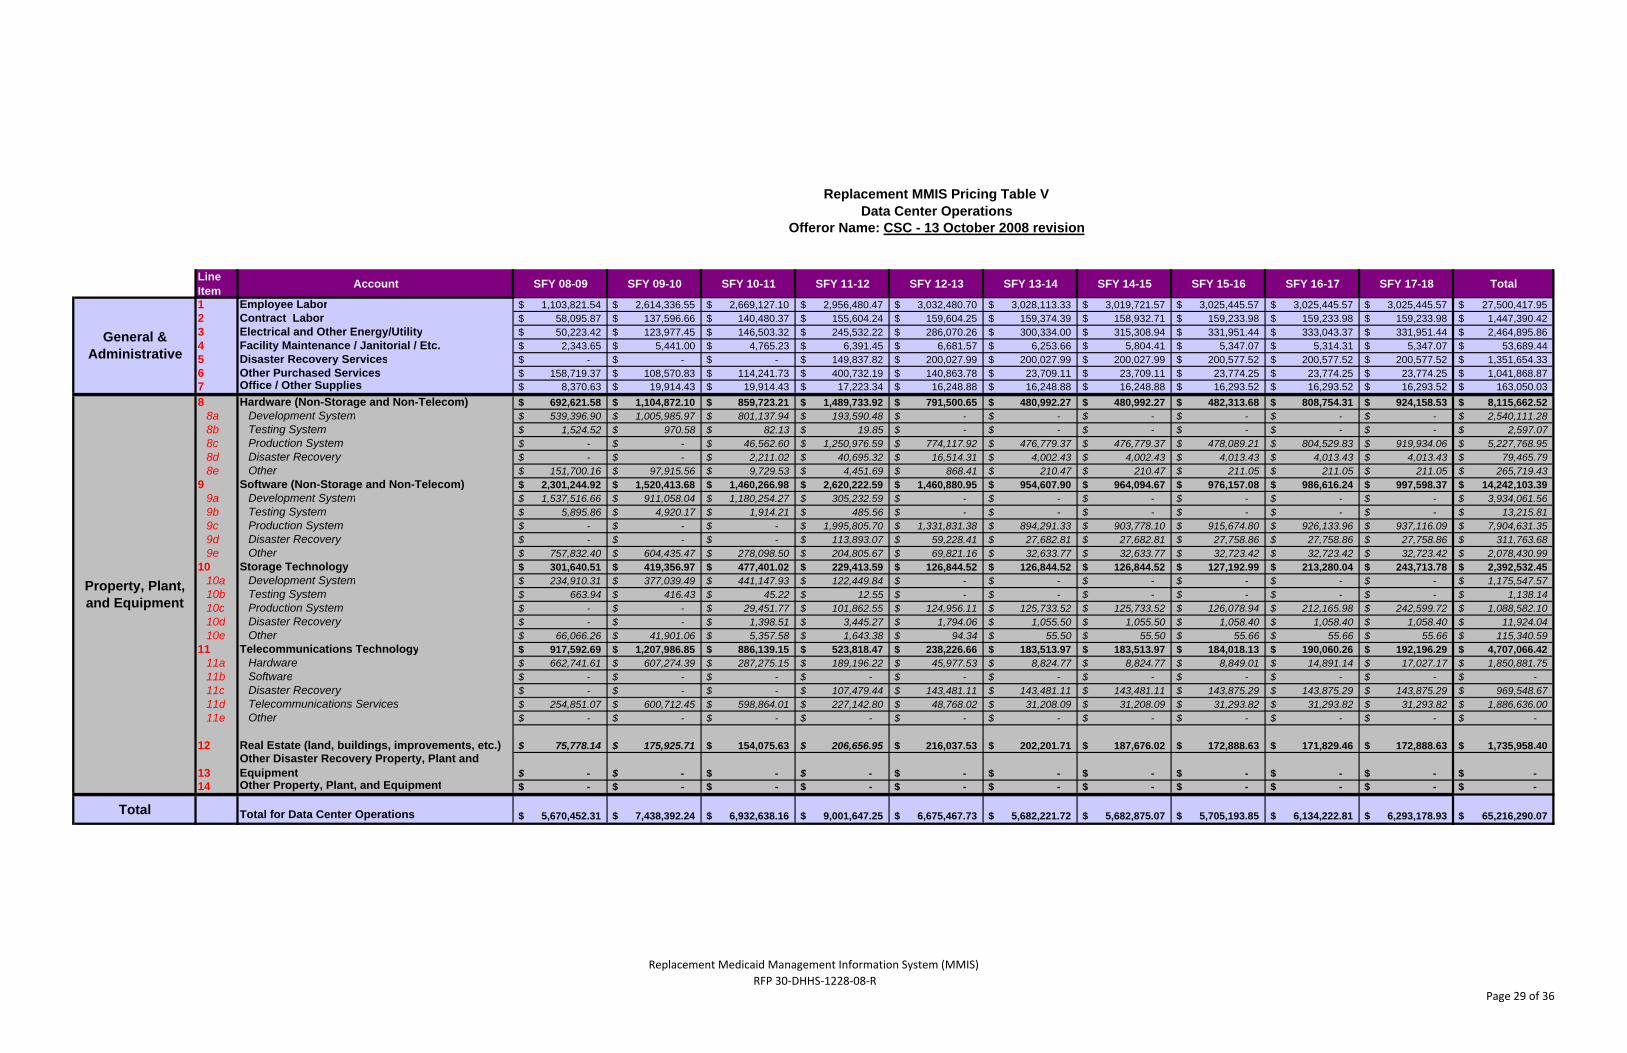
Replacement MMIS Pricing Table VData Center Operations
14 Other Property, Plant, and Equipment -$ -$ -$ -$ -$ -$ -$ -$ -$ -$ -$
Total Total for Data Center Operations 5,670,452.31$ 7,438,392.24$ 6,932,638.16$ 9,001,647.25$ 6,675,467.73$ 5,682,221.72$ 5,682,875.07$ 5,705,193.85$ 6,134,222.81$ 6,293,178.93$ 65,216,290.07$
General & Administrative
Property, Plant, and Equipment
Replacement Medicaid Management Information System (MMIS) RFP 30‐DHHS‐1228‐08‐R
Page 29 of 36
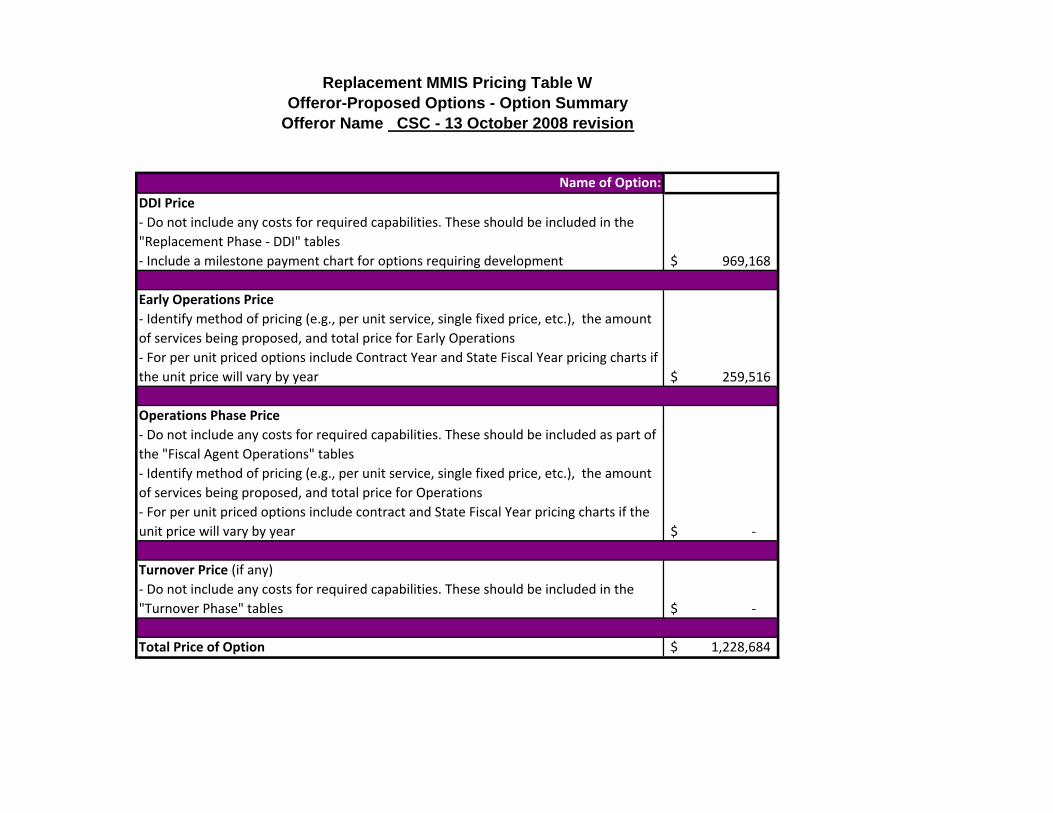
Name of Option:DDI Price‐ Do not include any costs for required capabilities. These should be included in the "Replacement Phase ‐ DDI" tables‐ Include a milestone payment chart for options requiring development 969,168$
Early Operations Price‐ Identify method of pricing (e.g., per unit service, single fixed price, etc.), the amount of services being proposed, and total price for Early Operations‐ For per unit priced options include Contract Year and State Fiscal Year pricing charts if the unit price will vary by year 259,516$
Operations Phase Price‐ Do not include any costs for required capabilities. These should be included as part of the "Fiscal Agent Operations" tables‐ Identify method of pricing (e.g., per unit service, single fixed price, etc.), the amount of services being proposed, and total price for Operations‐ For per unit priced options include contract and State Fiscal Year pricing charts if the unit price will vary by year ‐$
Turnover Price (if any)‐ Do not include any costs for required capabilities. These should be included in the "Turnover Phase" tables ‐$
6 Replacement MMIS Pricing Table T - Estimated Provider Enrollment, Credentialing, and Verification 20,936,685$ 2,968,580$
7 Replacement MMIS Pricing Table U - Retrospective Drug Utilization Review -Prices for RetroDUR by State Fiscal Year and Contract Year $ 3,048,949 $ 345,453
Total
Total Excluding State Cost of Enterprise License Agreements $ 238,473,176 $ 38,449,494 $ 276,922,670
Line Item Table Name Basic Price Option Year Price
1 Replacement MMIS Pricing Table E - Replacement Phase - DDI Marginal Price of Non-Title XIX/XXI Requirements 1,839,919$ N/A
2 Replacement MMIS Pricing Table F - Replacement Phase - DDI Marginal Price of Legislatively-Mandated Requirements $ 1,322,320 N/A
3 Replacement MMIS Pricing Table V - Data Center Operations $ 65,216,290 N/A Total
4 Replacement MMIS Pricing Table W - Offeror-Proposed Options - Option Summary (Sum of all options) $ 1,228,684
$ 1,228,684
5 Replacement MMIS Pricing Table Y - Offeror Exceptions Table (Sum of all exceptions) $ (512,000,000) $ (512,000,000)
Price Tables Not Included in Total Price
Replacement MMIS Pricing Table ZSummary of Proposed Prices
Offeror Name CSC - 13 October 2008 revision
Price Tables Included in the Total Price
Replacement Medicaid Management Information System (MMIS) RFP 30‐DHHS‐1228‐08‐R
Page 36 of 36
North Carolina Replacement Medicaid Management Information System
Pages 1 of 3 through 2 of 3 contain confidential information.
North Carolina Replacement Medicaid Management Information System
Page 3 of 3 (second section) contains confidential information.