14
North Sea Measurement Workshop 1998 PAPER 27 FOCUS DISCUSSION GROUP D GAS ULTRASONICS Karen van Bloemendaal, Gasunie • •

North Sea
Measurement Workshop1998
PAPER 27
FOCUS DISCUSSION GROUP D
GAS ULTRASONICS
Karen van Bloemendaal, Gasunie
•
•

1
16TH NORTH SEA FLOW MEASUREMENT WORKSHOP
ULTRASONIC METERS AND NOISEA TASK OF THE '98 GERG PROJECT ON ULTRASONIC GAS FLOW METERS
K. van Bloemendaal, N.V. Nederlandse Gasunie, Groningen, The Netherlands.G.H. Sioet, N.V. Nederlandse Gasunle, Groningen, The Netherlands.
1 INTRODUCTION
1.1 Background
In 1995, the status of multi-path ultrasonic gas flow metering was investigated by a GERG pro-ject group. This study not only established the state-of-the-art at that moment, but also identifiedgaps in the knowledge of such meters, which could be identified as topics for future research.The results were published in GERG Technical Monograph nr. 8 [1]. .
The most relevant of these "knowledge-gaps" were taken up in a second GERG project on ultra-sonic gas flow meters (USM's). One of these items, the effects of (ultrasonic) noise on USM's,was investigated experimentally by Gasunie, and some results are presented in this paper. Theother subjects of the GERG project, the effects of non-ideal flow, the development of a generaluncertainty model, the development of procedures to evaluate transducers, and attenuation andpropagation of noise in pipelines were or will be reported elsewhere (2, 3, 4, 5). This GERGproject ran in 1997 and 1998, and the project group involved 9 European gas companies: BGTechnology, UK; Distrigaz, Belgium; ENAGAS, Spain; Gasunie, the Netherlands; Gaz deFrance, France; NAM. the Netherlands; Ruhrgas, Germany; SNAM, Italy, and Statoil, Norway.
1.2 Previous Work on USM's and Noise
•
The research of (ultrasonic) noise and the effects of it on USM's is induced by problems withUSM's in the neighbourhood of valves and regulators encountered by users of these meters. Afew times these problems in field locations were published [for example 6. 7,8], but more oftenthe problems are tackled in a practical way. Solutions to the problems are often sought in repla-cing the (silent) regulator with one of a different type, usually a non-silent one, or by increasingthe distance between the regulator and the USM. The 1996 AGA Technical Note on USM's [9]also advises not to install USM's in close proximity to throttling devices, and suggests manufac-turers to improve signal handling by techniques as for example stacking, and to increase thetransducer power in order to increase the signal to noise ratio. In {S] it was possible to increasethe transmission output to the sensors, but this is not usually the case. {101presents a noisesuppression algorithm for a USM.In field situations, varying of flow and pressure difference is often difficult, and noise, if measuredat all, can only be measured at one or two locations. In some publications [11,121 an attempt ismade to investigate the effect of noise on a given meter more systematically. However, thescheduled tests in these cases were curtailed, because the USM'!? would not operate correctlywith substantial pressure reduction, and no noise measurements were performed. In [13] manysound spectra were recorded and compared with the signal level of a USM, but this investigationwas performed at low pressures. [14] presents sound measurements of one regulator and signalto noise ratios of a USM .
1.3 Aim of the Present Work
The aim of the present work is to investigate whether it is, in principle, possible to measure gasflows with USM's in the vicinity of ultrasonic noise sources such as regulators, and if so, howreliable the USM output is. This is done by observation of the performance of as much as possi-ble USM's of different makes in the vicinity of a pressure reducer and simultaneous registrationof the noise disturbance in a more systematic way than has been done up till now. It has notbeen the intention to perform a competitive test, in other words to identify 'tne best meter" .
•

•
2 EXPERIMENTAL SET~UP
2.1 Test Facility
The experiments described in this paper were performed in a test section at the Gasunie labora-tory in Groningen. The gas flows first through the test section and then through the referencemeters, before it is delivered into the distribution network of Groningen city. Pressure is reducednear the inlet from the supply pressure of 40 bar(a) to the desired test pressure and in case thetest pressure is higher than 9 bar(a), between the test section and the reference meters, whoalways operate at the outlet pressure of 9 bar(a). Flow rate is controlled at the outlet of thefacility, and it is limited by the gas demand of the city.
2.2 Pipe Configurations
The test section was about 18 m long. A large part of this section was of 200 mm diameter pipe.The inlet and the outlet of the test section are defined by 150 mm plug valves, which are a fixedpart of the test facility. In the following figures, gas flow is from left to right.
o C 8 A
~ ~ ~ ~
ImrJrl' ====- ==tEt-=::::- :::::::::::=:::::::::::::::;=::::;==~::::-::::::=:-::::::=:-::::::=:-=:::::-:=:::::- =::=:-::::::=:-::::::=:-=,~ ~~ t
Figure 1: Test Set-up With Regulator Downstream (ON)
Figure 1 shows the set-up with the regulator (see 2.3) close to the downstream end of the testsection (ON). Downstream of the 150 mm angular plug valve, the piping expands to 200 mm.Ca. 1.5 m upstream of the end of the test section. the pipe diameter is reduced back to 150 mm.The 100 mm regulator is mounted between two 100-150 mm reducers and is located about 1 mupstream of the outlet valve. The USM's spool piece (see 2.5) is located about 6 m downstreamof the inlet valve; the distance between the USM's and the regulator is about 9 m. Soundmeasurement sensors (see 2.4) are located upstream (D), close to the middle of the test section(C ), further downstream (8) and downstream of the regulator (A).
L N P
r~:EI~~~~~~~~~-~-~-~~~~'~'-*.'~~~II~~~ t
•Figure 2: Test Set-up With Regulator Upstream and USM's in Middle of Test Section (UP-M)
K M 0
IJl~IaI~1IEi!I1 !f.~.t:lI.-==-~-..aD:::::::- :::::::::::::::::=::::::::::::::==!~- ;::::.::=:::;:- :::;-=::::::- :::::;.:::::-::=::::::- =:::::- ~ I' I~
~ WFigure 3: Test Set-up With Regulator Upstream and USM's at Long Distance (UP-L)
2

Figures 2 and 3 show the set-up with the regulator close to the upstream end of the test section,and the USM's spool piece located respectively near the middle of the test section (UP-M), or atlonger distance, about 13 m, from the regulator (UP-L). In the UP-M case, the distance betweenregulator and USM's was about 9 m, the same as in the ON case. Sound measurement sensorswere located at 3 positions downstream of the regulator: close to the regulator (L), near themiddle of the test section (N) and near the end of the test section (P). In the UP-L case soundmeasurement sensors were located upstream of the regulator (K), between locations Land N(M), and between locations Nand P (0).
•2.3 Regulator
The regulator, a 4" axial flow valve see figure 4, is a pro-duct of and made available to the project by MokveldValves [15]. Bodies of such regulators are standard, theinternal cages, the parts where actual pressure reductiontakes place, are sized on specification. For this projectthe maximum pressure difference was set at 27 bar, andmaximum flow rate at 30000 m3/h(s). The regulator wasequipped with a pneumatic actuator so that it could bemoved into position from the control room. Its positionoutput could be read by the data acquisition system.The regulator was mounted both on the downstream andupstream ends of the test section.
•Figure 4: Mokveld Regulator.
Two cage designs were selectedin order to investigate the influen-ce of these constructions on thespectrum, see figure 5. The RVXcage is a "standard" cage with 7slots, which produces a lot of au-dible noise. Noise levels of morethan 100 dB(A) were recorded in
, the test room. The RQX cage is alow noise design with 228 holes, ~L:...~;:-~~"'.'producing considerably lessaudible noise. Figure 5: RVX (left) and RQX Cages.•2.4 . Sound Measurements
Under att test conditions, the noise levels and spectra were measured inside the pipe at severallocations, both upstream and downstream of the regulator (see figures 1 to 3 in section 2.2). Forthe sound measurements, PCB sensors type 132 A 41 [16] were selected. These piezoelectricsensors are very smatt, 3 mm diameter, and may be used in high pressure surroundings. Res-ponse is claimed to be accurate within Yz dB in the range up to 500 kHz. Calibration results ofthe sensitivity, in the order of 3000 mVipsi, are supplied with each sensor.
The signal of the sensor was recorded on a digital storage oscilloscope. Every sound measure-ment consists of 60000 data points, sampled at 1 us, which were stored on file and processedoff-line in a Matlab-environment. Every measurement was transformed into a spectrum by a FFTprocedure, from which sound pressures in 1/3 -octave frequency bands were calculated. Meansound pressure values over the frequency range of 50-500 kHz were calculated from these.
3
2.5 Ultrasonic Meters
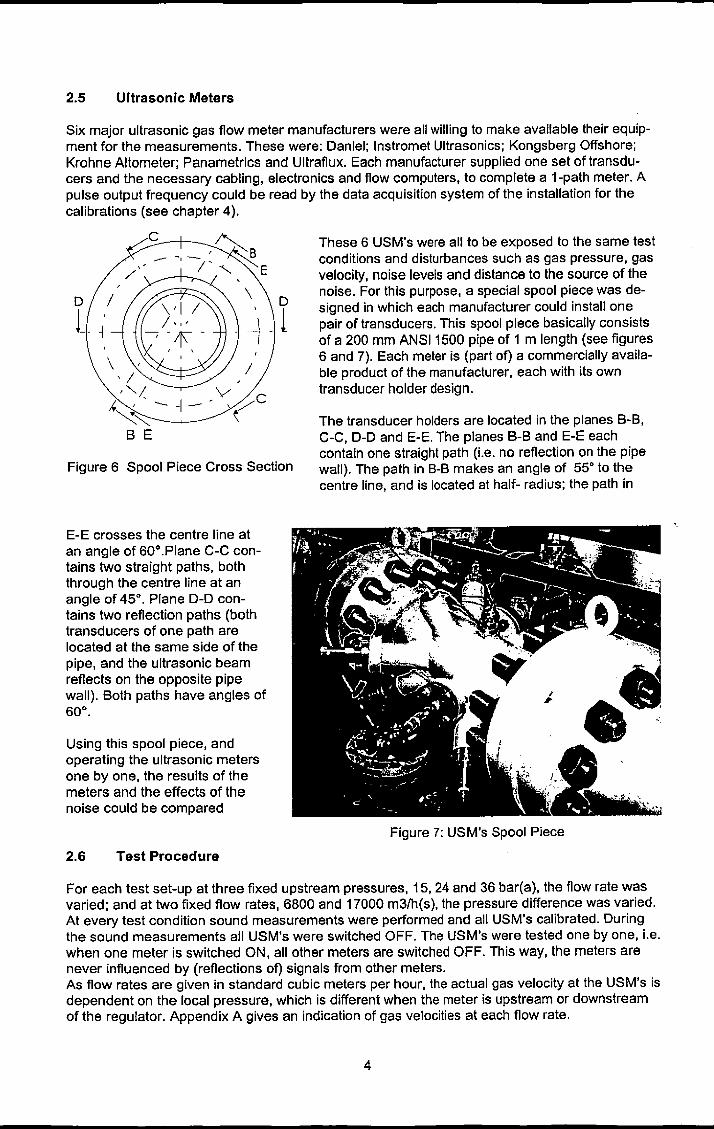
Six major ultrasonic gas flow meter manufacturers were all willing to make available their equip-ment for the measurements. These were: Daniel; Instromet Ultrasonics; Kongsberg Offshore;Krohne Altometer; Panametrics and Ultraflux. Each manufacturer supplied one set of transdu-cers and the necessary cabling, electronics and flow computers, to complete a t-path meter. Apulse output frequency could be read by the data acquisition system of the installation for thecalibrations (see chapter 4).
Figure 6 Spool Piece Cross Section
E-E crosses the centre line atan angle of 60°.Plane C-C con-tains two straight paths, boththrough the centre line at anangle of 450
• Plane D-D con-tains two reflection paths (bothtransducers of one path arelocated at the same side of thepipe, and the ultrasonic beamreflects on the opposite pipewail). Both paths have angles of600
•
Using this spool piece, andoperating the ultrasonic metersone by one, the results of themeters and the effects of thenoise could be compared
2.6 Test Procedure
These 6 USM's were aUto be exposed to the same testconditions and disturbances such as gas pressure, gasvelocity, noise levels and distance to the source of thenoise. For this purpose, a special spool piece was de-signed in which each manufacturer could install onepair of transducers. This spool piece basically consistsof a 200 mm ANSI 1500 pipe of 1 m length (see figures6 and 7). Each meter is (part of) a commercially availa-ble product of the manufacturer, each with its owntransducer holder design.
The transducer holders are located in the planes 8-B,C-C, D-D and E-E. The planes B-8 and E-E eachcontain one straight path (i.e. no reflection on the pipewail). The path in B-B makes an angle of 550 to thecentre line, and is located at half- radius; the path in
Figure 7: USM's Spool Piece
For each test set-up at three fixed upstream pressures, 15, 24 and 36 bar(a), the flow rate wasvaried; and at two fixed flow rates, 6800 and 17000 m3/h(s), the pressure difference was varied.At every test condition sound measurements were performed and all USM's calibrated. Duringthe sound measurements all USM's were switched OFF. The USM's were tested one by one, i.e.when one meter is switched ON, all other meters are switched OFF. This way, the meters arenever influenced by (reflections of) signals from other meters.As flow rates are given in standard cubic meters per hour, the actual gas velocity at the USM's isdependent on the local pressure, which is different when the meter is upstream or downstreamof the regulator. Appendix A gives an indication of gas velocities at each flow rate.
4
•
•
•
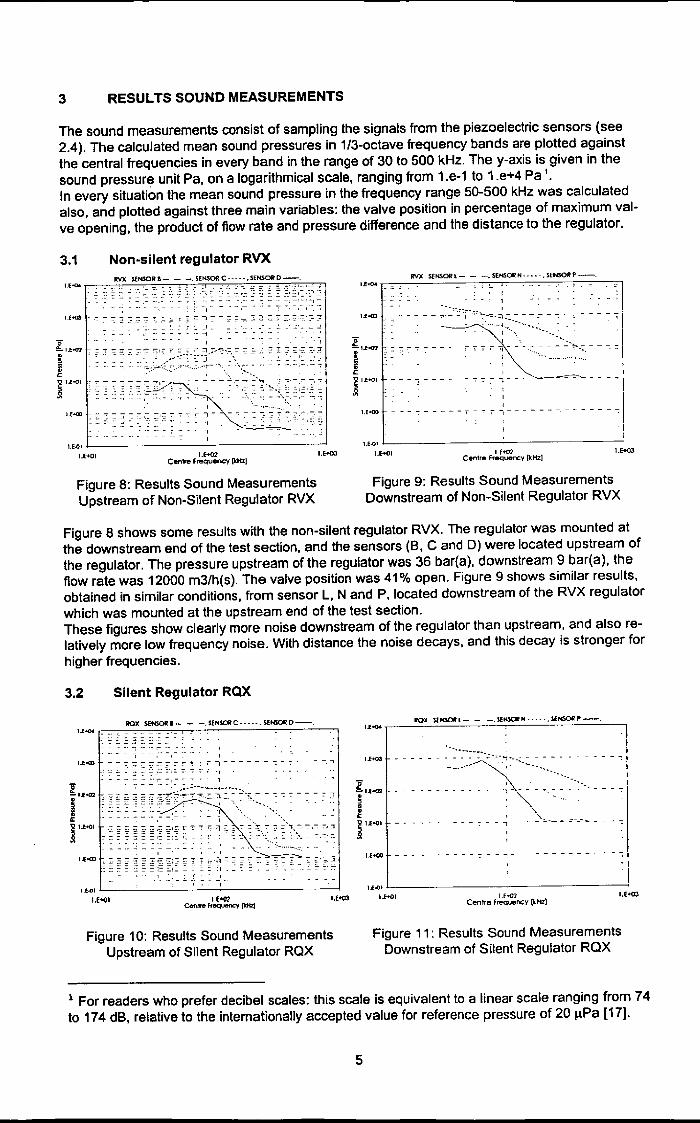
The sound measurements consist of sampling the signals from the piezoelectric sensors (see2.4). The calculated mean sound pressures in 1/3-octave frequency bands are plotted againstthe central frequencies in every band in the range of 30 to 500 kHz. The y-axis is given in thesound pressure unit Pa, on a logarithmical scale, ranging from 1.e-1 to 1 .e+4 Pa 1.
In every situation the mean sound pressure in the frequency range 50-500 kHz was calculatedalso, and plotted against three main variables: the valve position in percentage of maximum val-ve opening, the product of flow rate and pressure difference and the distance to the regulator.
Figure 8 shows some results with the non-silent regulator RVX. The regulator was mounted atthe downstream end of the test section, and the sensors (B, C and D) were located upstream ofthe regulator. The pressure upstream of the regulator was 36 bar{a). downstream 9 bar(a), theflow rate was 12000 m3fh{s). The valve position was 41% open. Figure 9 shows similar results,obtained in similar conditions, from sensor L, Nand P, located downstream of the RVX regulatorwhich was mounted at the upstream end of the test section.These figures show clearly more noise downstream of the regulator than upstream, and also re-latively more low frequency noise. With distance the noise decays, and this decay is stronger forhigher frequencies.
3 RESULTS SOUND MEASUREMENTS
3.1 Non-silent regulator RVX
• ,.£<00
•• 1_ .•••. ~. ~' '. •• '1
....",l----------------~I.(-+{Jl 1.E<02
Centre Fre~ (ktuj
Figure 8: Results Sound MeasurementsUpstream of Non-Silent Regulator RVX
3.2 Silent Regulator RQX• ReX SEt<SOU _ _ -. SENSORC ...... SENSOIW-.1..f+04 .... ~ '._ .•... __ ,_ .. _ _ .
- ~.~~.. - - .- _. -. - ." :; '::. .::. :1 '::. :: ;,,:-.~;_-;.: " .. i
~ •••••• _ •• - -, .• - ,.. _. "I,1..E-toOl :-: -:;:- -;:: :;; -: -; r: -; ::- t- ':'; T r- .., - - - - - - -: - :- - ~ - -:::-.~
: ' !
i::.. -:::':-;:~:;~~::;~:.:::~-:-:Ii,~..":-~--;-----~7 7 , -: - - - - -c-c, - - - -I
1.E>OO •.' ., - - ., - - - - - r ~7 ., ~ - - - - - - - - - - - - - -; Il.E.()ll--------.......;:......-~-----..-'1
l.E-oOI I!_ l.E+03Cenlre Frequency (kN<j
Figure 9: Results Sound MeasurementsDownstream of Non-Silent Regulator RVX
11'0)[ UPGORl- - _.s.ENKlI'N .....• SfNSC.'«P"-.I....,.........--=-...:.:.----~.:..:.::..,.:..:......-.......:..........:...=----'-----,
,.£<00 -- -- - - ---~..~~~~.<z.<.::,~,~,.-.,~...--- - - - -t
- - - . - - - - - - . - - ~, - • :.-.-">~- - - :: -,
- - - - _. - ~- -;: - - -. - - - - :.---- ~---.-- - - -:
_____ .L :- __ -:._ - - - - - - - - - - - --;
_ :! :.::."~~-::.'_ L } ,_ . _1_1-E..o1 L...._---'---_........:. __ .~. _. ....;' ----1 1.f.a~ l..-- ........;
L(-+{JI 1.«02 1.E+<rl 1.£-001eon ... ffeq.JerCy (kHzl
Figure 10: Results Sound MeasurementsUpstream of Silent Regulator RQX
I.Eo01Centre ~ueno;y [kN<j
l.eo<o
Figure 11: Results Sound MeasurementsDownstream of Silent Regulator RQX
• 1 For readers who prefer decibel scales: this scale is equivalent to a linear scale ranging from 74to 174 dB, relative to the internationally accepted value for reference pressure of 20 IlPa [17].
5

Figures 10 and 11 show results of the silent regulator RQX, under test conditions correspondingto those of figures 8 and 9. Although this regulator is a low-noise one, designed for low noise inthe audible range and outside the pipe, this regulator produces more noise inside the pipe in thefrequency range of interest 30-500 kHz.
3.3 Mean Sound Pressure in Relation to Q*dP. Valve Position and Distance
Analysis of all (more than 500) obtained spectra revealed that the spectrum depends on regula-tor type, pressure difference across the regulator and flow rate, valve position, and distance tothe regulator. In order to show these dependencies, the mean sound pressure (MSP) in the fre-quency range from 50 to 500 kHz is calculated for every test condition. Similar calculations wereperformed with two or more smaller ranges, to see the effect of frequency range.Presented here is MSP(50-500 kHz) as a function of the valve position V, as a function of theproduct of flow and pressure difference Q*dP which are important parameters in the generationof noise inside the regulator, and as a function of distance to the regulator x as noise is known todecay with distance. Because of the large similarity, only results of non-silent regulator RVX arepresented graphically.
Figures 12 and 13 show mean sound pressures MSP for regulator RVX, upstream and down-stream of the regulator, as a function of the valve position. Only data points from the sensorsclosest to the regulator, Band L respectively, are given in the figures, The other sensors showSimilar patterns. but at lower values.The 5 different experiment series are clearly recognisable: three lines with fixed pressures andvariable flow rates, and two lines with fixed flow rate and variable pressures. At a given flow rate,increasing valve opening means decreasing pressure difference, and accordingly decreasingsound pressure. At a given pressure difference. with increasing valve opening, flow rate andsound pressure increase.With regulator RQX similar results were obtained.
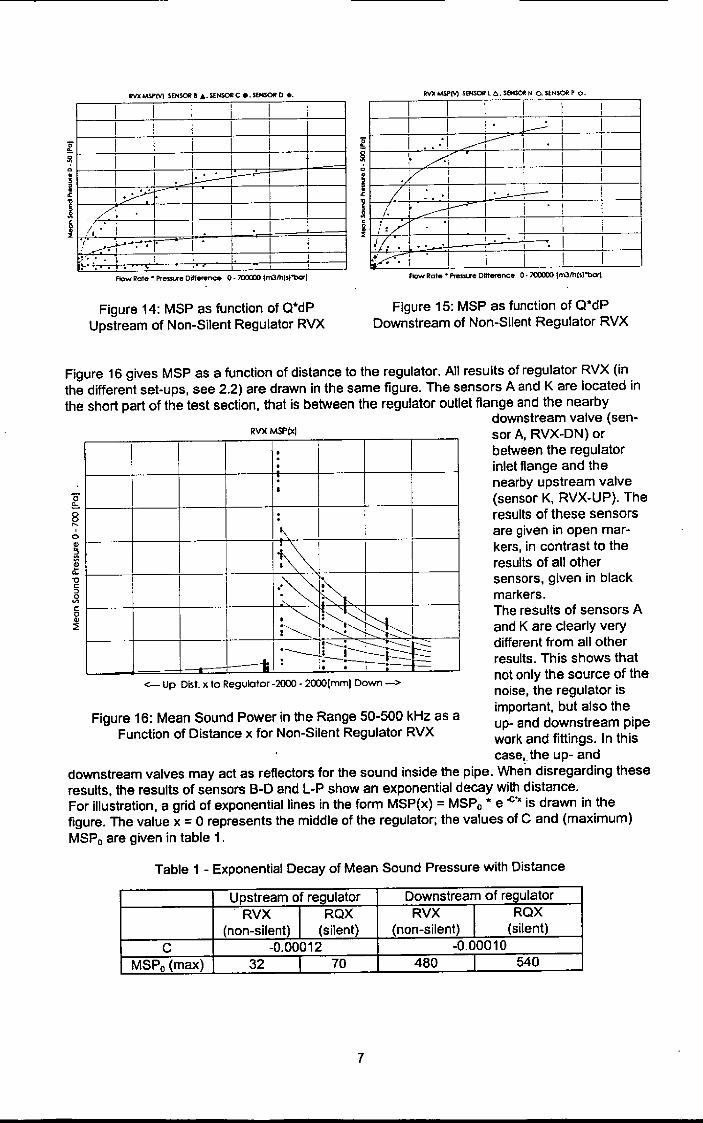
Figures 14 and 15 show mean sound pressures for regulator RVX. upstream and downstream ofthe regulator. With some scatter. the mean sound pressure fits logarithmically with the product offlow rate and pressure difference Q*dP. Curve fits in the form MSP = A * In(Q*dP) - B are drawnin the figures. Factor A decreases with increasing distance to the regulator.A has larger values with silent regulator RQX than with non-silent regulator RVX. The differencebetween RQX and RVX increases with increasing distance, and is larger upstream thandownstream of the regulator.
l /~~-+--~--+-~--~--~~--~--+-~0r--+--~--r-~--~~r-~--~--r-~i·/ '···1·· ..1r-~--~--~··~··~:··+·~~-.-··~i~·-··~··+·~·~··.~--~-1] 1--~+---+--"'4' "0..,,-' --!.I------!_~t-···_+=~i1---+--+-',...,+1' ".-.. -=··· ..=...t.:::...::.:::·:.~=:,.J!..L~•... _···+·t_···_····-+· --~--t---I
i:':::;'" I '1'..
Valve PCHllion to· I 00 ~1
Figure 12: MSP as function of Valve PositionUpstream of Non-Silent Regulator RVX
•
! 1 I 1 I I II
I I···· I' I I I1I ", I
I T: I > j. i I i.. I· ,1 "1 ~. I.·· .' ., I !-'t
I I' . ! I ! I". ,
I r 1 1 i I. \ 1 .J I I'i ,:" I I..··I' , . ,' ..' .
... .,.:-' ..,_ .. , I
; , i I II
I ,'I, i 1 ,
I, I ,
v e tv. Posilion [0 • 100 ~I
Figure 13: MSP as function of Valve PositionDownstream of Non·Silent Regulator RVX
•
•6
RVX MSf'M !EN$OI! B .. ~NSOR c. 5~ 0 ••• I 1 1 1 1
1 1 1 1
1 I 1 1
1 1 1
I 1 ~I~ 1
//~ 1/ . I1 1 1/, . .
!~ . . r .1 I
~'< •• ~ • • I , ,Row Rat" • Pr......... Dllfe<ence O· 700000 {rn3/hl.)"bar1
Figure 14: MSP as function of O-dPUpstream of Non-Silent Regulator RVX
• RVXMSPlxl
8r-,
1 1 1 1
1 I' 1..-: ! 1. ---r- I 1 1../" I 1 I 1
v 1 I 1 1
71 :. ·1 I'~ I I/: . ---r--- 1 I 1 I,
i./1 i 1i I. . I
i/. . L. . I I I~ . . , Iv- ! 1 1 I I I• I
Row Rat,,' """","" Dlltttrttnce 0·700000 {rn3lhl.l"bar1
Figure 15: MSP as function of O-dPDownstream of Non-Silent Regulator RVX
<- Up Dist. x 10 Regulator -2000 - 2OOO[mml Down ->
Figure 16 gives MSP as a function of distance to the regulator. All results of regulator RVX (inthe different set-ups, see 2.2) are drawn in the same figure. The sensors A and K are located inthe short part of the test section, that is between the regulator outlet flange and the nearby
downstream valve (sen-sor A, RVX-DN) orbetween the regulatorinlet flange and thenearby upstream valve(sensor K, RVX-UP). Theresults of these sensorsare given in open mar-kers, in contrast to theresults of all othersensors, given in blackmarkers.The results of sensors Aand K are clearly verydifferent from all otherresults. This shows thatnot only the source of thenoise, the regulator isimportant, but also theup- and downstream pipework and fittings. In thiscase, the up- and
downstream valves may act as reflectors for the sound inside the pipe. When disregarding theseresults. the results of sensors 8-D and L-P show an exponential decay with distance.For illustration. a grid of exponential lines in the form MSP(x) = MSPo - e .c'x is drawn in thefigure. The value x = 0 represents the middle of the regulator; the values of C and (maximum)MSPo are given in table 1.
··•·I·
I·~
I I~~':~ ~ I
\.~1~~~N~ I
I:---!L~.... : I' -r- -----II •• I
• Figure 16: Mean Sound Power in the Range 50-500 kHz as aFunction of Distance x for Non-Silent Regulator RVX
Table 1 - Exponential Decay of Mean Sound Pressure with Distance
Upstream of regulator Downstream of regulator
. RVX 1 RQX RVX 1 ROX(non-silent) (Silent) (non-silent) (silent)
C -0.00012 -0.00010MSPo (max) 32 I 70 480 I 540
7

The exponent C gives the decay rate. In the frequency range 50-500 kHz, the upstream noisedecays faster (C = -0.00012) than downstream noise (C = -0.00010). From the calculations withdivided frequency ranges it follows that exponent C is larger for higher frequencies than for lowerfrequencies: the decay goes faster for higher frequencies •The base MSPo, both upstream and downstream, is larger for the silent regulator RQX than forthe non-silent regulator RVX. The "silenr regulator is producing more noise inside the pipe in therange of 50-500 kHz, than the "noisy" one. The ratio of noise for the two regulators RVX andRQX is not the same at the different sides of the regulator: upstream it is 0.5, downstream 0.9.These ratios change slightly with frequency.Also, the base MSPo is much larger downstream than upstream for both regulators. This meansthat more noise is measured downstream of the regulator than upstream. The ratio downstream-upstream noise is not the same for these two regulators: 15 for regulator RVX and 7.7 for regula-tor RQX. These values are lower for higher frequencies, and higher for lower frequencies. Noiseat lower frequencies is thus better "separated" by the regulator than noise at higher frequencies.
4 RESULTSULTRASONICMETERS
4.1 Presentation of calibration results
The USM's are calibrated against the Gasunie reference flow meters during 3 times 100 s. Forconfidentiality reasons, the results of the calibrations of each USM in test situations with regula-tor are only presented as error shifts compared to the mean error of the same meter in "idealflow": the calibration of the meter at the same pressure, when no regulator is mounted in the line.The results of these "ideal" calibrations are not presented in this paper.A calibration of a USM under noise disturbed conditions is only sensible if the meter is functio-ning continuously. If one or more USM's are partially failing, one should assess its performancein another way, for example with a performance comparison method as described below.
•4.2 A Performance Comparison Method
As ultrasonic meters are based on a measuring principle using a beam of sound, it is likely to ex-pect that they may be disturbed by sound in the right frequency range andlor of sufficient power.Field experience learns that this is indeed the case. When both the ultrasonic beam and noisereach the receiving sensor of the USM, it will be more difficult or even impossible to detect theright signal out of it and from that, calculate a correct gas flow velocity. The output that is shownto the user, in this case the frequency of the pulse output, depends on signal strength, signal de-tection, analysis techniques and often also on user-set parameters.The following four types of behaviour and the effect on the error curves of the meter, were ob-served in the experiments. In brackets the number of meters that showed this behaviour isgiven; one meter may be in different categories. •1 The meter fails, and the pulse output frequency is set to zero Hz. If the failure is complete, a
meter error E of -100% will be found. If the meter only part of the time is failing, the error willbe smaller. (4 meters).
2 The meter fails, and the pulse output frequency is set to a user specified "error-frequency",usually a frequency much higher than the maximum flow rate frequency. If the failure is com-plete, a high error E will be found. The value of E is dependent of the error-frequency, thefrequency factor and the actual flow rate. If the meter is only partially failing, then the more itfails, the higher the meter error is. (1 meter).
3 The meter continues working but with a larger output variation. In the error curve more scat-ter will be observed. If the variation is on a relatively small time base, it is filtered out duringthe measurement time of in this case 100 s. (2 meters).
4 The meter continues working but with erroneous output. The resulting error shift is usually ofseveral percents. The wrong output may be steady or switching between distinct values (2meters).
•8

• For every test condition, each USM is given a "performance number" according to the schemebelow. From all these performance numbers for each test set-up (USM's upstream or down-stream of the regulator, the latter at two distances), a mean performance number Pi is calculatedfor each individual USM and Pm for all USM's together 2.
100 % IF90% IF
OR75% IF
OROR
50 % IFOR
25% IFOROR
10% IF0% IF
• ,.t---+---f------!---+-----1
..•to t-~-+---I------!---+-----1
USM functions correctly all the time AND meter error E is smaller than 1 %USM functions correctly all the time AND E lies between 1 and 5 %,USM functions but shows some alarms AND E is smaller than 1 %USM functions all the time AND E lies between 5 and 20 %,USM functions but gives regular alarms AND E lies between 1 and 5 %USM fails sometimes AND E is smaller than 1 %USM fails sometimes AND E lies between 1 and 5 %USM functions only half of the time AND E is smaller than 1 %USM functions only sometimes AND E is smaller than 1 %USM functions half of the time AND E lies between 1 and 5 %USM functions (almost) all the time AND E is larger than 20 %USM functions only a few times shortlyUSM is not functioning at all
4.3 Results with USM'sUpstreamof the Regulator
Figure 17 and 18 show meter error shift curves for all six USM's located near the middle of thetest section, upstream of the regulator which is mounted at the downstream end of the testsection (RVX-DN and ROX-DN). These are the results of the experiments with fixed upstreampressure, 15, 24 or 36 bar(a), and varying flow rate. The curves are given as error shifts relativeto the meter error Emeso.Base from the calibration of the same USM at the same pressure but' inabsence of the regulator (see 2.6 and 4.1).
Except for the lowest flow rates, almost all error shifts are well within ±2 %. Although the noise isat relatively low level in these situations, at the lowest flow rates of less than 1.5 mIs, the shiftsof some USM's are much larger: within ±15%. As almost all USM's kept on functioning almost aUthe time, the mean performance numbers Pm are 94% with the non-silent RVX regulator, and93% with the silent ROX regulator. All meters were in one way or another affected by the noise,the maximum PI was not 100% but 98%. For some USM's the noise from silent regulator RQXwas more severe than the noise from non-silent regulator RVX: the lowest individualperformance numbers PI were 81% (RQX) vs. 91% (RVX) .
,.rr-__ .-_~lIVXr·:!!tI~24~-=_,--___r--__,
l • ;:~J. I.
Ii " •
~~~--r---r---r---~----I
.I I • • •
.c.I--__ L- __ L-_--I __ ---L__ ---'
• •.......~ .. usw....,.1..
Figure 17: USM's Meter Error ShiftsUpstream of Non-Silent Regulator RVX
2 Note that this is a selection scheme, in which error deviation and failing time are rated as goodas equal. If one would appoint more value to the reliability of the answer or to the amount of timeit is failing, this scheme and the mean performance numbers Pi and Pm could be quite different.
. . I• •ji ~ I
.
... II •
to
..-II
-c... .. II
Figure 18: USM's Meter Error ShiftsUpstream of Silent Regulator RQX
9
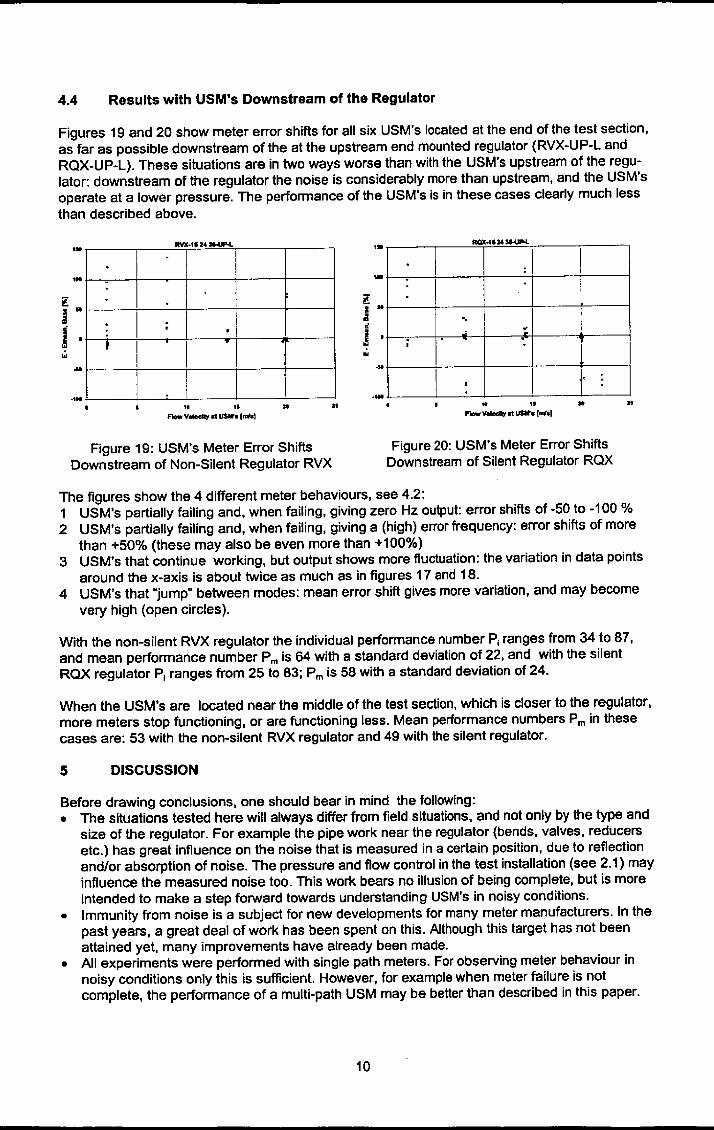
4.4 Results with USM·s Downstream of the Regulator •Figures 19 and 20 show meter error shifts for all six USM's located at the end of the test section,as far as possible downstream of the at the upstream end mounted regulator (RVX-UP-L andRQX-UP-L). These situations are in two ways worse than with the USM's upstream of the regu-lator: downstream of the regulator the noise is considerably more than upstream, and the USM'soperate at a lower pressure. The performance of the USM's is in these cases clearly much lessthan described above.
The figures show the 4 different meter behaviours, see 4.2:1 USM's partially failing and, when failing, giving zero Hz output: error shifts of -50 to -100 %2 USM's partially failing and, when failing, giving a (high) error frequency: error shifts of more
than +50% (these may also be even more than +100%)3 USM's that continue working, but output shows more fluctuation: the variation in data points
around the x-axls is about twice as much as in figures 17 and 18.4 USM's that "jump" between modes: mean error shift gives more variation, and may become
very high (open circles).
With the non-silent RVX regulator the individual performance number PI ranges from 34 to 87,and mean performance number Pm is 64 with a standard deviation of 22, and with the silentROX regulator PI ranges from 25 to 83; Pm is 58 with a standard deviation of 24.
IMI,SZ4-.t.•• .
····· I ; ,
• I jJ
i
'M
lJ to
J ·...
·'M11 11
Aow v-.y at USM'. l..nl..
Figure 19: USM's Meter Error ShiftsDownstream of Non-Silent Regulator RVX
,to_ 1I2411-11N.
...
:·
I.
\··
'..:· .
I
I,. :
I
l• to.a
J ·.. ...·OM
as as
Figure 20: USM's Meter Error ShiftsDownstream of Silent Regulator RQX
When the USM's are located near the middle of the test section, which is closer to the regulator,more meters stop functioning, or are functioning less. Mean performance numbers Pm in thesecases are: 53 with the non-silent RVX regulator and 49 with the silent regulator.
Before drawing conclusions, one should bear in mind the following:• The situations tested here will always differ from field situations. and not only by the type and
size of the regulator. For example the pipe work near the regulator (bends, valves, reducersetc.) has great influence on the noise that is measured in a certain position, due to reflectionand/or absorption of noise. The pressure and flow control in the test installation (see 2.1) mayinfluence the measured noise too. This work bears no illusion of being complete, but is moreintended to make a step forward towards understanding USM's in noisy conditions.
• Immunity from noise is a subject for new developments for many meter manufacturers. In thepast years, a great deal of work has been spent on this. Although this target has not beenattained yet, many improvements have already been made.
• All experiments were performed with Single path meters. For observing meter behaviour innoisy conditions only this is sufficient. However, for example when meter failure is notcomplete, the performance of a multi-path USM may be better than described in this paper.
5 DISCUSSION•
•10

11
• There is no "best meter". All meter characteristics, such as performance in pulsating flow,response times, maximum flows, error handling, and not to forget immunity from noise are aresult of the specific combination of mechanical construction, path dimensions, techniques ofsending and detecting of signals, signal analysis, filtering, etc. Many of these characteristicsmay also be influenced by a number of user-set parameters. For example: during the experi-ments, one meter kept on operating in almost all test conditions, albeit at the expense oflarge output variations; another meter was clearly indicating when it was failing, but if it wasoperating the output was highly reliable (no Significant error shift nor variations). This makesit difficult to compare USM's, and select a "best one". A user should identify his specificconditions and needs, and select a meter accordingly.
6 CONCLUSIONS
•
• In-duct sound measurements near a Mokveld regulator were performed in which a "non-silent" RVX and a "silent" RQX internal cage were used. The regulator with RQX cageproduces indeed considerable less audible noise outside the pipe, but more ultrasonic noiseinside the pipe than with the RVX cage.
• The measured mean sound pressures of the noise fit logarithmically with the product of flowrate through and pressure difference across the regulator.
• Downstream of the regulator more noise was measured than upstream, and also relativelymore low frequency noise.
• With distance the noise decays exponentially, and this decay is stronger for higher frequen-cies. The exponent C is larger upstream than downstream, which is a result of the frequencydistribution: upstream relatively more higher frequency noise was registered.
• USM's may behave differently when subjected to noise: 4 different categories of behaviourwere described. Many factors, including user-set parameters, influence the type of behavioura meter adopts in a given situation.
• In general, a USM functions better when it is mounted upstream from the regulator, where thesound pressure is considerably less, and the operational pressure is higher. Furthermorebecause of the frequency distribution, the noise decays a bit faster than downstream, thusthe effect of shifting the meter away from the regulator is larger.
• The mean performance of all USM's with the non-silent regulator cage RVX is better thanwith the silent cage RQX.
• The worst case (USM's at close distance to RQX regulator) still resulted in a mean perfor-mance number of 49%. The best case resulted in a mean performance number of 94%. Thisindicates that it is indeed possible to measure gas flows with USM's in the vicinity of aregulator. However, at this moment not with all meters and not under all circumstances.
• The work described in this paper is far from complete. In order to get a full picture of noisegenerated by regulators, future research could perform similar experiments under differentcircumstances: other pressure reducing devices, different flow and pressure regimes, varyingdistances to the regulator, and studying the effect of other devices such as bends anddiffusers in the flow.
• Manufacturers of USM's have done a great deal of work on immunity from noise, and havealready reached a number of successes. Although several meters have shown very goodperformances, no meter is perfect under every condition. Further development will benecessary. From the users point of view, more co-operation between the manufacturerscould be a good idea.
•
7 ACKNOWLEDGEMENTSThe authors wish to express their gratitude to all who contributed to this part of the GERGproject, which are to many to be named here: colleagues from the gas companies partiCipatingin the project, representatives from the manufacturers who made available equipment andexpertise to the project, and several colleagues from within Gasunie.
•

Tests are indicated with codes in the form RRR-FF-PP-N, or parts of these., which stands for:RRR = RVX or RQX Regulator with standard "non-silent" cage RVX or with "silent" cage RQXFF = 9, 15, 24 or 36 Test pressure of 9, 15, 24 or 36 bar(a), and variable flow rateFF = LO or HI Flow rate is LOw or High, 6800 or 17000 m3/h (s), pressure variablePP = UP or ON Regulator at UPstream or DowNstream end of the test sectionN = M, L USM's spool piece at Medium or Long distance from regulator
8
[1]
[2]
[3]
[4][5]
[6]
[7]
[8]
[9]
[10J
[11 J
[12]
[13]
[14J
[15][16J
{17]
9
dPEEmean. Base
MSPPIPmUSMQ
VX
Lygre, A., Lunde, P., and Freysa, K.-E.: Present Status and Future Research on Multi-Path Ultrasonic Gas Flow Meters. GERG Technical Monograph Nr. 8 (1995).Hilgenstock, A., Ho.wener, Th., and Nath, B.: Kalibra® - A Fast Numerical Method forDetermining Installation Effects in Ultrasonic Flowmeters. 9th International Conferenceon Flow Measurement FLOMEKO '98. Lund, Sweden.Lunde, P., Fr"ysa, K.-E., and Vestrheim, M.: Garuso version 1.0. Uncertainty Model forMultipath Ultrasonic Transit Time Gas Flow Meters. CMR report no. CMR-97-A10014.Development of procedures to evaluate transducers: to be published by Statoi1 in 1998.Brassier, P., Hosten, B., Castaings, M., and Vulovic, F.: Study of Ultrasonic Disturban-ces in Gas Pipelines. Universite de Bordeaux and Gaz de France, December 1997.Rogi, M.J., Williamson, 1.0., and McBrien, R.K.: Single Path Ultrasonic Meters, Petter-mance Evaluation and Operational Experience. A.G.A. Op. Cont. 1996. Montreal.Smits, T.C.L.: Acoustic Noise Investigation GASSONIC ® - 400 Ruhrgas Winterswijk.Stork Servex report 014853.TST.OO1. August 1994.Agricola, J.B.: Gas Well Flowline Measurement by Ultrasonic Flow Meter. North SeaFlow Measurement Workshop 1997. NorwayAmerican Gas Association. Ultrasonic Flow Measurement for Natural Gas Applications.Engineering Technical Note M-96-2-3, March 1996. Darlington, Virginia.Kristensen, B.D., Lofsei, C., Fmysa, K.-E.: Testing of Noise Suppression System forMultipath Ultrasonic Gas Flow Meters. North Sea Flow Measurement Workshop 1997.Bloemendaal, K. van, and Kam, P.M.A. van der: Installation Effects on Multi-Path Ultra-sonic Flow Meters: the Ultraflow Project. North Sea Flow Measurement Workshop 1994.Scotland, UK.Vulovic, F., Harbrink, B., and Bloemendaal, K. van: Installation Effects on a MultipathUltrasonic Flow Meter Designed for Profile disturbances. North Sea Flow MeasurementWorkshop 1995, Norway.Bruggeman, J.C., Hopmans, L.J.M., Looijmnas, K.H.N.: Sound Power Radiated intoPipes by Control Valves. TNO report TPD-HAG-RPT-960041. April 1996.Fr0ysa, K.-E., Lunde, P., Sakariassen, R., Grendstad, J., and Norheim, R.: Operationsof Multipath Ultrasonic Gas Flow Meters in Noisy Environments. North Sea Flow Mea-surement Workshop 1996. Scotland, UK.Control Valves. Commercial brochure Mokveld Valves B.V., Gouda, The Netherlands.Series 132A30 & A40. ICP® Microsensor for High Frequency and Dynamic PressureMeasurement. Commercial brochure PCB Piezotronics Inc., Depew, NY, USA.Norton, M.P.: Fundamentals of Noise and Vibration Analysis for engineers. CambridgeUniversity Press, 1989.
REFERENCES
NOTATION
Pressure difference across regulatorMeter Error (Qmeter- Qrererence)/Qreference* 100 %Mean Meter Error in baseline calibration at the same pressureMean Sound PressurePerformance number for individual USM, based on all test conditionsMean performance number for all USM's, based on all test conditionsUltraSonic (gas flow) MeterFlow rateValve position in percentage of maximum (=open)Distance to regulator
12
•
•
•[bar][%][%J[PaJ[%][%][-][mJ/h (5)][%J[mm]
•

13
• APPENDIX A
Table A 1: Indication of local gas velocities in rnIs at USM's for each flow rateas a function of pressure at USM's.
USM's USM's USM's USM'sdonwstream of upstream of upstream of upstream of
regulator regulator regulator regulator
Flow rate 9 bar(a) 15 bar(a) 24 bar(a) 26 bar(a)
in m3/h(s)27000 32 19 12 8
22000 26 15 10 6
17000 20 12 7 5
12000 14 8 5 3
6800 8 5 3 2
1700 2 1 1 1
•
•


