27
North York Moors National Park Authority Report on the Economy of the Whitby (2015) Final report May 2015 Amec Foster Wheeler Environment & Infrastructure UK Limited

North York Moors National Park Authority
Report on the Economy of the Whitby (2015)
Final report
May 2015
Amec Foster Wheeler Environment
& Infrastructure UK Limited

iii © Amec Foster Wheeler Environment & Infrastructure UK Limited
May 2015 Doc Ref. 35190 CLon066R 35190 CLon066R
Executive summary
This report has been produced for the purpose of providing an analysis of the economy of Whitby in order to
inform the assessment of the planning application by York Potash Limited for a new potash mine in the North
York Moors National Park. There is a specific focus on tourism within the town’s economy in the report. The
report has not been produced to establish the impacts of the application but provides a description of the
economy of contemporary Whitby and comments on the future economic prospects of the town. The
assessment does not factor in the potential economic impacts from of the proposed Potash Mine and
associated developments.
Data for Whitby covers the three wards of Mayfield, Streonshalh and Whitby West Cliff and was obtained
from a number of datasets. Demographic data from the 2001 and 2011 Census datasets is compared with
the local regions: the Scarborough Borough Council area, Yorkshire and the Humber region and North
Yorkshire county area, and also with England as a whole. Measures of economic activity were informed by a
variety of datasets at different levels depending on the availability of the data. Employment by industrial
sector was obtained from the Census dataset at ward level. Numbers of business start-ups was collected at
Scarborough Borough level, which is the most detailed level at which the data is available. This information
was collected from the business registration and business count datasets. Seasonality of employment was
obtained from ward level data from the unemployment claimant database.
Demographic data indicates that Whitby has experienced a moderately declining population over recent
years (1991 – 2011) with a higher proportion of older people and of those that are long-term sick or disabled
compared to the average for local regions1 and England. There are 6,535 economically active people with a
relatively large proportion of self-employed (12%) and part-time employees (18%) compared to England.
Despite a decreasing and aging population, employment in Whitby has grown by 7% between 2001 and
2011, amounting to 750 more jobs, although at a slower rate than England.
The economic sectors of Accommodation and food services and Wholesale, retail trade and repair have the
two greatest shares of employment in Whitby over the 10-year period assessed (2001 to 2011). Together
they employ approximately 32% of the total workforce in Whitby. Health and Social Work is the next largest
sector, accounting for over 11% of employment and reflecting the high proportion of older and long-term sick
and disabled people. It has remained relatively stable over the period. Of a similar size are the sectors of
Construction and Manufacturing. Manufacturing employed a lower proportion of the workforce in 2011
compared to 2001, in line with overall trends in the region and across the UK. In contrast, Construction is
becoming more important employing 10% of the workforce in 2011, compared to 9% in 2001.
The evidence overall indicates that tourism is currently a key sector in Whitby. In this study Accommodation
and food services is likely to be the stronger indicator as Retail is combined with Wholesale and Repairs.
Employment data shows that Accommodation and food services employs as many as 1,007 people -
approximately 1 out of every 13 Whitby residents - suggesting a large number of non-residents (most likely
tourists) use these services. This is supported by the claimant data, which is highly cyclical and shows a
pronounced trough in the number of claimants during the peak tourist summer season. Comparisons of
changes in employment for Accommodation and food services between 2011 and 2001 show that
employment in this sector in Whitby has increased by 40%, almost 11% greater than England, suggesting
that this market has grown strongly over the period. This is in contrast to the overall seaside tourism trend in
England, which has seen an overall contraction in recent years.
There are some noticeable developments around Whitby, which are likely to benefit the economy and could
be significantly affect the structure and size of local markets. The main development is in relation to the
Dogger Bank wind farm development which is located 80 miles off the Yorkshire coast. This has resulted in
a multi-million pound development in Whitby to create an offshore renewables management and marine
control centre, which will be used to support the 1,500 vessels that are expected to be required to service the
windfarms.
1 North Yorkshire, Yorkshire and the West Humber, Scarborough
iv © Amec Foster Wheeler Environment & Infrastructure UK Limited
May 2015 Doc Ref. 35190 CLon066R 35190 CLon066R
Contents
1. Introduction 1
1.1 Scope 1
1.2 Whitby 1
1.3 Whitby datasets 1
1.4 Structure of the report 2
2. Whitby - Demographics and employment 3
2.1 Demographics 3
2.2 Economic activity and the labour market 4
2.3 Employment 6
3. Economic activity 8
3.1 Business start ups 10
4. Tourism 13
4.1 National context 13 Trends 14
4.2 Local Context 14
4.3 Tourism in Whitby 15
4.4 The seasonality of employment in Whitby 17
5. Future prospects for Whitby 19
6. Conclusions 20
Table 2.1 Resident Population 1991 to 2011 3 Table 2.2 Change in Age Structure in Whitby and comparators (2001-2011) 4 Table 2.3 Economically active population - % of all usual residents aged 16-74 (2011) 5 Table 2.4 Economically inactive population - % of all usual residents aged 16-74 (2011) 5 Table 2.5 Qualifications of resident population aged 16-74 (2011) 6 Table 2.6 Employment growth 2001 – 2011 (All people aged 16-74 in employment) 7 Table 4.1 Employment in sectors which are closely related to tourism (2001 – 2011) 16
Figure 2.1 Age Structure Whitby (age categories as % of total population) 2001-2011 4 Figure 3.1 Whitby employment structure 2001 (% of total employment) 8 Figure 3.2 Whitby employment structure - % of total employment (2011) 9 Figure 3.3 Employment Structure of Whitby compared to Scarborough - % of total employment (2011) 10 Figure 3.4 Number of business registrations in Scarborough (1994 – 2007) 11 Figure 3.5 Change in Business Counts in Scarborough (1994 – 2007) 12 Figure 3.6 Change in Business Counts in Scarborough (2010 – 2014) 12 Figure 4.1 Whitby employment structure - % of total employment (2011) 15 Figure 4.2 Business Counts in Scarborough between 1994 and 2014 17 Figure 4.3 Number of unemployment claimants in Whitby (2009 – 2013) 18 Figure 4.4 Claimant Count Rates Whitby and comparators (2013) 18

v © Amec Foster Wheeler Environment & Infrastructure UK Limited
May 2015 Doc Ref. 35190 CLon066R 35190 CLon066R
1 © Amec Foster Wheeler Environment & Infrastructure UK Limited
May 2015 Doc Ref. 35190 CLon066R 35190 CLon066R
1. Introduction
1.1 Scope
This report provides an analysis of the economy of Whitby in order to inform the assessment of a planning
application for a new mine from York Potash Ltd (YP). The report has not been produced to establish the
impacts of the application but provides a description of the economy of contemporary Whitby and comments
on the future economic prospects of the town. The assessment does not factor in the potential economic
impacts from of the proposed Potash Mine and associated developments. The report has been based on a
publicly available data with the key information taken from the 2001 and 2011 Census Dataset.
1.2 Whitby
Whitby is a small seaside town and ancient fishing port located on the North Yorkshire coast in a deep valley
at the mouth of the River Esk. It is within the borough of Scarborough and on the edges of the North York
Moors National Park (NYMNP). The small population of 13,213 is equivalent to that of coastal towns such
as Sidmouth (13,700), Minehead (12,100) and Porthcawl (15,700)2. Whitby is known for its association with
James Cook, the explorer who first mapped the coast of Australia, and is where he learnt his seamanship3.
Whitby is also the inspiration for Bram Stoker’s novel Dracula.
Whitby is known for its unique features and is an important tourist destination in the North Yorkshire region.
It is described by Scarborough Council as having national and international acclaim for its maritime, literacy
and geological heritage as well as providing cultural opportunities, excellent dining experiences and
interesting and unique shopping.
Whitby is located on the A171 road from Scarborough to Guisborough which links the coastal towns in the
region. Whitby is served by the Yorkshire Coastliner bus line which has connections in and beyond
Yorkshire, including Leeds and York. Whitby is connected to the national rail network through
Middlesbrough with a service that runs four trains daily4. There is also the North Yorkshire Moors Railway
that provides mainline running of steam trains during the summer months in the North York Moors National
Park5.
1.3 Whitby datasets
Whitby covers the three wards of Mayfield, Streonshalh and Whitby West Cliff. Demographic data from the
2001 and 2011 Census datasets is compared with the local regions: the Scarborough Borough Council area,
Yorkshire and the Humber region and North Yorkshire county area, and also with England as a whole.
Measures of economic activity were informed by a variety of datasets at different levels depending on the
availability of the data. Employment by industrial sector was obtained from the Census dataset at ward level.
Numbers of business start-ups was collected at Scarborough Borough level, which is the lowest level at
which the data is available. This information was collected from the business registration and business
count datasets.
Seasonality of employment was obtained from ward level data from the unemployment claimant database.
2 Centre for regional and social economics (2010) The seaside tourist industry in England and Wales, Employment, Economic output, location and trends 3 Wikipedia: http://en.wikipedia.org/wiki/Whitby 4 Wikidpedia http://en.wikipedia.org/wiki/Whitby_railway_station 5 Wikipedia: http://en.wikipedia.org/wiki/North_Yorkshire_Moors_Railway
2 © Amec Foster Wheeler Environment & Infrastructure UK Limited
May 2015 Doc Ref. 35190 CLon066R 35190 CLon066R
1.4 Structure of the report
The rest of the report is structured as follows:
Chapter two focuses on demographics and employment at ward level using datasets published
by the office for National Statistics (ONS).
Chapter three examines the structure of economic activity in Whitby as shown by employment
in industrial sectors. The change in the level of business activity was assessed by looking at
business registrations and counts of their number though this is available only at borough level.
Chapter four examines tourism in Whitby. It describes the national context and the trends that
have been seen in England using publicly available reports. It assesses the likely importance of
the tourist industry to Whitby using, for example statistics on seasonal employment reflected in
claimant data.
Chapter five provides an assessment of future prospects of Whitby. It draws on public data,
particularly that including policy aspirations.
Chapter six provides the conclusions.

3 © Amec Foster Wheeler Environment & Infrastructure UK Limited
May 2015 Doc Ref. 35190 CLon066R 35190 CLon066R
2. Whitby - Demographics and employment
This section summarises key data from the ONS Whitby 2001 and 2011 Census datasets.
2.1 Demographics
The population in Whitby has been declining. Table 2.1 shows that the population has fallen slightly from
13,600 in 2001 to 13,213 in 2011, a reduction of 387 (-2.8%). This is in contrast to both the local regions
and England which have seen increases over the period. In England, the population as a whole showed an
increase of 7.9%. Locally the population has increased more slowly with Scarborough district (which
includes Whitby) seeing an increase of 2.4%.
Figures from 1991 provide a longer term trend of population changes in Whitby, local regions and England.
This shows that Whitby population has been declining over a twenty year period, although the rate of decline
has increased over the last ten years. The change in population in Scarborough has been minimal over the
whole year period. The population in Yorkshire and the Humber has increased strongly over the last ten
years compared to the 1991-2001 period. However, the North Yorkshire population increase has slowed
down in the last ten years.
Table 2.1 Resident Population 1991 to 2011
1991 2001 % change (2001-1991)
2011 % change (2011 – 2001)
England 47,055,204 49,138,831 4.4% 53,012,456 7.9%
North Yorkshire 535,862 569,660 6.3% 598,376 5.0%
Yorkshire and The Humber
4,836,524 4,964,833 2.7% 5,283,733 6.4%
Scarborough 106,221 106,252 0.0% 108,793 2.4%
Mayfield 7,280 4,565 4,652 1.9%
Streonshalh 6,361 4,860 4,608 -5.2%
Whitby West Cliff no data 4,175 3,953 -5.3%
Whitby Total 13,641 13,600 -0.3% 13,213 -2.8%
Source: 2001 and 2011 Census. (National Park Data set). 2011 data for surrounding areas downloaded from Nomis
www.nomisweb.co.uk
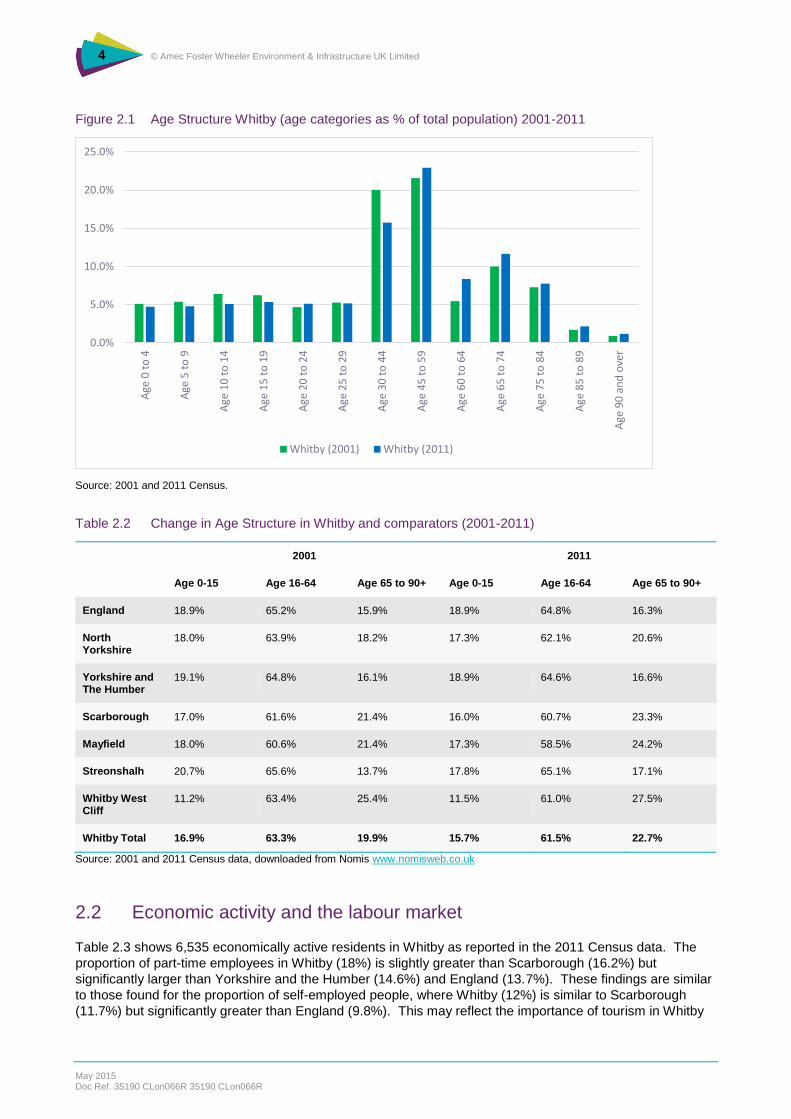
Figure 2.1 provides further information on the age structure within Whitby in 2001 and 2011. This shows that
the proportion of people below 44 has decreased, with the largest decline in those aged between 30 and 44,
where the proportion declined by 4.3% over the period. Only the number of those aged between 25 and 29
remained stable over the period. There has been a corresponding increase in the proportion of people aged
over 44 (in all age groups). The largest proportionate increase in population is for those aged between 60
and 64, which has grown by 2.9% over the period. The next two largest increases are in the age groups 45
to 59 (1.3% increase) and 65 to 74 (1.7% increase).
Table 2.2 shows the age structure of Whitby compared to those of the surrounding area and England. This
indicates that Whitby has a much greater proportion (6.4%) of retired people (65 years and above) than
England. The proportion of retired people has increased from 2001 to 2011 - similar to findings in the local
region and England - and characteristic of an aging population. There is also a decline in the number of
people of working age (16 – 64), again in line with both local regions and England. Although the proportion
of young people (0 – 15) has remained constant in England, there has been a decline in Whitby and the local
region.
4 © Amec Foster Wheeler Environment & Infrastructure UK Limited
May 2015 Doc Ref. 35190 CLon066R 35190 CLon066R
Figure 2.1 Age Structure Whitby (age categories as % of total population) 2001-2011
Source: 2001 and 2011 Census.
Table 2.2 Change in Age Structure in Whitby and comparators (2001-2011)
2001 2011
Age 0-15 Age 16-64 Age 65 to 90+ Age 0-15 Age 16-64 Age 65 to 90+
England 18.9% 65.2% 15.9% 18.9% 64.8% 16.3%
North Yorkshire
18.0% 63.9% 18.2% 17.3% 62.1% 20.6%
Yorkshire and The Humber
19.1% 64.8% 16.1% 18.9% 64.6% 16.6%
Scarborough 17.0% 61.6% 21.4% 16.0% 60.7% 23.3%
Mayfield 18.0% 60.6% 21.4% 17.3% 58.5% 24.2%
Streonshalh 20.7% 65.6% 13.7% 17.8% 65.1% 17.1%
Whitby West Cliff
11.2% 63.4% 25.4% 11.5% 61.0% 27.5%
Whitby Total 16.9% 63.3% 19.9% 15.7% 61.5% 22.7%
Source: 2001 and 2011 Census data, downloaded from Nomis www.nomisweb.co.uk
2.2 Economic activity and the labour market
Table 2.3 shows 6,535 economically active residents in Whitby as reported in the 2011 Census data. The
proportion of part-time employees in Whitby (18%) is slightly greater than Scarborough (16.2%) but
significantly larger than Yorkshire and the Humber (14.6%) and England (13.7%). These findings are similar
to those found for the proportion of self-employed people, where Whitby (12%) is similar to Scarborough
(11.7%) but significantly greater than England (9.8%). This may reflect the importance of tourism in Whitby
0.0%
5.0%
10.0%
15.0%
20.0%
25.0%A
ge 0
to
4
Age
5 t
o 9
Age
10
to
14
Age
15
to
19
Age
20
to
24
Age
25
to
29
Age
30
to
44
Age
45
to
59
Age
60
to
64
Age
65
to
74
Age
75
to
84
Age
85
to
89
Age
90
an
d o
ver
Whitby (2001) Whitby (2011)

5 © Amec Foster Wheeler Environment & Infrastructure UK Limited
May 2015 Doc Ref. 35190 CLon066R 35190 CLon066R
and Scarborough and the corresponding level of service industries that tend to be smaller in scale and more
likely to rely on self-employed workers.
The number of unemployed people in Whitby is only slightly greater than England in proportionate terms,
with both showing cyclical variation over the course of a year. Although similar to England, unemployment
levels in Whitby are noticeably larger than in North Yorkshire and Scarborough. The proportion of
unemployed people also differs significantly within the Whitby wards, with high levels of unemployment found
in Streonshalh.
Table 2.3 Economically active population - % of all usual residents aged 16-74 (2011)
Economically active residents
Employee: Part-time
Employee: Full-time
Self-employed Unemployed Full-time student
England 27,183,134 13.7% 38.6% 9.8% 4.4% 3.4%
North Yorkshire
314,100 15.1% 38.2% 13.0% 3.0% 2.5%
Yorkshire and The Humber
2,649,975 14.6% 37.0% 8.4% 4.8% 3.5%
Scarborough 52,245 16.2% 30.7% 11.7% 4.2% 3.0%
Mayfield 2,210 19.3% 30.8% 11.0% 3.5% 2.1%
Streonshalh 2,393 19.1% 32.3% 9.8% 5.8% 2.2%
Whitby West Cliff
1,932 15.3% 29.1% 15.7% 4.3% 2.1%
Whitby (Total) 6,535 18.0% 30.8% 12.0% 4.6% 2.2%
Source: 2001 and 2011 Census data, downloaded from Nomis www.nomisweb.co.uk
Table 2.4 provides details of the composition of the economically inactive population from the 2011 Census.
The proportion of long-term sick or disabled and retired people in Whitby (not including retired people above
74) is high compared to that in the local regions, North Yorkshire and Yorkshire and the Humber, and
England. This is most notable for the Whitby West Cliff ward, where 21.6% of economically inactive are
unemployed, greater than in the local regions and 7.9% greater than the average for England. 6.2% of
economically inactive people within the Whitby West Cliff ward are long term sick or disabled, which is also
significantly greater than the local regions and 2.2% greater than the average for England.
Table 2.4 Economically inactive population - % of all usual residents aged 16-74 (2011)
Retired Student (incl. full-time)
Looking after home or family
Long-term sick or disabled
Other U/E: (16 -24)
U/E: (50-74)
U/E Never worked
Long-term U/E
England 13.7% 5.8% 4.4% 4.0% 2.2% 1.2% 0.8% 0.7% 1.7%
North Yorkshire
17.3% 3.3% 3.3% 2.8% 1.4% 0.8% 0.7% 0.3% 1.1%
Yorkshire and The Humber
14.7% 5.9% 4.3% 4.5% 2.2% 1.5% 0.8% 0.8% 1.9%
Scarborough 20.3% 4.0% 3.5% 4.7% 1.8% 1.2% 0.9% 0.4% 1.7%
Mayfield 20.8% 2.9% 4.1% 3.5% 1.8% 0.8% 1.1% 0.3% 1.1%
Streonshalh 16.1% 2.7% 4.8% 5.3% 1.9% 1.8% 1.3% 0.5% 2.0%

6 © Amec Foster Wheeler Environment & Infrastructure UK Limited
May 2015 Doc Ref. 35190 CLon066R 35190 CLon066R
Retired Student (incl. full-time)
Looking after home or family
Long-term sick or disabled
Other U/E: (16 -24)
U/E: (50-74)
U/E Never worked
Long-term U/E
Whitby West Cliff
21.6% 1.6% 2.2% 6.2% 2.0% 1.1% 1.0% 0.3% 1.9%
Whitby (Total)
19.4% 2.4% 3.8% 4.9% 1.9% 1.2% 1.1% 0.4% 1.7%
Source: 2001 and 2011 Census data, downloaded from Nomis www.nomisweb.co.uk
Whitby has a population that tends to be less educated than that of the local regions and England. Table 2.5
indicates that almost 8% more of the population in Whitby, between the ages of 16-74, have no qualifications
compared to England. The pattern of a higher proportion of people with no qualifications is repeated in the
attainment of level 4 (university degree) qualifications which is 8.3 % lower in Whitby than in England.
Although the individual wards have the same overall trends as Whitby as a whole, the Streonshalh ward
tends to have the largest differences compared to local regions and England. Streonshalh ward has 32.9%
of people with no qualifications, compared to 22.5% in England and between 20.8% and 26.0% in local
regions. Whilst only 15.9% of Strenshalh population has level 4 qualifications compared to 27.4% in
England and between 22.7% and 29.2% in the local regions. Local regions and Whitby tend to have a
greater proportion of people undertaking apprenticeships than England.
Table 2.5 Qualifications of resident population aged 16-74 (2011)
No quals. Level 1 Level 2 Apprenticeship Level 3 Level 4 (+) Other
England 22.5% 13.3% 15.2% 3.6% 12.4% 27.4% 5.7%
North Yorkshire
20.8% 12.7% 16.4% 4.3% 12.1% 29.2% 4.6%
Yorkshire and The Humber
25.8% 13.6% 15.5% 4.2% 12.8% 23.3% 4.9%
Scarborough 26.0% 12.9% 16.3% 5.3% 12.1% 22.7% 4.8%
Mayfield 29.5% 13.8% 15.6% 5.7% 11.3% 19.3% 4.8%
Streonshalh 32.9% 15.4% 16.1% 4.1% 10.3% 15.9% 5.3%
Whitby West Cliff
28.0% 12.5% 15.6% 5.0% 11.5% 22.1% 5.3%
Whiby (total) 30.2% 13.9% 15.8% 5.0% 11.0% 19.1% 5.1%
Source: 2001 and 2011 Census data, downloaded from Nomis www.nomisweb.co.uk
2.3 Employment
Despite a decrease in overall population and an increase in the proportion of older people within Whitby, the
number of jobs has increased by 384 over the 10 year period, a 7% increase (Table 2.6). Nevertheless,
there are large differences between the wards, where Mayfield saw the largest increase (12.6%) and Whitby
West Cliff saw a slight decrease (-0.5%), although this only corresponds to a slight reduction of 9 jobs, which
could reflect underlying changes such as increased efficiencies of businesses.

7 © Amec Foster Wheeler Environment & Infrastructure UK Limited
May 2015 Doc Ref. 35190 CLon066R 35190 CLon066R
Table 2.6 Employment growth 2001 – 2011 (All people aged 16-74 in employment)
Economic Activity (employed)
2001 2011 % change 2001 – 2011
England 21,650,270 24,143,464 11.5%
North Yorkshire 266,616 289,797 8.7%
Yorkshire and The Humber 2,105,237 2,325,386 10.5%
Scarborough 43,403 46,482 7.1%
Mayfield 1,796 2,022 12.6%
Streonshalh 1,948 2,115 8.6%
Whitby West Cliff 1,756 1,747 -0.5%
Whitby (Total) 5,500 5,884 7.0%
Source: 2001 and 2011 Census, downloaded from Nomis www.nomisweb.co.uk

8 © Amec Foster Wheeler Environment & Infrastructure UK Limited
May 2015 Doc Ref. 35190 CLon066R 35190 CLon066R
3. Economic activity
Figures 3.1 and 3.2 below show employment in Whitby by economic sector in 2001 and 2011. It should be
considered in the context of an underlying growth in total employment (although this was very small). As the
sector categorisations differ between the two censuses they are not combined on a single figure.
Employment in wholesale and retail make up the largest proportion of employment in Whitby but has shown
a slight reduction between 2001 (19%) and 2011 (17%). Hotels and restaurants are the next biggest
employer, which has shown an increase over the period from 13% to 17%. These figures provide some
indication of the importance of tourism in Whitby, where a common proxy for tourism (which is not defined as
a sector) are statistics on accommodation/food and a proportion of retail.
Manufacturing was the third most important employment sector in Whitby in 2001 (~12% of total
employment) but dropped to sixth in 2011 (~7%) reflecting a trend found in the North York Moors National
Park6 and elsewhere in the UK. Employment in the Health and social work sector has remained steady over
the period, at approximately 12%. Both Education and Construction have both increased by approximately
1% over the period. Although fishing is important in Whitby’s history, it is now not a major industry,
accounting for approximately 1% of employment.
Figure 3.1 Whitby employment structure 2001 (% of total employment)
Source: 2001 Census.
6 Report on the Economy of the North York Moors National Park (35190 CBri065R), Amec Foster Wheeler (2015)

9 © Amec Foster Wheeler Environment & Infrastructure UK Limited
May 2015 Doc Ref. 35190 CLon066R 35190 CLon066R
Figure 3.2 Whitby employment structure - % of total employment (2011)
Source: 2011 Census.
Figure 3.3 compares the employment structure of Whitby with the wider district of Scarborough. It shows
that Whitby has the same general structure of employment, although there are some small differences in
some key sectors. There is a higher percentage of employees in manufacturing in Scarborough (10%)
compared to Whitby (7%) and in Health and social work (Scarborough - 16%, Whitby – 12%). However,
Whitby has a higher percentage of employees in Accommodation and food services (Scarborough - 12%,
Whitby – 16%) and Construction (Scarborough – 8%, Whitby – 10%).

10 © Amec Foster Wheeler Environment & Infrastructure UK Limited
May 2015 Doc Ref. 35190 CLon066R 35190 CLon066R
Figure 3.3 Employment Structure of Whitby compared to Scarborough - % of total employment (2011)
Source: 2011 Census.
3.1 Business start ups
Data on business start-ups, business counts and total change in stock are not available at ward level, and
data has been used for the borough of Scarborough which includes Whitby. Although Whitby only forms a
small part of the borough Figure 3.3 demonstrates that it consists of similar employment patterns and
changes in business development is likely to be applicable to Whitby.
Figure 3.4 provides information on business registrations in Scarborough between 1994 and 2007 (no data
was found on Nomis after this date). Hotel and restaurants make up the largest number of new business
registrations over the thirteen year period with approximately 850 new businesses being registered.
Wholesale, retail and repairs are the next largest number of new registrations (almost 800 new business
registrations). Real Estate, renting and business activities (approximately 700) and Construction
(approximately 400) were sectors with significant levels of new business registrations over the period. In
comparison, no new businesses were registered in financial intermediation or Mining and quarrying,
electricity and gas.

11 © Amec Foster Wheeler Environment & Infrastructure UK Limited
May 2015 Doc Ref. 35190 CLon066R 35190 CLon066R
Figure 3.4 Number of business registrations in Scarborough (1994 – 2007)
Source: ONS data obtained from Nomis
Figure 3.4 only took into account new business registrations and is not necessarily the best indicator of the
change in growth of a sector as some sectors with high levels of registrations may also be more susceptible
to business closure. Figures 3.5 and 3.6 show the overall change in the number of businesses (business
counts), the net effect of new registration and closure. This indicates that the biggest growth in businesses
in the Scarborough borough was in Real estate, renting and businesses activities, with almost 250 new
businesses over the period. Construction is the sector with the next largest growth, with an increase in the
stock of businesses of almost 150, closely followed by hotels and restaurants (approximately 125). This
indicates that despite the high number of new registrations, hotels and restaurants also experienced a high
number of closures.
Although a number of new businesses were registered in the Manufacturing, Agriculture, forestry and fishing,
wholesale and retail sectors, they all contracted over the period. The number was reduced in the Wholesale
and retail sector by just over 100, Agriculture, forestry and fishing sector by almost 100 and Manufacturing
only marginally. Other sectors that also contracted over the period included financial intermediation,
Education, Health and social work and Public administration.
Figure 3.5 provides a more recent picture over the growth of a sector between 2010 and 2014 (Note that
there is no data on business counts between 2007 and 2010 and sector classification has changed slightly.
This indicates that Agriculture, forestry and fishing sectors have seen a recent increase of 60 businesses
and Public administration has an increase of 20 businesses, both recovering over the last four years.
Accommodation and food services grew by the addition of almost 20 new businesses. Finance and
insurance, Health and education, Manufacturing, Wholesale and Retail sectors have all continued to contract
further over the last four years. Construction, which saw growth between 1994 and 2007, has contracted the
most in the last four years (reduction of just over 60 businesses). Strong growth was also seen in the last
four years in the Professional, science and technical sector (increase of 40 new businesses) and in the
Information and communication sector (increase of just over 20 businesses). The Mining quarrying and
utilities sector has seen a small growth over the period.
0 100 200 300 400 500 600 700 800 900
Agriculture; Forestry and fishing
Mining and quarrying; Electricity, gas and…
Manufacturing
Construction
Wholesale, retail and repairs
Hotels and restaurants
Transport, storage and communication
Financial intermediation
Real Estate, renting and business activities
Public administration; Other community,…
Education; health and social work

12 © Amec Foster Wheeler Environment & Infrastructure UK Limited
May 2015 Doc Ref. 35190 CLon066R 35190 CLon066R
Figure 3.5 Change in Business Counts in Scarborough (1994 – 2007)
Source: Business Start-ups (ONS data obtained from Nomis)
Figure 3.6 Change in Business Counts in Scarborough (2010 – 2014)
Source: UK Business Counts – Enterprises & Business Start-ups (ONS database obtained from Nomis)
-150 -100 -50 0 50 100 150 200 250 300
Wholesale, retail and repairs
Agriculture; Forestry and fishing
Public administration; Other community, social and…
Education; health and social work
Manufacturing
Financial intermediation
Mining and quarrying; Electricity, gas and water supply
Transport, storage and communication
Hotels and restaurants
Construction
Real Estate, renting and business activities
13 © Amec Foster Wheeler Environment & Infrastructure UK Limited
May 2015 Doc Ref. 35190 CLon066R 35190 CLon066R
4. Tourism
Tourism as an industry is difficult to quantify as it tends to be related to service sectors that provide goods
and services to both tourists and residents. Sectors which are important to tourism are7:
Retail trade
Hotels and restaurants
Camp sites and short stay accommodation
Transport
Recreation, sporting and culture
Fair and amusement parks
Estimates of the economic contribution of tourism are usually based on surveys and economic models. This
section draws on data obtained from Census and ONS on the Nomis database as well as readily available
literature to identify the importance of tourism at a national and local level. Nevertheless, caution should be
applied in using these results as it difficult to disentangle the relative shares of contributions in these sectors
from tourism and others.
4.1 National context
According to a Delloites & Oxford Economics (2013) 8 report on tourism it was estimated that tourism (including
overseas visitors) contributed gross value added (GVA) of £58bn to the UK economy in 2013 (4% of the UK
GDP) and supported 1.76 million jobs. The tourism sector (taking into account direct and indirect impacts)
was worth £133bn an increase of 6% from 2012, which created an increase of 173,000 jobs (2010-12). In
total in this year tourism accounted for 3.1m jobs, 9.6% of the total UK jobs and contributed £126.9bn (9%)
to the UK GDP9.
Seaside tourism is an important component of overall tourism. It was estimated that seaside tourism directly
supported 210,000 jobs (2006/8), considered to be an increase from the late 1990s10. However, jobs in this
sector tend to be low paid. GVA per job in hotels and restaurants is only £11,000 per year which is
significantly lower than the national average of £36,000 per year, and these jobs make up approximately half
the jobs in the sector. It was estimated in that year that the contribution of GVA from seaside tourism to the
UK economy was £3.4bn in 200711, This is much lower than would be expected based on overall tourism
figure from the Delloites & Oxford Economics (2013) report and is likely to reflect the different methodological
approaches to collecting the data highlighting the overall uncertainties in data for this sector.
Visit England12 conducted a study in 2012 on seaside trips. The number of overnight domestic trips
estimated to be made to the seaside was 14.4 million in 2012, 31% of the total overnight domestic trips, with
almost half the trips being taken during the summer period. Most of these trips were taken in the South
West, were more likely to include children, and were by people from less privileged backgrounds. For a
given region at least a quarter of overnight holiday visitors came from the same region (e.g. 57% for
7 Centre for regional and social economics (2010) The seaside tourist industry in England and Wales, Employment,
Economic output, location and trends 8 Delloites & Oxford Economics (2013) Tourism: Jobs and growth, The economic contribution of the tourism economy in
the UK 9 Delloites & Oxford Economics (2013) Tourism: Jobs and growth, The economic contribution of the tourism economy in the UK 10 Centre for regional and social economics (2010) The seaside tourist industry in England and Wales, Employment,
Economic output, location and trends 11 Centre for regional and social economics (2010) The seaside tourist industry in England and Wales, Employment,
Economic output, location and trends 12 Visit England Presentation (no date) England’s Seaside: What are the opportunities?

14 © Amec Foster Wheeler Environment & Infrastructure UK Limited
May 2015 Doc Ref. 35190 CLon066R 35190 CLon066R
Yorkshire & Humberside). Although seaside trips make up a large proportion of overnight trips and tend to
be of longer duration, the overall market has declined in recent years.
Trends
The Visit England study identified trends for future tourism in England13. The findings suggest that the future
of seaside tourism may suffer declines in certain locations, although locations that provide a unique
experiences may well adapt. The main findings from the Visit England survey are:
The economic recession resulted in an increase in domestic tourism.
There is a growing practice to visit friends or families as part of leisure trips.
Health and skills tourism will become increasingly important being driven by health conscious
people and people who are looking for new experiences. 56% of consumers said that ‘trying
new things’ was important to them and 67% said that art or culture was important.
Rural and urban tourism have experienced strong growth in recent years.
There is a large uncertainty over the future of seaside tourism. It was found that some resorts
were unable to compete with the more reliable weather overseas. However, many resorts have
been able to adapt in providing new experiences such as cuisine or sports.
4.2 Local Context
Whitby is a key tourist location for the Borough of Scarborough14 and for Yorkshire. Scarborough borough
itself has a diverse tourist market that includes the North York Moors National Park, a Heritage Coastline and
the traditional seaside towns of Whitby and others. It has recently been expanding the tourist market by
marketing tourism and putting on festivals and events. Whitby is seen as an important part of this offer.
Scarborough Council describes Whitby15 as:
“Whitby continues to achieve national and international acclaim for its unique combination of maritime,
literacy, ecclesiastical and geological heritage, combined with contemporary cultural offerings and excellent
dining experience as well as the quant and quirky shopping experience which becoming a key part of
Whitby’s attractiveness during all seasons. In this way the town represents an experience that is hard to
come by elsewhere”.
Yorkshire tourism was estimated to be worth £7bn to the economy in 2010 and employed approximately
250,000 people16. Scarborough is visited annually by some 1.62m people for a holiday trip, which is higher
than other popular locations, including the Isle of Wight, Brighton, Bournemouth amongst many others17 and
is considered to have a high-level of repeat visitors18. A visitor survey carried out in 2010 and having over
671 responses within the Scarborough council19 revealed that 53% of visitors came from within the Yorkshire
region, with an average stay of 4.8 nights20. Although Scarborough receives a high number of visitors the
survey suggested that the average spend per person per night on accommodation was £22.30, lower than
the regional average.
13 Visit England (2013) Domestic Leisure Tourism Trends for the Next Decade 14 Scarborough Borough (no date) Scarborough Borough Tourism Strategy (Draft) 2011 - 2014 15 Scarborough Borough (no date) Scarborough Borough Tourism Strategy (Draft) 2011 - 2014 16 Scarborough Borough (no date) Scarborough Borough Tourism Strategy (Draft) 2011 - 2014 17 Visit England Presentation (no date) England’s Seaside: What are the opportunities? 18 Scarborough Borough (no date) Scarborough Borough Tourism Strategy (Draft) 2011 - 2014 19 Scarborough Borough (no date) Scarborough Borough Tourism Strategy (Draft) 2011 - 2014 20 Scarborough Borough (no date) Scarborough Borough Tourism Strategy (Draft) 2011 - 2014

15 © Amec Foster Wheeler Environment & Infrastructure UK Limited
May 2015 Doc Ref. 35190 CLon066R 35190 CLon066R
Estimates of tourism in Whitby itself have been made using the Cambridge model21 by Tourism South
East22. In 2012, 134,000 overnight trips and 1.1 million tourism day trips were estimated to be made. £62m
directly was spent between all trips made to Whitby (13% of the equivalent figure of £470m for Scarborough). Of this, 14% was for accommodation, 34% for catering and 23% on retail. Other costs included transport and visitors attractions. It was estimated that the income would have supported 1,444 FTEs.
4.3 Tourism in Whitby
Figure 4.2 below indicates that the sectors which are directly related to the level of tourism, are the largest
employers within Whitby. Both the Accommodation and food services and Wholesale and retail and repair
sectors each employ just over 16% of the workforce (over 32% together) and a significant part of the activity
is likely to support demand from tourists. These make up a significant part of the economy of Whitby with
only a few other sectors employing appreciable workforces. In addition to tourism, the Health and social
work and Construction sectors are also major employers. Levels of construction work are also likely to be
influenced by the current level and prospects of tourism in the region.
Figure 4.1 Whitby employment structure - % of total employment (2011)
Source: 2011 Census.
Employment in Accommodation and food services has increased in Whitby by 40% between 2001 and 2011
(Table 4.1). This increase is much greater than the growth in employment in Scarborough (23.8%) and other
local regions. It is also approximately 8% greater than the increase in Accommodation and food services
over the same period in England. As these sectors are closely related to tourism they provide what are
considered good proxies for similar levels of growth in tourism over this ten-year period.
21 The Cambridge model is described as a computer-based spreadsheet model that produces estimates from existing national and local information (e.g. accommodation stocks, inbound trips) of the level of tourism activity within a given local area. The volume of visits is translated into economic terms by estimating the amount of spending by visitors based on their average spend per trip. In turn, the impact of that spending can be translated to estimate the effects in terms of business turnover and jobs. 22 Tourism South East (2012) The Economic Impact of Tourism on Whitby Town 2012
16 © Amec Foster Wheeler Environment & Infrastructure UK Limited
May 2015 Doc Ref. 35190 CLon066R 35190 CLon066R
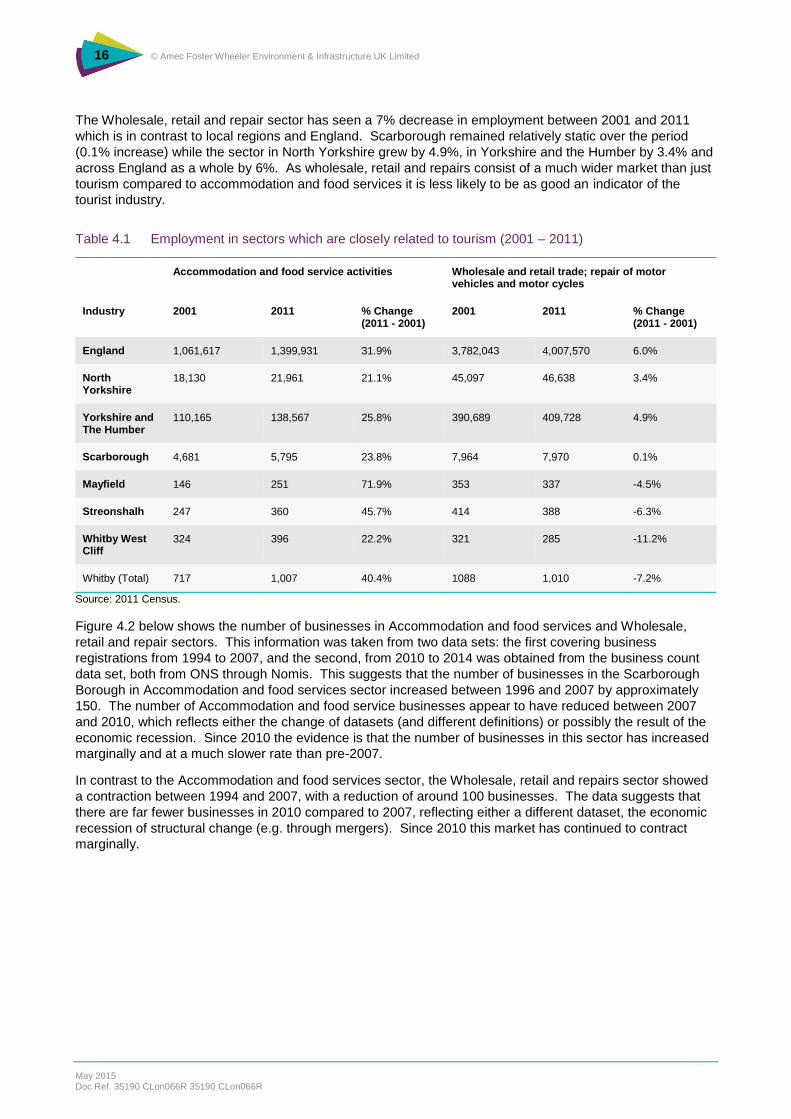
The Wholesale, retail and repair sector has seen a 7% decrease in employment between 2001 and 2011
which is in contrast to local regions and England. Scarborough remained relatively static over the period
(0.1% increase) while the sector in North Yorkshire grew by 4.9%, in Yorkshire and the Humber by 3.4% and
across England as a whole by 6%. As wholesale, retail and repairs consist of a much wider market than just
tourism compared to accommodation and food services it is less likely to be as good an indicator of the
tourist industry.
Table 4.1 Employment in sectors which are closely related to tourism (2001 – 2011)
Accommodation and food service activities Wholesale and retail trade; repair of motor vehicles and motor cycles
Industry 2001 2011 % Change (2011 - 2001)
2001 2011 % Change (2011 - 2001)
England 1,061,617 1,399,931 31.9% 3,782,043 4,007,570 6.0%
North Yorkshire
18,130 21,961 21.1% 45,097 46,638 3.4%
Yorkshire and The Humber
110,165 138,567 25.8% 390,689 409,728 4.9%
Scarborough 4,681 5,795 23.8% 7,964 7,970 0.1%
Mayfield 146 251 71.9% 353 337 -4.5%
Streonshalh 247 360 45.7% 414 388 -6.3%
Whitby West Cliff
324 396 22.2% 321 285 -11.2%
Whitby (Total) 717 1,007 40.4% 1088 1,010 -7.2%
Source: 2011 Census.
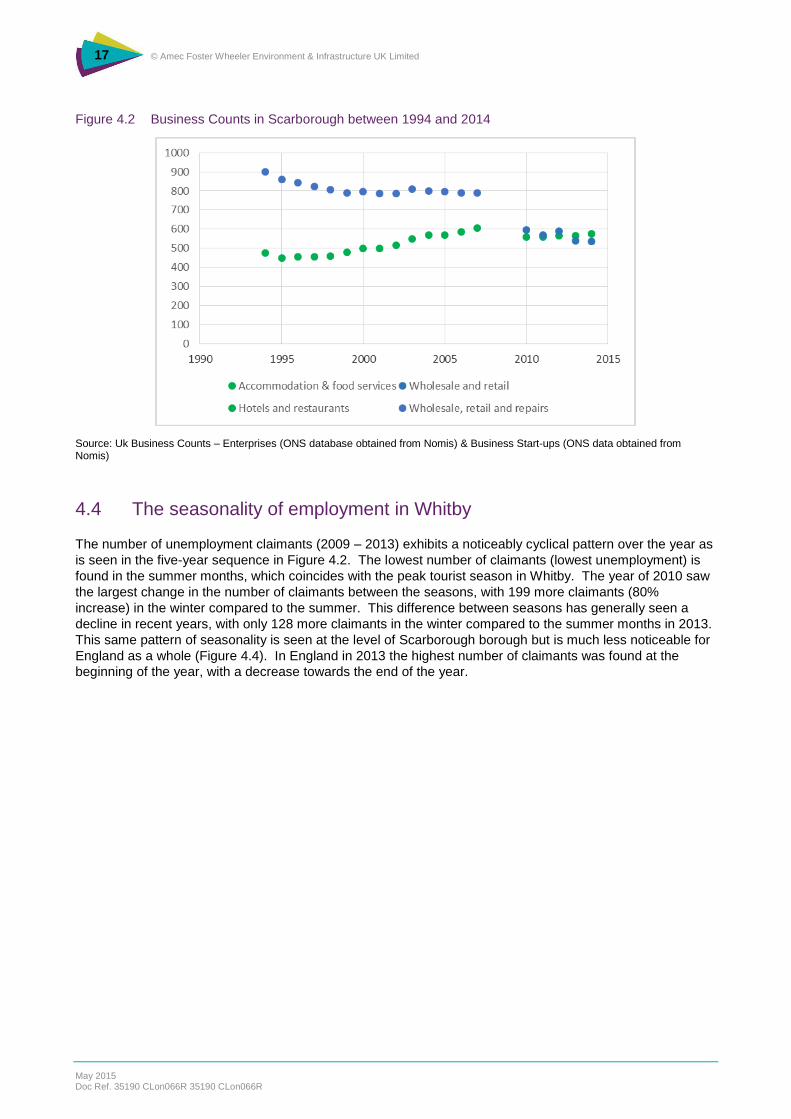
Figure 4.2 below shows the number of businesses in Accommodation and food services and Wholesale,
retail and repair sectors. This information was taken from two data sets: the first covering business
registrations from 1994 to 2007, and the second, from 2010 to 2014 was obtained from the business count
data set, both from ONS through Nomis. This suggests that the number of businesses in the Scarborough
Borough in Accommodation and food services sector increased between 1996 and 2007 by approximately
150. The number of Accommodation and food service businesses appear to have reduced between 2007
and 2010, which reflects either the change of datasets (and different definitions) or possibly the result of the
economic recession. Since 2010 the evidence is that the number of businesses in this sector has increased
marginally and at a much slower rate than pre-2007.
In contrast to the Accommodation and food services sector, the Wholesale, retail and repairs sector showed
a contraction between 1994 and 2007, with a reduction of around 100 businesses. The data suggests that
there are far fewer businesses in 2010 compared to 2007, reflecting either a different dataset, the economic
recession of structural change (e.g. through mergers). Since 2010 this market has continued to contract
marginally.
17 © Amec Foster Wheeler Environment & Infrastructure UK Limited
May 2015 Doc Ref. 35190 CLon066R 35190 CLon066R
Figure 4.2 Business Counts in Scarborough between 1994 and 2014
Source: Uk Business Counts – Enterprises (ONS database obtained from Nomis) & Business Start-ups (ONS data obtained from Nomis)
4.4 The seasonality of employment in Whitby
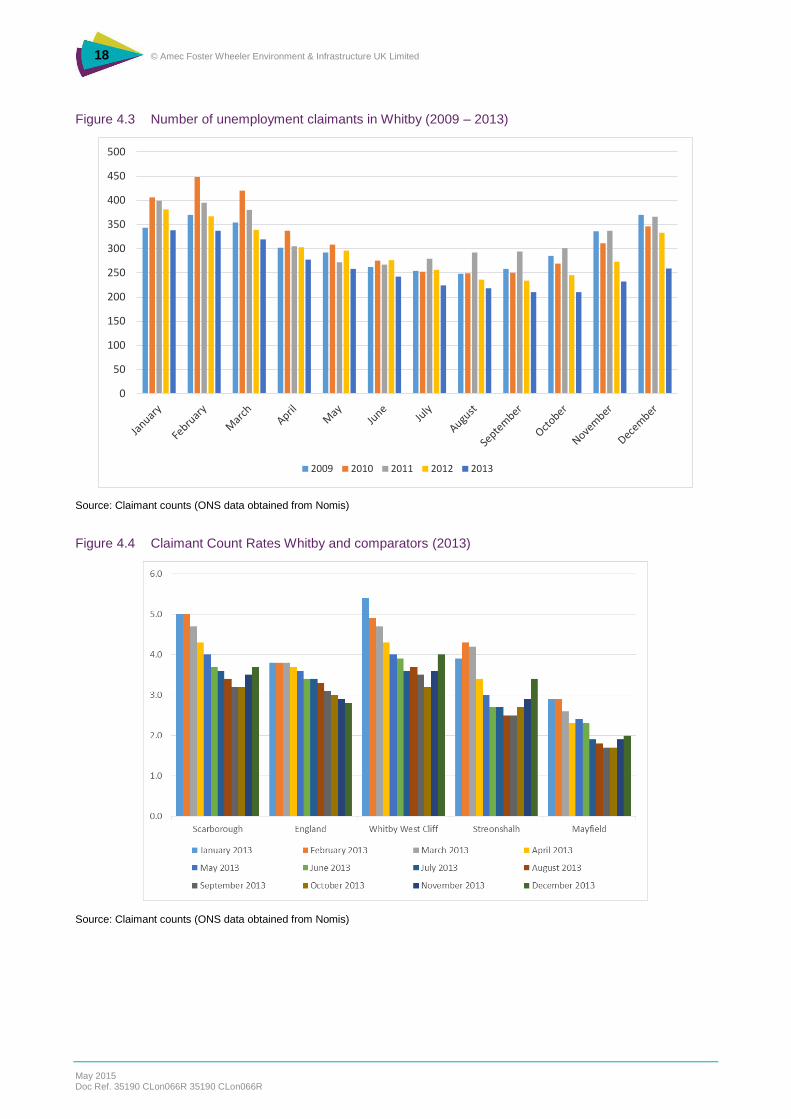
The number of unemployment claimants (2009 – 2013) exhibits a noticeably cyclical pattern over the year as
is seen in the five-year sequence in Figure 4.2. The lowest number of claimants (lowest unemployment) is
found in the summer months, which coincides with the peak tourist season in Whitby. The year of 2010 saw
the largest change in the number of claimants between the seasons, with 199 more claimants (80%
increase) in the winter compared to the summer. This difference between seasons has generally seen a
decline in recent years, with only 128 more claimants in the winter compared to the summer months in 2013.
This same pattern of seasonality is seen at the level of Scarborough borough but is much less noticeable for
England as a whole (Figure 4.4). In England in 2013 the highest number of claimants was found at the
beginning of the year, with a decrease towards the end of the year.
18 © Amec Foster Wheeler Environment & Infrastructure UK Limited
May 2015 Doc Ref. 35190 CLon066R 35190 CLon066R
Figure 4.3 Number of unemployment claimants in Whitby (2009 – 2013)
Source: Claimant counts (ONS data obtained from Nomis)
Figure 4.4 Claimant Count Rates Whitby and comparators (2013)
Source: Claimant counts (ONS data obtained from Nomis)
0
50
100
150
200
250
300
350
400
450
500
2009 2010 2011 2012 2013
19 © Amec Foster Wheeler Environment & Infrastructure UK Limited
May 2015 Doc Ref. 35190 CLon066R 35190 CLon066R
5. Future prospects for Whitby
The national picture of UK economic growth was described in the Amec Foster Wheeler report on the
Economy of the North York Moors National Park. This indicated that economic growth in recent years had
been mixed after the recession in 2009 and a second recession in 2011 but has improved through 2013 with
expectations of strong growth in 2014, and this expected to continue. Unemployment was found to be at
pre-recession levels over this period, but is starting to decrease rapidly to pre-recession levels in December
2014, with employment expected to continue to grow, although slowly. It is forecast the economy will grow
by c.3% by 2014 and above 2% to 2019. The national growth will to some extent will influence the growth at
the local level.
The previous sections of the report suggest that two largest sectors in Whitby are related to tourism,
suggesting that prospects for the local economy are heavily dependent on tourism. The Visit England23
report on future trends in tourism suggests that it is uncertain how seaside tourism will prosper in the future,
given that overseas locations are popular due to the more reliable climate and notes a slight decline in UK
seaside tourism in recent years. However, this report also suggests that seaside resorts could adapt by
providing new experiences, such as, cuisine or sports. The Scarborough Strategy24 indicated that Whitby
was unique in its variety of culture, good cuisine and quirky shops and suggested that it may be well
positioned to these trends in the future.
Recent trends in tourism in Whitby suggest growth rather than a decline. Employment data for Whitby
indicates that the Accommodation and food services sector has increased by 40% between 2001 and 2011,
much greater than the UK average and despite the decline in local population. The Retail sector is another
known indicator of tourism, however, it was not possible disaggregate it from statistics relating to Wholesale
and repairs, making it a weaker indicator. This showed that in contrast to growth in Accommodation and
food services there was a 7% decrease in employment which could be reflecting markets other than tourism.
A major wind farm development near the Dogger Bank, 80 miles of the Yorkshire coast, was granted
planning permission on 17 February 201525. The level of investment is estimated at some £8 billion and may
support up to 900 jobs and once developed may eventually generate up to 2.5% of the UK’s electricity
requirements26. Although there is always concern over the impact offshore farms will have on the tourist
industry, due to visual intrusion, the development is sufficiently far away over the horizon (80 miles) that
there is unlikely to be any noticeable impact.
Whitby may see an increase in activity during the construction of the Dogger Bank wind farm as a result of
shipping and other traffic through the port, which is the closest to the site. A report by the borough council
project manager suggested that Whitby would be heavily involved in the support of the 1,500 vessels needed
to service the wind farms27. A lease of Endeavour Wharf in Whitby port to Dalby Offshore Services was
agreed on 17 March 201528. The large scale development based in Whitby will include an offshore
renewables management and marine control centre for the support of operations in the North Sea including
vessel maintenance, relaying personnel, and sale of goods and services.
An area action plan was adopted in November 2014 setting out the development strategy/ policy for the
Whitby Business Park to improve infrastructure, support new development and diversify employment
opportunities in the Whitby area. The existing business park is around 23ha in size with some 40 occupants,
collectively employing some 17% of the working age people in Whitby. The action plan contains a target for
2,000 jobs to be accommodated there by 202629.
23 Visit England Report (2012) Domestic Leisure Tourism Trends for the Next Decade 24 Scarborough Borough (no date) Scarborough Borough Tourism Strategy (Draft) 2011 - 2014 25 http://infrastructure.planningportal.gov.uk/wp-content/ipc/uploads/projects/EN010021/3.%20Post%20Decision%20Information/Decision/Notice%20of%20the%20Decision%20by%20the%20Secretary%20of%20State%20(Reg%2024).pdf 26 http://www.theguardian.com/environment/2015/feb/17/worlds-biggest-offshore-windfarm-approved-for-yorkshire-coast 27 http://www.whitbygazette.co.uk/news/business/optimism-following-wind-farm-update-1-5904998 28 https://whitbywind.wordpress.com/2015/03/20/whitby-offshore-centre-takes-major-step-forward/ 29 Source: North York Moors National Park http://www.northyorkmoors.org.uk/planning/framework/whitby-business-park-area-
action-plan/ADOPTED-PLAN.pdf
20 © Amec Foster Wheeler Environment & Infrastructure UK Limited
May 2015 Doc Ref. 35190 CLon066R 35190 CLon066R
6. Conclusions
Whitby has experienced a moderately declining population over recent years (1991 – 2011) with a higher
proportion of older people and of those that are long-term sick or disabled compared to the average for local
regions30 and England. There are 6,535 economically active people with a relatively large proportion of self-
employed (12%) and part-time employees (18%) compared to England. This reflects the business structure
in Whitby, which has a predominance of restaurant, accommodation, and trade (retail and wholesale)
businesses. A large proportion of economically inactive people are retired and include those below normal
retirement age. In contrast, the proportion of economically inactive people that are unemployed is only
marginally greater than in England. Despite a decreasing and aging population, employment in Whitby has
grown by 7% between 2001 and 2011, amounting to 750 more jobs, although at a slower rate than England.
The economic sectors of Accommodation and food services and Wholesale, retail trade and repair have the
two greatest shares of employment in Whitby over the 10-year period assessed (2001 to 2011). Together
they employ approximately 32% of the total workforce in Whitby. Health and Social Work is the next largest
sector, accounting for over 11% of employment and reflecting the high proportion of older and long-term sick
and disabled people. It has remained relatively stable over the period. Of a similar size are the sectors of
Construction and Manufacturing. Manufacturing employed a lower proportion of the workforce in 2011
compared to 2001, in line with overall trends in the region and across the UK. In contrast, Construction is
becoming more important employing 10% of the workforce in 2011, compared to 9% in 2001. Future
prospects for construction and manufacturing will remain relatively important in Whitby in the near future as a
result of the new large scale development of an offshore renewables management and marine control
centre. Although fishing was historically a major source of employment in Whitby, it now accounts for only
1% of the active workforce.
Despite the complexities of assessing tourism, the evidence overall indicates that tourism is currently a key
sector in Whitby. In this study Accommodation and food services is likely to be the stronger indicator as
Retail is combined with Wholesale and Repairs. Employment data shows that accommodation and food
services employs as many as 1,007 people - approximately 1 out of every 13 Whitby residents - suggesting
a large number of non-residents (most likely tourists) use these services. This is supported by the claimant
data, which is highly cyclical and shows a pronounced trough in the number of claimants during the peak
tourist summer season.
Despite business count data for Scarborough borough indicating that Accommodation and food services has
been relatively stable, employee data at ward level indicates that Whitby may have grown between 2001 and
2012. Business count data suggests that Accommodation and food services businesses may have dropped
slightly between 2007 and 2012 across Scarborough borough, coinciding with the recent recession and may
have predominately affected areas outside of Whitby. Comparisons of changes in employment between
2011 and 2001 show that employment in this sector in Whitby has increased by 40%, almost 11% greater
than England, suggesting that this market has grown strongly over the period.
There are some noticeable developments around Whitby, which are likely to benefit the economy and could
be significantly affect the structure and size of local markets. The main development is in relation to the
Dogger Bank wind farm development which is located 80 miles off the Yorkshire coast. This has resulted in
a multi-million pound development in Whitby to create an offshore renewables management and marine
control centre, which will be used to support the 1,500 vessels that are expected to be required to service the
windfarms. In addition to the direct benefits from this business there are likely to be indirect benefits for a
number of other economic sectors, such as Construction, Accommodation and food services and Retail.
Although this may benefit the economy it is difficult to assess in detail how this could affect the
characteristics and identity of the town itself.
The future of tourism in Whitby is uncertain. Research by Visit for England indicates that over recent year’s
seaside trade as a whole in England has been contracting, although they suggest that many seaside towns
can adapt by bringing unique experiences. Whitby appears to offer this by providing unique heritage and
culture, good food and quirky shops. Recent employment data indicates that it is unlikely that tourism has
30 North Yorkshire, Yorkshire and the West Humber, Scarborough

21 © Amec Foster Wheeler Environment & Infrastructure UK Limited
May 2015 Doc Ref. 35190 CLon066R 35190 CLon066R
declined in Whitby and may have even grown. The tourism trade in Whitby may be impacted by the Dogger
Bank windfarm development and the new multi-million offshore renewables business. The 1,500 vessels
that it will service seem significantly large enough to have a noticeable impact on a small town with only
13,600 residents.

22 © AMEC Environment & Infrastructure UK Limited
May 2015 Doc Ref. 35190 CLon066R


