83
Annual report 2018 NORWEGIAN PROPERTY ASA

Annual report 2018 - Norwegian Property ASA
Contents Page 1
Annual report
2018 NORWEGIAN PROPERTY ASA

Annual report 2018 - Norwegian Property ASA
Contents Page 2
Contents
CEO's summary Page 3
Directors report Page 6
The annual accounts of the group Page 14
Annual accounts of the parent company Page 46
Declaration by the board of directors and the CEO Page 60
Independent auditors report Page 61
Key figures Page 67
Corporate governance Page 68
Corporate social responsibility Page 76
Presentation of the directors Page 80
Definitions Page 81
Contacts Page 83

Annual report 2018 - Norwegian Property ASA
CEO's summary Page 3
CEO's summary
Measured by rental income, our properties at 31 De-cember comprised 85 per cent offices, warehousing and parking and 15 per cent retail. The bulk of our office properties, measured by area, value and rental income, lie in Oslo’s central business district (CBD). That provides obvious advantages, and we will seek to exploit econo-mies of scale and all our knowledge of the area, the ten-ants and rent levels in the time to come. The bulk of our organisation is also located in the CBD, ensuring close-ness to and contact with our tenants virtually around the clock.
We had a rental income of NOK 799 million in 2018 and a profit before fair value changes of NOK 345 million. Both these figures represented an increase from 2017. Changes in fair value for the investment properties were a moderate NOK 161 million after several years of big write-ups.
Our policy of paying 30-50 per cent of profit before fair value changes in quarterly dividends remains un-changed. We paid out 45 per cent in 2018, correspond-ing to NOK 0.07 quarterly per share (NOK 0.28 for the full year). We seek to pay out soon after the interim re-sults have been presented, and achieved that in 2018.
Net asset value per share had grown further to NOK 14.60 at 31 December. Our balance sheet is strong, and the loan-to-value (LTV) ratio for commercial properties was 43.1 per cent at 31 December. Adjusted for the for-ward sales made at Skøyen and Gardermoen, the LTV ratio was just under 40 per cent.
During 2018, we gave priority to refining the company to become even more exposed to central Oslo proper-ties. Ever since we were established in 2006, we have leased some properties at Oslo Airport Gardermoen from Avinor and let them on a long lease to SAS. The SAS lease expires on 31 December 2019, while the lease for the properties has about six more years to run. We are therefore very satisfied with selling them to Avinor through a forward contact dated 31 December 2019. These properties have given us a good ongoing return since our creation. We have now eliminated the risk pre-sented by the short lease terms remaining after the ex-piry of the SAS lease. Nor do the old properties and hangars at Gardermoen offer us any comparative ad-vantage in our everyday business.
We sold four of our properties at Forus to various local investors in Stavanger during the fourth quarter of 2018. Some of these had stood vacant for several years, and we took the view that they would need substantial in-vestment to be attractive in a tenant-friendly Stavanger
My first year with NPRO is over, and have had a highly interesting time. My goal was to get our whole able organisation to improve its collaboration even further across regions and departments while we maintain and strengthen our commercial and customer-orented mindset.
Our ambition is to be one of the leading prop-erty companies in creating sustainable growth, all through a concentration on our core values of collaborative, courageous, pro-active and attentive.
We made a couple of changes to the manage-ment group in 2018, with three newcomers re-placing former members. I feel that these changes, combined with the rest of our vigor-ous organisation, have positioned us to take our company further steps forward.

Annual report 2018 - Norwegian Property ASA
CEO's summary Page 4
market. We are very satisfied with the solution we suc-ceeded in achieving in Stavanger.
During the fourth quarter, we also sold Badehusgata 33-39, our big property in central Stavanger, to a new com-pany and simultaneously established a 50-50 joint ven-ture with two local companies in the city. Badehusgata is a former single-user building which has been con-verted to multi-use. We have great expectations for let-ting work with the property and for the pursuit of fur-ther development opportunities there in the future.
We agreed in 2015 to sell the rest of our properties at Skøyen in a forward sale to Veidekke and Urbania Eien-dom. Part of 2018 and the time up to 1 March 2019 were used to prepare the implementation of this transaction. It is therefore gratifying that delivery and settlement were implemented efficiently and straightforwardly on 1 March 2019.
The letting market in the Oslo CBD was strong through-out 2018. That has resulted in very low vacancy, at the same time as new production of office space in the area is relatively limited. I think this will lead to a continued strong letting market in the CBD during 2019, providing no substantial and unexpected shocks occur in the do-mestic economy. We expect that stable interest rates and moderate economic growth will also produce a pos-itive trend in 2019. Our business is guided to a great ex-tent by tenant wishes and the demand for sustainable solutions in attractive locations with access to services, retail, restaurants and security. In my view, our portfolio in the CBD means we are well equipped to benefit from this in the years to come.
To create further value, we must also continue to de-velop our portfolio through projects. We devoted much of 2018 to mapping and building a pipeline of new pro-jects, particularly in Nydalen. Our first estimates indi-cate a potential new output of homes, retail and offices with a gross area of up to 50 000 square metres in Nyda-len alone. We see the importance of getting going with planning processes and the work of refining this part of our value creation in the time ahead.
Another important area for us has been upgrading and tailoring for tenants. During the third quarter of 2018, the Frogner district council and the Norwegian Labour and Welfare Service (NAV) moved into a fully refur-bished office building at Drammensveien 60 in Oslo. This project also provided evidence of our organisation’s ability to implement complex rehabilitation schemes in an environment-friendly manner. Ninety-two per cent
of the total waste of 415 tonnes was sorted into 17 dif-ferent categories. We are very proud of this building of about 11 000 square metres, and the grand opening and handover ceremony to our new tenants was an addi-tional gratification.
At Fornebu, 2018 opened with the conversion of the for-mer single-user building into a functional and attractive multi-user facility under the name Fornebu WORKS, with the qualities this requires. Energetic efforts during 2018 have resulted in a gross area of just over 13 000 square metres being let, and work is now in full swing to adapt this space to our new tenants. We are very pleased with the reception the building has received among professional tenants seeking new premises, and also have ambitious goals for 2019.
In December, we acquired the Vinslottet property in Oslo. This is an urban space/retail property in a new dis-trict of the city. Just over 50 per cent of it was let, and plans call for it to be opened in the fourth quarter of 2019. This investment is in an area which has been un-der development and renewal for the past 15-20 years, and now has several metro lines in the immediate vicin-ity as well as new schools, large-scale housebuilding, a couple of hotels under construction, and substantial new office buildings with the headquarters of several big companies. The area also has good parking provi-sion, which has become a restriction in parts of the CBD. Hasle is only 10 minutes from Aker Brygge by metro and represents a good option for certain companies. With the acquisition at Hasle, we will regard this area in fu-ture as a third priority for us in addition to the CBD and Nydalen. That will require us to secure more offices and property in the district over time.
Through our four core values, we will concentrate fur-ther attention on sustainable development in 2019. Our organisation regards this as inspirational and motiva-tional, at the same time as we are being challenged on a daily basis by our tenants and stakeholders. For us, sus-tainability means that environmental and financial con-siderations must be teamed with what is socially ac-ceptable to the population at any given time. The grow-ing consciousness and willingness to take strike action among Norway’s children and young people in recent

Annual report 2018 - Norwegian Property ASA
CEO's summary Page 5
weeks illustrates the importance of a diversified organi-sation cutting across age, gender, background and inter-ests.
Having buildings which are alive for large parts of the day is important for us. We want our capital to partici-pate in value creation for the largest possible number of hours in the day and over weekends. A new record was set in 2018 for utilising our energy centre at Aker Brygge. We are proud of the low energy consumption we have achieved, at 180 kilowatt-hours per square metre for our office properties, given a level of activity far in ex-cess of normal working hours on weekdays and at week-ends. The UN’s sustainable development goals hang over the public debate. In the future, we as a company must entrench more of our commitment in these objec-tives. Given that a large part of our property is close to the sea, it goes without saying that one of our objectives is to preserve marine resources in a sustainable way. Of initiatives taken in 2018, I would mention our collabora-tion with the In the Same Boat organisation through providing information and clearing the seabed off Aker Brygge. At the same time, we conducted a pilot project with investment in a Seabin, which constantly cleans surface pollution in our marina. This project was a big success for us and will be expanded in 2019. We also re-ceived continuous positive feedback from users who rented stand-up paddle (SUP) boards from us - another new initiative in 2018 - that the marina and the sur-rounding waters came across as clean and inviting. An additional goal I would mention here is making towns and communities inclusive, secure, robust and sustaina-ble. We have come a long way with developing the ur-ban space at Aker Brygge, but must always be alert and continue to develop ourselves. The work is well under way at our tenants, and it is gratifying that we can al-ready see new initiatives from many of them. Mention can be made here of restaurants which have removed plastic straws while launching food-saving initiatives and other climate measures. We will seek to support all our tenants with further initiatives in the future.
We had an active year in 2018. Some changes occurred in the management team, but I nevertheless feel that the organisation and our employees are stronger than ever. We have the city’s best properties in a strong let-ting market. Our level of borrowing is low, and we have the muscle to build a larger portfolio. We are looking at specific new development projects in Nydalen, and I be-lieve we will be coming to market with exciting and sus-tainable products in the time to come. We feel our dis-cussions with tenants, official regulators, investors, lenders and other stakeholders are fruitful and con-structive. With that, our gaze is forward-looking, full of optimism.
Oslo, March 2019

Annual report 2018 - Norwegian Property ASA
Directors report Page 6
Directors report
Highlights of 2018
Increased rental income and profit before tax and fair value adjustments - Rental income for 2018 of NOK 798.9 million shows an increase of NOK 14.6 million compared with last year. The revenues for the properties at Aker Brygge contrib-ute with the greatest increase (6.6 per cent). - Profit before tax and fair value adjustments for 2018 of NOK 345.0 million increased by NOK 28.2 million (8.9 per cent) compared with the previous year. This in-crease related primarily to growth in rental income and reduced financial expenses. Positive trend in market value for the properties - The value of the properties again developed positively in 2018 (NOK 161.1 million), after several years with substantial positive value changes. Increased market rents for the most central properties contributed to the growth in value for 2018, while some rise in market in-terest rates partly offset this effect. Completion of projects and high letting activity - Projects related to refurbishment and adaptation for new tenants at Drammensveien 60 and Sandakerveien 130 were completed in 2018. These properties are fully let. – Leases including re-rental with a total annual rental in-come of NOK 72 million were awarded during 2018, compared with NOK 48 million the year before.
Portfolio strengthened in main priority areas and prop-erties sold outside the core areas - As part of strengthening the portfolio in the company’s core areas, further space at Aker Brygge in Oslo was ac-quired through several transactions with a total asset value of NOK 190.6 million. - In late 2018, Norwegian Property also purchased Vinslottet, the former Norwegian Wine and Spirit Mo-nopoly plant at Hasle in Oslo. This property is being con-verted to commercial space for restaurants, services and retail, and to flats for sale. The share purchase price totalled NOK 222 million. - During 2018, Norwegian Property sold four properties at Forus in Stavanger plus a 50 per cent interest in a property in central Stavanger and entered into an agree-ment to sell properties at Oslo Airport Gardermoen. These sales are in line with the strategy of focusing the company’s capital on areas which offer synergies with the rest of the portfolio, and capital liberated by the
sales has been used to grow in the core areas or repay-ment of debt.
About Norwegian Property
Norwegian Property owned 30 office, commercial and residential properties in Norway at 31 December 2018. These are primarily located in the Oslo region. The com-pany owns a development property at Forus in Sta-vanger, where a change of use to mixed purposes is be-ing sought, as well as an interest (joint venture) in a commercial property in central Stavanger.
The company’s properties had a combined fair value, ex-cluding the joint venture, of NOK 15.6 billion at 31 De-cember. They primarily comprise office premises with associated warehousing and car parks, and retail and restaurant space. During 2018, the company acquired a housing project under development. The business is or-ganised in the parent company Norwegian Property ASA with subsidiaries. With its head office at Aker Brygge in Oslo, the group had 49 employees at 31 December 2018.
Norwegian Property’s business purpose article states: “The company operates in management, acquisitions, sales and development of commercial real estate, in-cluding participation in other companies as well as busi-nesses which are related to such”.
The company is listed on Oslo Børs with the ticker code NPRO and had a market value of NOK 5.8 billion at 31 December 2018.
The business in 2018
Market and letting
LETTING MARKET
Activity in the letting market was high in 2018, and the rental market for both office and retail is better than for many years. Rents are rising in central Oslo and Nydalen, and vacancy is low in these areas. While vacancy in Oslo as a whole lies just under 5.5 per cent, the figure for the city centre and Nydalen is lower. Vacancy is expected to decline further in coming years as a result of space con-versions already under way to other purposes (primarily residential accommodation and hotels), limited new-build activity and continued employment growth.
In Stavanger, interest in city-centre commercial space is growing at the same time as development will continue in new office areas elsewhere.

Annual report 2018 - Norwegian Property ASA
Directors report Page 7
LETTING ACTIVITY
Leases including re-rental representing a total annual rental income of NOK 72 million were awarded in 2018. The weighted remaining lease duration at 31 December 2018 was 3.9 years (2017: 4.4 years).
Norwegian Property is experiencing a strong demand for premises in the Oslo region. Rents are rising in its core areas of central Oslo and Nydalen, and vacancy for the company’s properties in these areas is low.
The company owns a property at Fornebu in Bærum lo-cal authority, adjacent to Oslo. The current tenant is due to vacate this property when the lease expires in the fourth quarter of 2019. Several leases were awarded for the property in 2018, and about a third of the space fall-ing vacant has been relet.
CUSTOMER SATISFACTION
Norwegian Property works to ensure a high level of ten-ant satisfaction in its property portfolio and participates regularly in surveys of tenant satisfaction by the Norwe-gian Lessee Index. It achieved a score of 80 in the most recent survey at the turn of the year 2017/2018, which was similar its previous high rating.
Financing
FINANCING MARKET
Long-term market interest rates increased somewhat during 2018 but remained at a low level in a historical perspective. The bond market has developed to become an attractive source of financing on competitive terms for more players than before.
FINANCING ACTIVITIES
The company’s net loan to value (LTV) ratio is 47 per cent, with bonds listed on Oslo Børs accounting for 62 per cent of its total borrowings at 31 December 2018. In addition came loan financing from two separate bank groups, as well as a construction loan for residential property provided by a bank.
Norwegian Property made no substantial changes to its loan portfolio in 2018. At the beginning of the year, a bond loan was increased by NOK 230 million with a cor-responding reduction in bank facilities.
The company’s two bank facilities, with total drawings of NOK 2 355.4 million, and a NOK 350 million bond loan mature during 2019. One of the bank facilities matures in the first quarter in connection with the agreed sale of
properties at Skøyen in Oslo. The overdraft facility re-lated to this bank loan, which had a drawdown of NOK 250 million at the end of 2018, will be reduced from NOK 400 million to NOK 300 million, and it will continue until the third quarter of 2020. The second facility is due in the fourth quarter of 2018, and work is underway with refinancing of this facility.
Property transactions
TRANSACTION MARKET
The level of activity in the transaction market was high during 2018, with many property deals in various seg-ments at sharp yield levels. Long-term market interest rates rose somewhat over the year. Further increases in these rates are expected to have a negative effect on the willingness of investors to seek exposure to invest-ment property. However, many buyer groups are active and hunting for good objects.
TRANSACTIONS CONDUCTED AND AGREED
The board is devoting attention to opportunities which could strengthen the company’s position in its core ar-eas of the Oslo region. Several transactions were imple-mented in 2018 as part of efforts to strengthen the com-pany’s portfolio at Aker Brygge, which has been ex-panded with further units. The combined asset value of these acquisitions was NOK 190.6 million.
In late 2018, Norwegian Property purchased Vinslottet, the former Norwegian Wine and Spirit Monopoly plant at Hasle in Oslo. Following current upgrading, this prop-erty will have a commercial space of about 8 800 square metres for restaurants, services and retail. The floors above are being converted to 223 flats, almost all of which are sold. The purchase price for the shares to-talled NOK 222 million. While the commercial premises are due for completion in the fourth quarter of 2019, the residential units will be finished in that period and in the second quarter of 2020. The property is centrally lo-cated in the Hasle district, close to residential proper-ties, schools, offices and hotels and in the immediate vi-cinity of the metro.
Until 2018, Norwegian Property owned properties at Fo-rus in Stavanger and Oslo Airport Gardermoen in Ullen-saker local authority, which are not part of the com-pany’s priority areas. These properties also represented a small proportion of the group’s asset value. The four properties at Forus and a 50 per cent interest in a prop-erty in central Stavanger were sold in December 2018. These sales are in line with Norwegian Property’s strat-egy of concentrating its capital in areas which offer syn-ergies with the rest of the portfolio, own staffing and

Annual report 2018 - Norwegian Property ASA
Directors report Page 8
other comparative advantages in relation to competi-tors. Capital liberated by the sales in Stavanger has been used to grow in the core areas of the Oslo region. The sale of the properties at Gardermoen has been agreed, with handover in 2019.
Norwegian Property has earlier entered into a sales agreement for properties at Skøyen, with handover in 2019.
Strategic goals
Competitive return with balanced risk Norwegian Property has a goal of paying 30-50 per cent of its ordinary profit after tax, but before fair-value ad-justments, as dividend to its shareholders. Before a div-idend is determined, an assessment will be made of the group’s financial position and prospects, including pos-sible increased capital requirements when investing in properties and changes to the income base when prop-erties are sold.
High tenant satisfaction Norwegian Property’s vision is to create meeting places which encourage engagement and provide favourable conditions for developing interpersonal relationships. The company works to ensure a high level of tenant sat-isfaction, which contributes in turn to a good reputation and which is important for retaining existing tenants and attracting new ones.
Environmental improvement in line with the best in the industry Corporate environmental and social responsibility is broadly defined and includes clearly defined targets for measures to protect the environment as well as high aesthetic standards for buildings and outside areas in the local environment. The group’s strategy and goals are outlined in the report on corporate social responsi-bility.
Investment strategy Norwegian Property has an investment strategy with the emphasis on the following main parameters:
- leading player for office and associated com-mercial property in selected areas of the Oslo region
- prioritise properties close to public transport hubs, and seek to create natural property clus-ters in the company’s priority areas
- seek to have five to 15 per cent of the portfo-lio’s area under development over time
- active management of the portfolio through transactions, including the purchase of proper-ties with value development potential.
Financing strategy Norwegian Property’s ambition is to deliver a competi-tive return with a balanced financial risk profile. The main parameters of its financial strategy are:
- a goal that the loan-to-value ratio will be a max-imum of 45-55 per cent of the total value of the company’s investment properties over time
- to base borrowing on long-term relationships with banks and other players which have a long-term strategy in the Norwegian property market
- to seek to diversify funding sources and the maturity structure to reduce refinancing risk
- an ambition to achieve a stable development in cash flow which requires a relatively high level of interest rate hedging, where the interest hedging ratio shall be 50-100 per cent of the company's interest-bearing debt, with the term of the hedging weighted against the term of the leases while also being spread over the period to avoid excessive exposure at specific points in time.
Risk and risk management
Through its activities, Norwegian Property manages ma-jor financial assets which are exposed to substantial risk factors, such as development projects, interest rates and the letting market. The management model is based on an appropriate delegation of responsibility for prof-its, clearly defined operational parameters and internal control.
Overall targets are established and further refined through continuous updating of the company’s strategy. On the basis of this strategy, the values base and the ethical guidelines, an overall management instruction has been established with the specification of authori-ties for delegating responsibility to defined roles in the organisation. Guidelines have furthermore been estab-lished for managing and handling risk in the most im-portant risk areas, such as operations and finance. Based on these overall guidelines, governing processes and routines have been established for day-to-day man-agement of the company. The board regularly reviews the company’s formal documents.

Annual report 2018 - Norwegian Property ASA
Directors report Page 9
The administration prepares periodic activity reports which are considered at board meetings. These reports are based on management reviews of the various parts of the business and contain an update of the status in relation to targets, important operational conditions, fi-nancial conditions, and a description of the status of risk areas. Quarterly financial reports are also prepared and then reviewed by the audit committee ahead of the board meeting. In connection with the presentation of the annual financial statements, the executive manage-ment prepares estimates and makes assumptions about the future. The consequent accounting estimates will be subject by definition to uncertainties. Estimates and as-sumptions which represent a substantial risk of signifi-cant changes to the carrying amounts of assets and lia-bilities in forthcoming accounting periods relate primar-ily to developments in the value of investment property.
In connection with its annual consideration of Norwe-gian Property’s strategy, the board reviews the most im-portant risk areas facing the company.
Financial risks The group’s financial risks relate primarily to changes in equity as a result of adjustments to the value of the property portfolio, the effect of interest rate changes on profits and liquidity, liquidity risk, and profit effects when refinancing debt and implementing major pro-jects.
Efforts are made to dampen the effect of interest rate changes on profits and liquidity through hedging. At 31 December 2018, 60 per cent (2017: 63 per cent) of the group’s interest-bearing debt was covered by interest rate hedges with an average term of 4.2 years (2017: 3.9 years). Fluctuations in short- and long-term market in-terest rates will accordingly have a limited impact on the group’s interest expenses before changes in the value of derivatives.
The group’s credit facilities incorporate financial cove-nants related to interest cover and the LTV ratio. It was in compliance with these and other conditions in the credit agreements related to its liabilities at 31 Decem-ber 2018.
Market risk Norwegian Property is exposed to changes in market rents, vacancy in the portfolio, turnover-based rents and the rate of inflation. The group has a significant propor-tion of long-term leases. The commercial property leases provide fixed revenues over their term. The ma-jority of the leases are fully adjusted for changes in the consumer price index (CPI).
Project risk Generally speaking, major construction projects may in-volve risk relating to such aspects as the future letting ratio and level of rents for converted areas, cost over-runs on procurement and planning, delays, delivery shortfalls and market developments.
In late 2018, the company acquired a housing project under construction. Virtually all the flats have been sold, and a turnkey contract has been entered into for the construction cost. Delivery of the flats will take place in the fourth quarter of 2019 and the second quarter of 2020.
Credit risk Norwegian Property’s portfolio of office properties is characterised by high quality, central locations and a fi-nancially sound and diversified set of tenants. Bad debts have been limited in recent years. Tenants of the group’s office properties normally pay rent quarterly in advance. In addition, most leases require security for rent payments in the form of either a deposit account containing a sum equivalent to three to six months of rent, or a bank guarantee. The group checks the credit rating and history of new tenants. As a result, the risk of direct losses from defaults or payment problems is lim-ited and relates primarily to re-letting of premises.
Liquidity risk The group’s goal is to have sufficient liquidity/drawing rights to meet its obligations, including existing develop-ment projects. It also seeks to maintain a sensible level of liquidity to meet unexpected commitments. The fi-nancing strategy aims to maintain flexibility in the mar-ket and to cope with fluctuations in rental income. One goal is that liquidity will consist as far as possible of avail-able revolving credit and overdraft facilities rather than cash holdings.
Norwegian Property has a high level of hedging against fluctuations in market interest rates, which reduces the need for liquidity to meet unexpected commitments in these areas. Other liquidity risk relates first and fore-most to servicing instalments on and redemption of loans. The group generates a positive cash flow from op-erations.
At 31 December, the group had an interest-bearing debt of NOK 7 833.4 million (2017: NOK 6 950.4 million), with an average remaining term of 2.3 years. Debt maturing and instalments due during 2018 are recognised as cur-rent liabilities in the consolidated balance sheet at 31 December 2018. At the same date, the group had a li-quidity including undrawn borrowing facilities of NOK

Annual report 2018 - Norwegian Property ASA
Directors report Page 10
772 million (2017: NOK 986.8 million). The group seeks at all times to maintain a liquidity buffer tailored to the redemption profile of its debt and the ongoing short-term fluctuations in requirements for working capital, as well as requirements which follow from current and planned projects being pursued by the group at any given time. Good and long-term relations are cultivated by the group with its main bankers.
Statement of the accounts
The consolidated financial statements have been pre-pared in accordance with the International Financial Re-porting Standards (IFRS), and consistent accounting principles are applied to all the periods presented.
Going concern assumption Pursuant to the requirements of the Norwegian Ac-counting Act, the board confirms that the going concern assumption is realistic. The financial statements for 2018 have been prepared on that basis.
Income statement Operating revenue in 2018 totalled NOK 798.9 million (2017: NOK 784.3 million). Income from the Aker Brygge properties rose by 6.6 per cent in 2018. At the same time, it declined for Snarøyveien 36, where the tenant has exercised its option to reduce the amount of space leased.
Property costs related to operations totalled NOK 71.7 million (2017: NOK 66 million). Other property costs to-talled NOK 65.8 million (2017: NOK 58 million). Admin-istrative owner costs totalled NOK 57.1 million (2017: NOK 53.7 million). Operating profit before fair-value ad-justments was thereby NOK 604.6 million (2017: NOK 606.6 million). No costs related to research and devel-opment activities were recognised in the financial state-ments for either 2018 or 2017.
Profit before tax and fair-value changes came to NOK 345 million, compared with NOK 316.8 million for 2017.
Fair-value changes to the company’s property portfolio totalled NOK 161.1 million in 2018 (2017: NOK 1 046.7 million). The increase in fair value primarily reflected in-creased market rents for a significant proportion of the property portfolio, while this effect has been offset to some extent by rather higher market interest rates.
Financial income, which consists largely of interest in-come, totalled NOK 3.6 million (2017: NOK 2.5 million). Financial expenses, primarily interest expenses and other costs related to the company’s financing, were
NOK 263.2 million (2017: NOK 292.4 million). Higher market interest rates and reduced time to maturity con-tributed to a positive fair-value change of NOK 71.3 mil-lion (2017: NOK 43.6 million) for financial derivatives. These are used to reduce interest-rate risk.
Profit before tax was thereby NOK 577.4 million (2017: NOK 1 407 million).
NOK 86.8 million in tax expense is recognised in the 2018 accounts (2017: NOK 58.3 million). As a result, net profit for the year was NOK 490.6 million (2017: NOK 1 348.7 million).
Cash flow Net cash flow from operating activities was NOK 419.7 million (2017: NOK 234.6 million). Operating profit be-fore tax and fair-value adjustments came to NOK 345 million in 2018. The difference compared with net cash flow from operating activities relates primarily to changes to working capital items for 2018.
Net cash flow from investing activities was negative at NOK 471.6 million (2017: NOK 187.5 million). Capital spending totalling NOK 582.2 million in 2018 related to the acquisition of properties, tenant adaptations related to new and renegotiated leases, and ongoing opera-tional investment. Property sales of NOK 110.6 million related to properties in the Stavanger region.
Net cash flow from financing activities in 2018 was NOK 87.3 million (2017: negative at NOK 4.1 million) follow-ing a net increase of NOK 240.8 million in interest-bear-ing debt and the payment of NOK 153.6 million in divi-dend.
The net change in cash and cash equivalents was NOK 35.4 million (2017: NOK 43 million).
Balance sheet and liquidity The carrying amount of the group’s total assets in the balance sheet was NOK 17 064.3 million (2017: NOK 15 576.2 million), with investment property accounting for NOK 14 573.7 million (2017: NOK 15 289.8 million), properties used by the owner for NOK 75.6 million (2017: NOK 70.8 million) and investment property held for sale for NOK 941.6 million. Inventory related to the housing project at Hasle amounted to NOK 815.5 mil-lion.
The company held NOK 124.6 million (2017: NOK 89.2 million) in cash and cash equivalents. In addition, the group had unused drawing rights of NOK 650 million (2017: NOK 900 million). Interest-bearing receivables

Annual report 2018 - Norwegian Property ASA
Directors report Page 11
came to NOK 354 million at 31 December 2018 and were redeemed at the beginning of January 2019. They in-cluded NOK 200 million related to temporary financing of the joint venture and NOK 154 million related to post-poned settlement for property sales in December 2018.
Total interest-bearing liabilities in the balance sheet came to 7 833.4 million (2017: NOK 6 950.4 million), with non-current interest-bearing liabilities totalling NOK 4 679.6 million (2017: NOK 6 940.5 million) and cur-rent interest-bearing liabilities amounting to NOK 3 153.8 million (2017: NOK 9.9 million). NOK 850 million of current interest-bearing liabilities at 31 December 2018 related to properties covered by agreements to sell in 2019 and to temporary financing of the joint ven-ture. Other current interest-bearing liabilities related to facilities maturing in the fourth quarter of 2019, which will be refinanced during the year.
The average interest rate for the company’s loans (in-cluding payments for interest-rate derivatives) amoun-ted to 3.62 per cent at 31 December 2018 (2017: 3.48 per cent), while the interest rate margin averaged 1.38 per cent (2017: 1.39 per cent). The remaining time to maturity for interest-bearing debt was 2.3 years (2017: 3.3 years). Financial derivatives related to interest hedg-ing accounted for a net liability item of NOK 156.5 mil-lion (2017: NOK 230.9 million).
Equity at 31 December totalled NOK 8 002.8 million (2017: NOK 7 654.8 million), representing an equity ratio of 46.9 per cent (2017: 49.1 per cent). Carried equity per share was NOK 14.59 (2017: NOK 13.96).
Valuation of the properties The company’s valuation process is based on quarterly external valuations, supplemented by internal analyses where the company makes an assessment and deter-mines whether the external valuations provide an accu-rate picture of the fair value of the investment proper-ties. Based on this process, the properties were valued on 31 December 2018 by two independent professional specialists. Cushman & Wakefield and Akershus Eien-dom have each prepared a valuation of all the proper-ties. An average of these valuations is used as the basis for recognising the investment properties at fair value at 31 December 2018. The valuation models used for these assessments are based on discounting cash flows re-lated to existing leases and the value of market rents af-ter the expiry of existing leases. Individual assessments of current expenses, upgrading costs and the risk of va-cancy are made on a property-by-property basis.
The executive management and the board have made independent assessments of parameters which affect the value of the company’s properties, including devel-opments in interest rates, market rents, occupancy, the yield level on property transactions and the quality of the properties. The conclusion is that the external valu-ations can be used as a basis for assessing the fair value of the properties. The total carrying amount of the com-pany’s investment properties, properties used by the owner and properties held for sale was NOK 15 590.9 million at 31 December 2018 (2017: NOK 15 360.6 mil-lion).
Events after the balance sheet date
In accordance with the mandate from the AGM in 2018, the board resolved on 6 February 2019 that a dividend of NOK 0.07 per share will be paid on the basis of the accounts at 31 December 2018.
No other significant events since 31 December 2018 provide information concerning the conditions which existed at the balance sheet date.
Parent company accounts and coverage of net loss
The parent company, Norwegian Property ASA, made a net loss of NOK 208.4 million in 2018 (2017: NOK 256.8 million). Administrative owner costs for the group as well as interest costs on the group’s credit facilities are recognised in the company’s accounts. The company’s subsidiaries are largely financed by equity, and no divi-dends were recognised in profit and loss by the parent company in 2018.
The board is mandated by the AGM to make quarterly dividend payments. A total of NOK 0.28 per share was paid in dividend for the four quarters of 2018, including a decision by the board meeting of 6 February 2019 to pay a dividend of NOK 0.07 per share.
The board proposes that the net loss is charged to other paid-in equity with NOK 171.1 million and to share pre-mium with NOK 37.3 million. The provision of NOK 38.4 million for dividend is charged to share premium.

Annual report 2018 - Norwegian Property ASA
Directors report Page 12
Corporate social responsibility and corporate governance
The company has prepared a separate presentation on CSR pursuant to section 3-3c of the Norwegian Account-ing Act, which covers the natural environment, em-ployee rights and social conditions as well as human rights. This report includes information on the condi-tions mentioned in section 3-3a, paragraphs 9-12 of the Accounting Act related to the working environment, equal opportunities, anti-discrimination and the com-pany’s impact on the natural environment. The presen-tation appears on page 76 of the company’s annual re-port.
A separate presentation on corporate governance has also been prepared to cover the company’s principles and practice in this area, pursuant to section 3-3b of the Accounting Act. This presentation appears on page 68 of the company’s annual report.
Board of directors
The AGM in April 2018 elected Merete Haugli as the new chair and Bjørn Henningsen as deputy chair. Cecilie Astrup Fredriksen, Kathrine Astrup Fredriksen, Carl Erik Krefting, Lars Erich Nilsen and Kjell Sagstad were elected as directors.
Executive management
Bent Oustad took over as the new CEO on 1 January 2018, Haavard Rønning took office as the CFO on 1 March 2018, and Ellen Kobro became vice president marketing on 15 June 2018.
Shareholders
Norwegian Property had 1 479 shareholders at 31 De-cember, a decline of 213 from the same time in 2017 (1 692 shareholders). Foreigners owned 68.3 per cent of the shares, compared with 67.1 per cent a year earlier. Shareholder policies and other aspects of the share-holder structure are described in the investor relations area of the company’s website.
Outlook
Norwegian Property delivers good and stable results from its operations. The company is experiencing good demand for space with rising market rents, and vacancy is low. Modern offices located close to public transport hubs are attractive and achieve good rents. The office market in central areas of Oslo is strong and is expected to continue making progress with low vacancy and good rents. Valuation of the property portfolio has developed positively over a number of years. The company’s finan-cial position is sound, with a high equity ratio and low LTV ratio.
During 2018, the company concentrated its business through the sale of properties outside the core areas. At the same time, the portfolio in these core areas was strengthened through property purchases. A number of new commercial units have been acquired at Aker Brygge. Capital liberated through sales in Stavanger has also been applied to investing in a very interesting pro-ject at Hasle, where the group has the opportunity to exploit its expertise from Aker Brygge in a comparable property combining residential units, commercial prem-ises and retail. The group is working actively on contin-ued expansion of the portfolio, partly in the wake of agreed property sales at Skøyen and Gardermoen due to be implemented in 2019. Several interesting long-term development opportunities in the existing prop-erty portfolio are also being pursued.
Although the Norwegian economy is strong, some un-certainty prevails over a tightening of the housing mar-ket and a high level of household debt. Long-term inter-est rates are at a historically low level but have risen somewhat over the past year. Generally speaking, that could lead to increased financing costs and yield levels. On the other hand, the transaction market is active, with a high level of demand from both Norwegian and for-eign investors. Yield compression has flattened out somewhat, but development opportunities in the port-folio and a strong letting market are expected to help compensate for this.
Norwegian Property is well positioned, with properties in attractive areas, a solid tenant base, a number of in-teresting development opportunities and a sound finan-cial position.

Annual report 2018 - Norwegian Property ASA
Directors report Page 13
The company’s goal is to pay 30-50 per cent of ordinary profit after tax payable but before fair-value adjust-ments to shareholders in the form of dividend. Before the dividend is set, an assessment is made of the group’s financial position and prospects, including a possible in-crease in capital requirements for investment in proper-ties and changes to the revenue base as a result of prop-erty sales.
Oslo, 11 March 2019
Norwegian Property ASA

Annual report 2018 - Norwegian Property ASA
The annual accounts of the group Page 14
The annual accounts of the group
Consolidated income statement 1 Jan - 31 Dec
Notes 1 to 28 are an integral part of the consolidated financial statements.
Consolidated statement of comprehensive income 1 Jan - 31 Dec
Notes 1 to 28 are an integral part of the consolidated financial statements.
(Amounts in NOK million) Note 2018 2017
Revenues 18 798.9 784.3
Property-related operational expenses 20 (71.7) (66.0)
Other property-related expenses 20 (65.8) (58.0)
Total property-related expenses (137.5) (124.0)
Administrative expenses 20, 21 (57.1) (53.7)
Total operating expenses (194.6) (177.7)
Share of profit in joint ventures 8 0.3 -
Operating profit before value adjustments 604.6 606.6
Change in fair value of investment property 6 161.1 1 046.7
Operating profit 765.7 1 653.3
Financial income 9, 19 3.6 2.5
Financial cost 9, 19 (263.2) (292.4)
Realised net interest expense and realised financial instruments (259.6) (289.9)
Change in fair value of financial derivative instruments 9, 10 71.3 43.6
Net financial items (188.3) (246.3)
Profit before income tax 577.4 1 407.0
Income tax 16 (86.8) (58.3)
Profit for the year 490.6 1 348.7
Profit attributable to non-controlling interests - -
Profit attributable to shareholders of the parent company 490.6 1 348.7
Earnings per share attributable to parent company shareholders (amounts in NOK) 23 0.89 2.46
Diluted earnings per share attributable to parent company shareholders (amounts in NOK) 23 0.88 2.46
(Amounts in NOK million) 2018 2017
Profit for the year 490.6 1 348.7
Value adjustment of owner-occupied property 6 6.1 4.8
Income tax related to value adjustment of owner-occupied property 16 (1.3) (1.1)
Other comprehensive income that will not be reclassified to profit or loss, net of tax 4.8 3.7
Other comprehensive inc. that subsequently may be reclassified to profit or loss, net of tax - -
Total comprehensive income for the year 495.4 1 352.3
Total comprehensive income attributable to shareholders of the parent company 495.4 1 352.3
Total comprehensive income attributable to non-controlling interests - -

Annual report 2018 - Norwegian Property ASA
The annual accounts of the group Side 15
Consolidated balance sheet as at 31 Dec
Notes 1 to 28 are an integral part of the consolidated financial statements.
Oslo, 11 March 2019
Norwegian Property ASA
(Amounts in NOK million) Note 2018 2017
ASSETS
Non-current assets:
Financial derivative instruments 3, 9, 10, 11 8.1 2.3
Investment property 6 14 573.7 15 289.8
Owner-occupied property 6 75.6 70.8
Other fixed assets 7 39.2 42.3
Investment in joint ventures 8 30.1 -
Receivables 13 10.0 -
Total non-current assets 14 736.7 15 405.1
Current assets:
Financial derivative instruments 3, 9, 10, 11 0.2 0.4
Receivables 9, 13 445.7 81.4
Property related inventory 12 815.5 -
Cash and cash equivalents 3, 9 124.6 89.2
Investment property held for sale 6 941.6 -
Total current assets 2 327.6 171.1
TOTAL ASSETS 17 064.3 15 576.2
EQUITY AND LIABILITIES
Equity:
Share capital 22 274.2 274.2
Share premium 2 295.2 2 295.2
Other paid-in equity 7 563.5 7 557.3
Retained earnings (2 130.1) (2 471.9)
Total equity 8 002.8 7 654.8
Non-current liabilities:
Deferred tax 16 615.9 531.5
Financial derivative instruments 3, 9, 10, 11 163.2 233.1
Interest-bearing debt 9, 15 4 679.6 6 940.5
Other liabilities 9, 14 2.3 57.4
Non-current liabilities 5 461.0 7 762.5
Current liabilities:
Financial derivative instruments 3, 9, 10, 11 1.6 0.5
Interest-bearing debt 9, 15 3 153.8 9.9
Other liabilities 9, 14 445.1 148.6
Total current liabilities 3 600.5 159.0
Total liabilities 9 061.5 7 921.5
TOTAL EQUITY AND LIABILITIES 17 064.3 15 576.2

Annual report 2018 - Norwegian Property ASA
The annual accounts of the group Side 16
Changes in the group’s equity
Notes 1 to 28 are an integral part of the consolidated financial statements.
Consolidated cash flow statement 1 Jan - 31 Dec
Notes 1 to 28 are an integral part of the consolidated financial statements.
(Amounts in NOK million)
Total equity 31 December 2016 274.2 2 295.1 7 557.2 (3 637.5) 6 488.9
Profit for the year - - - 1 348.7 1 348.7
Other comprehensive income for the year - - - 3.7 3.7
Total comprehensive income for the year - - - 1 352.3 1 352.3
Paid dividend 24 - - - (186.5) (186.5)
Total contributions by and distributions to owners
of the parent - - - (186.5) (186.5)
Total equity 31 December 2017 274.2 2 295.1 7 557.2 (2 471.7) 7 654.8
Profit for the year - - - 490.6 490.6
Other comprehensive income for the year - - - 4.8 4.8
Employee share-option scheme 22 - - 6.2 - 6.2
Total comprehensive income for the year - - 6.2 495.4 501.6
Paid dividend 24 - - - (153.6) (153.6)
Total contributions by and distributions to owners
of the parent - - - (153.6) (153.6)
Total equity 31 December 2018 274.2 2 295.1 7 563.4 (2 129.9) 8 002.8
Note Total equityShare capital
Share
premium
Other paid-in
equity
Retained
earnings
(Amounts in NOK million) Note 2018 2017
Profit before income tax 577.4 1 407.0
Net financial items 9, 19 188.3 246.3
Interest received 19 3.6 2.5
Interest and realised interest derivatives paid 15, 19 (250.3) (300.3)
Buyout of derivatives 10 (3.2) (62.0)
Depreciation of tangible assets 6, 7 10.1 7.5
Change in fair value of investment property 6 (161.1) (1 046.7)
Change in current items 54.9 (19.8)
Net cash flow from operating activities 419.7 234.6
Payments related to investmenmts in properties and other fixed assets 6, 7 (582.2) (187.5)
Received cash from sale of investment property 6 110.6 -
Net cash flow from investing activities (471.6) (187.5)
Repayment of interest-bearing debt 15 (1.3) (3 183.6)
New interest-bearing debt 15 242.2 3 366.0
Paid dividend 24 (153.6) (186.5)
Net cash flow from financial activities 87.3 (4.1)
Net change in cash and cash equivalents 35.4 43.0
Cash and cash equivalents at 1. January 3 89.2 46.2
Cash and cash equivalents at 31. December 3 124.6 89.2

Annual report 2018 - Norwegian Property ASA
The annual accounts of the group Page 17
NOTE 1: General information
The Norwegian Property group owns commercial and residential properties in the Oslo and Stavanger regions. Norwegian Property ASA, the parent company, is a pub-lic limited liability company with its head office at Støperigata 2, NO-0250 Oslo, Norway. The company’s share is listed on Oslo Børs under the ticker NPRO.
The financial statements were approved by the board on 11 March 2019 for final approval by the AGM on 11 April 2019.
NOTE 2: Summary of significant accounting policies
The principal accounting policies applied in the prepara-tion of these consolidated financial statements are set out below. These policies have been consistently ap-plied to all the years presented, unless otherwise stated.
2.1 - Basis of preparation The consolidated financial statements of Norwegian Property ASA have been prepared in accordance with the International Financial Reporting Standards (IFRS) as adopted by the EU and effective at 31 December 2018, and additional requirements pursuant to the Norwegian Accounting Act at 31 December 2018.
The consolidated financial statements have been pre-pared on a historical cost basis, but with key modifica-tions for the assessment of investment property as well as financial instruments and derivatives at fair value (see note 4).
Preparation of financial statements in accordance with the IFRS requires the use of certain critical accounting estimates. It also requires management to exercise judgments in the process of applying the group’s ac-counting policies. Areas involving a higher degree of judgement or complexity, or areas where assumptions and estimates are significant for the financial state-ments, are disclosed in note 5.
The group has implemented the following new stand-ards and changes to standards in the financial state-ments for 2018:
IFRS 9 Financial instruments addresses the classification, measurement and recognition of financial assets and li-abilities as well as hedge accounting. The complete ver-sion of IFRS 9 was issued in July 2014. It replaces the parts of IAS 39 which relate to similar issues. Pursuant
to IFRS 9, financial assets are classified into three cate-gories: fair value through other comprehensive income, fair value through profit and loss, and amortised cost. The measurement category is determined on initial recognition of the asset. The classification depends on the entity’s business model for managing its financial in-struments and the characteristics of the cash flows of the individual instrument. Equity instruments will ini-tially be measured at fair value through profit and loss. The company may elect to present value changes through other comprehensive income, but the choice is binding and subsequent gain or loss cannot be reclassi-fied to income. Impairment owing to credit risk must now be recognised on the basis of expected loss rather than the current model, where losses must have been incurred. Where financial liabilities are concerned, the standard is largely based on IAS 39. The biggest change is that, in cases where the fair value option is adopted for financial liabilities, the changes in fair value owing to changes in own credit risk are recognised in other com-prehensive income. IFRS 9 simplifies the requirements for hedge accounting by linking hedging effectiveness more closely to management’s risk management and provides greater scope for assessment. Meanwhile, hedge documentation is still required. The standard came into effect for the 2018 financial year. Implemen-tation of the standard has not had a material effect on the financial statements for Norwegian Property. Imple-mentation of the standard has required some changes to the information in the notes.
IFRS 15 Income from customer contracts is related to revenue recognition. The standard requires a division of the customer contract in the individual performance ob-ligations. A performance obligation can be a product or a service. Revenue is recognised when a customer se-cures control of the product or service and thus can de-termine the use and receive the benefits of the product or service. The standard replaces IAS 18 Revenue and IAS 11 Construction contracts and related interpreta-tions. The standard came into effect for the 2018 finan-cial year. Its changes have had no transitional effects for the consolidated income statement and balance sheet. The group's income from commercial property is ac-counted for almost wholly in accordance with IAS 17.
Important new standards and interpretations not yet adopted:
IFRS 16 Leases was issued in January 2016 and comes into effect from the 2019 financial year. This standard will result in almost all leases being capitalised, since the distinction between financial and operational leases is removed. Under the new standard, both an asset (the

Annual report 2018 - Norwegian Property ASA
The annual accounts of the group Side 18
right to use the leased item) and a financial liability (the value of future lease payments) are recognised. The only exceptions are short-term leases or leases of low value. For the landlord, there will be no significant changes of the accounting practice. The group has certain minor leases which will be affected by the new standard, and the changes at 1 January 2019 are specified in note 7.
There are no other standards or interpretations which are not yet effective, and which are expected to have a significant impact on the consolidated financial state-ments.
2.2 - Consolidation policies
A) SUBSIDIARIES
Subsidiaries are defined as all entities (including special purpose entities) over which the group has the power to govern financial and operating policies, generally result-ing from a shareholding of more than half the voting rights. The existence and effect of potential voting rights which are currently exercisable, or convertible are con-sidered when assessing whether the group controls an-other entity. Subsidiaries are fully consolidated from the date on which control is transferred to the group. They are deconsolidated from the date on which such control ceases.
The purchase method of accounting is used to account for the acquisition of subsidiaries by the group. The ac-quisition cost is measured as being the fair value of as-sets used as consideration, equity instruments issued, and liabilities incurred related to transfer of control. Di-rect costs related to the acquisition are expensed in the income statement at the date of acquisition. Identifiable assets acquired, and liabilities and contingent liabilities are recognised at fair value at the date of acquisition, irrespective of any minority interest. The excess cost of acquisition over the fair value of identifiable net assets acquired is recorded as goodwill. If the cost of acquisi-tion is less than the fair value of the net assets of the subsidiary acquired, the difference is recognised directly in the income statement at the date of acquisition.
Purchases of single purpose entities owning only prop-erty, with no employees, management or recorded pro-cedure descriptions are not considered as acquisition of business (IFRS 3 Business combinations is not applica-ble). The cost of such purchases is capitalised as part of the acquisition price.
Intercompany transactions, balances and unrealised gains on transactions between group companies are
eliminated. Unrealised losses are eliminated but as-sessed as an impairment indicator in relation to the transferred asset. Accounting policies of subsidiaries have been changed where necessary to ensure con-sistency with the policies adopted by the group.
B) JOINT OWNERSHIP ARRANGEMENTS
Joint ownership arrangements are classified in two cat-egories: joint operation and joint ventures. In the for-mer case, the parties with joint control have rights to the assets and responsibility for the liabilities in the arrange-ment. In a joint venture, the parties with joint control have the right to the net assets in the arrangement. The group has no investments recognised as joint opera-tions, only an investment classified as a joint venture.
The classification depends on the contractual rights and obligations of each party. Joint control normally re-quires unanimity between the parties. The group classi-fies its investments on the basis of an analysis of its de-gree of control and other underlying conditions. An as-sessment is made in this context of voting rights, own-ership structure and the relative strength of the parties. Should changes occur to the underlying conditions, an assessment must be made of whether these require changes to the accounting classification.
The group’s share of the company’s net profit is pre-sented in accordance with the equity method on a sep-arate line in the consolidated income statement, and the investment is similarly recognised on a separate line under fixed assets in the balance sheet.
The group’s share of gain and loss from transactions with the joint venture are eliminated. Accounting poli-cies in the joint venture are changed when necessary to accord with the accounting policies applied by the group.
A transaction which involves a change of control from joint venture to subsidiary will be recognised as a dis-posal where gain or loss is recognised in the profit and loss account as profit/loss from the joint venture.
C) MINORITY INTERESTS
Minority interests are included in the group’s income statement and are specified as minority interests. Cor-respondingly, minority interests are included as part of the group’s shareholders’ equity and are specified in the consolidated balance sheet.
2.3 - Segment reporting Operating segments are reported in a manner con-sistent with the internal reporting provided to the chief

Annual report 2018 - Norwegian Property ASA
The annual accounts of the group Side 19
operating decision maker. The chief operating decision maker, who is responsible for allocating resources and assessing performance of the operating segments, has been identified as corporate management. See note 17.
2.4 - Foreign currency translation
(A) FUNCTIONAL AND PRESENTATION CURRENCY
Items included in the financial statements of each of the group’s entities are measured using the currency of the primary economic environment in which the entity op-erates (the functional currency). The consolidated finan-cial statements are presented in NOK, which is the par-ent company’s functional and presentation currency.
(B) TRANSACTIONS AND BALANCES
Foreign currency transactions are translated into NOK using the exchange rates prevailing at the dates of the transactions. Foreign exchange gains and losses result-ing from the settlement of such transactions and from the translation at year-end exchange rates of monetary assets and liabilities denominated in foreign currencies are recognised in the income statement.
2.5 - Classification of balance sheet items Current assets and liabilities comprise items which ma-ture in less than one year from the balance sheet date. Other items are classified as non-current assets/liabili-ties.
Financial assets and liabilities are offset and the net amount recognised in the balance sheet when there is a legally enforceable right to offset the recognised amounts and there is an intention to settle on a net ba-sis or realise the asset and settle the liability simultane-ously.
2.6 - Investment property Property which is held for long-term rental yields or for capital appreciation or for both, is classified as invest-ment property. Investment property is initially meas-ured at acquisition cost, including related transaction costs. After initial recognition, investment property is carried at fair value pursuant to IAS 40. The fair value of investment property reflects, among other things, rental income from current leases and assumptions about rental income from future leases in the light of current market conditions.
Changes in fair values are recorded in the income state-ment under change in market value of investment prop-erty.
Subsequent expenditure is charged to the asset’s carry-ing amount only when it is probable that future eco-nomic benefits associated with the item will flow to the group and the cost of the item can be measured reliably. Other repair and maintenance costs are charged to the income statement during the financial period in which they are incurred. Expenses related to accommodating tenants, such as replacement of walls, are capitalised to-gether with the asset’s carrying amount at the same time as the remaining carrying amount of the replaced components is derecognised. Costs related to termina-tion of leases are capitalised if the main purpose of the termination is linked to a further development of the property and are expensed if the main purpose of the termination is purely a change of tenant.
Assets under construction for future use as investment property are recognised in the construction phase as in-vestment property at fair value at the completion date minus remaining construction costs.
If an investment property is used by the company, it is reclassified as property, plant and equipment unless the internal use is insignificant. Fair value at the date of re-classification is the property’s acquisition cost. An owner-occupied property is accounted for at revalued value less accumulated depreciation and amortisation. An evaluation of fair value for such properties is carried out in the same manner as described for investment properties. An increase in the value of owner-occupied property is not recognised in the income statement, but recognised as a change of the revaluation reserve in comprehensive income. An impairment of the value is recognised against the revaluation reserve, related to revaluation of the specific building. If impairment ex-ceeds the revaluation reserve, the remainder is recog-nised against the income statement.
Tax compensation related to acquisition of investment properties (single purpose entities) is recognised in the period after the acquisition as a value adjustment on in-vestment property.
If it is expected that a property will be sold within one year from the balance sheet date, it will be classified as an investment property held for sale. Investment prop-erty held for sale is recognised at fair value as other in-vestment properties.
2.7 - Property, plant and equipment All property, plant and equipment are stated at histori-cal cost less depreciation and write-downs. Historical cost includes expenditure which is directly attributable to the acquisition of the item.

Annual report 2018 - Norwegian Property ASA
The annual accounts of the group Side 20
Subsequent costs are included in the asset’s carrying amount or recognised as a separate asset, as appropri-ate, only when it is probable that future economic ben-efits associated with the item will flow to the group and the cost of the item can be reliably measured. All other repairs and maintenance are charged to the income statement during the financial period in which they in-cur.
2.8 - Impairment of non-financial assets Assets which have an indefinite useful life are not sub-ject to amortisation and are tested annually for impair-ment. Assets which are subject to amortisation are re-viewed for impairment whenever events or changes in circumstances indicate that the carrying amount may not be recoverable. An impairment loss is recognised with the amount by which the asset’s carrying amount exceeds its recoverable amount. The recoverable amount is the higher of an asset’s fair value less selling costs and value in use. For the purposes of assessing im-pairment, assets are grouped at the lowest levels for which there are separately identifiable cash flows.
2.9 - Financial instruments Norwegian Property has implemented IFRS 9 Financial instruments at 1 January 2018. Implementation of the standard has had no material effect for the group.
(A) GENERAL PRINCIPLES AND DEFINITIONS
Recognition and derecognition Financial assets and liabilities are recognised in the bal-ance sheet when the group becomes a party to the in-strument’s contractual provisions. Normal acquisition and disposal of financial assets are recognised at the transaction date and financial liabilities are recognised at the settlement date. On initial recognition of a finan-cial asset or liability, it is measured at fair value with the exception of trade receivables, which are measured at the transaction price with a provision for expected bad debts on initial recognition to the extent that such bad debts have arisen from the service component of the letting business, and where no significant financing ele-ment is included in the transaction price.
Financial assets are derecognised when the contractual rights to cash flows from the financial asset expire or when the company transfers the financial asset in a transaction where all or virtually all risk and opportuni-ties for profit related to ownership of the asset are transferred.
Financial liabilities are derecognised from the balance sheet when they have ceased to apply - in other words,
when the obligation specified in the contract has been fulfilled, cancelled or expired.
Classification The group classifies financial instruments in the catego-ries at fair value through profit and loss and at amortised cost. The classification depends on the purpose the in-strument, and the company assesses the classification of financial instruments on their acquisition.
(B) FINANCIAL INSTRUMENTS AT FAIR VALUE THROUGH
PROFIT AND LOSS
Financial instruments at fair value through profit and loss are derivatives unless they are part of hedging. See note 2.10.
(C) FINANCIAL INSTRUMENTS AT AMORTISED COST
The group’s financial instruments at amortised cost pri-marily comprise borrowings and bank deposits as well as receivables and payables arising from regular opera-tion.
Borrowings Borrowings are recognised initially at fair value, net of transaction costs incurred. Borrowings are subsequently stated at amortised cost using the effective interest method. Any differences between the proceeds (net of transaction costs) and the redemption value is recog-nised in the income statement over the duration of the borrowings.
Cash and cash equivalents Cash and cash equivalents are classified at amortised cost. They include cash in hand, bank deposits and other current highly liquid investments with original maturi-ties of three months or less. Bank overdrafts are in-cluded in borrowings in the balance sheet under current liabilities.
Trade receivables Trade receivables in the balance sheet relate primarily to the letting business. The main priority with such re-ceivables is to secure payment of outstanding rental in-come when it falls due. Receivables are classified at amortised cost. Pursuant to IAS 39, they were assessed in the lending and receivables category at amortised cost. The transition to the new standard has therefore not involved a change in the measurement method.
Trade payables Pursuant to IAS 39, trade payables were assessed at amortised cost, and pursuant to new standard are still

Annual report 2018 - Norwegian Property ASA
The annual accounts of the group Side 21
classified and measured at amortised cost. The transi-tion to the new standard has therefore not involved a change in the measurement method.
Definition of amortised cost Amortised cost pursuant to the effective interest method is used at initial recognition of financial assets and liabilities where the conditions are met. See the dis-cussion below. When calculating the effective interest rate, actual cash flows are estimated, and account is taken of such contractual terms as early payment, pur-chase options and the like. The calculation embraces all fees and interest points paid or received between par-ties to the contract as an integrated part of the effective interest rate, transaction costs and all other additional payments or discounts.
After initial recognition, all financial liabilities are meas-ured at amortised cost using the effective interest method.
Financial assets recognised at amortised cost are as-sessed on each balance sheet date to determine whether objective indications exist of impairment of a financial asset or group of financial assets.
Impairment of financial assets, primarily trade receiva-bles, is based on an expected credit loss model, which replaces the incurred loss model in IAS 39. The group has taken advantage of the exception defined in the stand-ard for trade receivables which permits provision for ex-pected credit loss to be based on loss over the whole lifecycle of the receivable.
Before entering into new leases, credit assessments and so forth are conducted to ensure that the tenant is able to meet their obligations. Guarantees are normally ob-tained from banks, parent companies and the like. Vir-tually all rent payments are invoiced in advance, and the group has established good routines for reminders and so forth. The group has historically had very low credit losses. No significant changes in the provision for ex-pected credit loss have been identified in the transition from IAS 39 to IFRS 9.
2.10 - Derivatives and hedging All the group’s interest rate swaps and forward ex-change contracts are used as economic hedges. Hedge accounting is not applied.
Derivatives are initially recognised at fair value at the date the derivative contract is entered into and are sub-sequently recognised continuously at their fair value.
Changes in the fair value of derivatives are recognised in the income statement under change in market value of financial derivative instruments.
The realised payable part of the interest swap agree-ments is presented under financial cost, with the split shown in a note.
2.11 - Inventory (residential property) The inventory related to homes under construction is valued at the lower of acquisition cost and net realisable value. Acquisition cost includes all expenditures for pur-chase and construction as well as other expenses in-curred to bring the inventory to its present condition. Construction costs include direct expenditures on con-struction of the property as well as indirect fixed and variable costs incurred during development and con-struction. Borrowing expenses are included in the acqui-sition cost until the properties are ready for sale. Capi-talisation of borrowing costs begins when the property has received planning permission. Capitalisation of other direct attributable costs begins when it is more likely than not that a project will be realised. The net re-alisable value is the estimated sales price in the ordinary way of business, based on the market price at the re-porting date and discounted for the time value of money, less estimated costs for completion and sales. When properties are sold, the carrying amount is recog-nised as a project cost in the income statement in the same period as the associated income is realised.
2.12 - Share capital and share premium Shares are classified as equity when there is no obliga-tion to transfer cash or other assets. Costs directly at-tributable to the issuance of new shares or options are shown in equity as a deduction, net of tax, from the pro-ceeds.
Employee options represent rights for employees to subscribe for shares in the company at a future time at a predetermined subscription price (subscription right). Exercise requires continued employment. The fair value of employee benefits received in exchange for the grant-ing of options is calculated as an expense. The total amount to be expensed over the vesting period reflects the fair value of the options granted. On the balance sheet date, the company reviews the estimates of the number of options expected to be utilised and changes in estimates are recognised in the income statement over the remaining vesting period with a corresponding adjustment of equity. The strike price after deduction of possible transaction costs is credited to share capital and the share premium when the option is exercised.

Annual report 2018 - Norwegian Property ASA
The annual accounts of the group Side 22
2.13 - Deferred income tax Deferred income tax is calculated in full, using the liabil-ity method, on all temporary differences arising be-tween the tax basis of assets and liabilities and their car-rying amounts in the consolidated financial statements. However, the deferred income tax is not accounted for if it arises from initial recognition of an asset or liability in a transaction other than a business combination which at the time of the transaction affects neither ac-counting nor taxable profit or loss. Deferred income tax is determined using tax rates and tax laws which have been enacted or substantially enacted at the balance sheet date, and which are expected to apply when the related deferred income tax asset is realised or the de-ferred income tax liability is settled.
Deferred income tax assets are recognised to the extent that it is probable that future taxable profit will be avail-able against which the temporary differences can be uti-lised.
Deferred income tax is provided on temporary differ-ences arising from investments in subsidiaries and asso-ciates, except where the timing of the reversal of the temporary difference is controlled by the group and it is probable that the temporary differences will not reverse soon.
Pursuant to the exception in IAS 12, deferred tax is not recognised when buying a company which is not a busi-ness. A provision for deferred tax is made after subse-quent increases in the value beyond initial cost, while a fall in value below initial cost will only reverse previous provisions for deferred tax. Furthermore, an increase in temporary differences related to tax depreciation will give grounds for a recognition of deferred tax.
2.14 - Revenue recognition Revenue consists of rental income and other income re-lated to operations. Gain on the sale of investment property is included under change in fair value of invest-ment property in the income statement.
Operating income encompasses the fair value of the consideration received for services in the ordinary busi-ness. Revenues are presented net of VAT, discounts and rebates. Service-charge expenses are charged to ten-ants and recognised in the balance sheet together with payments on account from tenants, and therefore do not affect the result beyond an administrative premium recognised under revenue. Settlement of service-charge expenses is carried out after the balance sheet date.
(A) RENTAL INCOME
Rental income is recognised over the life of the rental period. Possible costs in the form of rent rebates, com-pensation payments or the like are distributed over the duration of the lease so that the income is recognised on a linear basis. The accrued amount is presented un-der other receivables in the balance sheet. Termination of leases is assessed specifically in relation to the indi-vidual lease. Buyout of the remaining duration of a lease is recognised up to the termination date.
(B) SALE OF RESIDENTIAL PROPERTY
Revenue from residential property sales is recognised at the transaction date. Where residential units are con-cerned, risk and control are considered to be transferred to the buyer on delivery.
(C) OTHER OPERATING INCOME
Other income is recognised as it is earned. Income is earned when the product or service is delivered. The in-come is often earned at the same time as the transac-tion. Recognition is delayed for income not earned at the same time as the transaction and brought forward for income earned before the time of the transaction.
2.15 - Dividend distribution Dividend distribution to the company’s shareholders is recognised as a liability in the group’s financial state-ments in the period in which the dividends are approved by the company’s shareholders.
2.16 - Interest expense Interest expenses on borrowings are recognised under financial costs in the income statement using the effec-tive interest rate method. The effective interest rate method is used to allocate amortised costs to financial assets and liabilities and for correct accrual of interest income and expense. The effective interest rate distrib-utes the future cash flows over the duration of the loan and indicates the real net value of the financial asset or liability.
The calculation of the effective interest rate considers all estimated contractual cash flows related to the finan-cial instrument (such as payment terms) but does not account for future losses. When calculating the effective interest rate, all fees are included and distributed over the relevant period (term to maturity).
General and specific borrowing costs directly attributa-ble to the acquisition, construction or production of qualifying assets, which are assets which necessarily take a substantial period to get ready for their intended

Annual report 2018 - Norwegian Property ASA
The annual accounts of the group Side 23
use, are added to the cost of those assets, until the as-sets are substantially ready for their intended use.
2.17 - Pensions Norwegian Property ASA operates a defined contribu-tion plan for all employees. A defined contribution pen-sion scheme is an arrangement whereby the group pays fixed (defined) amounts to a separate legal entity. The group has no legal or other obligations to pay further amounts. Contributions are recognised as employee benefit expense when they fall due. Prepaid contribu-tions are capitalised as an asset to the extent that cash refunds or reductions in future payments are available.
2.18 - Operating expenses Property-related expenses include administrative costs related to the management of the properties as well as operating and maintenance costs.
Other property expenses include income-related costs related to rental, marketing and so forth of the proper-ties, the owner’s share of service-charge expenses for the properties, project-related property costs and de-preciation related to the properties.
Administrative expenses relate to costs which are not di-rectly related to the operation and letting of properties, and include costs related to overall ownership and cor-porate functions.
NOTE 3: Financial risk management
The group’s activities imply exposure to a variety of fi-nancial risks: market (including foreign exchange, inter-est rate and price), credit and liquidity risk. The group’s overall risk management programme focus on the un-predictability of financial markets and seeks to minimise potential adverse effects on the group’s profit/loss and equity. The group use hedging instruments designed to mitigate certain risks. Hedge accounting is not applied.
Risk management for the group is managed by a corpo-rate treasury department in accordance with guidelines approved by the board. Management identifies, evalu-ates and hedges financial risks in close cooperation with the group’s operational units. The board provides writ-ten policies for overall risk management and written guidelines for specific areas such as foreign exchange and interest rate risk.
3.1 – Market risk
FOREIGN EXCHANGE RISK
The group has not awarded leases in foreign currency, and all operational costs are in practice in NOK.
PRICE RISK
Rental income is exposed to changes in market rents, revenue-based rent and inflation. The group prefers long-term leases. The average duration of rental con-tracts at 31 December 2018 was 3.9 years (2017: 4.4 years).
Rental agreements for commercial properties secure a fixed revenue during the lease term. Most leases have a 100 per cent CPI adjustment clause allowing the com-pany to adjust rents in line with CPI changes. The com-pany seeks to incorporate clauses providing for such regulation in all new leases. CPI regulation in 2018 was 3.1 per cent for leases regulated in October and 3.5 per cent for leases regulated in November, which increased annual rental income at 31 December 2018 by NOK 21 million. Rent related to the shopping centre at Aker Brygge in Oslo is partly revenue-based.
INTEREST RATE RISK
The group is subject to interest rate risk related to float-ing rate loans. Norwegian Property’s policy pursuant to current loan agreements is a hedging ratio of at least 60 per cent related to floating rate loans outstanding. At 31 December, 60.4 per cent (see note 15) of such loans – excluding construction loans – were hedged (2017: 62.6 per cent).
To mitigate interest rate risk, the group has entered into interest rate swap agreements totalling NOK 5.7 billion at 31 December (2017: NOK 6 billion). The average credit margin on floating rate borrowings at 31 Decem-ber 2018 was 138 basis points (2017: 139 basis points). The average basis rate of the loan portfolio at 31 Decem-ber 2018 was 3.62 per cent (2017: 3.48 per cent). The average remaining maturity of hedging agreements was 4.2 years (2017: 3.9 years). Notional principal amounts and the duration for the group’s total portfolio of inter-est rate hedges at 31 December are specified in NOK million in the table below (see also note 10).
Year 2018 2017
< 1 year (550.0) (655.0)
1-2 year (650.0) (650.0)
3-5 year (2 335.0) (2 770.0)
Over 5 year (2 135.0) (1 950.0)
Notional principal amount (5 670.0) (6 025.0)

Annual report 2018 - Norwegian Property ASA
The annual accounts of the group Side 24
If the average interest rate for the group had been 25 basis points higher/lower at 31 December 2018 and all other variables constant, this would have constituted a change in annual interest expense on unsecured lending portfolio of NOK 9 million and a change in the value of interest rate swaps of NOK 20 million.
3.2 - Credit risk The majority of the group’s rental revenues come from solid tenants. Tenants are preferably large, solid compa-nies and public institutions, which reduces risk related to leases. New tenants are checked with credit rating agencies for an acceptable credit history. Most tenants have provided bank guarantees or made deposits of sums equivalent to three months’ rent. Rents are gener-ally invoiced quarterly in advance. Credit loss has histor-ically been limited. The group’s trade receivables at the balance sheet date are entirely in NOK.
3.3 - Liquidity risk The group aims to ensure that liquidity/credit facilities are sufficient to meet its foreseeable obligations as well as securing a reasonable capacity to meet unforeseen obligations. The funding strategy aims to maintain flexi-bility and withstand fluctuations in rental income. The liquidity reserve should consist as far as possible of re-volving credit and overdraft facilities, rather than cash and cash equivalents. The liquidity reserve at 31 Decem-ber is specified in the table below.
As described above, the group has a high level of hedg-ing against changes in market interest rates and foreign currencies, reducing the need for liquidity reserves to meet unforeseen obligations related to these areas. The group has generated positive cash flows from opera-tions related to results from ordinary operations/finan-cial items (profit/loss before value changes and buyout of derivatives), for both 2018 (NOK 345 million) and 2017 (NOK 317 million). Additional liquidity risks are mainly related to instalments and maturity of liabilities. The maturity of liabilities for the group is specified in the table below. The classification is based on the maturity specified in the contracts. The figures in the table specify the timing of repayment of principal amounts (NOK mil-lion).
20181:
20171:
1 The differences between the carrying amount and the expected cash flow for interest-bearing debt is due to capitalised costs and estimated interest cost based on the average interest rate at year-end.
Norwegian Property made no major changes to its loan portfolio in 2018. At the beginning of the year, a bond loan was extended by NOK 230 million with a corre-sponding reduction in bank facilities. In connection with the acquisition of a property project at Hasle in Oslo, a construction loan drawn down by NOK 631.5 million was taken over towards the end of the year.
Interest-bearing debt in the balance sheet totalled NOK 7 833.4 million at 31 December 2018, with non-current interest-bearing debt accounting for NOK 4 679.6 mil-lion and current interest-bearing debt for NOK 3 153.8 million. NOK 850 million of the current interest-bearing debt at 31 December 2018 related to properties agreed for sale in 2019 as well as temporary joint-venture fi-nancing. Other current interest-bearing debt relates to facilities maturing in the fourth quarter of 2019, which will be refinanced during the year, as well as construc-tion loans for homes to be sold in 2019.
3.4 - Capital risk management The group’s objectives relating to capital management are to ensure continued operation in order to provide returns for shareholders and benefits for other stake-holders. To achieve this, the aim is to maintain a capital structure which helps to reduce the cost of capital.
(Amounts in NOK million) 2018 2017
Cash and cash equivalents 124.6 89.2
- of which restricted cash and cash
equivalents (2.6) (2.5)
Available cash and cash equivalents 122.0 86.8
Unused credit and overdraft
facilities 650.0 900.0
Liquidity reserve 772.0 986.8
(Amounts in NOK million)
Interest-
bearing debt
Other
liabilities at
amortised
cost
< 1 year 3 389.2 234.8
1-2 year 2 045.8 -
3-5 year 2 007.1 -
Over 5 year 987.6 -
Expected cash flow 8 429.7 234.8
Book value 7 833.4 234.8
(Amounts in NOK million)
Interest-
bearing debt
Other
financial
liabilities
< 1 year 252.5 115.7
1-2 year 2 880.0 -
3-5 year 3 577.0 -
Over 5 year 1 022.5 -
Expected cash flow 7 732.0 115.7
Book value 6 950.4 115.7

Annual report 2018 - Norwegian Property ASA
The annual accounts of the group Side 25
Norwegian Property’s goal is to pay a dividend to its shareholders amounting to 30-50 per cent of its ordi-nary profit after tax payable, but before fair-value ad-justments. The dividend can be higher in times with good cash flow. Before a dividend is determined, an as-sessment is made of the group’s financial position and prospects, including the availability of attractive invest-ment opportunities.
Capital management seeks to maintain a good balance between debt and equity. The group must have a satis-factory equity ratio, but where the main focus relates to the loan-to-value (LTV) ratio. The latter is calculated as gross debt less cash and interest-bearing receivables di-vided by gross property value. The group’s goal is to have an LTV ratio of 45-55 per cent. The LTV ratio at 31 December is specified in the table below. According to the group’s loan agreements, the LTV ratio should not exceed 75 and 78 per cent respectively. The size of the instalments is determined by the level of the LTV ratio. Requirements related to LTV ratio in the loan agree-ments were met both at 31 December and in the interim reporting for 2017 and 2018. To change the capital structure, the group may adjust the level of dividends paid to shareholders, return capital to shareholders, is-sue new shares or sell assets to redeem debt.
NOTE 4: Determination of fair value
The consolidated financial statements have been pre-pared on a historical cost basis except for investment property and financial assets and financial liabilities (in-cluding derivative instruments), which are recognised at fair value through profit and loss.
4.1 - Investment property According to the group’s valuation process, the finance and investment department is responsible for the prep-aration of valuations of investment property for use in the financial accounts. The department is responsible for a quarterly valuation of the group’s investment prop-erties at fair value. The company’s valuation process is based on external valuations, supplemented by internal analysis where the company makes an assessment and
determines whether the external valuations give an ac-curate picture of the fair value of the investment prop-erties. Inspections and technical reviews of all the prop-erties are performed regularly. The valuations are re-viewed quarterly as a key part of the audit committee’s quality assurance of the interim and annual accounts. Based on this valuation process, properties were valued by two independent professional valuers at 31 Decem-ber 2018. Cushman & Wakefield and Akershus Eiendom have prepared a valuation of the properties. The com-pany has concluded that an average of the valuations may be used as the basis for the accounting of invest-ment properties at fair value at 31 December 2018. See also note 5 for critical accounting estimates and judge-ments.
4.2 - Financial instruments and derivatives The estimated fair value of the group’s financial instru-ments is based on market value and valuation methods as described below.
CASH AND CASH EQUIVALENTS
Fair value is assumed to be equal to the carried amount.
INTEREST-BEARING LIABILITIES
The group recognises interest-bearing liabilities at amortised cost. Notes to the financial statements (see note 15) provide information on the estimated fair value of interest-bearing liabilities. Bonds are valued at mar-ket price at 31 December and bank loans at estimated fair value where the estimated difference between the current margin and market conditions is considered.
TRADE RECEIVABLES/OTHER RECEIVABLES AND TRADE
PAYABLES/OTHER LIABILITIES
In principle, the items are recognised initially at fair value and measured at amortised cost in subsequent pe-riods. However, discounting is not normally assumed to have a significant effect on this type of receivable and liability.
DERIVATIVES
The fair value of financial derivatives, including currency forward exchange contracts/swaps and interest rate swaps, is determined by the net present value of future cash flows, calculated using quoted interest rate curves and exchange rates at the balance sheet date. The tech-nical calculations are generally performed by banks. The company has checked these valuation and tested them for reasonableness.
(Amounts in NOK million) 2018 2017
Long-term interest-bearing liabilities 4 679.6 6 940.5
Short-term interest-bearing liabilities 3 153.8 9.9
Capitalised borrowing cost 13.7 24.3
Interest-bearing receivables (354.0) -
Cash and cash equivalents (124.6) (89.2)
Net interest-bearing liabilities 7 368.5 6 885.5
Market value of property portfolio 15 590.9 15 360.6
Loan to value (per cent) 47.3 44.8

Annual report 2018 - Norwegian Property ASA
The annual accounts of the group Side 26
NOTE 5: Critical accounting estimates and jud-gements
Estimates and judgements are continually evaluated, and are based on historical experience and other fac-tors, including expectations about future events which are believed to be reasonable under current circum-stances.
Management makes estimates and assumptions con-cerning the future. The resulting accounting estimates will, by definition, seldom equal the related actual fig-ures. The estimates and assumptions which have a sig-nificant risk of causing a material adjustment to the car-rying amounts of assets and liabilities in the next finan-cial year are outlined below.
5.1 - Fair value of investment properties Investment property is valued at its fair value based on a quarterly valuation update. Procedures for determin-ing fair value for investment properties are described in note 4. In line with these policies, the portfolio of com-mercial properties is valued every quarter on the basis of external valuations.
Properties are valued by discounting future cash flows. Both contractual and expected cash flows are included in the calculations. Fair value assessment of investment properties therefore depends largely on assumptions related to market rents, discount rates and inflation. Market rents are based on individual assessments of each property and on segmentations of different areas within the properties if relevant. Macroeconomic as-sumptions for interest rate levels, inflation expectations and so forth are updated as part of the calculations. In-flation expectations are based on consensus views from banks and public statistical agencies (from 1.6 to two per cent in the calculation period). Based on an assess-ment of the properties, tenants and macroeconomic conditions at the balance sheet date, cash flows are dis-counted using discount rates in the range from 3.6 to 10.7 per cent based on individual assessments of each property.
The sensitivity of the fair value assessment of invest-ment properties depends mainly on assumptions re-lated to yield, interest rates, market rent and operating costs for the properties. The table1 below shows exam-ples of how changes related to each of these variables influenced property values at 31 December 2018, as-suming all other variables remained constant (amounts in NOK million).
1 The calculations have been carried out by Cushman & Wakefield in connection with the valuations at 31 December 2018.
5.2 - Fair value of financial derivatives The group’s financial derivatives include currency for-ward contracts/swap contracts, interest rate swap con-tracts and the obligation to acquire investment proper-ties. The procedures for valuing financial derivatives are described in note 4.
NOTE 6: Investment and owner-occupied properties
6.1 - Carrying amount of investment and owner-occu-pied properties Changes to the balance sheet item on investment prop-erty are specified in the table below. Future minimum annual rent payments receivable under non-cancellable operating leases are specified in note 18.
1 Applies to the sale of properties at Forus near Stavanger in 2018. 2 Applies to the sale of a 50 per cent share in the property Badehusgata 33-39 in Stavanger in 2018. At year-end 2018, the property was recog-nised as a joint venture. See note 8. 3 Norwegian Property has entered into an agreement for the sale of certain properties with takeover on expiry of lease agreements in 2019.
Variables Changes of variables Value change
Exit yield + 0.25 per cent (737)
Discount rate + 0.25 per cent (387)
Operating costs + NOK 25 per sqm (393)
Market rent + 10 per cent 1 356
(Amounts in NOK million) 2018 2017
Total value of investment property
at 1 January 15 360.6 14 112.1
Disposals of properties at book
value1 (237.0) -
Disposals of properties at book
value in connection with
establishing joint ventures2 (280.0) -
Additions through acquisitions and
ongoing investments 577.7 188.0
Change in market value of
investment properties recognised
in profit and loss 161.1 1 046.7
Sale of properties 3.7 10.4
Fair value adjustment of owner-
occupied property 4.8 3.4
Total value of investment property
and owner-occupied properties at
31 December 15 590.9 15 360.6
Owner-occupied
property (see specification below) (75.6) (70.8)
Investment property held for sale3 (941.6) -
Book value of investment property
at 31 December 14 573.7 15 289.8

Annual report 2018 - Norwegian Property ASA
The annual accounts of the group Side 27
This applies to Nedre Skøyen road 24-26 and Hovfaret 11 in Oslo, as well as properties at Oslo Airport Gardermoen. The properties are clas-sified as investment property held for sale in the balance sheet, valued at the net present value of agreed cash flows.
Rental income and property expenses related to invest-ment properties are stated in the income statement
At 31 December 2018, financial vacancy for the invest-ment properties was 4.7 per cent. Operating expenses for vacant space totalled NOK 33.4 million for 2018 (2017: NOK 28.8 million).
Apart from covenants in loan agreements, no re-strictions apply to the timing of the realisation of invest-ment properties or how the revenue from any sale can be used.
The group had no significant contractual obligations for construction contracts related to investment properties at 31 December in 2017 or 2018.
6.2 - Owner-occupied property Changes to the balance sheet item on owner-occupied property are specified in the table below.
6.3 - Fair value assessment The table below shows the fair value assessment of properties using different types of inputs.
20181:
20171:
1 Level 1: Financial instruments valued based on quoted prices in active markets for identical assets. Level 2: Financial instruments valued based on observable market information not covered by level 1. Level 3: Financial instruments valued based on information that is not ob-servable under level 2.
The group’s policy is to recognise transfers into and out of fair value hierarchy levels at the date of the event or change in circumstances which caused the transfer. There were no transfers between the levels during 2017 or 2018.
(Amounts in NOK million) 2018 2017
Book value of owner-occupied
property at 1 January 70.8 87.0
Addition by transfer from
investment property to owner-
occupied property - 65.1
Disposal by discontinuance of
owner-occupied property - (84.7)
Fair value adjustment of owner-
occupied property recognised
against the revaluation reserve 6.1 4.8
Depreciation of owner-occupied
property recognised against the
revaluation reserve (1.3) (1.4)
Book value of owner-occupied
property at 31 December 75.6 70.8
Accumulated acquisition costs at
31 December 65.1 65.1
Accumulated depreciation at 31
December 2.7 1.4
Accumulated net fair value
adjustment at 31 December 10.9 4.8
(Amounts in NOK
million)
Investment
property
Owner-
occupied
property
Investment
property held
for sale
Given market
value for
corresponding
assets and
liabilities (level 1) - - -
Other significant
observable input
(level 2) - - -
Other significant
non-observable
input (level 3) 14 573.7 75.6 941.6
Total estimated
fair value 14 573.7 75.6 941.6
(Amounts in NOK
million)
Investment
property
Owner-
occupied
property
Investment
property held
for sale
Given market
value for
corresponding
assets and
liabilities (level 1) - - -
Other significant
observable input
(level 2) - - -
Other significant
non-observable
input (level 3) 15 289.8 70.8 -
Total estimated
fair value 15 289.8 70.8 -

Annual report 2018 - Norwegian Property ASA
The annual accounts of the group Side 28
NOTE 7: Other fixed assets
7.1 – Fixed assets Changes in other fixed assets are specified in the table below.
The company uses linear depreciation. The economic life of the assets is set at four years for IT equipment, five years for licences, cars and furnishings and seven years for other equipment. It is set at 20 years for the energy centre at Aker Brygge.
7.2 - Leases IFRS 16 Leases come into effect from the financial year 2019. The standard entails that significant leases will be capitalized, after the distinction between financial and operating leases is removed. IFRS 16 states that both an asset (the right to use the leased object) and a financial liability (the value of future lease payments) are capital-ised.
The group has certain leases of limited size that will be affected by the new standard, and the changes at the beginning of 2019 are specified below.
The capitalised lease agreements include a lease agree-ment for renting office space at Aker Brygge in Oslo, used in the business of a subsidiary. In addition, the company rents company cars, used in connection with the operation of the group's properties.
In 2019, the right of use is taken as an asset under other tangible fixed assets, and the lease obligation is included as a liability under other liabilities in the balance sheet. Comparative figures for 2018 are not prepared.
NOTE 8: Joint ventures
Norwegian Property sold a 50 per cent interest in the Badehusgata 33-39 property in Stavanger in December 2018. This property was originally acquired in June 2006. At 31 December 2018, the group’s only investment in joint ventures relates to this property.
The changes for the year in the balance sheet item on net investment in joint ventures are specified in the ta-ble below.
The group’s share of income in joint ventures is specified in the table below.
(Amounts in NOK million)
Other
fixed
assets
Energy
distri-
bution
system
(Aker
Brygge) Total
Acquisition costs:
At 31 December 2016 40.0 39.7 79.6
Additions 2017 - 0.4 0.4
Disposals 2017 (0.8) - (0.8)
At 31 December 2017 39.1 40.1 79.2
Additions 2018 5.8 - 5.8
Disposals 2018 - - -
At 31 December 2018 44.9 40.1 84.9
Accumulated depreciation:
At 31 December 2016 26.0 4.8 30.8
Additions 2017 4.1 2.0 6.1
Disposals 2017 - - -
At 31 December 2017 30.1 6.8 36.9
Additions 2018 6.8 2.0 8.8
Disposals 2018 - - -
At 31 December 2018 36.9 8.8 45.7
Book value:
At 31 December 2017 9.0 33.3 42.3
At 31 December 2018 7.9 31.3 39.2
(Alle beløp i mNOK)
Leases
for
company
cars
Lease
for
offices Total
Net present value of leases
31.12.2018 0.4 5.1 5.5
- Short-term leases - - -
- Leases with low rent - - -
Carrying amount of rental
obligation 01.01.2019 0.4 5.1 5.5
(Amounts in NOK million) 2018 2017
Book value 1 January - -
New joint ventures 29.8 -
Share of profit and loss 0.3 -
Book value 31 December 30.1 -
(Amounts in NOK million) 2018 2017
Revenues 0.9 -
Property-related expenses (0.6) -
Change in fair value of investment property 0.8 -
Operating profit 1.1 -
Net financial items (0.6) -
Profit before income tax 0.5 -
Income tax - -
Profit for the period 0.5 -
The groups share of profit for the period 0.3 -

Annual report 2018 - Norwegian Property ASA
The annual accounts of the group Side 29
The group’s share of equity in joint ventures is specified in the table below.
The joint venture had no non-capitalised contractual ob-ligations at 31 December 2018.
At 31 December 2018, Norwegian Property had pro-vided an interest-bearing loan of NOK 200 million to the joint venture. This loan was redeemed in its entirety in January 2019, with the establishment of a correspond-ing external bank facility in the joint venture. The loan is recognised in the Norwegian Property balance sheet un-der other current liabilities at 31 December 2018 (see note 13). In addition to their equity interest, the partici-pants in the joint venture have provided a long-term shareholder loan totalling NOK 20 million to the busi-ness. Norwegian Property has classified its NOK 10 mil-lion share under other non-current liabilities in the bal-ance sheet at 31 December 2018 (see note 13).
The sale of the interest in the subsidiary and the transi-tion to a joint venture had no significant effect on profits in the fourth quarter of 2018. In earlier accounting peri-ods, the property has been valued at fair value as an in-vestment property and the asset value assumed for the sale did not vary significantly from the previous valua-tion.
NOTE 9: Financial instruments
Financial assets represent contractual rights for the group to receive cash or other financial assets in the fu-ture. Financial liabilities correspondingly represent con-tractual obligations for the group to make future pay-ments. Financial instruments are included in several ac-counting lines in the group’s balance sheet and income statement and are classified in different categories in ac-cordance with their accounting treatment.
A specification of the group’s financial instruments is presented below.
20181:
(Amounts in NOK million) 2018 2017
Total investment property 280.8 -
Total receivables 0.9 -
Cash and cash equivalents 0.9 -
Total interest-bearing debt (200.0) -
Total shareholder loans (20.0) -
Total other liabilities (2.5) -
Total equity at 31 December (60.1) -
The groups share of total equity at 31 Dec. (30.1) -
(Amounts in NOK million)
Financial assets:
Long-term derivatives 8.1 - - 8.1
Long-term receivables - 10.0 - 10.0
Short-term receivables - 385.1 60.6 445.7
Short-term derivatives 0.2 - - 0.2
Cash and cash equivalents - 124.6 - 124.6
Financial liabilities:
Long-term derivatives 163.2 - - 163.2
Long-term interest-bearing debt - 4 679.6 - 4 679.6
Other long-term liabilities - - 2.3 2.3
Short-term derivatives 1.6 - - 1.6
Short-term interest-bearing debt - 3 153.8 - 3 153.8
Short-term liabilities - 234.8 210.3 445.1
Profit/loss related to financial instruments:
Financial income - 3.6 - 3.6
Financial cost - (263.2) - (263.2)
Change in market value of financial instruments 71.3 - - 71.3
Gain/loss recognised in comprehensive income:
Recognised in comprehensive income - - - -
Total
Non-financial
assets and
liabilities
Financial
instruments at
fair value through
profit or loss Amortised cost

Annual report 2018 - Norwegian Property ASA
The annual accounts of the group Side 30
20171:
1 Accounting items not specified in the table above, but included in the group’s financial statement, do not contain financial instruments.
The carrying amount and fair value of financial instru-ments are specified in the table below.
20181:
20171:
1 Book value of financial instruments in the group’s balance sheet is evaluated to provide a reasonable estimate of fair value, except for interest-bearing debt. Fair value of interest-bearing debt is described in note 15.
(Amounts in NOK million)
Financial assets:
Long-term derivatives 2.3 - - - 2.3
Short-term receivables - 17.1 - 64.3 81.4
Short-term derivatives 0.4 - - - 0.4
Cash and cash equivalents - 89.2 - - 89.2
Financial liabilities:
Long-term derivatives 233.1 - - - 233.1
Long-term interest-bearing debt - - 6 940.5 - 6 940.5
Long-term liabilities - - - 57.4 57.4
Short-term derivatives 0.5 - - - 0.5
Short-term interest-bearing debt - - 9.9 - 9.9
Short-term liabilities - - 115.7 32.9 148.6
Profit/loss related to financial instruments:
Financial income - 2.5 - - 2.5
Financial cost - - (292.4) - (292.4)
Change in market value of financial instruments 43.6 - - - 43.6
Gain/loss recognised in comprehensive income:
Recognised in comprehensive income - - - - -
Other financial
liabilities Total
Loans and
receivables
Financial
instruments at
fair value through
profit or loss
Non-financial
assets and
liabilities
(Amounts in NOK million) Book value Fair value
Long-term derivatives 8.1 8.1
Short-term derivatives 0.2 0.2
Long-term receivables 10.0 10.0
Short-term receivables 385.1 385.1
Cash and cash equivalents 124.6 124.6
Total financial assets 528.0 528.0
Long-term derivatives 163.2 163.2
Long-term interest-bearing debt 4 679.6 4 676.5
Short-term derivatives 1.6 1.6
Short-term interest-bearing debt 3 153.8 3 159.9
Other short-term liabilities 253.6 253.6
Total financial liabilities 8 251.8 8 254.8
(Amounts in NOK million) Book value Fair value
Long-term derivatives 2.3 2.3
Short-term derivatives 0.4 0.4
Short-term receivables 17.1 17.1
Cash and cash equivalents 89.2 89.2
Total financial assets 109.1 109.1
Long-term derivatives 233.1 233.1
Long-term interest-bearing debt 6 940.5 6 959.5
Short-term derivatives 0.5 0.5
Short-term interest-bearing debt 9.9 9.9
Other short-term liabilities 132.0 132.0
Total financial liabilities 7 316.0 7 335.0

Annual report 2018 - Norwegian Property ASA
The annual accounts of the group Side 31
NOTE 10: Derivatives
10.1 - Specification of derivatives in the financial state-ments The group is subject to interest rate risk related to float-ing rate loans. The general policy in accordance with the applicable loan agreements is that at least 60 per cent of the company’s interest-bearing debt at any time will be hedged.
Derivatives are carried at fair value. Below is a specifica-tion of derivatives in the balance sheet at 31 December.
2018:
2017:
Annual changes of net derivatives in the balance sheet are specified in the table below.
10.2 - Interest rate derivatives A specification of principal notional amounts per cur-rency for the group’s interest rate derivatives at 31 De-cember is presented below. The maturity is specified in note 3.
The floating interest rate is three-months NIBOR for all contracts. Gains and losses for hedge accounting con-tracts are recognised in other comprehensive income until the underlying hedged loan is repaid.
10.3 - Fair value of derivatives The table below shows the fair value of derivatives.
20181:
20171:
1 Level 1: Financial instruments valued based on quoted prices in active markets for identical assets. Level 2: Financial instruments valued based on observable market information not covered by level 1. Level 3: Financial instruments valued based on information that is not ob-servable under level 2.
The group’s policy is to recognise transfers into and out of fair value hierarchy levels at the date of the event or change in circumstances which caused the transfer. No transfers were made between the levels in 2017 or 2018.
(Amounts in NOK million) Assets Liabilities
Interest rate hedging contracts 8.1 163.2
Exchange rate hedging contracts - -
Derivatives, non-current assets/-
liabilities 8.1 163.2
Interest rate hedging contracts 0.2 1.6
Exchange rate hedging contracts - -
Derivatives, current assets/-
liabilities 0.2 1.6
Total derivatives 8.3 164.8
Net financial derivatives in the
balance sheet (156.5)
(Amounts in NOK million) Assets Liabilities
Interest rate hedging contracts 2.3 233.1
Exchange rate hedging contracts - -
Derivatives, non-current assets/-
liabilities 2.3 233.1
Interest rate hedging contracts - 0.5
Exchange rate hedging contracts 0.4 -
Derivatives, current assets/-
liabilities 0.4 0.5
Total derivatives 2.7 233.6
Net financial derivatives in the
balance sheet (230.9)
(Amounts in NOK million) 2018 2017
Net book value of derivatives, 1
January (230.9) (336.4)
Buyout of hedging contracts 3.1 62.0
Net fair value adjustments of
derivatives during the year 71.3 43.6
Net book value of derivatives, 31
December (156.5) (230.9)
Currency 2018 2017
Notional principal
amount NOK 5 670.0 6 025.0
(Amounts in NOK million)
Assets
derivatives
Liabilities
derivatives
Given market value for corresponding
assets and liabilities (level 1) - -
Other significant observable input
(level 2) 8.3 164.8
Other significant non-observable
input (level 3) - -
Total estimated fair value 8.3 164.8
(Amounts in NOK million)
Assets
derivatives
Liabilities
derivatives
Given market value for corresponding
assets and liabilities (level 1) - -
Other significant observable input
(level 2) 2.7 233.6
Other significant non-observable
input (level 3) - -
Total estimated fair value 2.7 233.6

Annual report 2018 - Norwegian Property ASA
The annual accounts of the group Side 32
NOTE 11: Presentation of financial assets and liabilities which are subject to net settlement
The purpose of the note is to show the potential effect of net settlements for the group. The tables below spec-ify derivatives in the balance sheet with related infor-mation at 31 December.
2018:
2017:
NOTE 12: Inventory
The group’s business includes a property-related inven-tory intended for future sale. This inventory comprises residential units under construction or development for such sale. Generally speaking, this type of inventory can cover land, properties for onward sale, and property un-der development and construction.
In late December 2018, Norwegian Property acquired a company which has 223 residential units/flats under construction at Hasle in Oslo. These units were under construction at 31 December 2018, with completion and onward sale in 2019 and 2020. Virtually all the units have been sold on to end users.
The changes for the year in the balance sheet item on inventory relate in their entirety to the project at Hasle, as specified in the table below.
At 31 December, the whole inventory related to projects under construction/development as specified in the ta-ble below.
NOTE 13: Receivables
Current receivables in the balance sheet at 31 December are specified in the table below.
(Amounts in NOK million)
Non-current
assets
derivatives
Current
assets
derivatives Total
Gross financial assets 8.1 0.2 8.3
Gross assets presented net - - -
Book value 8.1 0.2 8.3
Financial instruments (8.1) (0.2) (8.3)
Security in cash - - -
Net amount - - -
(Amounts in NOK million)
Non-current
liabilities
derivatives
Current
liabilities
derivatives Total
Gross financial liabilities 163.2 1.6 164.8
Gross liabilities presented net - - -
Book value 163.2 1.6 164.8
Financial instruments (8.1) (0.2) (8.3)
Security in cash - - -
Net amount 155.1 1.4 156.5
(Amounts in NOK million)
Non-current
assets
derivatives
Current
assets
derivatives Total
Gross financial assets 2.3 0.4 2.7
Gross assets presented net - - -
Book value 2.3 0.4 2.7
Financial instruments (2.3) (0.4) (2.7)
Security in cash - - -
Net amount - - -
(Amounts in NOK million)
Non-current
liabilities
derivatives
Current
liabilities
derivatives Total
Gross financial liabilities 233.1 0.5 233.6
Gross liabilities presented net - - -
Book value 233.1 0.5 233.6
Financial instruments (2.3) (0.4) (2.7)
Security in cash - - -
Net amount 230.8 0.1 230.9
(Amounts in NOK million) 2018 2017
Book value 1 January - -
Purchase of company 815.5 -
Book value 31 December 815.5 -
(Amounts in NOK million) 2018 2017
Plots - -
Project under
construction/development 815.5 -
Completed units - -
Total book value of inventories 815.5 -
(Amounts in NOK million) 2018 2017
Accounts receivable 24.6 21.1
Provision for impairment of receivables (4.5) (4.0)
Net accounts receivable 20.1 17.1
Loans to joint ventures 200.0 -
Deferred settlement on sale of properties 154.0 -
Public duties 11.0 -
Other current receivables 60.6 64.3
Total other current receivablkes 425.6 64.3
Total current receivables 445.7 81.4
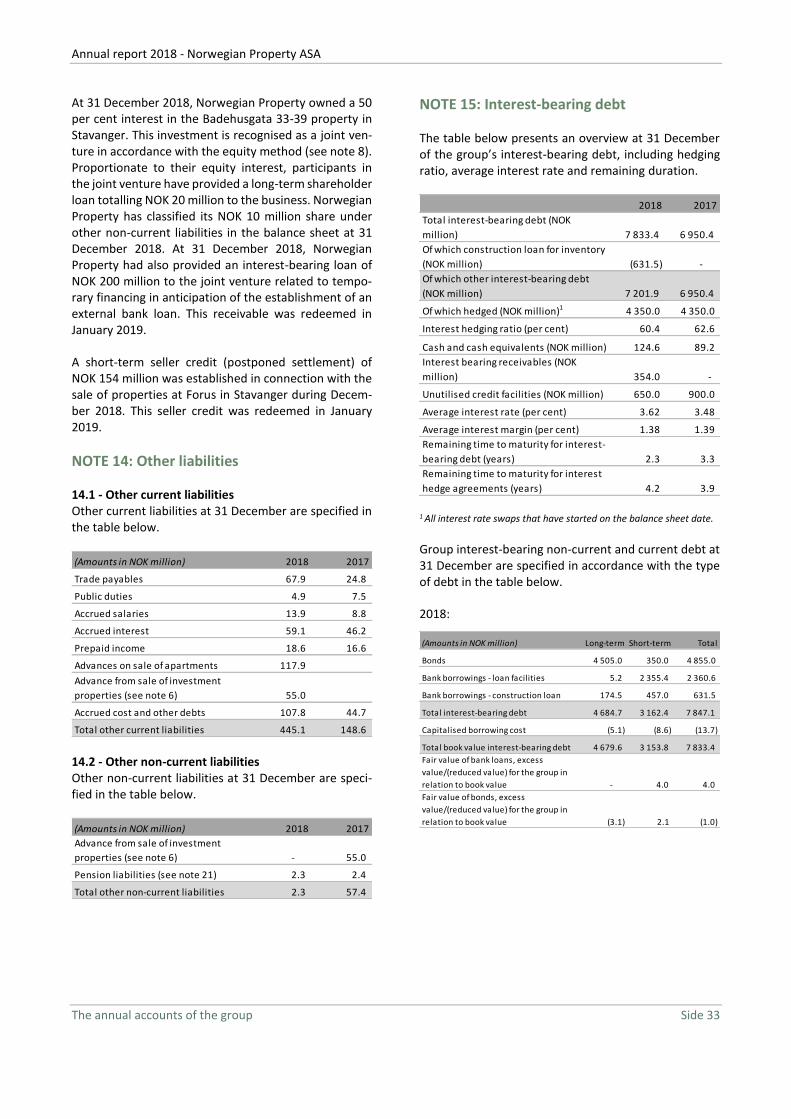
Annual report 2018 - Norwegian Property ASA
The annual accounts of the group Side 33
At 31 December 2018, Norwegian Property owned a 50 per cent interest in the Badehusgata 33-39 property in Stavanger. This investment is recognised as a joint ven-ture in accordance with the equity method (see note 8). Proportionate to their equity interest, participants in the joint venture have provided a long-term shareholder loan totalling NOK 20 million to the business. Norwegian Property has classified its NOK 10 million share under other non-current liabilities in the balance sheet at 31 December 2018. At 31 December 2018, Norwegian Property had also provided an interest-bearing loan of NOK 200 million to the joint venture related to tempo-rary financing in anticipation of the establishment of an external bank loan. This receivable was redeemed in January 2019.
A short-term seller credit (postponed settlement) of NOK 154 million was established in connection with the sale of properties at Forus in Stavanger during Decem-ber 2018. This seller credit was redeemed in January 2019.
NOTE 14: Other liabilities
14.1 - Other current liabilities Other current liabilities at 31 December are specified in the table below.
14.2 - Other non-current liabilities Other non-current liabilities at 31 December are speci-fied in the table below.
NOTE 15: Interest-bearing debt
The table below presents an overview at 31 December of the group’s interest-bearing debt, including hedging ratio, average interest rate and remaining duration.
1 All interest rate swaps that have started on the balance sheet date.
Group interest-bearing non-current and current debt at 31 December are specified in accordance with the type of debt in the table below.
2018:
(Amounts in NOK million) 2018 2017
Trade payables 67.9 24.8
Public duties 4.9 7.5
Accrued salaries 13.9 8.8
Accrued interest 59.1 46.2
Prepaid income 18.6 16.6
Advances on sale of apartments 117.9
Advance from sale of investment
properties (see note 6) 55.0
Accrued cost and other debts 107.8 44.7
Total other current liabilities 445.1 148.6
(Amounts in NOK million) 2018 2017
Advance from sale of investment
properties (see note 6) - 55.0
Pension liabilities (see note 21) 2.3 2.4
Total other non-current liabilities 2.3 57.4
2018 2017
Total interest-bearing debt (NOK
million) 7 833.4 6 950.4
Of which construction loan for inventory
(NOK million) (631.5) -
Of which other interest-bearing debt
(NOK million) 7 201.9 6 950.4
Of which hedged (NOK million)1 4 350.0 4 350.0
Interest hedging ratio (per cent) 60.4 62.6
Cash and cash equivalents (NOK million) 124.6 89.2
Interest bearing receivables (NOK
million) 354.0 -
Unutilised credit facilities (NOK million) 650.0 900.0
Average interest rate (per cent) 3.62 3.48
Average interest margin (per cent) 1.38 1.39
Remaining time to maturity for interest-
bearing debt (years) 2.3 3.3
Remaining time to maturity for interest
hedge agreements (years) 4.2 3.9
(Amounts in NOK million) Long-term Short-term Total
Bonds 4 505.0 350.0 4 855.0
Bank borrowings - loan facilities 5.2 2 355.4 2 360.6
Bank borrowings - construction loan 174.5 457.0 631.5
Total interest-bearing debt 4 684.7 3 162.4 7 847.1
Capitalised borrowing cost (5.1) (8.6) (13.7)
Total book value interest-bearing debt 4 679.6 3 153.8 7 833.4
Fair value of bank loans, excess
value/(reduced value) for the group in
relation to book value - 4.0 4.0
Fair value of bonds, excess
value/(reduced value) for the group in
relation to book value (3.1) 2.1 (1.0)

Annual report 2018 - Norwegian Property ASA
The annual accounts of the group Side 34
2017:
The total fair value of interest-bearing debt consists of bonds valued at their market price at 31 December and bank loans at estimated fair value, where account is taken of the estimated difference between the current margin and market conditions (as an example, a positive fair value of the debt in the overview indicates a nega-tive equity effect when the current loan margins are less favourable than the current market conditions).
The table below presents the determination of fair value of loans (bank loans and bonds), excess/(reduced) value for the group in relation to book value (NOK million).
20181:
20171:
1 Level 1: Financial instruments valued based on quoted prices in active markets for identical assets. Level 2: Financial instruments valued based on observable market information not covered by level 1. Level 3: Financial instruments valued based on information that is not ob-servable under level 2.
The group’s policy is to recognise transfers into and out of fair value hierarchy levels at the date of the event or change in circumstances which caused the transfer. There were no transfers between the levels during 2017 or 2018.
The year’s change in interest-bearing debt is specified in the tables below.
2018:
2017:
The maturity of the group’s long-term interest-bearing debt at 31 December is specified in the table below (short-term interest-bearing debt falls due within one year from the balance sheet date).
The carrying amount of group assets pledged as security at 31 December is specified in the table below.
1 Properties with a book value of NOK 265.5 million at the end of 2018 is not pledged for interest-bearing debt.
(Amounts in NOK million) Long-term Short-term Total
Bonds 4 625.0 - 4 625.0
Bank borrowings 2 339.8 9.9 2 349.7
Total interest-bearing debt 6 964.8 9.9 6 974.7
Capitalised borrowing cost (24.3) - (24.3)
Total book value interest-bearing debt 6 940.5 9.9 6 950.4
Fair value of bank loans, excess
value/(reduced value) for the group in
relation to book value - - -
Fair value of bonds, excess
value/(reduced value) for the group in
relation to book value 19.0 - 19.0
(Amounts in NOK million) Bank loans Bonds
Given market value for corresponding
assets and liabilities (level 1) - (1.0)
Other significant observable input
(level 2) - -
Other significant non-observable input
(level 3) 4.0 -
Total estimated fair value 4.0 (1.0)
(Amounts in NOK million) Bank loans Bonds
Given market value for corresponding
assets and liabilities (level 1) - 19.0
Other significant observable input
(level 2) - -
Other significant non-observable input
(level 3) - -
Total estimated fair value - 19.0
(Amounts in NOK million) Bank loans Bonds Total
Interest-bearing debt as of 1 January 2 349.7 4 625.0 6 974.7
New debt 12.2 230.0 242.2
Purchase of company 631.5 - 631.5
Repayment of debt (1.3) - (1.3)
Interest-bearing debt as of 31
December 2 992.1 4 855.0 7 847.1
Capitalised borrowing cost (5.6) (8.1) (13.7)
Book value of interest-bearing debt 2 986.5 4 846.9 7 833.4
(Amounts in NOK million) Bank loans Bonds Total
Interest-bearing debt as of 1 January 5 069.3 1 723.0 6 792.3
New debt 9.0 3 357.0 3 366.0
Repayment of debt (2 728.6) (455.0) (3 183.6)
Interest-bearing debt as of 31
December 2 349.7 4 625.0 6 974.7
Capitalised borrowing cost (11.8) (12.5) (24.3)
Book value of interest-bearing debt 2 337.9 4 612.5 6 950.4
(Amounts in NOK million) 2018 2017
Due in 2020 and 2021 (2019 and 2020) 1 914.7 4 420.6
Due in 2022, 2023 and 2024 (2021, 2022
and 2023) 2 770.0 1 573.6
Due after 2024 (after 2023) - 970.6
Total 4 684.7 6 964.8
(Amounts in NOK million) 2018 2017
Investment property1 15 325.4 15 279.7
Inventory 815.5 -
Total 16 140.9 15 279.7
Liabilities secured 7 847.1 6 967.4

Annual report 2018 - Norwegian Property ASA
The annual accounts of the group Side 35
Assets owned by limited liability partnerships are only pledged as security for own borrowings.
Eight bonds totalling NOK 4 855 million were outstand-ing at 31 December 2018. The bonds are due as follows: NOK 350 million in 2019, NOK 1 735 million in 2020, NOK 1 800 million in 2022 and NOK 970 million in 2024. All bonds are secured by properties and are listed on Oslo Børs.
At 31 December 2018, the credit facilities consisted of bank facilities with a total remaining borrowing limit of NOK 3 010.5 million, which included an overdraft facility of NOK 100 million. The main facilities mature in March 2019 and December 2019 respectively. Drawings are se-cured by two separate property portfolios. Amounts drawn from the bank facilities at 31 December 2018 to-talled NOK 2 360.5 million, while an additional NOK 650 million takes the form of unused credit limits. The key terms for the bank facilities are as follows.
- Interest: NIBOR plus margin. - Interest rate hedging: Minimum 50 and 60 per
cent respectively with an average duration of at least three years.
- Financial covenants: The company must com-ply with agreed senior interest cover and loan-to-value (LTV) thresholds. The agreed senior in-terest cover at 31 December 2018 is a mini-mum interest cover ratio of 1.4 and an agreed LTV ratio for the two main facilities of less than 75 and 78 per cent respectively.
- Other covenants: Negative pledge, restrictions on granting loan guarantees and change of con-trol.
- Security: Secured by pledges on properties and priority pledges on subsidiary shares/interests and intercompany loans. No significant bank guarantees have been issued on behalf of the parent company.
Agreed requirements in the loan agreements were met at 31 December in both 2017 and 2018.
When acquiring the property development under con-struction at Hasle in Oslo in December 2018, a construc-tion loan drawn down by 631.5 million at 31 December
2018 was taken over. The borrowing limit for this loan totals NOK 1 125 million. The project will be completed in 2019 and 2020.
NOTE 16: Deferred tax and income tax
The following table specifies income tax on payable and deferred taxes respectively, and the calculation of in-come tax expense based on income before tax.
1 The corporate tax rate in Norway was reduced from 23 per cent to 22 per cent at the start of 2019. Deferred tax by year-end 2018 is there-fore calculated based on a tax rate of 22 per cent. Similarly, the corpo-rate tax rate was reduced from 24 per cent to 23 per cent at the start of 2018. Deferred tax by year-end 2017 is therefore calculated based on a tax rate of 23 per cent. 2 Relates primarily to deferred tax assets relating to investment prop-erty, which is not recognised when the fair value is greater than the taxable value but lower than cost for the group.
Changes in the carrying amount of deferred tax are specified as follows.
(Amounts in NOK million) 2018 2017
Payable tax - -
Deferred tax 86.8 58.3
Income tax 86.8 58.3
Profit before income tax: 577.4 1 407.0
Income tax calculated at 23 per
cent (2017: 24 per cent) 132.8 337.7
Effect on deferred tax by change of
tax rate1 (28.0) (23.1)
Other differences2 (18.0) (256.3)
Income tax 86.8 58.3
(Amounts in NOK million) 2018 2017
At 1 January 531.5 472.1
Recognised through profit and loss 86.8 58.3
Change related to the purchase of
company (3.7) -
Tax charged to comprehensive
income 1.3 1.1
Per 31. desember 615.9 531.5

Annual report 2018 - Norwegian Property ASA
The annual accounts of the group Side 36
The year's change in deferred tax appears as follows:
1 Property tax value totals NOK 6.5 billion at the end of 2018. Theoretical deferred tax on the sale of all properties at fair value amounts to approximately NOK 1.9 billion. Difference against estimated deferred tax for investment property is due to the recognition exception in IAS 12.15 for the purchase of assets. 2 Deferred tax assets and liabilities are presented net when the group has a legally enforceable right to offset current tax assets against current tax liabilities and when the deferred taxes relate to the same taxation authority. All limited group companies are included in the tax group and registered in Norway. 3 Purchases of single-purpose entities owning only property with no employees, management or recorded procedure descriptions are not considered to be an acquisition of a business (IFRS 3 Business Combinations is not applicable). Hence, the deferred income tax is not accounted for, since it arises from initial recognition of an asset or liability in a transaction other than a business combination which at the time of the transaction affects neither account-ing nor taxable profit or loss.
With effect from 2019, amendments have been made to the rules on limiting interest deductions under Norwe-gian tax legislation. The limitation has been extended to include external interest payments for taxpayers in a group. The change will affect Norwegian Property, which has a foreign controlling shareholder. Norwegian
Property has large losses to carry forward, and these can be used to control the effect on tax payable from a re-duction in interest payments recognised as tax deducti-ble.
NOTE 17: Segment information
Operating segments are reported in a manner con-sistent with the internal reporting provided to the chief operating decision maker. The chief operating decision maker, who is responsible for allocating resources and assessing performance of the operating segments, has been identified as corporate management.
Norwegian Property’s primary business is the ownership and management of commercial properties in Norway (the Oslo and Stavanger regions). The group also has a portfolio of residential properties under development in Oslo. The residential property business was acquired late in the fourth quarter of 2018. In earlier periods, the group assumed that it operated only in one business area and a single geographic market, and no further seg-ment information was therefore prepared.
(Amounts in NOK million)
Investment
property1
Gain and loss
account
Carry forward
losses
Financial
derivatives Other Total2
Total at 1 January 2017 829.8 103.5 (430.2) (80.7) (1.4) 421.0
Not capitalised at 1 January 20173 - (4.1) 55.3 - - 51.1
Book value at 1 January 2017 829.8 99.4 (374.9) (80.7) (1.4) 472.1
Recognised through profit and loss in 2017 306.0 (47.2) (228.6) 27.6 0.5 58.3
Recognised through comprehensive income
in 2017 1.1 - - - - 1.1
Change of calculated deferred tax in 2017 307.1 (47.2) (228.6) 27.6 0.5 59.4
Total at 31 December 2017 1 137.0 56.1 (656.5) (53.1) (0.9) 482.5
Not capitalised at 31 December 20173 - (4.0) 53.0 - - 49.0
Book value at 31 December 2017 1 137.0 52.1 (603.5) (53.1) (0.9) 531.5
Recognised through profit and loss in 2018 (24.1) (18.0) 110.1 18.7 - 86.8
Change related to the purchase of company
in 2018 - - - - (3.7) (3.7)
Recognised through comprehensive income
in 2018 1.3 - - - - 1.3
Change of calculated deferred tax in 2018 (22.7) (18.0) 110.1 18.7 (3.7) 84.4
Total at 31 December 2018 1 114.2 38.0 (544.1) (34.4) (4.6) 569.0
Not capitalised at 31 December 20183 - (3.8) 50.7 - - 46.9
Book value at 31 December 2018 1 114.2 34.2 (493.4) (34.4) (4.6) 615.9

Annual report 2018 - Norwegian Property ASA
The annual accounts of the group Side 37
The segmentation of operating profit excluding admin-istrative ownership costs follows the division in the seg-ments Commercial properties and Residential proper-ties from the fourth quarter of 2018. A corresponding
division has also been made for balance sheet items, but where items related to group functions, financing of the group and tax positions have not been allocated to the segments.
Segment information related to income statement items for 2018 is specified in the table below.
Segment information related to balance sheet items at 31 December 2018 is specified in the table below.
NOTE 18: Contractual rental income
Norwegian Property’s primary business is the ownership and management of commercial properties. The group also acquired a development project involving residen-tial properties in late 2018. The group’s operating in-come in 2018 totalled NOK 798.9 million (2017: NOK 784.3 million).
18.1 - Commercial properties The group’s commercial properties are almost entirely located in central areas of Oslo. The group has a prop-erty at Fornebu in Bærum local authority and leasehold properties at Gardermoen in Ullernsaker local authority where the leases expire in 2019, as well as a property at Forus in Stavanger where a change of use to mixed pur-poses is being sought. The commercial properties con-
sist primarily of office premises with associated ware-housing and parking space. Some of the properties in-clude space for letting as retail outlets and restaurants. Offices account for the bulk of all the larger properties. At Aker Brygge in central Oslo, the properties are lo-cated by the sea with a small associated marina business and an energy centre which uses seawater for heat-ing/cooling of the properties.
Tenants comprise commercial companies and public-sector institutions of different types and sizes. Rental in-come is based on leases of varying lengths, where in-come based on the leases is recognised on a linear basis over the duration of the lease. Rental income is gener-ally invoiced quarterly in advance with 30 days to pay. Income from the marina relates to rental charges by the season, by the day, for events and so forth. Income for
(Amounts in NOK million)Commercial
properties
Residential
propertiesGroup Total
Revenue 798.9 - - 798.9
Total property-related expenses (137.5) - - (137.5)
Administrative expenses - - (57.1) (57.1)
Share of profit in joint ventures 0.3 - - 0.3
Change in market value of investment property 161.1 - - 161.1
Operating profit 822.8 - (57.1) 765.7
Net financial items (188.3) (188.3)
Profit before income tax (245.4) 577.4
Income tax (86.8) (86.8)
Profit for the period (332.2) 490.6
(Amounts in NOK million)Commercial
properties
Residential
propertiesGroup Total
Investment property 15 590.9 - - 15 590.9
Other fixed assets 36.7 - 2.5 39.2
Investment in joint ventures 30.1 - - 30.1
Receivables 455.7 - - 455.7
Property related inventory - 815.5 - 815.5
Cash and cash equivalents - - 124.6 124.6
Deferred tax - - (615.9) (615.9)
Financial derivative instruments - - (156.5) (156.5)
Interest bearing liabilities - - (7 833.4) (7 833.4)
Other liabilities (191.5) (170.9) (85.0) (447.4)
Total equity (8 002.8) (8 002.8)

Annual report 2018 - Norwegian Property ASA
The annual accounts of the group Side 38
the energy centre is invoiced to tenants who are con-nected to it.
The group’s lease-based rental income is distributed as follows, where the figures are given as lease values with-out index adjustment for leases entered into at 31 De-cember.
Rental income does not include service-charge expenses charged to tenants. Accrued service-charge expenses are recognised in the balance sheet together with pay-ments on account from tenants, and therefore do not affect profit beyond an administrative mark-up recog-nised as income. Service-charge expenses are settled af-ter the balance sheet date. Accrued service-charge ex-penses charged to tenants in 2018 amounted to NOK 77.4 million, and the administrative markup recognised as income amounted to NOK 3.9 million.
18.2 - Residential properties The group acquired a project comprising 223 flats under development at Hasle in Oslo in late 2018. Almost all the flats have been sold. The flats are due for completion in the fourth quarter of 2019 and the second quarter of 2020, with a sales value of about NOK 1.2 billion. Assets and liabilities associated with the residential property business are presented in note 17. Assets are primarily related to inventories of NOK 815.5 million at the end of 2018. Current liabilities amount to NOK 170.9 million with NOK 117.9 million representing deposits on flats sold (see note 14.1).
NOTE 19: Realised net financial items
The table below presents a specification of the income statement item on realised net financial items.
NOTE 20: Operating expenses
A specification of operating expenses in the income statement is provided below
20.1 - Property-related operational expenses
20.2 - Other property-related expenses
20.3 - Administrative expenses
(Amounts in NOK million) 2018 2017
Within 1 year 689.0 775.0
Between 1 and 5 years 1 961.1 1 819.4
Later than 5 years 872.4 1 014.2
Total 3 522.5 3 608.6
(Amounts in NOK million) 2018 2017
Interest income on bank deposits 2.6 2.5
Interest income on receivables 1.0 -
Total financial income 3.6 2.5
Interest expense on borrowings (191.6) (210.0)
Realised interest rate derivatives (71.6) (82.4)
Total financial expenses (263.2) (292.4)
Net realised financial items (259.6) (289.9)
(Amounts in NOK million) 2018 2017
Administrative management costs 12.6 11.6
Operating and maintenance costs 59.1 54.5
Total property-related operational
expenses 71.7 66.0
(Amounts in NOK million) 2018 2017
Rental, market and other income-
related expenses 32.4 29.2
Owner's share of service charge
expenses 33.4 28.8
Total other property-related expenses 65.8 58.0
(Amounts in NOK million) 2018 2017
Payroll expenses (see note 21) 82.5 74.7
Depreciation 5.2 4.2
Other operating expenses 14.7 13.0
Costs allocated to property costs (45.3) (38.2)
Total administrative expenses 57.1 53.7

Annual report 2018 - Norwegian Property ASA
The annual accounts of the group Page 39
NOTE 21: Payroll costs and remuneration of executive officers and auditor
The tables below break down payroll costs and remu-neration of directors, senior executives and auditors.
21.1 - Payroll costs Payroll costs for the year are as follows.
Pursuant to the Norwegian Act on Mandatory Occupa-tional Pensions, Norwegian Property ASA must operate certain pension plans. The company has plans which sat-isfy these requirements (defined contribution plan for all employees).
The group has a controlling interest in Bryggedrift AS (see note 28), which has an individual defined benefit pension obligation of NOK 2.3 million to a former em-ployee funded through operations.
21.2 - Directors’ fees Fees paid to directors in 2018 are presented in the table below.
1 Paid benefits in 2018 (amounts in NOK). In addition, Employer’s Na-tional Insurance contributions (14.1 per cent).
Fees paid to directors in 2017 are presented in the table below.
1 Paid benefits in 2017 (amounts in NOK). In addition, Employer’s Na-tional Insurance contributions (14.1 per cent).
21.3 - Auditor’s fee1:
1 Fees to PricewaterhouseCoopers AS (PwC) and affiliated compa-nies.The fees are net of VAT (amounts in NOK).
(Amounts in NOK million) 2018 2017
Salaries and remuneration 62.1 60.9
Employee share-option scheme (see
note 22.4) 6.2 -
Social security costs 9.4 8.6
Pension costs for defined
contribution plans 2.5 2.5
Other employee expenses 2.4 2.7
Total payroll cost 82.5 74.7
Number of employees at 31
December 49 49
Number of full-time equivalent
positions in the financial year 50 51
Average number of employees in the
financial year 49 55
Name
Remune-
ration1
587 500
175 000
416 666
250 000
250 000
187 500
250 000
250 000
Total 2 366 666
Martin Mæland, Chair 01.01-19.04
Merete Haugli, Chair 19.04-31.12 and Director
01.01-19.04
Bjørn Henningsen, Deputy Chair 01.01-31.12
Cecilie Astrup Fredriksen, Director 01.01-31.12
Carl Erik Krefting, Director 19.04-31.12
Kathrine Astrup Fredriksen, Director 01.01-31.12
Kjell Sagstad, Director 01.01-31.12
Lars Erich Nilsen, Director 01.01-31.12
Name
Remune-
ration1
700 000
550 000
250 000
250 000
250 000
250 000
187 500
62 500
Total 2 500 000
Martin Mæland, Chair 01.01-31.12
Bjørn Henningsen, Deputy Chair 01.01-31.12
Cecilie Astrup Fredriksen, Director 01.01-31.12
Lars Erich Nilsen, Director 06.04-31.12
Kathrine Astrup Fredriksen, Director 01.01-31.12
Merete Haugli, Director 01.01-31.12
Kjell Sagstad, Director 01.01-31.12
Harald Herstad, Director 01.01-06.04
Type of fees 2018 2017
Statutory audit 1 292 171 1 343 469
Other certification services 353 300 177 050
Tax/VAT advice 533 910 278 999
Other services - 229 050
Total 2 179 381 2 028 568

Annual report 2018 - Norwegian Property ASA
The annual accounts of the group Page 40
21.4 - Remuneration of senior management Remuneration of senior management in 2018 is specified in the table below.
1 Paid benefits in 2018 (amounts in NOK). In addition, Employer’s National Insurance contributions (14.1 per cent) 2 Paid relating to defined contribution pension plans and employee insurances in 2018 (amounts in NOK).
Fees paid to directors in 2017 are presented in the table below.
1 Paid benefits in 2017 (amounts in NOK). In addition, Employer’s National Insurance contributions (14.1 per cent). 2 Paid relating to defined contribution pension plans and employee insurances in 2017 (amounts in NOK). 3 Svein Hov Skjelle resigned as CEO and CFO at the end of 2017. In 2018, a severance payment of NOK 3 700 000 is paid, as well as earned bonuses of NOK 750 000 and holiday payments of NOK 401 314.
21.5 - Declaration of management benefits This declaration relates to benefits received by key man-agement personnel for work performed in the group. The group will always ensure that it has a professional management to safeguard shareholder interests. To achieve this, the group is required to offer competitive remuneration as part of a total compensation package.
This declaration applies for the coming financial year. The board will base its work on the declaration after it has been considered by the AGM in 2019. In 2018, the group followed the guidelines on executive pay speci-fied in the declaration on executive salaries in the finan-cial statements for 2017, presented to the AGM in 2018. Possible changes to the principles in this statement compared with previous years are explained.
1. PRINCIPLES FOR BASIC PAY
Senior executives will receive a competitive basic annual salary, based on the individual’s responsibilities and level of expertise.
2. BONUS PRINCIPLES
Senior executives can also receive variable bonus pay-ments. Bonus payments are determined by the individ-ual’s own performance in meeting key targets for the group, a specific function or a subsidiary in which the in-dividual is employed. Key targets will consist of perfor-mance improvement initiatives or financial targets, in-cluding the company’s share price performance. Targets in relation to the chief executive officer’s own perfor-mance will be established by the board, while the chief executive officer will establish targets for other senior executives. The targets must be measurable wherever possible. Bonus payment must not exceed 80 per cent of the chief executive officer’s annual salary or 30 per cent of annual base salary for other senior executives.
3. PRINCIPLES FOR RELATED NON-CASH BENEFITS
Senior executives can be offered certain non-cash re-lated compensation benefits, such as a company car scheme, insurance and pension arrangements. Non-cash related benefits shall primarily be provided in the form of mobile telephony and newspapers in order for
Name Title Salary1 Bonuses1
Other
benefits1
Pension/insur-
ance benefits2
Bent Oustad CEO 3 208 333 - 4 026 89 694
Haavard Rønning CFO from 01.03.18 2 122 175 - 8 157 75 975
Bjørge Aarvold EVP Property Management 1 824 703 309 736 144 392 101 201
Ellen Cathrine Kobro EVP Marketing from 15.06.18 1 568 058 128 125 7 705 91 202
Tore Heldrup Rasmussen EVP Commercial until 30.04.18 2 411 113 339 844 129 514 87 360
Total 11 134 382 777 705 293 794 445 432
Name Title Salary1 Bonuses1
Other
benefits1
Pension/insur-
ance benefits2
Svein Hov Skjelle3 CEO and CFO until 31.12.17 3 745 600 700 000 133 262 111 134
Tore Heldrup Rasmussen EVP Commercial 2 564 705 400 000 115 984 108 638
Bjørge Aarvold EVP Property Management 1 837 950 275 000 119 262 113 863
Total 8 148 255 1 375 000 368 508 333 635
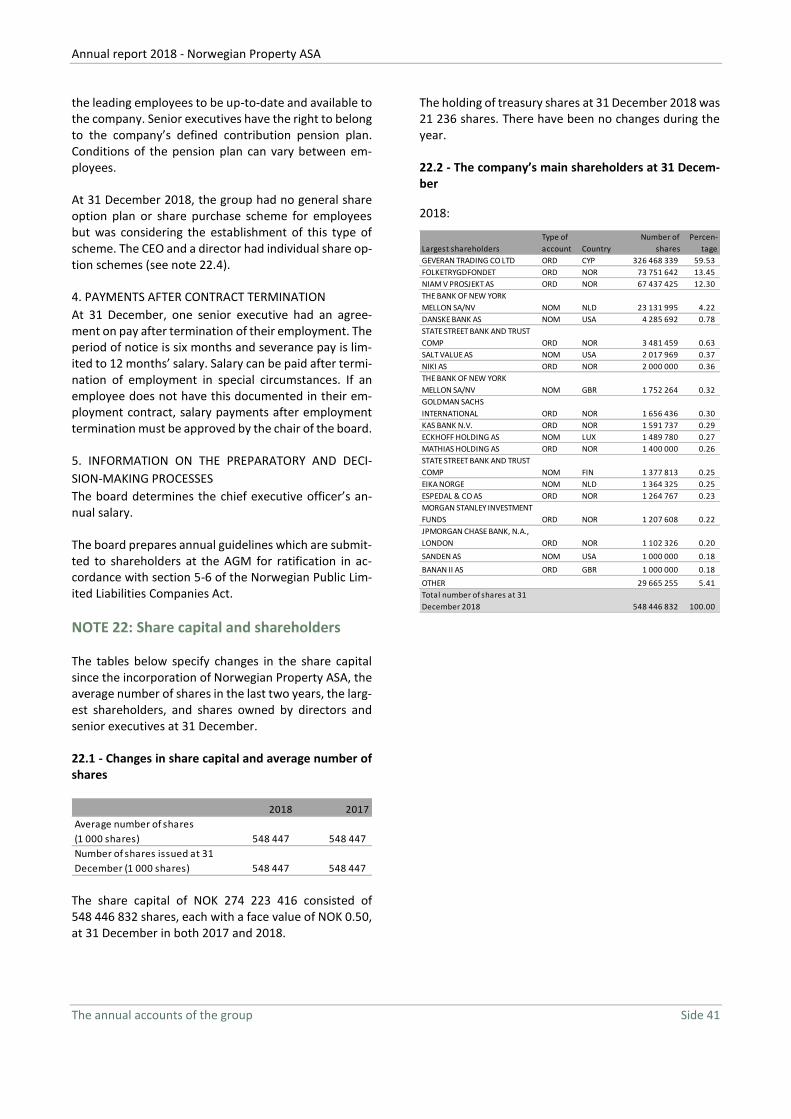
Annual report 2018 - Norwegian Property ASA
The annual accounts of the group Side 41
the leading employees to be up-to-date and available to the company. Senior executives have the right to belong to the company’s defined contribution pension plan. Conditions of the pension plan can vary between em-ployees.
At 31 December 2018, the group had no general share option plan or share purchase scheme for employees but was considering the establishment of this type of scheme. The CEO and a director had individual share op-tion schemes (see note 22.4).
4. PAYMENTS AFTER CONTRACT TERMINATION
At 31 December, one senior executive had an agree-ment on pay after termination of their employment. The period of notice is six months and severance pay is lim-ited to 12 months’ salary. Salary can be paid after termi-nation of employment in special circumstances. If an employee does not have this documented in their em-ployment contract, salary payments after employment termination must be approved by the chair of the board.
5. INFORMATION ON THE PREPARATORY AND DECI-
SION-MAKING PROCESSES
The board determines the chief executive officer’s an-nual salary.
The board prepares annual guidelines which are submit-ted to shareholders at the AGM for ratification in ac-cordance with section 5-6 of the Norwegian Public Lim-ited Liabilities Companies Act.
NOTE 22: Share capital and shareholders
The tables below specify changes in the share capital since the incorporation of Norwegian Property ASA, the average number of shares in the last two years, the larg-est shareholders, and shares owned by directors and senior executives at 31 December.
22.1 - Changes in share capital and average number of shares
The share capital of NOK 274 223 416 consisted of 548 446 832 shares, each with a face value of NOK 0.50, at 31 December in both 2017 and 2018.
The holding of treasury shares at 31 December 2018 was 21 236 shares. There have been no changes during the year.
22.2 - The company’s main shareholders at 31 Decem-ber
2018:
2018 2017
Average number of shares
(1 000 shares) 548 447 548 447
Number of shares issued at 31
December (1 000 shares) 548 447 548 447
Largest shareholders
Type of
account Country
Number of
shares
Percen-
tage
GEVERAN TRADING CO LTD ORD CYP 326 468 339 59.53
FOLKETRYGDFONDET ORD NOR 73 751 642 13.45
NIAM V PROSJEKT AS ORD NOR 67 437 425 12.30
THE BANK OF NEW YORK
MELLON SA/NV NOM NLD 23 131 995 4.22
DANSKE BANK AS NOM USA 4 285 692 0.78
STATE STREET BANK AND TRUST
COMP ORD NOR 3 481 459 0.63
SALT VALUE AS NOM USA 2 017 969 0.37
NIKI AS ORD NOR 2 000 000 0.36
THE BANK OF NEW YORK
MELLON SA/NV NOM GBR 1 752 264 0.32
GOLDMAN SACHS
INTERNATIONAL ORD NOR 1 656 436 0.30
KAS BANK N.V. ORD NOR 1 591 737 0.29
ECKHOFF HOLDING AS NOM LUX 1 489 780 0.27
MATHIAS HOLDING AS ORD NOR 1 400 000 0.26
STATE STREET BANK AND TRUST
COMP NOM FIN 1 377 813 0.25
EIKA NORGE NOM NLD 1 364 325 0.25
ESPEDAL & CO AS ORD NOR 1 264 767 0.23
MORGAN STANLEY INVESTMENT
FUNDS ORD NOR 1 207 608 0.22
JPMORGAN CHASE BANK, N.A.,
LONDON ORD NOR 1 102 326 0.20
SANDEN AS NOM USA 1 000 000 0.18
BANAN II AS ORD GBR 1 000 000 0.18
OTHER 29 665 255 5.41
Total number of shares at 31
December 2018 548 446 832 100.00

Annual report 2018 - Norwegian Property ASA
The annual accounts of the group Side 42
2017:
22.3 - Shares held by senior executives and directors at 31 December 2018
1 Cecilie Astrup Fredriksen, Kathrine Astrup Fredriksen and Lars Erich Nilsen are affiliated with Geveran Trading Co Ltd, which was the larg-est shareholder in Norwegian Property ASA at 31 December 2018. Geveran Trading Co Ltd owns 326 468 339 shares in Norwegian Prop-erty, which represent 59.53 per cent of the issued shares in the com-pany. 2 Kjell Sagstad is affiliated with Niam V Prosjekt AS, which owns 67 437 425 shares in Norwegian Property at 31 December 2018, rep-resenting 12.30 per cent of the issued shares in the company. 3 At year-end 2018, 100 000 shares were owned by Max Eiendom AS and 211 556 shares by Camvecti Holding AS. Both companies are 100 per cent owned by Bjørn Henningsen. 4 At year-end 2018, 55 000 shares were owned by Yanka AS. The com-pany is 100 per cent owned by Bent Oustad.
5 Board member Carl Erik Krefting owns or controls no shares directly in Norwegian Property ASA at the end of 2018, but via the wholly owned company Carucel Holding AS has a TRS agreement relating to 4 326 842 shares with a term to 24 January 2020 and redemption price of NOK 10.80 per share.
22.4 - Share options Share options had been granted to the CEO and one di-rector (Carl Erik Krefting) of the company at 31 Decem-ber 2018. Each share option entitles the holder to sub-scribe for a share in Norwegian Property ASA.
The fair value of the options is calculated at the time of allocation and expensed over the vesting period. The following amount has been recognised against equity in relation to employee options at 31 December.
The option agreement with the CEO was entered into in 2017 and entitles him to subscribe for a total of 5 750 000 shares as follows.
The options will lapse if they are not exercised by 1 July 2022. As an alternative to delivering shares, the board of Norwegian Property may opt to settle the profit in
Largest shareholders
Type of
account Country
Number of
shares
Percen-
tage
GEVERAN TRADING CO LTD ORD CYP 317 969 937 57.98
FOLKETRYGDFONDET ORD NOR 72 951 642 13.30
NIAM V PROSJEKT AS ORD NOR 67 437 425 12.30
THE BANK OF NEW YORK NOM NLD 23 730 241 4.33
STATE STREET BANK AN A/C WEST
NON-TREATY NOM USA 4 205 856 0.77
CEK HOLDING AS ORD NOR 3 396 352 0.62
STATE STREET BANK & S/A SSB
CLIENT OMNIBUS NOM USA 2 181 110 0.40
NIKI AS ORD NOR 2 000 000 0.36
BNP PARIBAS SECURITI BPSS
LDN/TR PROP NOM GBR 1 641 484 0.30
SALT VALUE AS ORD NOR 1 599 988 0.29
KLP AKSJENORGE INDEKS ORD NOR 1 553 612 0.28
J.P. MORGAN BANK LUX JPML SA
RE CLT ASSET NOM LUX 1 457 417 0.27
MATHIAS HOLDING AS ORD NOR 1 400 000 0.26
SKANDINAVISKA ENSKILDA SEB
AB, UCITS V FI NOM FIN 1 370 112 0.25
KAS BANK N.V. S/A CLIENT ACC
TREATY NOM NLD 1 359 000 0.25
DNB NOR MARKETS, AKS DNB
BANK ASA ORD NOR 1 331 646 0.24
EIKA NORGE ORD NOR 1 290 365 0.24
ESPEDAL & CO AS ORD NOR 1 264 767 0.23
STATE STREET BANK AN A/C
CLIENT OMNIBUS NOM USA 1 087 031 0.20
HSBC BANK PLC A/C IB MAIN
ACCOUNT ORD GBR 1 005 904 0.18
OTHER 38 212 943 6.97
Total number of shares at 31
December 2017 548 446 832 100.00
Shareholder
Number of
shares
Board of directors:
Affiliated with Geveran Trading Co Ltd1 326 468 339
Affiliated with Niam V Prosjekt AS2 67 437 425
Bjørn Henningsen, Deputy Chair3 311 556
Senior executives:
Bent Oustad, CEO4 55 000
Total number of shares5 394 272 320
Employee options
Number of
options
Weighted
average
excercice
price (NOK)
Outstanding 1 January 2017 - -
Awarded 5 750 000 12.54
Exercised - -
Terminated - -
Outstanding 31 December 2017 5 750 000 12.54
Earned - -
Outstanding 1 January 2018 5 750 000 12.54
Awarded 500 000 11.50
Exercised - -
Terminated - -
Outstanding 31 December 2018 6 250 000 12.46
Earned 1 January 2019 1 166 666 10.21
Employee options 2018 2017
Recognised against equity at 1
January - -
Recognised in profit and loss
during the period 6.2 -
Recognised against equity at 31
December 6.2 -
Earliest exercise date No. of shares Subscr. price (NOK)
01.01.2019 1 000 000 10.00
01.01.2020 1 250 000 11.50
01.01.2021 1 500 000 12.50
01.01.2022 2 000 000 14.50

Annual report 2018 - Norwegian Property ASA
The annual accounts of the group Side 43
cash. The agreement otherwise contains normal condi-tions on such matters as continued employment and ad-justment of share prices and so forth as a result of cor-porate events.
The total fair value of share options granted in 2017 was NOK 11.2 million (excluding the employer’s National In-surance contribution). The fair value is calculated by ex-ternal valuers based on the Black-Scholes model. In cal-culating fair value, volatility in the period was set at 27.43 per cent and the risk-free interest rate at 0.97 per cent. The weighted average vesting period for the share options granted is 2.8 years. The share price at the grant date was NOK 10.45.
The option agreement with the director was entered into in 2018 and entitles him to subscribe for a total of 500 000 shares as follows.
The options will lapse if they are not exercised by 19 Oc-tober 2021. As an alternative to delivering shares, the board of Norwegian Property may opt to settle the profit in cash. The agreement otherwise contains condi-tions on such matters as continued service as a director during the vesting period and adjustment of share prices and so forth as a result of corporate events.
The total fair value of share options granted in 2018 was NOK 0.9 million (excluding the employer’s National In-surance contribution). The fair value is calculated by ex-ternal valuers based on the Black-Scholes model. In cal-culating fair value, volatility in the period was set at 26.76 per cent and the risk-free interest rate at 1.21 per cent. The weighted average vesting period for the share options granted is two years. The share price at the grant date was NOK 10.24.
NOTE 23: Earnings per share
Basic earnings per share are calculated by dividing the net profit attributable to shareholders by the weighted average number of ordinary shares outstanding during the year.
1 At the end of 2018 the company owns 21 236 treasury shares (ac-quired in 2012). 2 The diluted number of shares has been adjusted for options granted (see note 22).
NOTE 24: Dividend per share and dividend policy
Norwegian Property’s goal is to pay a dividend to its shareholders amounting to 30-50 per cent of its ordi-nary profit after tax payable, but before fair-value ad-justments. The dividend can be higher in times with good cash flow. Before a dividend is determined, an as-sessment is made of the group’s financial position and prospects, including the availability of attractive invest-ment opportunities.
The board has a mandate from the company’s AGM to make quarterly dividend payments. A dividend of NOK 0.28 per share was approved for the quarters in 2018, including a resolution by the board meeting on 6 Febru-ary 2019 regarding payment of a dividend of NOK 0.07 per share.
Earliest exercise date No. of shares Subscr. price (NOK)
01.01.2019 166 666 11.50
01.01.2020 166 667 11.50
01.01.2021 166 667 11.50
2018 2017
Net profit attributable to shareholders
(NOK million) 490.6 1 348.7
Weighted average number of
outstanding shares, exclusive treasury
shares (million shares)1 548.4 548.4
Weighted average number of diluted
outstanding shares, exclusive treasury
shares (million shares)2 554.5 548.7
Basic earnings per share (NOK per
share) 0.89 2.46
Diluted earnings per share (NOK per
share) 0.88 2.46

Annual report 2018 - Norwegian Property ASA
The annual accounts of the group Side 44
NOTE 25: Related-party disclosures
Parties are related if one party can exercise significant influence over the group in making strategic or operat-ing decisions. Significant influence is normally obtained by ownership, participation in decision-making bodies and management, or by agreements.
Balances and transactions with subsidiaries (which are related parties of Norwegian Property ASA) are elimi-nated in the consolidated financial statements and are not covered by the information given in this note. Finan-cial relationships related to the board and senior man-agement are described in notes 21 and 22.
No significant agreements or significant transactions were entered into with related parties in 2017 and 2018.
NOTE 26: Contingent liabilities and assets
The group has a liability if it is committed to give up fi-nancial resources to another party at a future date. An uncertain liability is a liability of uncertain timing or amount. A contingent liability is a category of uncertain liabilities, where the possible obligation depends on whether some uncertain future events occur which the group cannot fully influence. Similarly, a contingent as-set relates to possible rights for the company to receive financial resources at a future date.
Guarantees relating to the sale of properties and com-panies The seller normally issues guarantees relating to the sale of properties because of formal, physical and suchlike conditions related to the transferred properties and/or companies. The guarantees typically include conditions related to legal status, ownership of shares, validity of financial statements and VAT/tax issues, contractual is-sues, liens, environmental matters, insurance coverage, assessment of defects and so forth. The seller must typ-ically cover financial losses for the buyer attributable to any errors or omissions which may be linked to the guar-antees.
Norwegian Property has issued this kind of guarantee to buyers in relation to the sale of properties/companies since the company was established. At 31 December 2018, the assessment is that there are no circumstances which entail an obligation and a need for provisions by Norwegian Property.
NOTE 27: Events after the balance sheet date
Events after the balance sheet date are events, favoura-ble or unfavourable, which occur between the balance sheet date and the date when the financial statements are authorised for issue. Such events can be events which provide information on conditions existing at the balance sheet date, resulting in adjustments in the fi-nancial statements, or events which do not require such adjustments.
In accordance with the mandate from the AGM in 2018, the board resolved on 6 February 2018 that a dividend of NOK 0.07 per share will be paid on the basis of the accounts at 31 December 2018.
No other significant events occurred after 31 December 2018 which provide information on conditions existing at the balance sheet date.
NOTE 28: Group companies
The consolidated financial statements of Norwegian Property ASA comprise the following wholly-owned sub-sidiaries at 31 December 2018.
Aker Brygge AS Aker Brygge Business Village AS Aker Brygge Energisentral AS Aker Brygge Marina AS Aker Brygge Marina Drift AS Aker Brygge Uteareal AS Bryggegata 9 AS Bydel Aker Brygge Forvaltning AS Dokkbygningen Aker Brygge AS Drammensveien 134 AS Drammensveien 60 AS Fondbygget AS Forusbeen 35 AS Fourth Floor AS Fifth Floor AS Gamle Kaibygning 1 AS Gardermoen Næringseiendom ANS Gardermoen Næringseiendom AS Gardermoen Næringseiendom KS Gjerdrums vei 10 D AS Gjerdrums vei 10 D II AS Gjerdrums vei 8 AS Gjerdrums vei 14-16 AS Gjerdrums vei 17 AS Grenseveien 19 AS Grenseveien 21 AS Gullhaug Torg 3 AS
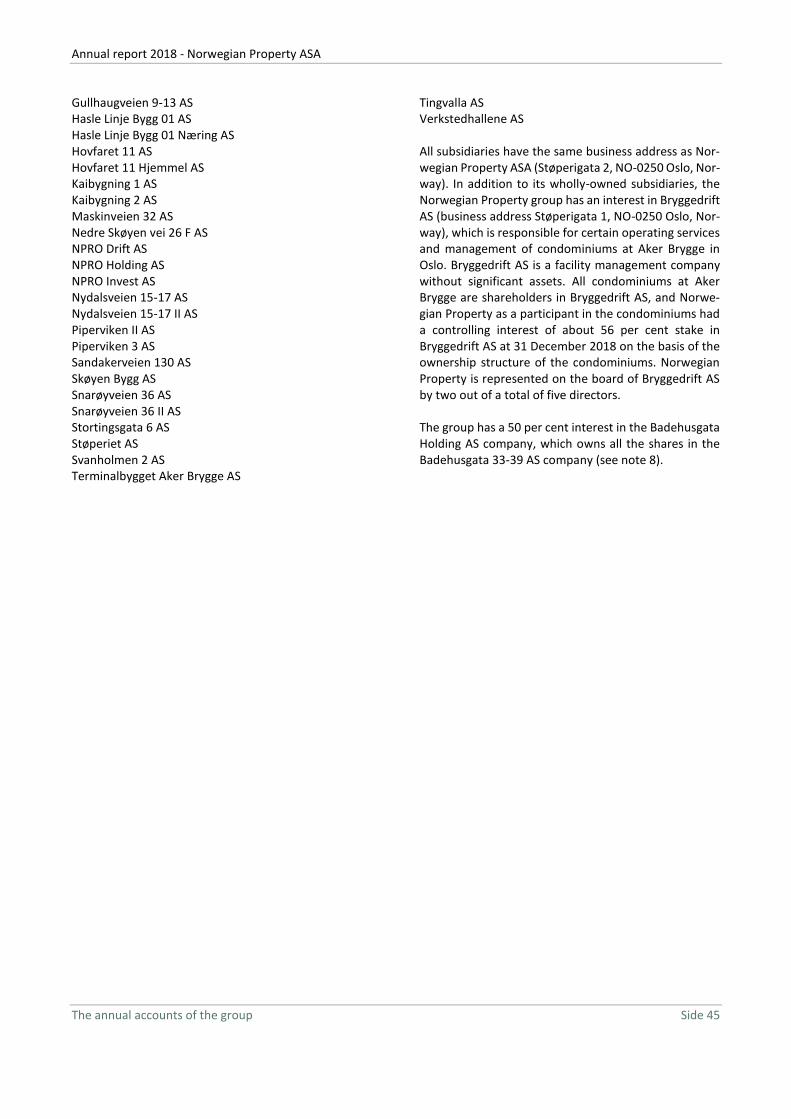
Annual report 2018 - Norwegian Property ASA
The annual accounts of the group Side 45
Gullhaugveien 9-13 AS Hasle Linje Bygg 01 AS Hasle Linje Bygg 01 Næring AS Hovfaret 11 AS Hovfaret 11 Hjemmel AS Kaibygning 1 AS Kaibygning 2 AS Maskinveien 32 AS Nedre Skøyen vei 26 F AS NPRO Drift AS NPRO Holding AS NPRO Invest AS Nydalsveien 15-17 AS Nydalsveien 15-17 II AS Piperviken II AS Piperviken 3 AS Sandakerveien 130 AS Skøyen Bygg AS Snarøyveien 36 AS Snarøyveien 36 II AS Stortingsgata 6 AS Støperiet AS Svanholmen 2 AS Terminalbygget Aker Brygge AS
Tingvalla AS Verkstedhallene AS All subsidiaries have the same business address as Nor-wegian Property ASA (Støperigata 2, NO-0250 Oslo, Nor-way). In addition to its wholly-owned subsidiaries, the Norwegian Property group has an interest in Bryggedrift AS (business address Støperigata 1, NO-0250 Oslo, Nor-way), which is responsible for certain operating services and management of condominiums at Aker Brygge in Oslo. Bryggedrift AS is a facility management company without significant assets. All condominiums at Aker Brygge are shareholders in Bryggedrift AS, and Norwe-gian Property as a participant in the condominiums had a controlling interest of about 56 per cent stake in Bryggedrift AS at 31 December 2018 on the basis of the ownership structure of the condominiums. Norwegian Property is represented on the board of Bryggedrift AS by two out of a total of five directors. The group has a 50 per cent interest in the Badehusgata Holding AS company, which owns all the shares in the Badehusgata 33-39 AS company (see note 8).

Annual report 2018 - Norwegian Property ASA
Annual accounts of the parent company Page 46
Annual accounts of the parent company
Income statement 1 Jan - 31 Dec
(Amounts in NOK million) Note 2018 2017
Management and service fee, group companies 13 46.7 42.8
Total operating revenue 46.7 42.8
Payroll costs 10 (75.8) (68.3)
Depreciation 5 (3.9) (2.9)
Other operating costs 10 (26.7) (27.6)
Total operating costs (106.4) (98.8)
Operating profit (59.7) (56.0)
Financial income 11, 13 77.6 110.5
Financial expenses 11, 13 (251.7) (351.8)
Net financial items (174.1) (241.3)
Profit before tax (233.8) (297.3)
Income tax expense 12 25.3 40.5
Profit for the year (208.4) (256.8)
Proposed allocations:
Dividend distribution to shareholders (38.4) (38.4)
Transferred to/from other paid-in equity (171.1) (295.2)
Transferred to/from share premium (75.7) -

Annual report 2018 - Norwegian Property ASA
Annual accounts of the parent company Side 47
Balance sheet as at 31 Dec
Oslo, 11 March 2019
Norwegian Property ASA
(Amounts in NOK million) Note 2018 2017
ASSETS
Non-current assets:
Deferred tax assets 12 581.7 632.2
Financial derivative instruments 9 8.1 2.3
Tangible assets 5 2.5 6.5
Investments in subsidiaries 4, 13 8 727.4 8 981.5
Intercompany balances 13 465.3 135.7
Total non-current assets 9 785.0 9 758.3
Current assets:
Financial derivative instruments 9 0.2 0.4
Intercompany balances 13 217.0 438.7
Other receivables 2.5 1.3
Cash and cash equivalents 3 42.3 5.9
Total current assets 262.0 446.4
TOTAL ASSETS 10 047.0 10 204.6
EQUITY AND LIABILITIES
Equity:
Share capital 274.2 274.2
Share premium 2 219.3 2 295.1
Other paid-in equity - 280.2
Total equity 6 2 493.5 2 849.4
Non-current liabilities:
Financial derivative instruments 9 163.2 233.1
Interest-bearing debt 8 4 499.9 6 933.8
Intercompany balances 13 70.0 70.0
Total non-current liabilities 4 733.1 7 236.9
Current liabilities:
Financial derivative instruments 9 1.6 0.5
Interest-bearing debt 8 2 695.5 8.7
Intercompany balances 13 - -
Provisory dividend 6 38.4 38.4
Other current liabilities 7 84.9 70.8
Total current liabilities 2 820.4 118.4
Total liabilities 7 553.5 7 355.3
TOTAL EQUITY AND LIABILITIES 10 047.0 10 204.6

Annual report 2018 - Norwegian Property ASA
Annual accounts of the parent company Page 48
Cash flow statement 1 Jan - 31 Dec
(Amounts in NOK million) Note 2018 2017
Ordinary profit before tax (233.8) (297.3)
Net financial items 11 174.1 241.3
Interest received 11 3.2 5.0
Interest paid 11 (215.7) (272.0)
Other financial expenses paid 11 (23.0) (86.7)
Depreciation of tangible assets 5 3.9 2.9
Changes in current items 16.8 3.4
Net cash flow from operating activities (274.4) (403.5)
Purchase of tangible assets 5 - (1.0)
Sale of tangible assets 5 0.1 1.8
Investments in subsidiaries 4 - (25.0)
Repayment of intercompany balances 13 222.1 425.2
Net cash flow from investment activities 222.2 401.0
Repayment of interest-bearing debt 8 - (3 182.4)
New interest-bearing debt 8 242.2 3 357.0
Dividends paid 6 (153.6) (186.5)
Net cash flow from financing activities 88.6 (11.8)
Net change in cash and cash equivalents 36.4 (14.3)
Cash and cash equivalents 1 January 3 5.9 20.2
Cash and cash equivalents 31 December 3 42.3 5.9

Annual report 2018 - Norwegian Property ASA
Annual accounts of the parent company Page 49
NOTE 1: General information
The real estate group Norwegian Property owns com-mercial and residential properties in the Oslo and Sta-vanger regions. Norwegian parent company ASA is a public limited company with headquarters in Støperi-gata 2, Oslo (Norway). The company's shares are listed on the Oslo Stock Exchange under the ticker NPRO.
The accounts were approved by the board on 11 March 2019, for final approval by the General Meeting on 11 April 2019.
NOTE 2: Summary of significant accounting-policies
The financial statements are prepared in accordance with the Norwegian Accounting Act and Norwegian generally accepted accounting principles.
The principal accounting policies applied in the prepa-ration of these consolidated financial statements are set out below. These policies have been consistently applied to all the years presented, unless otherwise stated.
2.1 - Classifications Assets held for sale or for use in the ordinary business cycle, or owned mainly for trade, or expected to be re-alised within 12 months or represent cash and cash equivalents are classified as current assets. All other as-sets are classified as non-current assets. Liabilities which are expected to be settled in the ordinary course of business, are mainly held for trade or are expected to be settled within 12 months are classified as current liabilities. All other liabilities are classified as non-cur-rent liabilities.
2.2 - Subsidiaries Subsidiaries are accounted for using the cost method. The investments are recorded at the acquisition price of the shares unless impairment is required. Impair-ment is implemented at fair value when a fall in value is caused by reasons which cannot be assumed to be transient and is deemed necessary according to gener-ally accepted accounting principles. Impairment is re-versed when the basis for it no longer exists.
Dividends and other distributions are recognised in the year for which they are proposed by the subsidiary. When dividend/group contribution significantly ex-ceeds the part of the retained earnings for the group from subsidiaries after the acquisition, the excess part
is considered a repayment of invested capital and de-ducted from the value of the investment in the balance sheet.
2.3 - Tangible assets All tangible assets are stated at historical cost, less de-preciation. Historical cost includes expenditure directly attributable to the acquisition of the item.
Subsequent costs are included in the asset’s carrying amount or recognised as a separate asset, as appropri-ate, only when it is probable that future economic ben-efits associated with the item will flow to the group and the cost of the item can be reliably measured. All other repairs and maintenance costs are charged to the income statement during the financial period in which they incur.
2.4 - Trade receivables Trade receivables and other receivables are recognized initially at face value, less provision for impairment. Provision for impairment of trade receivables is based on individual assessments of each receivable.
2.5 - Cash and cash equivalents Cash and cash equivalents include cash in hand, bank deposits, other current highly liquid investments with original maturities of three months or less, and bank overdrafts. Bank overdrafts are shown under borrow-ings in current liabilities in the balance sheet.
2.6 – Share capital and share premium Shares are classified as equity when there is no obliga-tion to transfer cash or other assets. Costs directly at-tributable to the issue of new shares or options are shown in equity as a deduction, net of tax, from the proceeds. Treasury shares are recognised at face value.
Employee options represent rights for employees to subscribe for shares in the company at a future time at a predetermined subscription price (subscription right). Drawing requires continued employment. The fair value of employee benefits received in exchange for the granting of options is calculated as an expense. The total amount to be expensed over the vesting period reflects the fair value of the options granted. On the balance sheet date, the company reviews the esti-mates of the number of options expected to be utilised and changes in estimates are recognised in the income statement over the remaining vesting period with a corresponding adjustment of equity. The value of allot-ted shares after deduction of directly-linked transac-tion costs is credited to share capital and share pre-mium when exercisable options are exercised.

Annual report 2018 - Norwegian Property ASA
Annual accounts of the parent company Side 50
2.7 - Borrowings Borrowings are recognised initially at fair value, net of transaction costs incurred. Borrowings are subse-quently stated at amortised cost using the effective in-terest method. Any differences between the proceeds (net of transaction costs) and the redemption value is recognised in the income statement over the duration of the borrowings.
2.8 - Interest expense Interest expenses on borrowings are recognised under “financial costs” in the income statement using the ef-fective interest rate method. The effective interest rate method is used to allocate amortised cost on financial assets and financial liabilities and for correct accrual of interest income and interest expense. The effective in-terest rate allocates future cash flows throughout the duration of the loan and indicates the real net value of the financial asset or liability.
When calculating the effective interest rate, the group estimates all contractual cash flows related to the fi-nancial instrument (such as terms of payment) but does not take future loss into account. When calculat-ing the effective interest rate, all fees are included and distributed over the relevant period (term to maturity).
2.9 - Management fees and other operating revenue Management fees charged to subsidiaries relate to property management, managing customer centre and financial management. Management fees are recog-nised when they are earned.
2.10 - Derivatives The group is exposed to interest rate risk related to floating rate loans. The company uses forward rate agreements to reduce interest rate risk. Unrealised profits/losses related to these contracts are recognised in the income statement.
2.11 - Pensions Norwegian Property ASA operates a defined contribu-tion plan for all employees. A defined contribution pen-sion plan is a scheme where the group pays fixed (de-fined) amounts to a privately held managed plan. The group has no legal or other obligations to pay further amounts if the pension scheme itself has insufficient assets to pay contributions to employees relating to rights earned in current or previous periods. Contribu-tions are recognised as an employee benefit expense when they fall due. Prepaid contributions are recog-nised as an asset to the extent that cash refunds or re-ductions in future payments are available.
2.12 - Income tax Tax in the income statement consists of tax payable and changes in deferred tax. Deferred income tax is calculated at 24 per cent based on the temporary dif-ferences between the tax bases of assets and liabilities and their carrying amounts in the consolidated finan-cial statements, and tax loss carried forward at 31 De-cember. Tax increasing or reducing temporary differ-ences which are reversed or can be reversed in the same period are offset. Deferred tax assets are recog-nised to the extent that it is probable that future taxa-ble profit will be available against which the temporary differences can be utilised.
2.13 - Use of estimates The preparation of the income statement in accord-ance with Norwegian generally accepted accounting principles requires the use of estimates and assump-tions which affect the income statement and the valua-tion of assets and liabilities as well as information re-lated to unsecured assets and liabilities at the balance sheet date.
Contingent losses which are probable and quantifiable are recognised as they occur.
2.14 - Cash flow statement The preparation of the cash flow statement is based on the indirect method. Cash and cash equivalents include cash in hand, bank deposits and other current liquid in-vestments.
NOTE 3: Financial risk management
The company’s activities imply exposure to a variety of financial risks: market risk, credit risk and liquidity risk. 3.1 - Market risk Market risk for the company is primarily related to in-terest rate risk and, to a lesser degree, currency and price risk. At the end of 2018, the company has no ex-posure to currency risk and the company’s revenue for 2018 is entirely related to management fees from sub-sidiaries.
The company is subject to interest rate risk related to floating rate loans. To mitigate interest rate risk, the group has entered into interest rate swap agreements. Notional principal amounts and the maturity for the company’s total portfolio of interest rate hedges at 31 December are specified in NOK million in the table be-low.

Annual report 2018 - Norwegian Property ASA
Annual accounts of the parent company Side 51
3.2 - Credit risk The company’s receivables are mainly related to inter-company balances, where credit risk is considered low.
3.3 - Liquidity risk The company aims to ensure that liquidity/credit facili-ties are sufficient to meet its foreseeable obligations in addition to securing a reasonable capacity to meet un-foreseen obligations. The liquidity reserve should largely consist of revolving credit and overdraft facili-ties, rather than cash and cash equivalents. The liquid-ity reserve at 31 December is specified in the table be-low.
1 Subsidiaries’ deposits in the parent company’s group accounts are included as cash and cash equivalents in Norwegian Property ASA.
As described above, the company has a high level of hedging against changes in market interest rates, re-ducing the need for liquidity reserves to meet unfore-seen obligations related to these areas. Liquidity risk is mainly related to instalments and maturity of liabilities. The maturity of liabilities for the company is specified in the table below. The classification is based on the maturity specified in the contracts. The amounts in the table specify the timing of repayment of notional prin-cipal amounts (NOK million).
20181:
20171:
1 The difference between the carrying value and expected cash flow reflects activated costs and estimated interest cost based on average interest rate at year-end (intercompany balances assumed settled by 1 January 2022). The difference between carrying value and expected cash flow related to provision for hedge contracts.
Norwegian Property made no major changes to its loan portfolio in 2018. At the beginning of the year, a bond loan was extended by NOK 230 million with a corre-sponding reduction in bank facilities.
Interest-bearing debt in the balance sheet totalled NOK 7 265.4 million at 31 December 2018, with non-current interest-bearing debt accounting for NOK 4 569.9 mil-lion and current interest-bearing debt for NOK 2 695.5 million. NOK 850 million of the current interest-bearing debt at 31 December 2018 related to properties agreed for sale in 2019 as well as temporary joint-venture fi-nancing. Other current interest-bearing debt relates to facilities maturing in the fourth quarter of 2019, which will be refinanced during the year.
(Amounts in NOK million) 2018 2017
The company's own accounts and net
balance in the group accounts 259.3 444.6
Intercompany net balance in the
group accounts1 (217.0) (438.7)
Cash and cash equivalents 42.3 5.9
Restricted bank deposits (2.4) (2.3)
Available cash and cash equivalents 39.8 3.6
Unused credit and overdraft facilities 650.0 900.0
Liquidity reserve 689.8 903.6
(Amounts in NOK million)
Interest-
bearing
debt
Other
liabilities
< 1 year 2 918.6 84.9
1-2 year 1 869.2
3-5 year 2 076.9
Over 5 year 987.6
Expected cash flow 7 852.3 84.9
Book value 7 265.4 84.9
(Amounts in NOK million)
Interest-
bearing
debt
Other
liabilities
< 1 year 251.0 70.8
1-2 year 2 878.6
3-5 year 3 573.0
Over 5 year 1 020.6
Expected cash flow 7 723.3 70.8
Book value 7 012.5 70.8

Annual report 2018 - Norwegian Property ASA
Annual accounts of the parent company Side 52
NOTE 4: Investments in subsidiaries
Investments in subsidiaries at 31 December 2018 are specified in the table below. The companies own the group’s properties (“single purpose” companies).
1 Voting ownership interest is identical to ordinary ownership.
Changes in book value for the year are as follows:
NOTE 5: Tangible assets
Changes in tangible assets are specified in the table be-low.
The company uses linear depreciation and the useful life of the assets are four years for IT equipment, five years for licenses, cars and equipment, and seven years for fixtures.
NPRO
Holding AS
NPRO
Invest AS
Acquired/established Date 17.01.07 26.09.13
Business office City Oslo Oslo
Share1 Per cent 100.0 100.0
Book value NOK million 8 717.4 10.0
(Amounts in NOK million) 2018 2017
Book value at 1 January 8 981.5 12 722.4
Investments in subsidiaries - 25.0
Group contribution recognised
against shares in subsidiaries (254.1) (3 765.9)
Book value at 31 December 8 727.4 8 981.5
(Amounts in NOK million)
IT-systems
and other
intangible
assets
Fixtures
and
equipment Total
Acquisition cost:
At 31 December 2016 28.8 1.6 30.4
Additions 1.0 1.0
Disposals/change (1.8) (1.8)
At 31 December 2017 28.0 1.6 29.6
Disposals/change (0.1) (0.1)
At 31 December 2018 27.9 1.6 29.5
Accumulated
depreciation:
At 31 December 2016 19.9 0.3 20.2
Depreciation and
impairment for the year 2.9 2.9
At 31 December 2017 22.8 0.3 23.1
Depreciation and
impairment for the year 3.9 3.9
At 31 December 2018 26.7 0.3 27.0
Book value:
At 31 December 2016 8.9 1.3 10.2
At 31 December 2017 5.2 1.3 6.5
At 31 December 2018 1.2 1.3 2.5

Annual report 2018 - Norwegian Property ASA
Annual accounts of the parent company Side 53
NOTE 6: Equity
6.1 - Change in equity Changes in the balance sheet items for equity are spec-ified in the table below.
1 The company had a share capital amounting to NOK 274 233 416 at 31 December 2018, consisting of 548 466 832 shares with a face value of NOK 0.50
The holding of treasury shares by the end of 2018 is 21 236 shares. There have been no changes during the year.
6.2 - The company’s largest shareholders at 31 De-cember
2018:
(Amounts in NOK
million)
Share
capital1
Share
premium
Other
paid-in
equity
Total
equity
Equity at 31
December 2016 274.2 2 295.1 695.9 3 265.2
Paid dividend - - (120.7) (120.7)
Dividend
appropriation - - (38.4) (38.4)
Transactions with
shareholders - - (159.0) (159.0)
Loss for the year - - (256.8) (256.8)
Loss for the year - - (256.8) (256.8)
Equity at 31
December 2017 274.2 2 295.1 280.1 2 849.4
Paid dividend - - (115.2) (115.2)
Employee share
options - - 6.2 6.2
Dividend
appropriation - (38.4) - (38.4)
Transaksjoner
med aksjonærer - (38.4) (109.0) (147.4)
Loss for the year - (37.3) (171.1) (208.4)
Loss for the year - (37.3) (171.1) (208.4)
Equity at 31
December 2018 274.2 2 219.3 - 2 493.5

Annual report 2018 - Norwegian Property ASA
Annual accounts of the parent company Side 54
2017:
6.3 - Shares held by senior executive officers and di-rectors at 31 December 2018
1 Cecilie Astrup Fredriksen, Kathrine Astrup Fredriksen and Lars Erich Nilsen are affiliated with Geveran Trading Co Ltd, which was the larg-est shareholder in Norwegian Property ASA at 31 December 2018. Geveran Trading Co Ltd owns 326 468 339 shares in Norwegian Prop-erty, which represent 59.53 per cent of the issued shares in the com-pany. 2 Kjell Sagstad is affiliated with Niam V Prosjekt AS, which owns 67 437 425 shares in Norwegian Property at 31 December 2018, rep-resenting 12.30 per cent of the issued shares in the company. 3 At year-end 2018, 100 000 shares were owned by Max Eiendom AS and 211 556 shares by Camvecti Holding AS. Both companies are 100 per cent owned by Bjørn Henningsen. 4 At year-end 2018, 55 000 shares were owned by Yanka AS. The com-pany is 100 per cent owned by Bent Oustad.
5 Board member Carl Erik Krefting owns or controls no shares directly in Norwegian Property ASA at the end of 2018, but via the wholly owned company Carucel Holding AS has a TRS agreement relating to 4 326 842 shares with a term to 24 January 2020 and redemption price of NOK 10.80 per share.
6.4 - Share options Share options had been granted to the CEO and one di-rector (Carl Erik Krefting) of the company at 31 Decem-ber 2018. Each share option entitles the holder to sub-scribe for a share in Norwegian Property ASA.
The fair value of the options is calculated at the time of allocation and expensed over the vesting period. The following amount has been recognised against equity in relation to employee options at 31 December.
The option agreement with the CEO was entered into in 2017 and entitles him to subscribe for a total of 5 750 000 shares as follows.
The options will lapse if they are not exercised by 1 July 2022. As an alternative to delivering shares, the board of Norwegian Property may opt to settle the profit in
Employee options
Number of
options
Weighted
average
excercice
price (NOK)
Outstanding 1 January 2017 - -
Awarded 5 750 000 12.54
Exercised - -
Terminated - -
Outstanding 31 December 2017 5 750 000 12.54
Earned - -
Outstanding 1 January 2018 5 750 000 12.54
Awarded 500 000 11.50
Exercised - -
Terminated - -
Outstanding 31 December 2018 6 250 000 12.46
Earned 1 January 2019 1 166 666 10.21
Employee options 2018 2017
Recognised against equity at 1
January - -
Recognised in profit and loss
during the period 6.2 -
Recognised against equity at 31
December 6.2 -
Earliest exercise date No. of shares Subscr. price (NOK)
01.01.2019 1 000 000 10.00
01.01.2020 1 250 000 11.50
01.01.2021 1 500 000 12.50
01.01.2022 2 000 000 14.50

Annual report 2018 - Norwegian Property ASA
Annual accounts of the parent company Side 55
cash. The agreement otherwise contains normal condi-tions on such matters as continued employment and ad-justment of share prices and so forth as a result of cor-porate events.
The total fair value of share options granted in 2017 was NOK 11.2 million (excluding the employer’s National In-surance contribution). The fair value is calculated by ex-ternal valuers based on the Black-Scholes model. In cal-culating fair value, volatility in the period was set at 27.43 per cent and the risk-free interest rate at 0.97 per cent. The weighted average vesting period for the share options granted is 2.8 years. The share price at the grant date was NOK 10.45.
The option agreement with the director was entered into in 2018 and entitles him to subscribe for a total of 500 000 shares as follows.
The options will lapse if they are not exercised by 19 Oc-tober 2021. As an alternative to delivering shares, the board of Norwegian Property may opt to settle the profit in cash. The agreement otherwise contains condi-tions on such matters as continued service as a director during the vesting period and adjustment of share prices and so forth as a result of corporate events.
The total fair value of share options granted in 2018 was NOK 0.9 million (excluding the employer’s National In-surance contribution). The fair value is calculated by ex-ternal valuers based on the Black-Scholes model. In cal-culating fair value, volatility in the period was set at 26.76 per cent and the risk-free interest rate at 1.21 per cent. The weighted average vesting period for the share options granted is two years. The share price at the grant date was NOK 10.24.
NOTE 7: Other current liabilities
Other current liabilities at 31 December are specified in the table below.
NOTE 8: Interest-bearing debt
The table below presents an overview at 31 December of the company’s interest-bearing debt, including hedg-ing ratio, average interest rate and remaining duration.
1 All interest rate swaps that have started on the balance sheet date.
The company’s interest-bearing long-term and short-term debt at 31 December is specified in the table be-low.
2018:
2017:
Earliest exercise date No. of shares Subscr. price (NOK)
01.01.2019 166 666 11.50
01.01.2020 166 667 11.50
01.01.2021 166 667 11.50
(Amounts in NOK million) 2018 2017
Public duties 3.6 4.3
Accrued salaries 6.5 4.2
Accrued interest 59.2 46.2
Trade payables 2.3 2.2
Other payables 13.4 13.9
Total other current liabilities 84.9 70.8
2018 2017
Interest-bearing debt (NOK million) 7 265.4 7 012.5
- of which hedged (NOK million)1 4 350.0 4 350.0
Interest hedging ratio (per cent) 59.9 62.0
Cash and cash equivalents (NOK million) 42.3 5.9
Unutilised credit facilities (NOK million) 650.0 900.0
Average interest rate (per cent) 3.62 3.48
Average interest margin (per cent) 1.38 1.39
Remaining time to maturity for interest-
bearing debt (years) 2.3 3.3
Remaining time to maturity for interest
hedge agreements (years) 4.2 3.9
(Amounts in NOK million) Long-term Short-term Total
Bank borrowings - 2 354.1 2 354.1
Bonds 4 505.0 350.0 4 855.0
Intercompany balances 70.0 - 70.0
Total interest-bearing debt 4 575.0 2 704.1 7 279.1
Capitalised borrowing cost (5.1) (8.6) (13.7)
Total book value interest-bearing debt 4 569.9 2 695.5 7 265.4
(Amounts in NOK million) Long-term Short-term Total
Bank borrowings 2 333.2 8.7 2 341.9
Bonds 4 625.0 - 4 625.0
Intercompany balances 70.0 - 70.0
Total interest-bearing debt 7 028.2 8.7 7 036.9
Capitalised borrowing cost (24.3) (24.3)
Total book value interest-bearing debt 7 003.8 8.7 7 012.5

Annual report 2018 - Norwegian Property ASA
Annual accounts of the parent company Side 56
Eight bonds totalling NOK 4 855 million were outstand-ing at 31 December 2018. The bonds are due as follows: NOK 350 million in 2019, NOK 1 735 million in 2020, NOK 1 800 million in 2022 and NOK 970 million in 2024. All bonds are secured by properties and are listed on Oslo Børs.
At 31 December 2018, the credit facilities consisted of bank facilities with a total remaining borrowing limit of NOK 3 001.1 million, which included an overdraft facility of NOK 100 million. The main facilities mature in March 2019 and December 2019 respectively. Drawings are se-cured by two separate property portfolios. Amounts drawn from the bank facilities at 31 December 2018 to-talled NOK 2 341.9 million, while an additional NOK 650 million takes the form of unused credit limits. The key terms for the bank facilities are as follows.
- Interest: NIBOR plus margin. - Interest rate hedging: Minimum 50 and 60 per
cent respectively with an average duration of at least three years.
- Financial covenants: The company must com-ply with agreed senior interest cover and loan-to-value (LTV) thresholds. The agreed senior in-terest cover at 31 December 2018 is a mini-mum interest cover ratio of 1.4 and an agreed LTV ratio for the two main facilities of less than 75 and 78 per cent respectively.
- Other covenants: Negative pledge, restrictions on granting loan guarantees and change of con-trol.
- Security: Secured by pledges on properties and priority pledges on subsidiary shares/interests and intercompany loans. No significant bank guarantees have been issued on behalf of the parent company.
Agreed requirements in the loan agreements were met at 31 December in both 2017 and 2018.
The maturity of the company’s long-term interest-bear-ing debt at 31 December is specified in the table below.
The book value of assets pledged as security for debt at 31 December is as follows:
1 The shares of property companies owned by other group entities are also pledged as security for corporate facilities in Norwegian Property ASA. See also note 15 in the group’s annual accounts. 2 Properties owned by subsidiaries have been pledged as security for bonds.
NOTE 9: Derivatives
9.1 - Derivatives in the annual accounts The company is exposed to interest rate risk related to loans with floating interest rates, and to reduce inter-est rate risk, interest rate hedging agreements are en-tered into. Unrealized gains/losses associated with such agreements are recognized in the income state-ment.
The fair value of derivatives is determined by the net present value of future cash flows, calculated using quoted interest rate curves and exchange rates at the balance sheet date. The technical calculations are gen-erally prepared by banks. The company has checked and tested the valuation for reasonableness. Fair value of the company’s derivatives at 31 December is speci-fied in the table below.
2018:
2017:
9.2 - Interest rate derivatives Most of Norwegian Property’s floating rate loans are hedged with interest rate hedge contracts. Norwegian Property has a policy of hedging a minimum of 70 per cent of the interest-bearing debt outstanding. Despite the hedging positions, the company’s financial assets and cash flow will be exposed to fluctuations in the short-term interest rate. Because of these fluctuations, the interest rate cost will vary. Notional principal
(Amounts in NOK million) 2018 2017
Due in 2019 and 2020 (2018 and 2019) 4 439.1 4 418.2
Due in 2021, 2022 and 2023 (2020,
2021 and 2022) 1 800.0 1 570.0
Due after 2023 (after 2022) 1 040.0 1 040.0
Total 7 279.1 7 028.2
(Amounts in NOK million) 2018 2017
Investment in subsidiaries1 8 727.4 8 981.5
Total 8 727.4 8 981.5
Liabilities secured2 2 354.1 2 341.9
(Amounts in NOK million) Eiendeler Gjeld
Interest rate contracts 8.3 164.8
(Amounts in NOK million) Eiendeler Gjeld
Exchange rate contracts 0.4 -
Interest rate contracts 2.3 233.6

Annual report 2018 - Norwegian Property ASA
Annual accounts of the parent company Side 57
amounts for the company’s interest rate hedges at 31 December are specified in the table below. The ma-turity is specified in note 3.
NOTE 10: Payroll costs and remuneration of executive officers and auditor
The payroll cost for the year is as follows:
Pursuant to the Norwegian Act on Mandatory Occupa-tional Pensions, Norwegian Property ASA must operate certain pension plans. The company has plans which satisfy these requirements. Norwegian Property ASA operates a defined contribution plan for all employees.
Remuneration to the auditor is specified in the table below1:
1 Fees to PricewaterhouseCoopers AS (PwC) and affiliated companies. The fees are net of VAT (amounts in NOK).
Fees paid to directors in 2018 are presented in the ta-ble below:
1 Paid benefits in 2018 (amounts in NOK). In addition, employer’s Na-tional Insurance contributions (14.1 per cent).
Remuneration of senior management in 2017 is speci-fied in the table below:
1 Paid benefits in 2017 (amounts in NOK). In addition, employer’s Na-tional Insurance contributions (14.1 per cent).
(Amounts in NOK million) 2018 2017
Notional principal amount 5 670.0 6 025.0
(Amounts in NOK million) 2018 2017
Salaries and remuneration 56.8 55.9
Employee share option sheemes 6.2 0.0
Social security costs 8.6 7.9
Pension costs (defined contribution
plan) 2.3 2.3
Other employee expenses 1.9 2.2
Total payroll costs 75.8 68.3
Number of employees at 31
December 43 43
Number of full-time equivalent
positions in the fiscal year 44 43
Average number of employees in the
fiscal year 43 47
Type of fees 2018 2017
Statutory audit 365 421 620 919
Other certification services 195 000 38 750
Tax/VAT advice 226 260 278 999
Total 786 681 938 668

Annual report 2018 - Norwegian Property ASA
Annual accounts of the parent company Side 58
Remuneration of senior management in 2018 is specified in the table below:
1 Paid benefits in 2018 (amounts in NOK). In addition, employer’s National Insurance contributions (14.1 per cent). 2 Paid relating to defined contribution pension plans and employee insurances in 2018 (amounts in NOK).
Remuneration of senior management in 2017 is specified in the table below:
1 Paid benefits in 2017 (amounts in NOK). In addition, employer’s National Insurance contributions (14.1 per cent). 2 Paid relating to defined contribution pension plans and employee insurances in 2017 (amounts in NOK). 3 Svein Hov Skjelle resigned as CEO and CFO at the end of 2017. In 2018, a severance payment of NOK 3 700 000 is paid, as well as earned bonuses of NOK 750 000 and holiday payments of NOK 401 314.
NOTE 11: Net financial items
Net financial items for the year are as follows:
(Amounts in NOK million) 2018 2017
Financial income:
Interest income from group companies 3.1 5.0
Changes in value of financial derivative
instruments 74.5 105.5
Other interest income 0.0 0.0
Total financial income 77.6 110.5
Financial expenses:
Loss on sale of shares in subsidiaries (1.7) -
Interest costs to group companies (1.7) (2.0)
Interest costs loans (227.1) (263.1)
Termination of financial derivative
instruments (3.5) (58.2)
Other financial expenses (17.8) (28.5)
Total financial expenses (251.7) (351.8)
Net financial items (174.1) (241.3)

Annual report 2018 - Norwegian Property ASA
Annual accounts of the parent company Side 59
NOTE 12: Deferred tax and income tax
The tax expense for the year in the income statement and deferred taxes in the balance sheet is as follows:
1 The corporate tax rate in Norway was reduced from 23 per cent to 22 per cent at the start of 2019. Deferred tax by year-end 2018 is therefore calculated based on a tax rate of 22 per cent. Equivalent the corporate tax rate was reduced from 24 per cent to 23 per cent at the start of 2018. Deferred tax by year-end 2017 is therefore calcu-lated based on a tax rate of 23 per cent.
NOTE 13: Related-party disclosures
All transactions, agreements and business relationships with related parties are made on normal commercial terms. Financial relationships related to the board and senior management are described in note 6 and note 10. Income statement and balance sheet items related to group companies are specified in the table below.
NOTE 14: Contingent liabilities
Norwegian Property ASA has no substantial contingent liabilities through guarantees or other circumstances related to the ordinary course of business.
NOTE 15: Events after the balance sheet date
Events after the balance sheet date are events, favour-able or unfavourable, that occur between the balance sheet date and the date that the financial statements are authorised for issue. Such events can be events that provide information of conditions that existed at the balance sheet date, resulting in adjustments in the financial statements, or events that do not require such adjustments.
There are no other significant events after 31 Decem-ber 2018 which provide information of conditions that existed at the balance sheet date.
(Amounts in NOK million) 2018 2017
The tax expense for the year is
distributed as follows:
Tax payable - -
Changes in deferred tax (25.3) (40.5)
Income tax expense (25.3) (40.5)
Calculation of the tax base for the year:
Profit before tax (233.8) (297.3)
Permanent differences 8.7 1.2
Changes in temporary differences (73.9) (415.5)
Group contribution 330.0 -
Tax base for the year 31.1 (711.6)
Specification of temporary differences
and deferred tax:
Tangible assets (12.2) (9.6)
Financial derivative instruments (156.5) (230.9)
Provisions (2.2) (4.2)
Tax loss carried forward (2 473.1) (2 504.2)
Basis for deferred tax (2 643.9) (2 748.9)
Deferred tax in the balance sheet 581.7 632.2
Reconciliation of tax expense and
calculated effective tax rate:
Calculated tax expense on profit before
tax (23 per cent for 2018 and 24 per cent
for 2017) (53.8) (71.3)
Effect on the ending balance for
deferred tax by change of tax rate1 26.4 30.6
Permanent differences 2.0 0.3
Income tax expense (25.3) (40.5)
Effective tax rate (per cent) 10.8 13.6
(Amounts in NOK million) 2018 2017
Income statement:
Management and service fee, group companies 46.7 42.8
Rental cost, subsidiaries (3.8) (3.6)
Interest income from group companies (note 11) 3.1 5.0
Interest costs to group companies (note 11) (1.7) (2.0)
Balance sheet:
Investments in subsidiaries (note 4) 8 727.4 8 981.5
Non-current assets, intercompany balances 465.3 135.7
Current assets, intercompany balances 217.0 -
Non-current liabilities, intercompany balances 70.0 70.0

Annual report 2018 - Norwegian Property ASA
Declaration by the board of directors and the CEO Page 60
Declaration by the board of directors and the CEO
The board and the chief executive have today considered and approved the directors’ report and the annual consolidated
and parent company financial statements for Norwegian Property ASA at 31 December 2018. The consolidated financial
statements for the year have been prepared in accordance with the IFRS as approved by the EU and associated interpre-
tative statements, and the additional Norwegian information requirements pursuant to the Norwegian Accounting Act
and which were to be applied at 31 December 2018. The parent company financial statements for the year have been
prepared in accordance with the Norwegian Accounting Act and Norwegian generally accepted accounting standards at
31 December 2018. The directors’ report for the group and the parent company accord with the requirements of the
Accounting Act and good Norwegian accounting practice (NRS 16 directors’ report) at 31 December 2018.
To the best of our knowledge, we hereby confirm that:
• The consolidated and parent company financial statements for 2018 have been prepared in accordance with appli-
cable accounting standards.
• The information in the financial statements provides a true and fair picture of the overall assets, liabilities, financial
position and financial results of the parent company and the group at 31 December 2018.
• The directors’ report for the group and the parent company provides a true and fair view of the development, finan-
cial results and position of the group and the parent company, and of the most important risk factors and uncertain-
ties facing the group and the parent company.
Oslo, 11 March 2019
Norwegian Property ASA

Annual report 2018 - Norwegian Property ASA
Independent auditors report Side 61
Independent auditors report

Annual report 2018 - Norwegian Property ASA
Independent auditors report Side 62

Annual report 2018 - Norwegian Property ASA
Independent auditors report Side 63

Annual report 2018 - Norwegian Property ASA
Independent auditors report Side 64

Annual report 2018 - Norwegian Property ASA
Independent auditors report Side 65

Annual report 2018 - Norwegian Property ASA
Independent auditors report Side 66

Annual report 2018 - Norwegian Property ASA
Key figures Side 67
Key figures
The table below shows a summary of key accounting figures and financial key figures1 for the group.
1 Figures not derived directly from the accounts are explained in the list of definitions at the end of this report. When calculating key figures per share related to profit and cash flow, the numbers are divided by the average number of shares in the period, while key figures per share related to the balance sheet are divided by the number of shares at the end of the period.
Profit and loss 31.12.18 31.12.17
Revenues NOK mill. 798.9 784.3
Operating profit before admin expenses NOK mill. 661.4 660.3
Operating profit before value adjustments NOK mill. 604.6 606.6
Profit before income tax and value adjust NOK mill. 345.0 316.8
Profit before income tax NOK mill. 577.4 1 407.0
Profit after income tax NOK mill. 490.6 1 348.7
Balance sheet 31.12.18 31.12.17
Market value of property portfolio NOK mill. 15 590.9 15 360.5
Total equity NOK mill. 8 002.8 7 654.8
Interest-bearing debt NOK mill. 7 833.4 6 950.4
Equity ratio Per cent 46.9 49.1
Pre-tax return on equity Per cent 7.4 19.9
Cash flow 31.12.18 31.12.17
Net cash flow from operating activities NOK mill. 419.7 234.6
Cash and cash equivalents NOK mill. 124.6 89.2
Key figures; per share 31.12.18 31.12.17
Number of shares issued, end of the period Number 548 425 596 548 425 596
Average number of shares in the period Number 548 425 596 548 425 596
Profit before income tax NOK 1.05 2.57
Earnings per share (EPS) NOK 0.89 2.46
Net cash flow from operating activities NOK 0.77 0.43
Interest-bearing debt NOK 14.28 12.67
NAV, book value NOK 14.59 13.96
Deferred property tax NOK 1.19 1.12
Fair value of fin. derivative instruments NOK 0.22 0.32
NAV, adjusted NOK 16.01 15.40
Fair value of deferred tax NOK (0.62) (0.52)
Fair value of fin. derivative instruments NOK (0.26) (0.38)
Fair value of debt NOK - (0.03)
NNNAV NOK 15.13 14.47

Annual report 2018 - Norwegian Property ASA
Corporate governance Page 68
Corporate governance
The object of corporate governance for Norwegian Property is to secure a clear and appropriate division of roles between shareholders, the board of directors and the executive management, and reassuring control of the company. An appropriate division of roles and reas-suring control will contribute to the highest possible value creation over time to the benefit of the owners and other stakeholders. A goal is that good corporate governance will contribute to a positive trust-based re-lationship between Norwegian Property and the com-pany’s shareholders and other stakeholders.
Presentation on corporate governance
Norwegian Property observes the reporting require-ments specified in section 33b of the Norwegian Ac-counting Act. As a listed company, it also complies with the stock exchange recommendation of 1 March 2017, available on the Oslo Børs website, and the latest ver-sion of the code of practice from the Norwegian Corpo-rate Governance Board (NCGB), published in October 2018. The code is available on the NCGB website at www.nues.no. These recommendations go beyond the legal requirements.
The board’s presentation of the way Norwegian Prop-erty has implemented the applicable Norwegian code of practice for corporate governance of 17 October 2018 is set out below. Reference is made to this presentation in the directors’ report for 2018, and it is available on the company’s website. The presentation covers each sec-tion of the code, and possible variances from the code are specified under the relevant section.
Overall principles for corporate governance have been drawn up by the board of Norwegian Property. The board has also prepared a set of formal documents which specify guidelines, instructions and policies in-tended to ensure compliance in practice with good cor-porate governance. The board regularly assesses the company’s formal documents, most recently in October 2018. Guidelines for ethics and corporate social respon-sibility (CSR) as well as principles for investor communi-cation are available at http://www.npro.no under “for-mal documents”.
The group’s values base defines important principles for corporate governance. This base rests on four core val-ues, which form the foundation for building a positive corporate culture:
COLLABORATIVE - We will be open and inclusive - We will be generous and make ourselves avail-
able - We will have a personal commitment
COURAGEOUS
- We will think innovatively - We will be ambitious - We will challenge established truths
PROACTIVE
- We will always seek to overcome problems be-fore they arise
- We will seek and see new opportunities - We will present new ideas
ATTENTIVE
- We will create and retain relationships - We will do what we promise
Business
Norwegian Property’s articles of association are availa-ble on its website. Enshrined in article 3, the company’s business purpose states:
“The company operates in management, acquisitions, sales and development of commercial real estate, in-cluding participation in other companies as well as busi-nesses which are related to such”.
Within the framework of its articles, the company has presented goals and strategies for its business in the di-rectors’ report.
The board has formulated guidelines for ethics and CSR in accordance with the group’s values base. Norwegian Property’s guidelines are available at www.npro.no. The core of the CSR guidelines is the company’s responsibil-ity for the people, society and environment affected by its operations, and they deal among other considera-tions with human rights, anti-corruption, labour condi-tions, health and safety, discrimination and environ-mental aspects. More details are provided in the presen-tation on CSR. These guidelines are subject to annual consideration by the board and were updated most re-cently in October 2018.

Annual report 2018 - Norwegian Property ASA
Corporate governance Side 69
Equity and dividends
Equity Consolidated equity at 31 December 2018 totaled NOK 8 002.8 million. The equity ratio at the same date was 46.9 per cent. The board regards the equity ratio as sat-isfactory in relation to the group’s goals, strategy and risk profile.
To secure good financial freedom of action, the com-pany has a long-term ambition that the relationship be-tween net interest-bearing debt and gross fair value of the properties will be in the range of 45-55 per cent over a business cycle. The company’s financial flexibility is as-sessed at any given time in relation to the company’s goals, strategy and risk profile. At 31 December 2018, the relationship between net interest-bearing debt and gross fair value (net loan to value - LTV) was 47.3 per cent.
Dividend Pursuant to the company’s dividend policy, a goal for Norwegian Property is to pay competitive quarterly div-idends. It aims to pay a dividend of 30-50 per cent of its profit after tax payable, but before fair-value adjust-ments. The dividend can be higher in times of good cash flow or property sales. An independent assessment of the group’s financial position and prospects will be car-ried out before a dividend is determined.
Dividends corresponding to 44.5 per cent of the basis for calculating such payments have been paid for 2018. The board has been mandated by the general meeting to de-termine quarterly dividends on the basis of the ap-proved financial statements for 2017. Although net LTV is somewhat below target, retaining funds for new in-vestment has been felt to desirable. The property mar-ket is also considered to be experiencing a boom at pre-sent, which makes it appropriate stay in the lower part of the measurement scale for LTV.
The dividend policy is also described in note 24 to the consolidated financial statements in this annual report and in the investor relations section of the company’s website.
Board mandates The AGM of 19 April 2018 mandated the board to in-crease the company’s share capital by up to NOK 27 420 000, corresponding to just under 10 per cent of the com-pany’s share capital when the mandate was awarded. The board mandate is motivated by the desire to be in a position to issue new shares in return for cash payment,
as settlement for property transactions, and/or as a component in fulfilling incentive schemes for employees and/or directors. As a consequence of these purposes, it was also resolved that the board could decide to waive the pre-emptive right of existing shareholders to new shares. In line with the NCGB code, a separate vote was held on each of the three purposes. This mandate had not been utilised at 31 December 2018.
In addition, the board was mandated to raise converti-ble loans totalling NOK 750 000 000. This was because the board wanted to have the opportunity to issue new shares in combination with additional debt, partly in or-der to optimise the financing structure in Norwegian Property ASA. This mandate had not been utilised at 31 December 2018.
It was also resolved that the board’s overall use of man-dates to issue new shares awarded to it by the AGM should not exceed 10 per cent of the share capital.
The board was also mandated to purchase the com-pany’s own shares up to a total nominal value of NOK 27 420 000. The grounds were that the board could ac-quire the company’s own shares with the intention of using them as settlement for property transactions, ful-filment of incentive scheme for employees and/or direc-tors, and/or in other circumstances which are consid-ered attractive for the shareholders in general. In this case, too, separate votes were held for each purpose. Norwegian Property made no purchases of its own shares during 2018.
The board was mandated to determine the payment of dividend on the basis of the company’s financial state-ments for 2017. This decision was motivated by the de-sire to give the board the opportunity to pay dividend on a rolling basis if it considered this to be appropriate in light of the company’s position. Norwegian Property paid a quarterly dividend of NOK 0.07 per share during 2018.
All board mandates remain valid until the company’s AGM in 2019, but in any event not beyond 30 June 2019.
No provisions in the articles of association authorise the board to decide that the company will buy back or issue its own shares or primary capital certificates.

Annual report 2018 - Norwegian Property ASA
Corporate governance Side 70
Equal treatment of shareholders and transac-tions with close associates
Norwegian Property has only one share class, and all shares have equal rights in the company. Its articles of association impose no voting restrictions.
No share issues were conducted by Norwegian Property in 2018. Pursuant to the code, the reasons for waiving the pre-emptive right of existing shareholders must be published in a stock exchange announcement in connec-tion with a capital increase. The board will endeavour to comply with this point should such circumstances arise in the future.
Norwegian Property did not purchase or sell any of its own shares in 2018. Possible future transactions will be conducted on the stock exchange or in another manner at the stock market price.
The board and the executive management are con-cerned to ensure equal treatment of all the company’s shareholders and that transactions with close associates (related parties) take place on an arm’s length basis. Note 25 to the consolidated financial statements details transactions with close associates (related parties). Fi-nancial relationships related to the directors and execu-tive personnel are described in notes 21 and 22.
Freely negotiated shares
Shares in Norwegian Property are freely tradable on Oslo Stock Exchange (Oslo Børs). No restrictions on the negotiability of the shares are imposed by the articles of association.
The board considers good liquidity of the share to be im-portant for Norwegian Property to be regarded as an at-tractive investment, and the company works actively to attract interest from the investor market.
General meetings
Notice, registration and participation The board makes provision for as many as possible of its shareholders to exercise their rights by attending the general meeting. The 2019 AGM is scheduled to take place on 11 April. The company’s financial calendar is published as a stock exchange announcement and in the investor relations section of the company’s website.
Notice of the general meeting, with comprehensive doc-umentation including the recommendations of the nomination committee, is made available to sharehold-ers on the company’s website no later than 21 days be-fore a meeting takes place. Shareholders who want the attachments sent by post can apply to the company for this to be done. The documentation must contain all the information required for the shareholders to form a view on every item to be considered. Shareholders wish-ing to attend the general meeting must indicate this in-tention by the specified deadline. The deadline for reg-istering attendance is set as close to the meeting as pos-sible, normally two days in advance.
Proxy form and advance voting Notices with documentation are made available on the company’s website immediately after the documenta-tion has been issued as a stock exchange announce-ment. General-meeting notices provide information on the procedures to be observed for attendance and vot-ing, including the use of proxies. Shareholders who can-not attend in person are encouraged to appoint a proxy. A proxy form, where a proxy has been named, is framed in such a way that the shareholder can specify how the proxy should vote on each issue to be considered. The notices have included information on the right to raise issues for consideration at the general meeting, includ-ing the relevant deadlines.
Chairing meetings, elections, etc. The general meeting is opened by the chair of the board or the person appointed by the board, and the chair of the meeting is elected by the meeting. The company has not drawn up specific routines to ensure that the chair of the meeting is independent, but experience with the chairing and conduct of the general meetings has been good. Representatives of the company’s board and ex-ecutive management are encouraged to attend. The same applies to the nomination committee at those meetings where the election and remuneration of direc-tors and members of the nomination committee are to be considered. The company’s auditor is present at the AGM.
The general meeting elects the members of the nomina-tion committee as well as the shareholder-elected direc-tors on the board. In its work, the nomination commit-tee gives emphasis to ensuring that the board functions optimally as a collective body, that legal requirements for gender representation can be met, and that the di-rectors complement each other in terms of their back-ground and expertise. The general meeting is therefore normally invited to vote for a complete board, rather

Annual report 2018 - Norwegian Property ASA
Corporate governance Side 71
than individual candidates as recommended by the NCGB. As a result, no opportunity has been provided to vote in advance for individual candidates.
Minutes from a general meeting are published as soon as practicable via the stock exchange’s reporting system (www.newsweb.no, ticker code: NPRO) and under “for-mal documents” in the investor relations section of the company’s website.
Nomination committee
The company’s articles of association call for the ap-pointment of a nomination committee. Pursuant to the articles, the nomination committee will comprise two or three members. Its composition must take account of the interests of shareholders in general. The committee is independent of the board and the executive manage-ment, and otherwise composed pursuant to the code.
Members of the nomination committee and its chair are elected by the general meeting for two-year terms, and their remuneration is determined by the general meet-ing. The work of the nomination committee is regulated by specific guidelines, which are adopted by the AGM.
The nomination committee nominates directors. Efforts are made to base its recommendations on contacts with directors and the CEO. In addition, the committee seeks to consult relevant shareholders to obtain suggestions for candidates as well as to entrench its recommenda-tions. The committee also recommends the remunera-tion of directors. Its recommendations with reasons are made available via the company’s website before the election and as soon as they are available. The nomina-tion committee is encouraged to attend the general meetings in order to present and justify its recommen-dations and to answer questions.
The present nomination committee was elected at the AGM of 19 April 2018 and comprises Marianne Johnsen and Robin Bakken. Bakken has served as chair since 13 April 2016. No regular directors or executive personnel are represented on the nomination committee. Dead-lines for submitting nominations to the nomination committee are published on the company’s website. The deadline for submitting nominations to the nomina-tion committee ([email protected]) for consideration by the 2019 AGM was 1 March 2019.
Board of directors, composition and inde-pendence
The company does not have a corporate assembly. Pur-suant to the articles of association, the board of Norwe-gian Property will comprise three to nine directors. The board currently has seven shareholder-elected direc-tors. Directors and the chair of the board have been elected by the general meeting until the AGM in 2019. See the provisions of the Public Limited Liability Compa-nies Act. The board’s composition is intended to secure the interests of the shareholders in general, while the directors also collectively possess a broad business and management background and an in-depth understand-ing of the property market, purchase and sale of busi-nesses, financing and capital markets. In addition, ac-count has been taken of the need for the board to func-tion well as a collegiate body. The background and ex-perience of directors are presented on the company’s website and on page 15 of this annual report. The board has been composed in such a way that it can act inde-pendently of special interests. The company’s executive management is not represented on the board.
Two of the seven directors are independent of the com-pany’s executive management, significant commercial partners and substantial shareholders, while four are re-lated to substantial shareholders and one has an option agreement and an agreement to provide support to the company over and above regular board work. These are:
- Cecilie Astrup Fredriksen is an employee of Seatankers Management Co Ltd in London, and a director of a number of companies – includ-ing Mowi ASA and Ship Finance International Ltd. These companies are related parties to the largest shareholder in Norwegian Property, Geveran Trading Co Ltd.
- Kathrine Astrup Fredriksen is an employee of Seatankers Management Co Ltd in London, and a director of Seadrill Ltd. She has previously been a director of Frontline Ltd, Golar LNG and others. These companies are related parties to the largest shareholder in Norwegian Property, Geveran Trading Co Ltd.
- Lars Erich Nilsen has been employed by Seatankers Management Norway AS since 2014. This company is a related party to the largest shareholder in Norwegian Property, Geveran Trading Co Ltd.
- Kjell Sagstad is senior director of Niam and head of the company’s Norwegian business. A

Annual report 2018 - Norwegian Property ASA
Corporate governance Side 72
company managed by Niam has a substantial shareholding in Norwegian Property.
- Carl Erik Krefting has an option agreement with Norwegian Property and has also entered into an agreement to support the company in as-signments over and above regular board work. He is also the owner of Carucel Holding AS, which has entered into a total return swap (TRS) agreement for 4 326 842 shares in Nor-wegian Property.
Ten board meetings were held in 2018.
Work of the board of directors
The board has overall responsibility for managing the group and for supervising the CEO and the group’s activ-ities. Its principal tasks include determining the com-pany’s strategy and monitoring its operational imple-mentation. In addition come control functions which en-sure acceptable management of the company’s assets. Instructions which describe the rules of procedure for the board’s work and its consideration of matters have been adopted by the board. Responsibility for ensuring that the board conducts its work in an efficient and cor-rect manner rests with the chair.
The board establishes an annual plan for its meetings and evaluates its work and expertise once a year. The annual plan specifies topics for board meetings, includ-ing reviewing and following up the company’s goals and strategy, budgets, reporting of financial information, the notice for the general meeting with associated docu-mentation, and the board’s meeting with the auditor.
The board appoints the CEO. The division of labour be-tween the board and the CEO is specified in greater de-tail in standing instructions for the latter. The CEO is re-sponsible for the company’s executive management.
The board has considered it appropriate to appoint sub-committees to advise it. Pursuant to the Norwegian Public Limited Liability Companies Act, an audit commit-tee of three directors has been established to support the board in the exercise of its responsibility for financial reporting, internal control, auditing and overall risk management. At 31 December 2018, the committee comprised Bjørn Henningsen (chair), Kjell Sagstad and Lars Erich Nilsen. Members of the committee are inde-pendent of the business, and their work is governed by a separate instruction. A compensation committee com-prising two directors has also been established to assist the board over the employment terms of the CEO and
the strategy and main principles for remunerating the company’s senior executives. This committee com-prised Merete Haugli and Carl Erik Krefting at 31 Decem-ber 2018. It is again governed by a separate instruction and consists of members who are independent of the company’s executive management.
Once a year, the board evaluates its own work and that of the CEO and reports its findings to the nomination committee.
Guidelines on conflicts of interest are included in the in-structions for the company’s board of directors and en-sure that directors inform the board if they have a sig-nificant direct or indirect interest in an agreement being entered into by the company. To avoid unintentional conflicts of interest, the company has drawn up an over-view which identifies the various roles of its directors, the offices they hold and so forth. This overview is up-dated as and when required and in the event of changes in the board’s composition.
Pursuant to the company’s ethical guidelines, no em-ployee must work on matters in which they have a per-sonal interest or where such an interest could be per-ceived to exist.
Risk management and internal control
Risk areas and internal control environment Through its business activities, Norwegian Property manages considerable financial assets which are ex-posed to substantial risk factors, such as the money market and the letting market. The group’s manage-ment model is based on an appropriate delegation of profit responsibility, clearly defined operating parame-ters and effective internal control.
Overall goals have been established and the company’s strategy is updated continuously. On the basis of this strategy, the values base and the ethical guidelines, overall instructions have been established for the board which specify authorisations for delegating responsibil-ity to defined roles in the organisation. Policies have fur-thermore been established for control and risk manage-ment in the most important risk areas, such as opera-tions and finance.
Operational risk relates to the award of contracts and renegotiation of leases, which are followed up in accord-ance with established guidelines and authorisations. Operational risk related to property management is

Annual report 2018 - Norwegian Property ASA
Corporate governance Side 73
handled through routines for day-to-day operation, compliance and HSE work. Financial risk is managed in accordance with the company’s financial strategy.
The board is responsible for seeing to it that the enter-prise, financial reporting and asset management are subject to reassuring controls. Based on the overall pol-icies, governing processes and routines have been es-tablished for day-to-day management. The board re-views the company’s formal documents annually. In connection with its annual review of the company’s strategy, the board reviews the most important risk ar-eas faced by Norwegian Property and the internal con-trols established to deal with and minimise these. The board is also briefed on developments in the risks facing the company on a continuous basis through the operat-ing reports.
Reporting The administration prepares periodic operating reports which are considered at the board meetings. These re-ports are based on management reviews of the various parts of the business and contain an update of the status for setting targets, important operational conditions, fi-nancial conditions and a description of the status in risk areas. In addition, quarterly financial reports are pre-pared and reviewed by the audit committee ahead of the board meeting.
Financial conditions are followed up through periodic accounting reports and regular updates of annual budg-ets and forecasts. Reporting also includes non-financial key figures related to the various business areas. In ad-dition, risk management includes the preparation of longer-term projections of financial trends, where as-sumptions are made about profits, cash flow and bal-ance sheet development. These simulations provide management and board with a basis for monitoring ex-pected trends in central key figures.
The company is managed on the basis of financial tar-gets related to such aspects as return on equity. Special profitability calculations are made when acquiring in-vestment properties and launching development pro-jects, based on established routines and required re-turns.
A special review of the quarterly valuations of invest-ment properties is conducted by management, and meetings are held with the external players responsible for the valuations where particular attention is paid to market views and risk conditions. Separate accounting documentation is prepared for significant accounting
items and transactions which are not of a routine char-acter. External valuations of financial interest-rate deriv-atives by the banks are quality-assured through the preparation of monthly internal value assessments. All other balance sheet items are reconciled and docu-mented on a continuous basis throughout the year. Sig-nificant profit and loss accounts and accounts related to direct and indirect taxation are also reconciled on a con-tinuous basis.
The interim reports and annual financial statements are reviewed by the audit committee ahead of considera-tion by the board. Risk management and internal con-trol are also addressed by the board’s audit committee. The latter reviews the external auditor’s findings and as-sessments after the interim and annual financial audits. Signification conditions in the auditor’s report are re-viewed by the board.
Remuneration of the board of directors
Directors’ fees are determined by the general meeting on the basis of recommendations from the nomination committee. These fees have been based on the board’s responsibility, expertise and time taken as well as the complexity of the business and have not been related to results. One director has been awarded options as com-pensation for providing advisory services to the com-pany in addition to his directorship. This was resolved by the AGM in 2018. It does not accord with the NCGB code but is justified on the grounds that the director in ques-tion has special expertise and that it is in this company’s interest to utilise this expertise over and above the per-son’s regular duties as a director.
Other directors have not undertaken special assign-ments for the company other than their work on the board. They are unable to accept such assignments without approval from the board in each case.
Further details on the remuneration paid to individual directors are provided in note 21 to the consolidated fi-nancial statements. An overview of shares owned by the directors and their close associates is included in note 22 to the consolidated financial statements.
Remuneration of executive personnel
The group’s guidelines for the remuneration of senior executives are described in note 21 to the consolidated financial statements. This note also provides further de-

Annual report 2018 - Norwegian Property ASA
Corporate governance Side 74
tails about remuneration in 2018 for certain senior ex-ecutives. The guidelines are presented to the AGM as a separate item on the agenda. The declaration of man-agement benefits is posted to the company’s website under formal documents.
These guidelines specify the main principles for the company’s executive pay policy and have been framed with the aim of ensuring that the interests of sharehold-ers and senior executives coincide. The CEO, who took office at 1 January 2018, has a personal share option scheme (see note 22).
Profit-related remuneration in the form of a bonus pro-gramme is based on the attainment of goals for the group or for a department or company in which the re-cipient is employed. Such goals may comprise the attain-ment of various improvement measures or financial cri-teria, including the development of the company’s share price. A ceiling has been set on the size of profit-related remuneration for those employees entitled to receive this.
Information and communication
Through the company’s established principles for inves-tor communication, available on its website under prin-ciples and guidelines, the board has determined guide-lines for reporting financial and other information. Based on openness and equal treatment of players in the securities market, the guidelines also cover commu-nication with shareholders outside the general meet-ings.
Reporting of financial and other information will be timely and accurate, while simultaneously being based on openness and equal treatment of players in the secu-rities market. Information is published in the form of an-nual and interim reports, press releases, stock exchange announcements and investor presentations. All infor-mation considered to be significant for valuing the com-pany will be distributed and published in both Norwe-gian and English via Cision and the Oslo Børs company disclosure system, and the company’s website exists in both Norwegian and English versions.
Information is made available simultaneously on the company’s website, where it is also possible to subscribe to announcements. The main purpose of this infor-mation will be to clarify the company’s long-term goals and potential, including its strategy, value drivers and important risk factors.
The company publishes a financial calendar every year with an overview of the dates of important events, in-cluding the AGM, publication of interim reports and open presentations. This calendar is made available as a stock exchange announcement and on the company’s website as soon as it has been approved by the board and is also reproduced in the annual report.
Norwegian Property complies with the recommenda-tions of Oslo Børs concerning the reporting of investor relations information. The applicable recommendation for such reporting is available on the Oslo Børs website at www.oslobors.no.
Takeovers
The board has not prepared separate guiding principles for responding to a possible takeover bid since it wishes to be free, within the constraints of existing regulations, to react to such an offer as it sees fit.
The company’s articles of association place no re-strictions on buying shares in the company. In a takeo-ver process, the company’s board and executive man-agement will seek to help ensure that the shareholders are treated equally and that the company’s business suf-fers no unnecessary disruption. The board will give par-ticular weight to ensuring that shareholders have suffi-cient time and information to be able to form a view of a possible offer for the company’s business or shares.
The board does not intend to prevent or hamper anyone from presenting an offer for the company’s business or shares. It will take account of the common interests of the company and the shareholders in the event that possible agreements with bidders are considered.
Auditor
An audit committee of three directors has been ap-pointed. This committee is intended to support the board in the exercise of its responsibility for financial re-porting, internal control, auditing and overall risk man-agement. Its work is governed by an instruction. The company’s auditor, PwC, conducted the following work during 2018 in relation to fiscal 2018.
- Presented the main features of the audit work. - Attended board meetings considering the an-
nual report, reviewing possible significant changes in accounting principles, assessing sig-nificant accounting estimates, and considering

Annual report 2018 - Norwegian Property ASA
Corporate governance Side 75
all cases where possible disagreements had arisen between auditor and executive manage-ment.
- Conducted a review, together with the board, of the company’s internal control systems, in-cluding the identification of weaknesses and proposals for improvements.
- Held a meeting with the board without the presence of the executive management.
- Confirmed that the requirements for the audi-tor’s independence were fulfilled and provided an overview of services other than auditing which have been rendered to the company.
PwC attended three meetings with the audit committee, which included reviewing the main features of the plan for executing the audit for the year and presenting re-sults from the audit.
Pursuant to the instruction for the board’s audit com-mittee, the use of the auditor for substantial assign-ments other than ordinary auditing services must be considered and approved by the board.
The board reports annually to the AGM on the auditor’s overall fees, broken down between audit work and other services. The AGM approves the auditor’s fees for the parent company.

Annual report 2018 - Norwegian Property ASA
Corporate social responsibility Side 76
Corporate social responsibility
Overall guidelines
Norwegian Property builds its guidelines for corporate social responsibility (CSR) on the basic principles of the UN’s Global Compact, which aim to safeguard human rights, standards in working life, environmental protec-tion and measures to combat corruption. The group will moreover observe all applicable legislation and statu-tory regulations where it has its operations.
The guidelines for CSR were approved by the board in October 2018 and have been published on the com-pany’s website at www.npro.no. Their purpose is to en-sure that CSR is exercised in accordance with estab-lished base values and ethical guidelines, guidelines for corporate governance, and the group’s long-term value creation for shareholders, employees, customers and society. The guidelines apply to all employees of the group and to the directors when they act on behalf of the company. The board is responsible for seeing to compliance with the guidelines.
Ensuring compliance with all the guidelines for CSR is an integral part of the group’s internal control. The group will continuously assess the social consequences of its business and implement improvements and measures where necessary. All significant breaches of the guide-lines must be reported to and followed up by the board.
Strategy for environmental and social respon-sibility
Norwegian Property has a strategy for corporate envi-ronmental and social responsibility with targets up to 2022. The strategy was reviewed and the goals adopted by the board in October 2018. The goal is to be a respon-sible social player as a property company, a contributor to shaping policy for the industry, and an employer. The basic precondition is that the group conducts a profita-ble and sustainable business. Long-term profitability is a prerequisite for exercising CSR in such respects as providing good and secure jobs, implementing environ-mental measures in the property portfolio in the shape of more energy-efficient solutions and reduced emis-sions from the buildings, ensuring good working condi-tions for the group’s tenants, and contributing to posi-tive development in those urban districts where Norwe-gian Property conducts its business.
The most important goals defined for CSR in the period until 2022 are as follows.
RESOURCES
- 30-50 per cent reduction in energy consump-tion from total rehabilitation of buildings
- 5-10 per cent reduction in energy consumption in the existing portfolio
- 10-20 per cent cut in carbon emissions - 60-65 per cent waste sorting in the buildings - five per cent reduction in water consump-
tion/establish good metering methods and fol-low-up of water consumption in the buildings
TENANTS AND MARKET
- strengthen reputation - tenant satisfaction index for the company’s en-
vironmental image and CSR exceeding 70 (Nor-wegian Lessee Index)
- proactive collaboration with tenants - no personal injuries in areas which the com-
pany is responsible for
STAKEHOLDERS AND SOCIETY
- forward-looking local developments - active participation in industry associations - portfolio concentrated around transport hubs
EMPLOYEES AND SUPPLIERS
- no breaches of ethical guidelines - develop relevant environmental expertise - responsible supplier/contractor management
The natural environment
The group applies a broad definition of the environment (and of CSR). This includes clearly defined goals for envi-ronmental protection as well as high standards for the aesthetic design of buildings and outdoor spaces in the local environment. Norwegian Property sets strict standards for its partners and suppliers and will be a good facilitator for its tenants.
More detailed information is available in the company’s environmental report at npro.no.
Energy consumption and CO2 emissions Climate-related risk management has been part of the company’s financial planning process and cross-discipli-nary risk management ever since 2011. On that occa-sion, environmental analyses were carried out for each building, with associated measures identified to reduce energy consumption in 2011. Based on a cost/benefit prioritisation, the company has implemented a number of these measures. Enova has supported the work and provided some NOK 33 million in investment grants for

Annual report 2018 - Norwegian Property ASA
Corporate social responsibility Side 77
the measures. Where buildings in regular operation are concerned, the work is pursued in close cooperation with tenants through “green” leases. Lessee and lessor can agree to invest in environmental measures during the life of the tenancy which will reduce energy con-sumption and thereby cut overhead costs. The capital spending involved will be covered by rental payments agreed between the parties.
Developments in energy consumption per building are measured and reported annually to the board. Results as per 31 December 2018 for the existing strategy pe-riod are available in the table below. Reduction and in-crease are calculated as change from previous year. To-tal energy consumptions and carbon emissions are cal-culated for the whole group. Energy consumption and carbon emissions per square meter only include build-ings which have been in ordinary operation. The base data are obtained from the company’s energy suppliers and the energy monitoring system (EOS) in the proper-ties. Cemasys has provided support in processing and verifying the figures for energy consumption and carbon emissions. As of 2018, we have calculated the split on different categories of premises.
1 The latest survey was conducted immediately before the end of 2017, and the next will be carried out in 2019.
The total reduction of CO2e emissions from 2017 to 2018 is 478.4 tCO2e. CO2e emissions from the buildings (Scope 2) have been reduced by a total of 434.1 tCO2e. Of this, 139.1 tCO2e is due to a changed composition of energy sources. From 2017 to 2018, consumption of dis-trict heating/cooling has increased by 21.0 per cent, and the energy production by the energy centre has in-creased by 17.0 per cent. Electricity consumption has been reduced by 3.5 per cent since 2017.
Most energy sources, such as electricity (Nordic mix) and district heating/cooling, have increased their re-newable component and cut carbon emissions by 13,5 per cent from 2017 to 2018 (6.3 per cent from 2016 to 2017).
Energy center at Aker Brygge Three of the buildings at Aker Brygge are connected to a common energy centre, which became operational in the summer of 2014. The centre delivered energy corre-sponding to 292 per cent of the energy input in 2018 (250 per cent in 2017), and this is used for heating and cooling. Continuous efforts are being devoted to im-provements. The share of energy consumption in the connected buildings delivered by the energy centre in-creased from 27 per cent in 2015 to 42 per cent in 2018. The company’s total carbon emissions would have been 443.7 tonnes (12.7 per cent) higher if electricity had been used instead of this wholly renewable energy. The centre delivered 8 532MWh in 2018, compared with 7 295.3MWh in 2017 and 6 560.7MWh in 2016, which cor-responded to an increase of 30 per cent over two years.
Water consumption Work is under way to secure reliable and historically comparable figures for water consumption in the build-ings. Water meters connected to the central EOS are be-ing installed in the buildings.
Waste sorting The proportion of waste sorted has shown a good im-provement since 2011 but declined slightly from 2017 to 2018. The table above shows waste sorting for Aker Brygge, Nydalen and Stavanger. Attention has concen-trated on achieving an increase at Aker Brygge, since the buildings there account for the largest share of the waste. The project at Aker Brygge boosted the propor-tion of sorted waste from 15 per cent in 2011 to 58 per cent in 2018.
Combating corruption
Norwegian Property wants fair and open competition in all markets, sets high standards of personal and profes-sional integrity, and does not tolerate any form of cor-ruption or bribery. It wishes to conduct an open, reliable and attentive communication with stakeholders and so-ciety in general.
Corruption is among the most damaging actions a com-pany can be exposed to and may involve financial and reputational loss. Moreover, the human consequences
2018 2017 2016
Total consumption (MWh) 62 216 61 455 66 008
Energy consumption per sqm (kWh) 266 281 300
Change from previous year (percent) (6) (6)
Office (kWh per sqm) 181
Retail (kWh per sqm) 511
Restaurant (kWh per squm) 792
Total CO2e-emission (ton) 3 548 4 026 4 275
CO2e-emission (kg per sqm) 10 12 13
Change from previous year (percent) (17) (10)
Office (kg per sqm) 6
Retail (kg per sqm) 16
Restaurant (kg per sqm) 28
Proportion of waste sorted (percent) 62 63 59
Tenant satisfaction index 1 - 77 80

Annual report 2018 - Norwegian Property ASA
Corporate social responsibility Side 78
are often serious and extensive. Corruption has oc-curred earlier in the Norwegian construction industry. Norwegian Property wants to help combat it in all its forms. This is ensured first and foremost through its work as a responsible investor and owner, as a respon-sible buyer and through implementing and following up ethical guidelines.
Norwegian Property has its own ethical guidelines ap-proved by the board in October 2018 and published on its website. These specify that the company will conduct an acceptable, ethical and sound business at every level, with stringent standards set for its employees. Its ethical guidelines provide norms and rules which apply to all employees. They also apply to directors when these act on behalf of Norwegian Property. All employees must review the ethical guidelines annually and confirm that they will comply with them.
The company’s reputation depends on the behaviour of its employees. These are expected to conform with the company’s base values by behaving responsibly towards colleagues, business contacts and society in general. The company requires each of its employees at all times to act with the greatest integrity, and to treat everyone they come into contact with in an equitable manner and with respect. Norwegian Property rejects corruption, bribery and other conditions which reduce competition or give advantages to the company or its employees. Its personnel must not accept gifts which could affect their own integrity or decisions or those of others, or which could be perceived to do so. Norwegian Property’s em-ployees must not work on behalf of the company on matters where they have personal interests, or where others could perceive such interests.
Norwegian Property has prepared detailed processes for procurement covering the whole process from iden-tifying a need to implementing a purchase. One purpose of these processes is to help limit opportunities for cor-ruption related to procurement. This is achieved in part by documented processes and the highest possible de-gree of work sharing, and by requirements on who can be used as suppliers. Norwegian Property seeks to uti-lise suppliers with comparable ethical standards and at-titudes. Suppliers represent Norwegian Property, and those it collaborates with must accordingly conform with its core values. The following minimum standards are set for suppliers and possible sub-suppliers:
- financial strength and the capacity to deliver - a good history for compliance with legal re-
quirements (business conduct, use of unregis-tered workers and so forth)
- satisfy requirements for health, safety and the environment (HSE), internal control and so forth
- ethical and environmental guidelines which ac-cord with Norwegian Property’s strategy
- membership of the StartBANK register for sup-pliers.
StartBANK is a joint supplier register used by purchasers in Norway’s construction, public administration, insur-ance and property sectors to support serious suppliers and provide updated and checked supplier information. With 3 600 suppliers evaluated on the basis of predeter-mined approval criteria, StartBANK provides an equita-ble, open and secure solution for selecting reliable sup-pliers. This gives suppliers the opportunity to compete on equal terms, contributes to the use of serious play-ers, and creates new business opportunities for both purchasers and suppliers. StartBANK is being continu-ously developed to meet the increasingly demanding le-gal guidelines and requirements for risk management in the construction industry.
Norwegian Property found no evidence of fraud, corrup-tion or attempted corruption in its business during 2018.
Employee rights and social conditions
Norwegian Property expects all employees to behave in conformity with the group’s base values. The latter rest on four core values which form the foundation of the group’s corporate culture:
- collaborative - courageous - innovative - attentive.
Norwegian Property is an expertise-driven organisation and aims to be an attractive employer where employees thrive. Active provision will be made for developing per-sonnel in order collectively to form a leading profes-sional team in the Norwegian property sector. Emphasis is given when recruiting staff to combining professional expertise and experience of the property sector, while ensuring that personal qualities contribute to an aggres-sive and efficient organisation.
Continuous efforts are devoted to knowledge develop-ment in the form of tailored training, so that each em-ployee can fully master their job and develop in step with changing requirements. Backed by individual devel-
Annual report 2018 - Norwegian Property ASA
Corporate social responsibility Side 79
opment plans, employee progress and training require-ments are followed up through job reviews. Based on goals for personal development, employees can apply for financial support to pursue further or continuing ed-ucation.
Contributions to a good working environment are also sought through attractive premises, a dynamic work-place and challenging assignments.
Norwegian Property has earlier conducted regular em-ployee satisfaction surveys. It has ceased to do so be-cause it was difficult to maintain anonymity in an organ-isation with a small workforce. Instead, a good ongoing dialogue will be sought with employees to identify their level of satisfaction and other conditions. Whistleblow-ing routines for reporting more serious conditions were established in 2018.
Where equal opportunities and inclusion are concerned, efforts are made to ensure that all employees receive the same opportunities for personal and professional development. New and existing personnel will be treated equally regardless of their gender, age, ethnic origin or possible disabilities. The company does not ac-cept any form of discrimination – on the basis of gender, race, religion or orientation, for instance.
Norwegian Property has a conscious attitude to equal opportunities when recruiting personnel. But the con-struction and property sectors are male-dominated, and that creates some challenges for efforts to increase the female proportion in certain posts. The group had 49 employees at 31 December 2018, same as a year earlier. 33 of the company’s 49 employees are male and 16 are female. The executive management comprises four peo-ple - three men and one woman. At the date when the financial statements were presented, the board com-prised seven directors - four male and three female.
Norwegian Property observes established standards of working life and will comply with all requirements en-shrined in relevant legislation. The group seeks to apply working methods which ensure good working condi-tions, with high standards of HSE. Day-to-day operations take account of HSE considerations. These are im-portant for Norwegian Property because the group is dependent on maintaining high standards for the health and well-being of its employees in order to succeed. Its strategy involves zero tolerance of serious personal in-juries suffered in relation to Norwegian Property’s prop-erties and areas of responsibility.
Sickness absence is an important HSE indicator. The to-tal recorded for 2018 at Norwegian Property was 3.7 per cent, compared with 2.6 per cent in 2017. The increase is caused by long term sick leave, and the effect is rela-tively high because the number of employees is low.
Opportunities for employees to participate in determin-ing their own working day form part of HSE work. The practical follow-up is conducted through the working environment committee (AMU), where representatives of employees and management meet. During the year, the AMU deals with current working environment issues and future plans which could have substantial signifi-cance for the working environment and so forth.
Human rights
Norwegian Property supports and respects interna-tional human rights. Respect for the individual repre-sents a fundamental guideline for the group. Everyone will be treated with dignity and respect, without dis-crimination on the basis of ethnicity, nationality, reli-gion, age, gender, disability or sexual orientation. Chil-dren will not be used as labour, and no forced labour will occur.
As a property company with all its activities in Norway, Norwegian Property does not face the greatest human rights challenges in its everyday operations. But the sup-pliers it uses could be subject to challenges, in part re-lated to social dumping. In the construction industry, the latter could be associated with economic migrants whose pay, and employment conditions are significantly worse than for national workers. The greatest opportu-nities for Norwegian Property to promote, respect and prevent breaches of human rights accordingly lie in be-ing a responsible purchaser of goods and services. Through its ethical guidelines and by acting as a respon-sible purchaser, the group seeks to help ensure that sup-pliers apply key principles which accord with its own.

Annual report 2018 - Norwegian Property ASA
Presentation of the directors Side 80
Presentation of the directors
With effect from the AGM in April 2018, the board of Norwegian Property ASA comprised the following direc-tors.
Merete Haugli (chair) Merete Haugli (born 1964), director since 13 April 2016 and chair since 19 April 2018, studied at Bankakademiet and the BI Norwegian Business School, and has pursued studies of transpersonal psychology. She runs her own consultancy in such areas as management training, mental training and mentoring, and has a versatile back-ground in finance and the police. She is a director of Sol-stad Offshore ASA, Reach Subsea ASA and Axactor AB, as well as a member of the nomination committee for Mowi ASA and North Energy ASA. She owned or con-trolled no shares in Norwegian Property ASA at 31 De-cember 2018.
Bjørn Henningsen (deputy chair) Bjørn Henningsen (born 1962), director since 10 Octo-ber 2014, has an MSc in economics from Heriot-Watt University and is a partner in Union Eiendomskapital AS, which he helped to found in 2005. Henningsen has very long and broad experience of real estate investment and development, banking and finance. He was previously fi-nance director and managing director of Investra ASA, and also has long experience from banks and financial institutions. Henningsen is chair and director of numer-ous companies in the Union group, including chair of Un-ion Gruppen AS and Union Eiendomskapital AS. He owned and controlled 311 556 shares in Norwegian Property ASA at 31 December 2018.
Cecilie Astrup Fredriksen (director) Cecilie Astrup Fredriksen (born 1983), director since 10 October 2014, received a BA in business and Spanish from London Metropolitan University in 2006. She is currently employed in Seatankers Management Co Ltd and serves as a director of several companies, including Marine Harvest ASA and Ship Finance International Ltd. Fredriksen is related to Geveran Trading Co Ltd, which owned and controlled 326 468 339 shares in Norwegian Property ASA at 31 December 2018.
Kathrine Astrup Fredriksen (director) Kathrine Astrup Fredriksen (born 1983), director since 13 April 2016, studied at the European Business School
in London. She is currently employed by Seatankers Management Co Ltd in London. Fredriksen’s previous di-rectorships include Seadrill Ltd, Frontline Ltd and Golar LNG. She is related to Geveran Trading Co Ltd, which owned and controlled 326 468 339 shares in Norwegian Property ASA at 31 December 2018.
Carl Erik Krefting (director) Carl Erik Krefting (born 1953), director since 19 April 2018, has a law degree from the University of Oslo. He helped to found Søylen Eiendom AS in 2004. This com-pany opened Eger as Norway’s first high-end depart-ment store in May 2009. Krefting was a lawyer and part-ner in the Thommessen Krefting Greve Lund law com-pany from 1982 to 2004, and in that connection held di-rectorships in such companies as Avantor ASA, Dyno In-dustrier ASA and Gresvig ASA. He owned or controlled no shares directly in Norwegian Property ASA at the end of 2018 but, through his wholly owned Carucel Holding AS company, has a TRS agreement related to 4 326 842 shares maturing on 24 January 2020 at a strike price of NOK 10.80 per share. Krefting also has an option to ac-quire 500 000 shares in Norwegian Property ASA in up to three tranches at a price of NOK 11.50 between 19 April 2019 and 19 April 2021.
Lars Erich Nilsen (director) Lars Erich Nilsen (born 1981) has been employed by Seatankers Management Norway AS since 2014. Before then, he worked as an analyst for Fearnley Advisors AS (2013-14) and Fearnley Fonds ASA/Fearnley Securities AS (2005-13, as partner from 2007). Nilsen holds a mas-ter’s degree in business economics from the BI Norwe-gian Business School. He is related to Geveran Trading Co Ltd, which owned and controlled 326 468 339 shares in Norwegian Property ASA at 31 December 2018.
Kjell Sagstad (director) Kjell Sagstad (born 1948), director since 13 April 2017, has an MSc in economics from the University of Oslo and is senior director and investment director at Niam and head of its Norwegian business. He is chair of a number of property companies owned and controlled by Niam. Sagstad has previously been investment vice president for Vital Eiendom and CEO of Norgani Hotels ASA, and has long experience of management, acquisition and sale of property. He is related to Niam V Prosjekt AS, which owned and controlled 67 437 425 shares in Nor-wegian Property ASA at 31 December 2018.

Annual report 2018 - Norwegian Property ASA
Definitions Page 81
Definitions
Below is an explanation of figures and notions mentioned in the interim report, which are not derived directly from the accounts.
Run rate for annual rent Contracted annualised rental income for the property portfolio at the balance sheet date.
Weighted remaining duration of leases Remaining contractual rent of current leases at the balance sheet date divided by the total contractual rent for the entire lease term.
Space vacancy Space which does not generate rent at the balance sheet date divided by total space.
Financial vacancy rate Annualised market rent for space that, at the balance sheet date, do not generate rental in-come divided by total annualised rent for total space (contract rent for leased space and market rent for vacant space).
Gross yield Gross yield on the balance sheet date for a property or portfolio of properties is calculated as contractual annualised rental income divided by market value.
Net yield When calculating net yield, maintenance and property-related costs are deducted from con-tractual annualised rental income, which is then divided by the market value.
Prime yield Yield for a fully leased property of best structural quality, with tenants in the best cate-gory and in the best location.
Property-related operational expenses Property-related expenses include administrative costs related to the management of the properties as well as operating and maintenance costs.
Other property-related expenses Other property-related expenses include income-related costs related to leasing, marketing and so forth, the owner’s share of service charges, project-related property costs and dep-reciation related to the properties.
Administrative expenses Administrative expenses relate to costs which are not directly related to the operation and leasing of properties, and include costs related to the overall ownership and corporate func-tions.
Operating profit before administrative expen-ses
Revenues net of property expenses.
Profit before income tax and value adjust-ments
Profit before tax, adjusted for fair value adjustments of investment properties and financial derivatives.
Like for like Change in rental income from one period to another based on the same income generating property portfolio, with rental income adjusted for purchases and sales of properties.
Independent valuers Akershus Eiendom and Cushman & Wakefield.
Market value of property portfolio The market value of all the group's properties regardless of accounting classification.
Interest-bearing debt Book value totals for long-term and short-term interest-bearing debt, less holdings of own bonds.
Net interest-bearing debt Interest-bearing debt, less holdings of bonds as well as cash and cash equivalents.
Equity ratio Total equity divided by total equity and liabilities.

Annual report 2018 - Norwegian Property ASA
Definitions Side 82
Pre-tax return on equity Annualised pre-tax profit in the period divided by average total equity for the period in the balance sheet.
Unutilised credit facilities The difference between total available credit facilities, based on the current loan agree-ments, and amounts at the balance sheet date which are deducted and accounted for as interest-bearing debt in the balance sheet.
Interest hedging ratio The share of interest-bearing liabilities hedged at the balance sheet date.
Base interest rate A weighted average of the fixed and floating average interest-rates at the balance sheet date. The fixed average interest rate is calculated as the weighted average of the fixed interest rate paid by the company in relation to outstanding interest-rate contracts and loans. The floating average interest-rate is calculated as the weighted average of the Nibor rate paid on interest-bearing debt. The interest-rate base does not include accrued finance charges or margin.
Average interest rate Weighted average interest rate on interest-bearing debt and fixed-rate interest agreements at the balance sheet date.
Average interest margin The weighted average of the interest margin on the outstanding interest-bearing debt at the balance sheet date.
Remaining time to maturity for interest-bear-ing debt
Weighted remaining period until maturity for interest-bearing debt at the balance sheet date.
Remaining time to maturity for interest hedge agreements
The weighted remaining period until maturity for interest hedge agreements at the balance sheet date.
LTV Debt to asset ratio (loan to value).
Gross debt to asset ratio (gross LTV) Interest-bearing debt divided by the fair market value of the property portfolio at the balance sheet date.
Net debt to asset ratio (net LTV) Net interest-bearing debt divided by the fair market value of the property portfolio at the balance sheet date.
Earnings per share (EPS) Net earnings for the period divided by the average number of shares during the period. Di-luted earnings per share are identical to basic earnings per share, unless otherwise specified.
NAV, book value Net asset value, the book value of total equity in the balance sheet.
NAV, adjusted NAV from an ordinary long-term operational perspective of the business. Based on total eq-uity in the balance sheet, adjustments are made for the carrying amount of deferred tax related to fair value adjustments of investment properties and for fair value of financial in-struments after tax in the balance sheet.
NNNAV In relation to the Adjusted NAV, NNNAV (triple net asset value) includes estimated realisable fair values at the balance sheet date for deferred taxes, financial instruments and liabilities.
Oslo CBD Oslo Central Business District is considered the most attractive area for office space in Oslo. The area is usually limited to the districts of Aker Brygge, Tjuvholmen and Vika.

Annual report 2018 - Norwegian Property ASA
Contacts Side 83
Contacts
Norwegian Property ASA:
Støperigata 2
NO-0250 Oslo, Norway
P. O. Box 1657 Vika
NO-0120 Oslo, Norway
www.npro.no
Switchboard:
Telephone: +47 22 83 40 20
Customer centre:
Telephone: +47 48 05 03 00
E-mail: [email protected]
Investor relations:
Haavard Rønning
CFO
Telephone: +47 40 02 00 19
E-mail: [email protected]
Letting:
Ellen Cathrine Kobro
EVP Sales and Marketing
Telephone: +47 95 29 24 78
E-mail: [email protected]


