Not to be cited without permission of the authors 1 Cana:Jian Atlantic Fiaheries Scientific Advisory Camlittee CAFSAC Research DocuDent 83/75 Ne pea pter sans aut:ori..a&ticn des auteurs l CCmit6 acientifique <.XXlSultatif des pIchea canadiennes dans l' Atlantique aK:PC'A DocuDent de recherche 83/75 Flatfhh Stat1st:ics in the Gulf of St. Lawrence, with a Jevlew of 4T White Bake by ))::)U:)l.as Clay and Gloria Nielsen Marine Resource Research Divisioo Department of Fisheries Ii OCeans P.O. Box 5030 Mcnct:a'\, N.B. canada ElC 9136 1 '1'his series dcx:lments the scientific basis for fisheries lIIaI'laqement advice in Atlantic Canada. As such, it adch:esses the issues of the day in the time frames required and 'the Research Docunents it ocntaina are not inten:ied as defini tiVe statements 00 the subjects addressed but rather as pt03te8S reports en investigatiQ'lS • 1 Cette sErie documente les bases scientifiques des oonsells de gestioo des p@ches sur la cate atlantique du canada. Ccmne telle, elle CXXlvte les pr:cblares actuels seloo lea 6cheanciers VQl],us et les OOc:uments de recherche qu' elle ocntient ne doivent pas @tre CCl'UIid!r4!s oc:mne des finals sur les sujets trait4s mais plutet oc:mne des rapports d I sur lea 6b:des en ccu.rs. Research DocuDents are produced in Ies IX:lcuoents de recherche sont the official l.an:juage in which they pbli6s dans la lan3ue officielle are provided to the secretariat by utilis6e par les auteurs dans le the author. manuscrit au secretariat.
Transcript
Not to be cited without permission of the authors1
CCmit6 acientifique <.XXlSultatif des pIchea canadiennes dans l'Atlantique
aK:PC'A DocuDent de recherche 83/75
Flatfhh Stat1st:ics in the Gulf of St. Lawrence, with a Jevlew of 4T White Bake
by
))::)U:)l.as Clay and Gloria Nielsen Marine Resource Research Divisioo
Department of Fisheries Ii OCeans P.O. Box 5030 Mcnct:a'\, N.B.
canada ElC 9136
1 '1'his series dcx:lments the scientific basis for fisheries lIIaI'laqement advice in Atlantic Canada. As such, it adch:esses the issues of the day in the time frames required and 'the Research Docunents it ocntaina are not inten:ied as definitiVe statements 00 the subjects addressed but rather as pt03te8S reports en ~~ investigatiQ'lS•
1 Cette sErie documente les bases scientifiques des oonsells de gestioo des p@ches sur la cate atlantique du canada. Ccmne telle, elle CXXlvte les pr:cblares actuels seloo lea 6cheanciers VQl],us et les OOc:uments de recherche qu' elle ocntient ne doivent pas @tre CCl'UIid!r4!s oc:mne des ~s finals sur les sujets trait4s mais plutet oc:mne des rapports d I ~tape sur lea 6b:des en ccu.rs.
Research DocuDents are produced in Ies IX:lcuoents de recherche sont the official l.an:juage in which they pbli6s dans la lan3ue officielle are provided to the secretariat by utilis6e par les auteurs dans le the author. manuscrit en~ au secretariat.
ABSTRACT
Analvtical assess~ents were not conducted for the flatfish stocks in NAFO divisions 4RST. Catch-at-ase dis~ribution is not accurate for American plaice due iG the large number of discards and the unknown nature of thase discards. Ab'....... dance indices ind i cat a a pas sib 1e dec line inst 0 c k 'S 1z e • The 101.1 n t e r flo u n d e r fisher~ is larsel~ an inshore fisher~, resultins in a lack of effort data and limited sa~plins information. Catch per unit effort data indicate a decreasins stock biomass, oespite stable catches. The landinss of the other flatfish stocks are small and comprise a ver~ small portion of the Atlantic fisher~. Catch-ataSe information is not available for wh". ~ake aad until 1982 this was an unresulated fisherw Res.,ttrClh vessel. s~rvev data indicate a stable stock biomass. Analiti~.l assessments on which to base manasement stratesies will not be feasible for these fish stocks until more data are available. For the present, little can be done aside from data collection and biolosical monitorinS.
# #
RESUME
II n'w a pas eu d'~yaluatiQns analwtiaues de faites des stocks de poissons plats dans les div. 4RST de l'OPANO. La distribution des prises par ase de plie canadienne est imprecise a cause du srand nombre de poissons reJet's A Is mer et du manaue d'information sur la natura de cas reJets. Las indices d'abondance indi~uent un d'clin possible des effectifs de stock. La pecha de la plie rouSe est en srande partie cotlere. Comme r6sultat, on man~ue de donnees sur l'effort, et l"chantillonnaSe est limiti. Les prises par unit' d'effort indiauent une diminution de la biomasse de stack, malsri des prises stables. Les debarauements des aut res stocks de poissons plats sont faibles et ne representent ay'une petite fraction de lapeche dans l'Atlantiaue. Nous na poss.dons pas de donnees sur les prises par aSe de merlucha blanche et, Jusau'en 1982, cette pi~he ~tait non rislementee. Les relev~s par navires de recherche indiauent une biomasse de stock stable. On ne pourra faire des iYaluations analwtiaues sur lesouelles fOnder des stratis!es de gestion pour cas stocks, . tant Gu'on n'aura pas plus de donnees. Pour Ie moment, on ne peut faire beaucoup plus aue recueillir des donnies et exercer une surveillance biolosiaue.
3
INTRODUCTION
Prior to 1982 the flatfish of the Gulf of St. Lawrence have been assessed b~ two research resions which in effect divided the Gulf into the southern (NAFO 4T) and northern (NAFO 4RS) research components. Most of the flatfish fisheries in the Gulf are b~
catchy some havins limited directed aspects. The major flatfish stocks investisated have included 4RS witch, 4RST Greenland halibut, 4T American plaice, and 4T winter flounder. The 4T white hake is a locall~ important stock in the southern Gulf.
STOCKS
YELLOWTAIL FLOUNDER
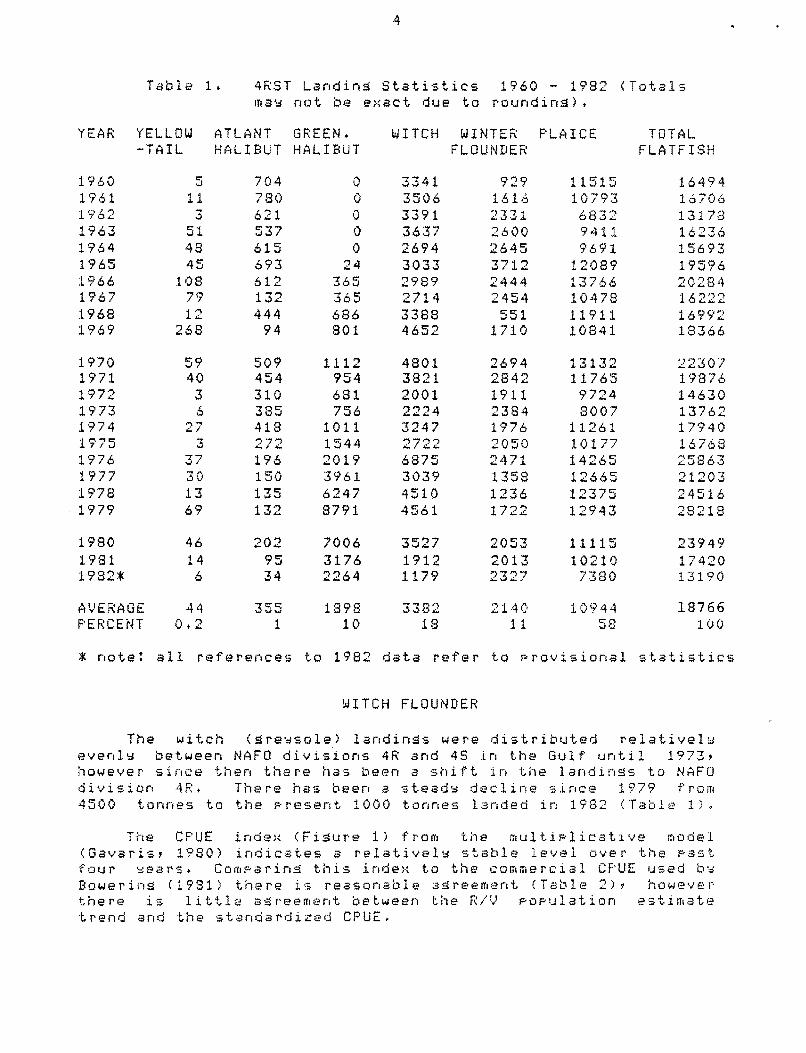
The Gulf ~ellowtail fisher~ is extremel~ small, havins a mean catch of less than 45 tonnes over the last twent~ ~ears
(Table 1). In most ~ears the major portion is taken in NAFO division 4T. There is no seasonalit~ in the distribution of the landinSs. The landinSs for 1982 were 6 tonnest
ATLANTIC HALIBUT
Atlantic halibut is a commerciall~ preferred fish, with declininS landinSs over the last 20 ~ears <Table 1). The landinss have tended to be split somewhat eaual1~ over the 3 NAFO divisions of the Gulf. The landinSs for 1982 were 34 tonnes, down considerabl~ from the 20 ~ear ave raSe of 355 tonnes.
GREENLAND HALIBUT
This fisher~ was a b~-catch of the northern shrimp fisher~
until 1978. Since that time increased biomass due to strong 1973 to 1975 ~ear classes has lead to a dedicated sillnet fisher~
alons the north shore (Quebec). The landinSs for this stock were fairl~ uniforml~ spread thoush NAFO divisions 4RST until 1973. Since that time there has been an increase in the 4S proportion of the landin~s, due mainl~ to fishinS bw Sillnetters and shrimp trawlers. The landinSs have been declinins in recent ~ears CTable 1) to the 1982 level of 2264 tonnes.
Research vessel survews do not indicate an~ stronS new recruitment and the commercial catch per unit effort indicates a decline from 1978 to 1981/1982 from 23ks/hr to 5ks/hr. Due to the b~-catch nature of the shrimp fisher~ component and the opportunistic nature of the directed sillnet component of the fisher~, this fisher~ will be difficult to manage with a TAC. Catches should, however remain stable until 1985 or 1986.
4
Table 1. 4RST Landins Statistics 1960 - 1982 (Totals may not be exact due to rounding).
YEAR YELLOW ATLANT GREEN. WITCH WINTER PLAICE TOTAL -TAIL HALIBUT HALIBUT FLOUNDER FLATFISH
* note: all references to 1982 data refer to provisional statistics
WITCH FLOUNDER
The witch (greysole) landinss were distributed relativel~
evenly between NAFO divisions 4R and 4S in the Gulf until 1973, however since then there has been a shift in the landings to NAFD division 4R. There has been a steadY decline since 1979 from 4500 tonnes to the present 1000 tonnes landed in 1982 (Table 1).
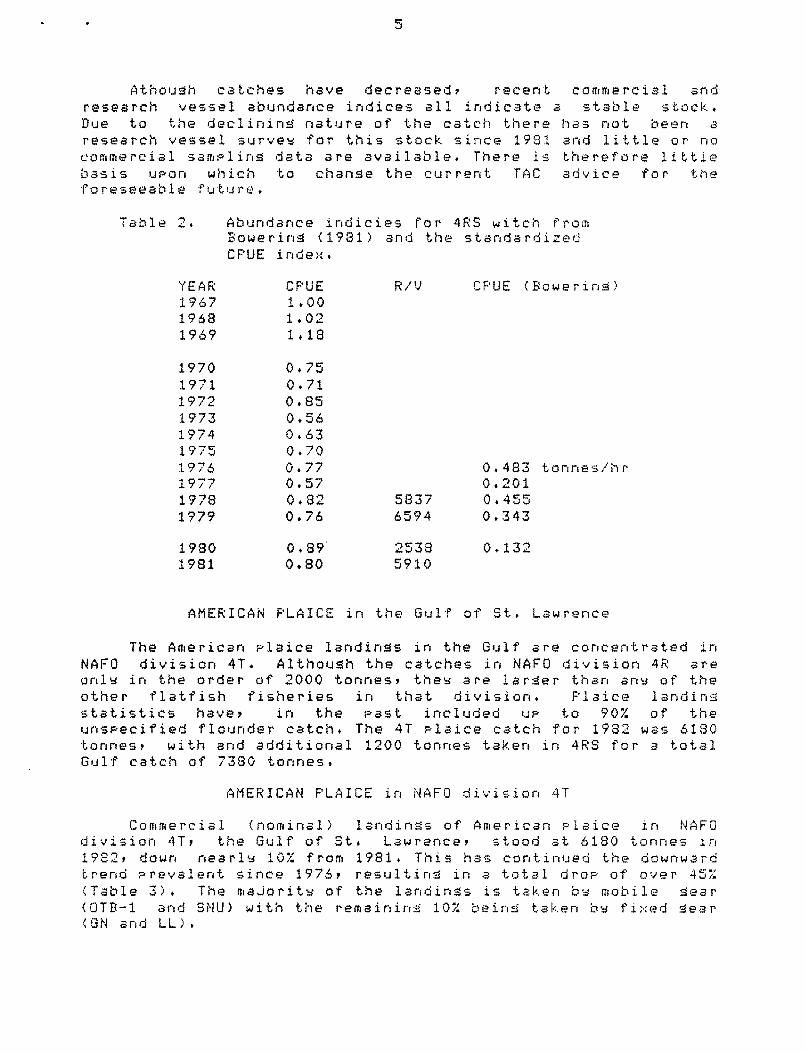
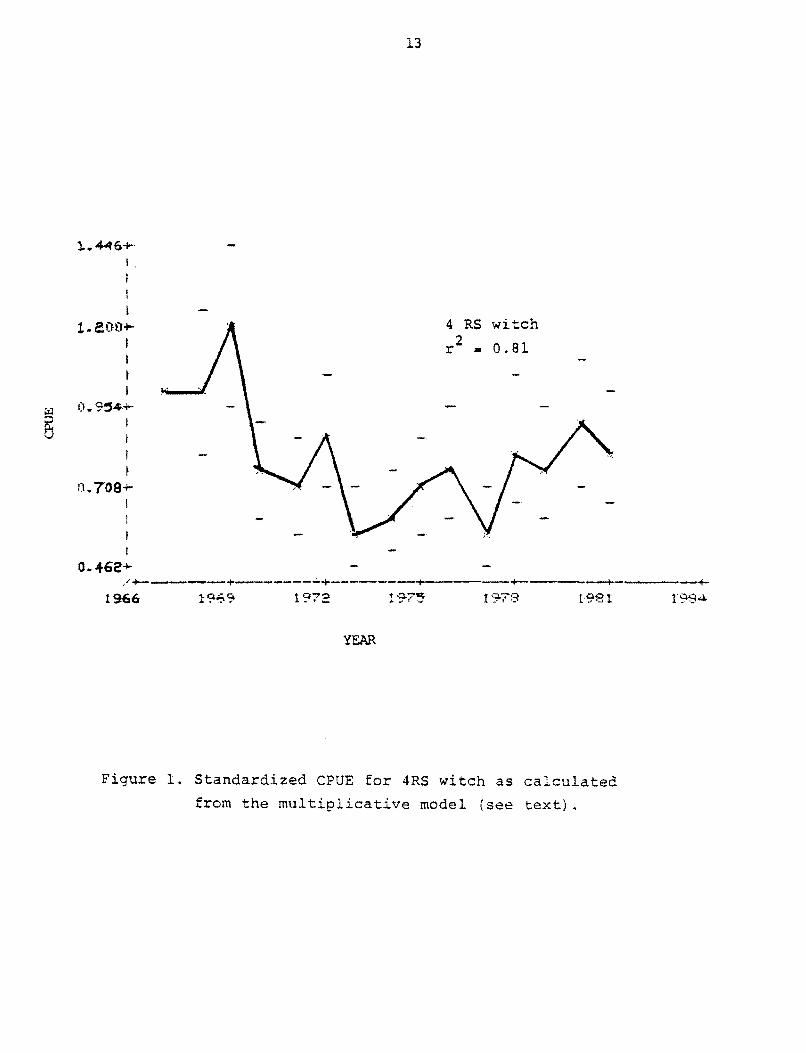
The CPUE index (FiSure 1) from the multiplicative model (Gavaris, 1980) indicates a relatively stable level over the past four sears. Comparing this index to the commercial CPUE used bs Bowering (1981) there is reasonable aSreement (Table 2), however there is little agreement between the R/V population estimate trend and the standardized CPUE.
5
Athough catches have decreased, recent commercial and research vessel abundance indices all indicate a stable stock. Due to the declining nature of the catch there has not been a research vessel surve~ for this stock since 1981 and little or no commercial sampling data are available. There is therefore little basis upon which to change the current TAC advice for the foreseeable future.
Table 2. Abundance indicies for 4RS witch from Dowering (1981) and the standardized CF'UE inde;.{.
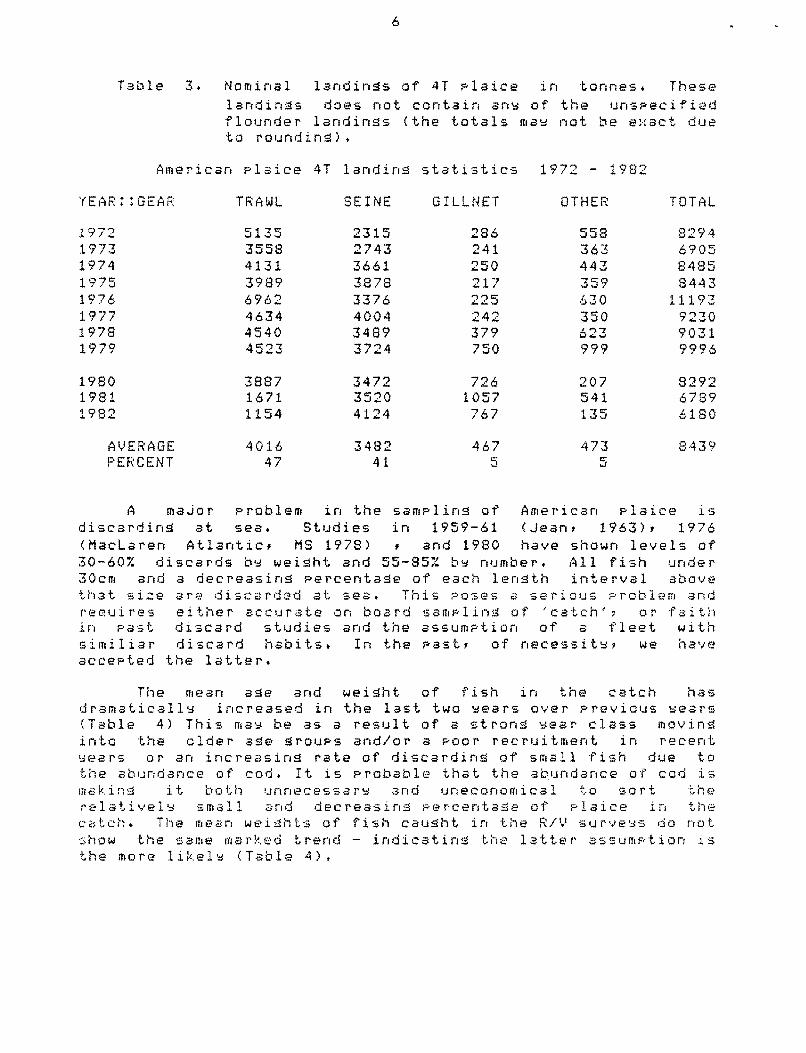
The American plaice landinss in the Gulf are concentrated in NAFO division 4T. Although the catches in NAFO division 4R are only in the order of 2000 tonnes, they are larger than any of the other flatfish fisheries in that division. Plaice landing statistics have, in the past included UP to 90% of the unspecified flounder catch. The 4T plaice catch for 1982 was 6180 tonnes, with and additional 1200 tonnes taken in 4RS for a total Gulf catch of 7380 tonnes.
AMERICAN PLAICE in NAFO division 4T
Commercial (nominal) landings of American plaice in NAFO division 4T, the Gulf of St. Lawrence, stood at 6180 tonnes in 1982, down nearly 10% from 1981. This has continued the downward ~rend prevalent since 1976, resulting in a total drop of over 45% (Table 3). The majority of the landings is taken by mobile Sear (OT8-1 and SNU) with the remaining 10% being taken by fixed sear (GN and LL).
6
Table 3. Nominal landin~s of 4T plaice landings does not contain any flounder landings (the totals to rounding).
American plaice 4T landing statistics
YEAR::GEAR TRAWL SEINE GIllNET
1972 1973 1974 1975 1976 1977 1978 1979
5135 3558 4131 3989 6962 4634 4540 4523
2315 2743 3661 3878 3376 4004 3489 3724
286 241 250 217
242 379 750
1980 1981 1982
3887 1671 1154
3472 3520 4124
726 1057 767
AVERAGE PERCENT
4016 47
3482 41
467 5
in tonnes. These of the unspecified
may not be exact due
1972 - 1982
OTHER TOTAL
558 8294 363 6905 443 8485 ~~n
~~7 8443 630 11193 350 9230 623 9031 999 9996
207 8292 541 6789 135 6180
473 8439 5
A major problem in the sampling of American plaice is discardin~ at sea. Studies in 1959-61 (Jean, 1963), 1976 (Maclaren Atlantic, MS 1978) and 1980 have shown levels of 30-60% discards b~ weight and 55-85% b~ number. All fish under 30cm and a decreasin~ percenta~e of each len~th interval above that size are discarded at sea. This poses a serious problem and reQuires either accurate on board sampling of 'catch', or faith in ?a$t discard studies and the assumption of a fleet with similiar discard habits. In the past, of necessity, we have accepted the latter.
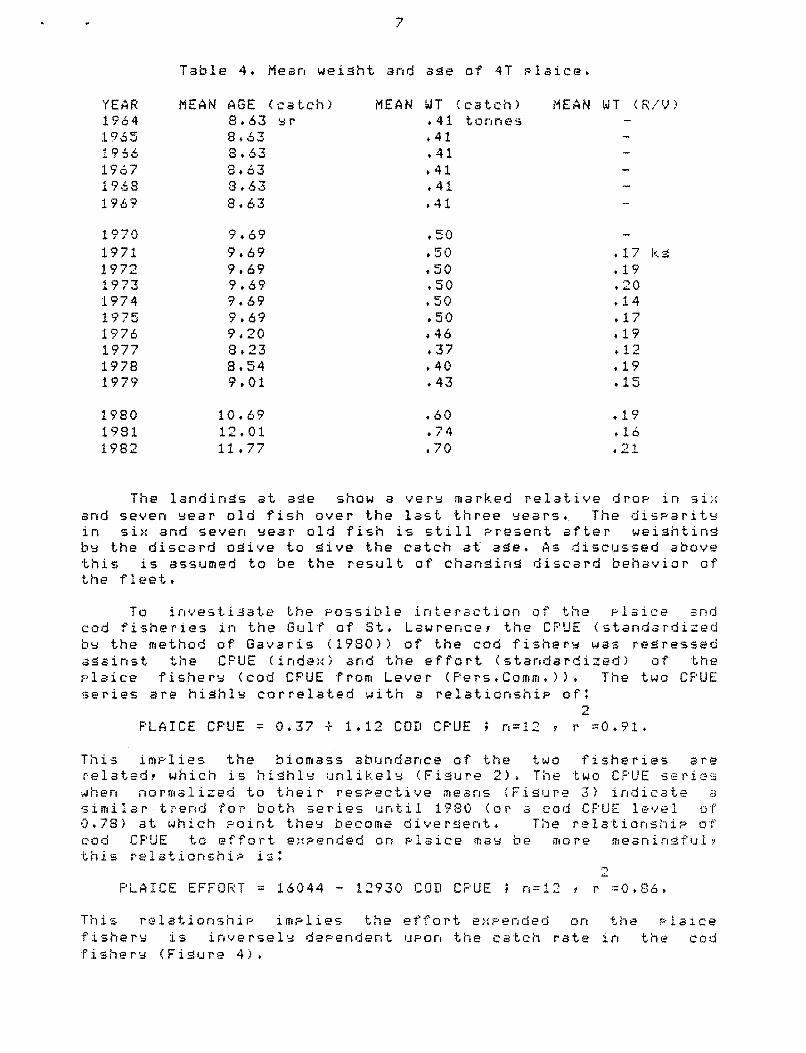
The mean age and weight of fish in the catch has dramaticall~ increased in the last two ~ears over previous years (Table 4) This ma~ be as a result of a stron~ ~ear class moving into the older a~e ~roups and/or a poor recruitment in recent sears or an increasinS rate of discarding of small fish due to the abundance of cod. It is probable that the abundance of cod is making it both unnecessar~ and uneconomical to sort the relativel~ small and decreasins percentaSe of plaice in the catch. The mean weights of fish causht in the R/V surve~s do not show the same marked ~rend - indicatins the latter assumption is the more likel~ (Table 4).
7
Table 4. Mean wei~ht and a~e of 4T plaice.
YEAR MEAN AGE (catch) MEAN WT (catch) MEAN WT (R/I,) 1964 8.63 .41 tonnes~r
The landings at a~e show a ver~ marked relative drop in six and seven ~ear old fish over the last three ~ears. The disparity in six and seven ~ear old fish is still present after wei~htins
b~ the discard oaive to ~ive the catch at age. As discussed above this is assumed to be the result of changing discard behavior of the fleet.
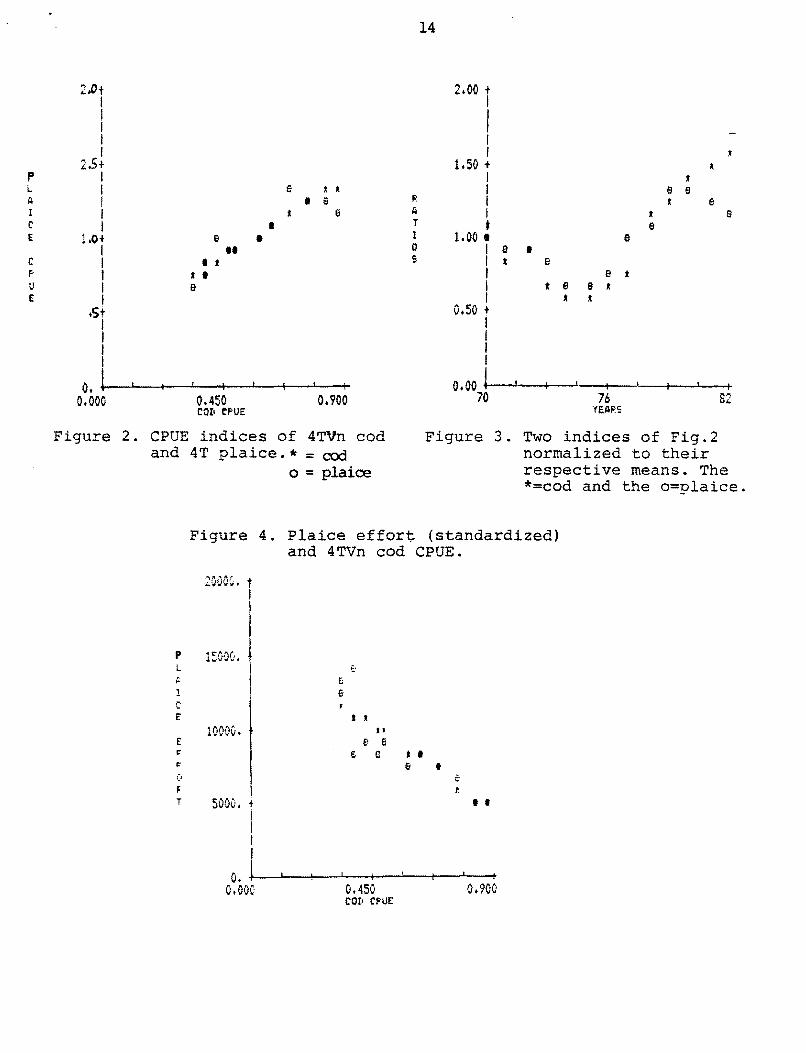
To investisate the possible interaction of the plaice and cod fisheries in the Gulf of St. Lawrence, the CPUE (standardized by the method of Gavaris (1980» of the cod fisher~ was regressed a~ainst the CPUE (index) and the effort (standardized) of the plaice fisher~ (cod CPUE from Lever (Pers.Comm.». The two CPUE series are hi~hl~ correlated with a relationship of:
This implies the biomass abundance of the two fisheries are related, which is hiahl~ unlikel~ (Figure 2). The two CPUE series when normalized to their respective means (Figure 3) indicate a similar trend for both series until 1980 (or a cod CPUE level of 0.78) at which point the~ become divergent. The relationship of cod CPUE to effort expended on plaice ma~ be more meaningful, this relationship 1· ~:>+•
This relationship implies the effort expended on the plaice fisher~ is inversel~ dependent upon the catch rate in the cad fishery (Figure 4).
8
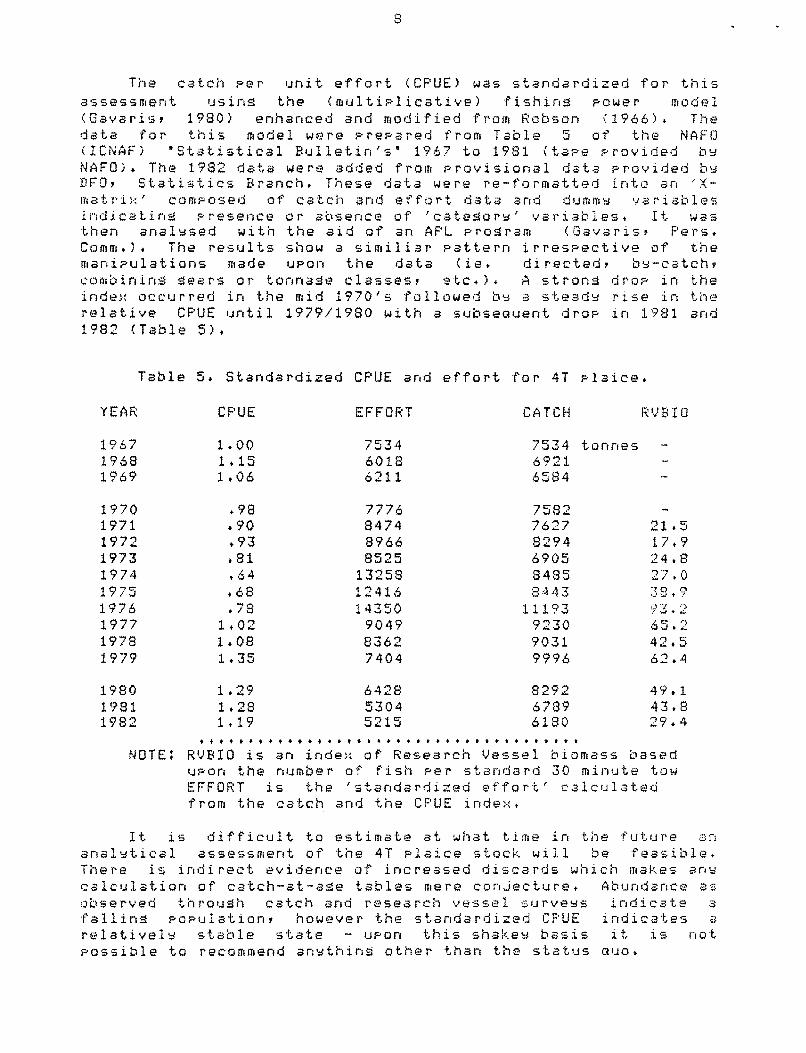
The catch per unit effort (CPUE) was standardized for this assessment using the (multiplicative) fishing power model (Gavaris, 1980) enhanced and modified from Robson (1966). The data for this model were prepared from Table 5 of the NAFO (ICNAF) 'Statistical Bulletin's' 1967 to 1981 (tape provided b~
NAFO). The 1982 data were added from provisional data provided b~ Dro, Statistics Branch. These data were re-formatted into an 'Xmatrix' composed of catch and effort data and dumm~ variables indicating presence or absence of 'categor~' variables. It was then anal~sed with the aid of an APL program (Gavaris, Pers. Comm,), The results show a similiar pattern irrespective of the manipulations made upon the data (ie. directed, b~-catch,
combining gears or tonnase classes, etc.), A strong drop in the index occurred in the mid 1970's followed b~ a stead~ rise in the relative CPUE until 1979/1980 with a subseauent drop in 1981 and 1982 (Table 5).
Table 5. Standardized CPUE and effort for 4T plaice.
NOTE: RVBIO is an index of Research Vessel biomass based upon the number of fish per standard 30 minute tow EFFORT is the 'standardized effort' calculated from the catch and the CPUE index.
It is difficult to estimate at what time in the future an anal~tical assessment of the 4T plaice stock will be feasible. There is indirect evidence of increased discards which makes ans calculation of catch-at-ase tables mere conjecture. Abundance as observed through catch and research vessel surve~s indicate a falling population, however the standardized CPUE indicates a relativel~ stable state - upon this shake~ basis it is not possible to recommend an~thing other than the status auo.
9
There are serious ramifications for the plaice fishery in view of the risinS catch rate of 4TVn cod. Two options exist for the management of this groundfish fishery. The first is through catch and effort restrictions (F 0.1 fishing levels). As this is a by-catch fishery of a relativelY uneconomical product, it is likely that discarding will continue aDd will be related to the catch rate of cod. This will continue to result in severe under reporting of Juvenile catches and of the massive destruction of recruiting wear classes. The catch/effort data are therefore inadeauate for the very manaSement that is supposed to control it.
The second management option is through the use of mesh size regulations. The very different mesh selection factors of flatfish compared to gadoids results in catches of Juvenile plaice which must be discarded (without recording) at sea. The apparent 'availability' of Juvenile plaice is inversely related to the catch rate of cod. LarSer mesh sizes for a directed plaice fishery would result in increased yields of 6+ year old fish, and reduce the costs associated with sorting undersized fish. However, mesh size limits that would result in a less destructive directed plaice fishery would do little to ease the problem unless a way could be found to reduce the undersized bY-catch of plaice in the cod fishery.
WINTER FLOUNDER
Over 95% of the landings of winter flounder are from the southern Gulf - NAFO division 4T. It is predominantly a small vessel, inshore, summer/autumn fishery, The mean landings over tl1e last twenty years have been in excess of 2000 tonnes <Table 1). The major portion of the landings has been with small trawlers (tonnage class 1 I 2).
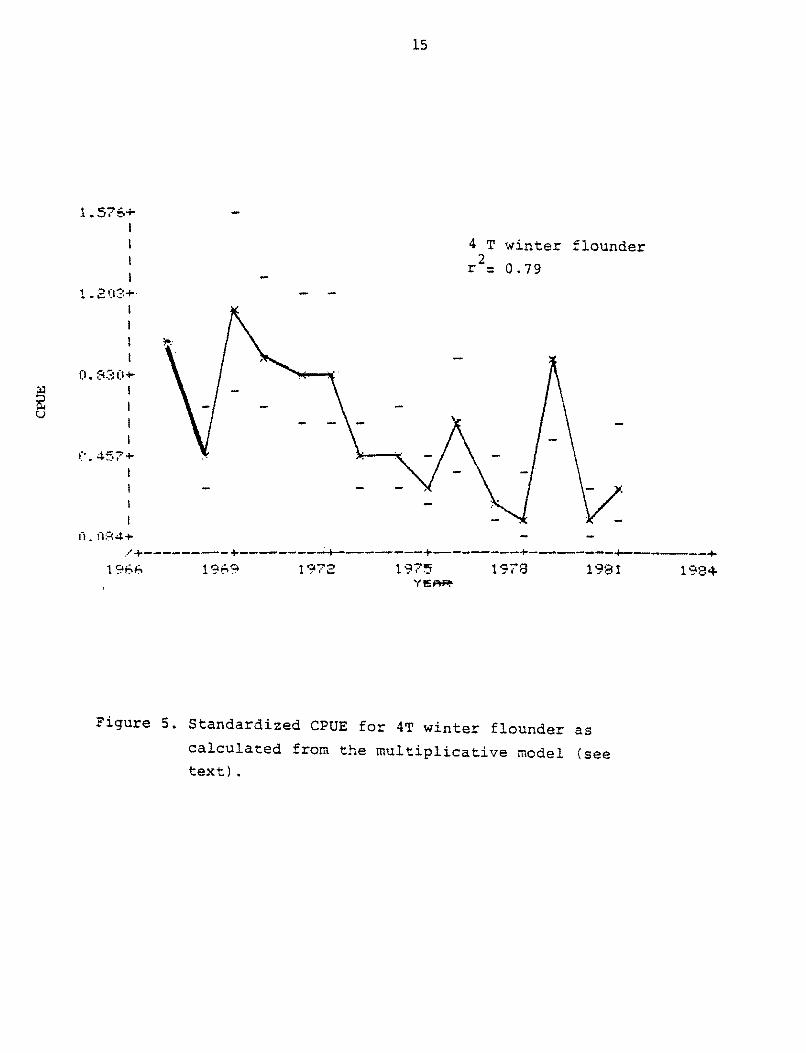
The catch per unit effort (CPUE) of winter flounder was calculated with the aid of the multiplicative model (Gavaris,1980). Their appears to be a decreasing trend over the last 20 years (Figure 5). The high CPUE of 1979 does not appear to be reflected in the landings.
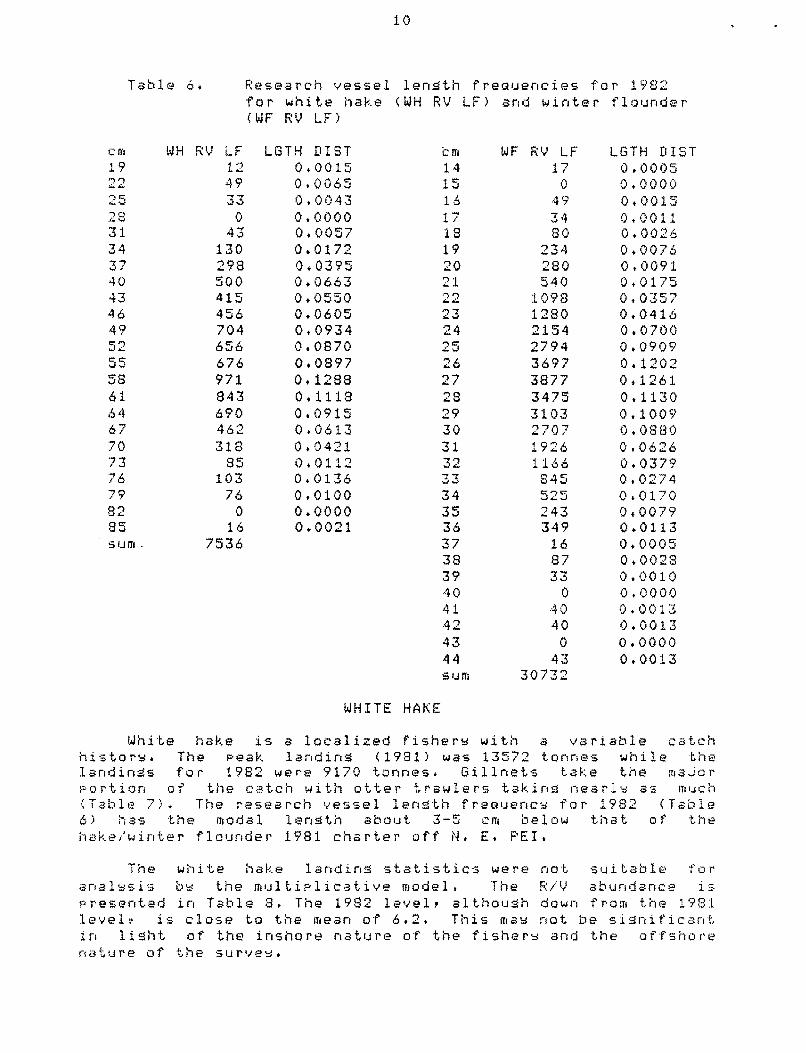
Research vessel lenSth freauencies for 1982 sexes combined are presented in Table 6. The modal lengths for males and females separately are 1 cm less than the respective modal lensths from the 1981 hake/winter flounder charter off N. E. PEl.
10
Table 6. Research vessel lensth freQuencies for 1982 for white hake CWH RV LF) and winter flounder (WF RV LF)
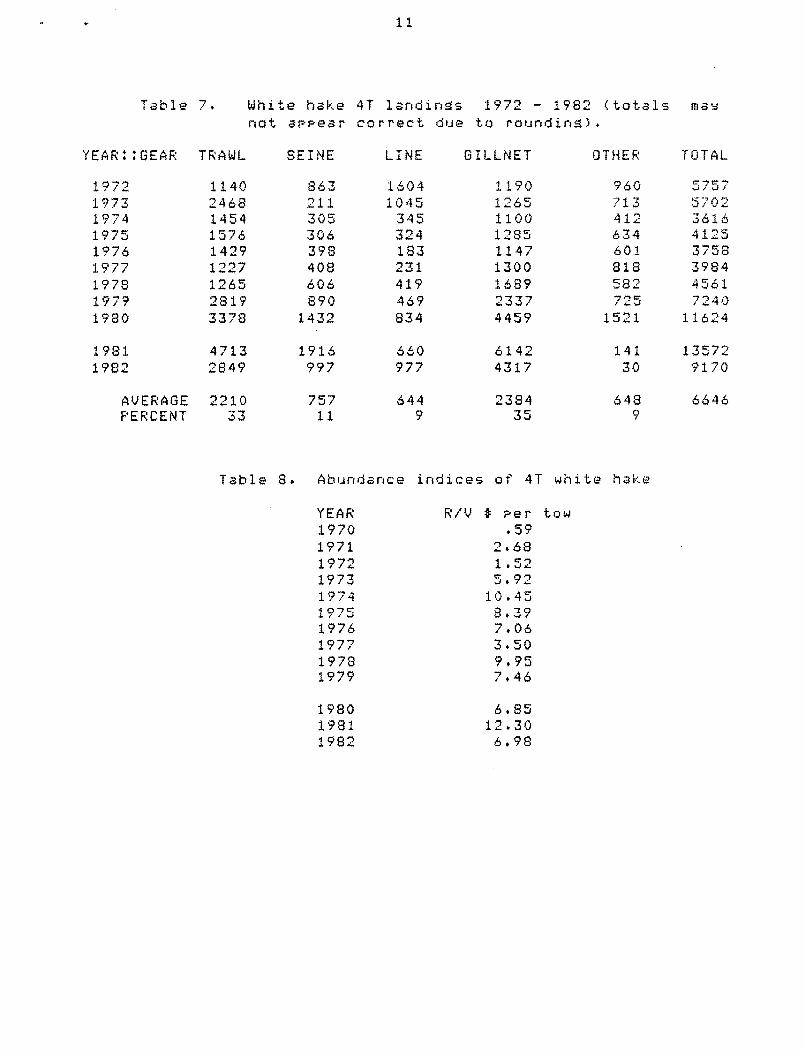
White hake is a localized fisher~ with a variable catch histor~. The peak land ins (1981) was 13572 tonnes while the landinss for 1982 were 9170 tonnes. Gillnets take the major portion of the catch with otter trawlers takins nearl~ as much (Table 7). The research yessel lensth freguenc~ for 1982 (Table 6) has the modal lensth about 3-5 em below that of the hake/winter flounder 1981 charter off N. E. PEl.
The white hake landing statistics were not suitable for analssis bs the multiplicative model. The R/V abundance is presented in Table 8. The 1982 level, although down from the 1981 level. is close to the mean of 6.2. This ma~ not be significant in light of the inshore nature of the fishers and the offshore nature of the surves.
11
Table 7. White hake not appear
4T landings correct due
1972 - 1982 (totals to round i ng) •
ITIa~
YEAR: : GEAF: TRAWL SEINE LINE GILLNET OTHER TOTAL
Bowerins, W.R. (1981) Witch flounder in the northern Gulf of St. lawrence (NAFO Divisions 4RS). CAFSAC Res. Doc. 81/52.
Gavaris, S. (1980) Use of a multiplicative model to estimate catch rate and effort from commercial data. Can. J. Fish. Aauat. Sci. 37(12):2272-2275.
Jean, Y. (1963) Discards of fish at sea bw northern New Brunswick drassers. J. FRB Canada. 20(2):497-524.
Maclaren Atlantic ltd. (1978) Analwsis of discards in the Gulf of St. lawrence plaice fisherw (MS). [Not cited in the orisinal - referenced in CAFSAC R~s. Doc. 78/14 Schwe1sert(1978).J
Robson, D.S. (1966) Estimation of the relative fishinS power of individual ships. ICNAF Res. Bull. 3:5-14.
Schweisert, J. (1978) Simulation and assessment of the dwnamics of American plaice stocks in the Gulf of St. lawrence (4T). CAFSAC Res. Doc. 78/14. pp28.


![Fashion 4.0. Innovating Fashion Industry Through Digital ...ualresearchonline.arts.ac.uk/13190/7/Fashion 4.0 final submission[1].pdfI4.0 solutions in fashion industry, also showing](https://static.documents.pub/doc/80x56/5e8c68d0134e723711692439/fashion-40-innovating-fashion-industry-through-digital-40-final-submission1pdfi40.jpg)


