93
NOTES: CH 25 - The History of Life on Earth
| Date post: | 26-Dec-2015 |
| Category: |
Documents |
| Upload: | mildred-evans |
| View: | 218 times |
| Download: | 2 times |

NOTES: CH 25 - The History of Life on Earth

Origin of Earth4500
History of Life
Boundaries between units in
the Geologic Time Scale are
marked by dramatic biotic
change
Eras

Overview: Lost Worlds
● Past organisms were very different from those now alive
● The fossil record shows macroevolutionary changes over large time scales, for example:
– The emergence of terrestrial vertebrates
– The impact of mass extinctions
– The origin of flight in birds


Prebiotic Chemical Evolution:
● Earth’s ancient environment was different from today:
-very little atmospheric oxygen
-lightning, volcanic activity, meteorite, bombardment, UV radiation were all more intense

● Chemical evolution may have occurred in four stages:
1) abiotic synthesis of monomers
2) joining of monomers into polymers
(e.g. proteins, nucleic acids)
3) formation of protocells (droplets
formed from clusters of molecules)
4) origin of self-replicating molecules
that eventually made inheritance
possible (likely that RNA was first)
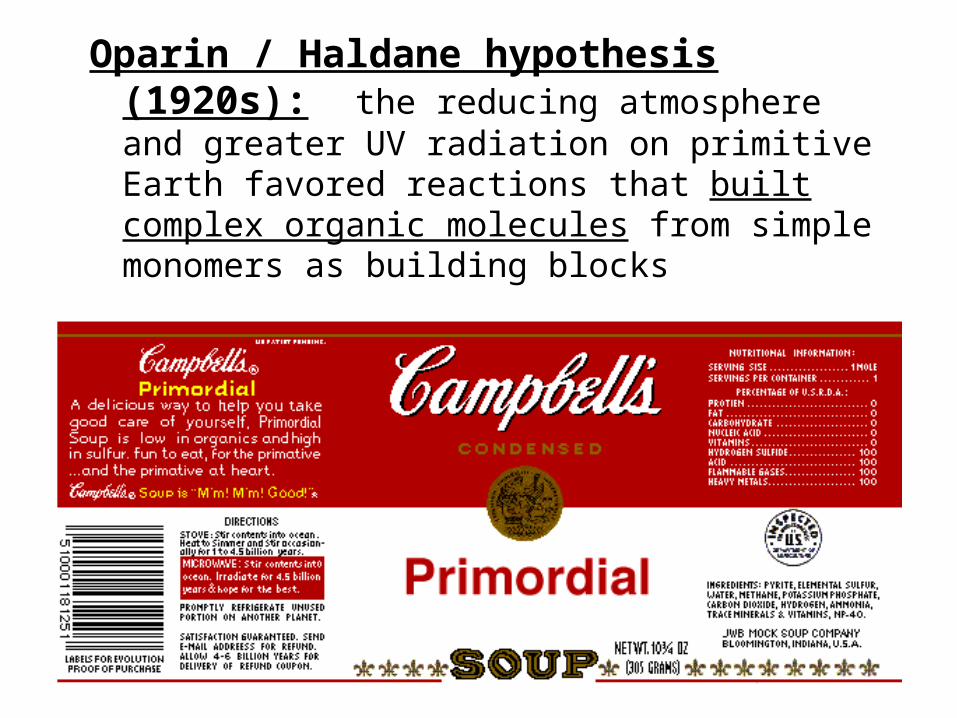
Oparin / Haldane hypothesis (1920s): the reducing atmosphere and greater UV radiation on primitive Earth favored reactions that built complex organic molecules from simple monomers as building blocks

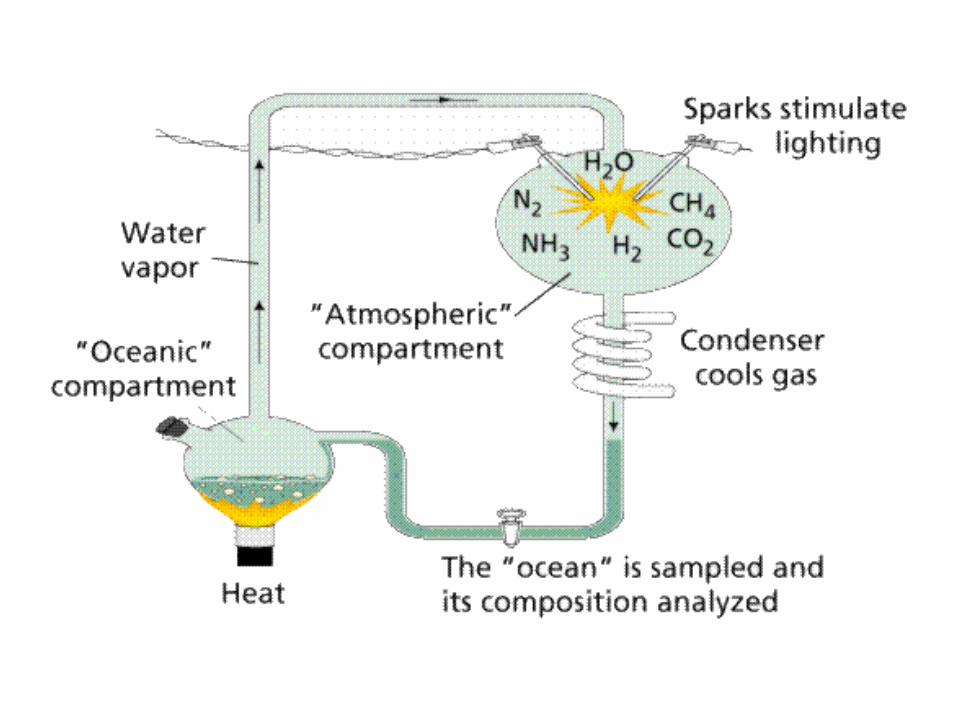
Miller / Urey experiment:Simulated conditions on early Earth by
constructing an apparatus containing H2O, H2,
CH4, and NH3.
Results:
● They produced amino acids and other organic molecules.
● Additional follow-up experiments have produced all 20 amino acids, ATP, some sugars, lipids and purine and pyrimidine bases of RNA and DNA.

Mas
s o
f am
ino
ac
ids
(mg
)
Nu
mb
er o
f am
ino
aci
ds
20
10
01953 2008
200
100
01953 2008

● Protocells: collections of abiotically produced molecules able to maintain an internal environment different from their surroundings and exhibiting some life properties such as metabolism, semipermeable membranes, and excitability
(experimental evidence
suggests spontaneous
formation of
protocells)


Abiotic genetic replication

possible formationof protocells;self-repliating RNAas early “genes”

Origin of Life - Different Theories:
*Experiments indicate key steps that could have occurred.
● Panspermia: some organic compounds may have reached Earth by way of meteorites and comets
meteorite

● Sea floor / Deep-sea vents: hot water and minerals emitted from deep sea vents may have provided energy and chemicals needed for early protobionts
● Simpler hereditary systems (self-replicating molecules) may have preceded nucleic acid genes.

Phylogeny: the evolutionary history of a species
● Systematics: the study of biological diversity in an evolutionary context
● The fossil record: the ordered array of fossils, within layers, or strata, of sedimentary rock
● Paleontologists: collect and interpret fossils

● A FOSSIL is the remains or evidence of a living thing
-bone of an organism or the print of a shell in a rock
-burrow or tunnel left by an ancient worm
-most common fossils: bones, shells, pollen grains, seeds.

Dimetrodon
Stromatolites
Fossilizedstromatolite
Coccosteuscuspidatus
4.5 cm
0.5 m
2.5
cm
Present
Rhomaleosaurus victor
Tiktaalik
Hallucigenia
Dickinsonia costata
Tappania
1 cm
1 m
100 mya
175200
300
375400
500525
565600
1,500
3,500
270
Figure 25.4
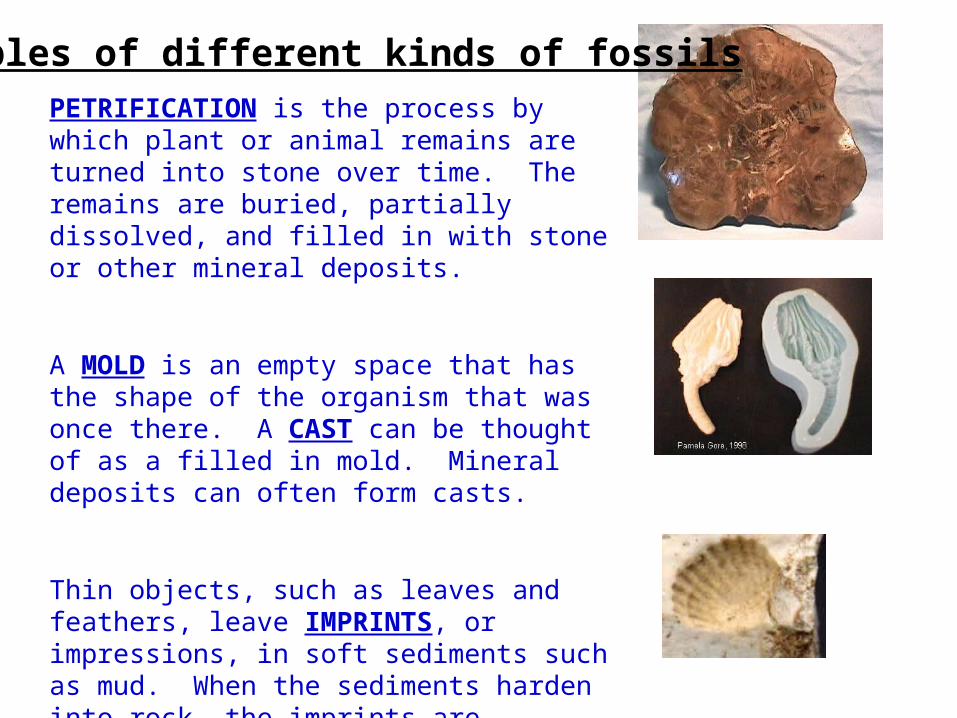
PETRIFICATION is the process by which plant or animal remains are turned into stone over time. The remains are buried, partially dissolved, and filled in with stone or other mineral deposits.
A MOLD is an empty space that has the shape of the organism that was once there. A CAST can be thought of as a filled in mold. Mineral deposits can often form casts.
Thin objects, such as leaves and feathers, leave IMPRINTS, or impressions, in soft sediments such as mud. When the sediments harden into rock, the imprints are preserved as fossils.
Examples of different kinds of fossils

PRESERVATION OF ENTIRE ORGANISMS: It is quite rare for an entire organism to be preserved because the soft parts decay easily. However, there are a few special situations that allow organisms to be preserved whole.
FREEZING: This prevents substances from decaying. On rare occasions, extinct species have been found frozen in ice.
AMBER: When the resin (sap) from certain evergreen trees hardens, it forms a hard substance called amber. Flies and other insects are sometimes trapped in the sticky resin that flows from trees. When the resin hardens, the insects are preserved perfectly.

TAR PITS: These are large pools of tar. Animals could get trapped in the sticky tar when they went to drink the water that often covered the pits. Other animals came to feed on these animals and then also became trapped.
TRACE FOSSILS: These fossils reveal much about an animal’s appearance without showing any part of the animal. They are marks or evidence of animal activities, such as tracks, burrows, wormholes, etc.

The fossil record● Sedimentary rock: rock
formed from sand and mud that once settled on the bottom of seas, lakes, and marshes
Methods for Dating Fossils:● RELATIVE DATING: used to
establish the geologic time scale; sequence of species
● ABSOLUTE DATING: radiometric dating; determine exact age using half-lives of radioactive isotopes

Where would you expect to find older fossils and where are the younger fossils?
Why?

Relative Dating:
● What is an INDEX FOSSIL?
fossil used to help determine the relative age of the fossils around it
must be easily recognized and must have existed for a short period BUT over wide geographical area.


Radiometric Dating:
● Calculating the ABSOLUTE age of fossils based on the amount of remaining radioactive isotopes it contains.
Isotope = atom of an element that has a number of neutrons different from that of other atoms of the same element

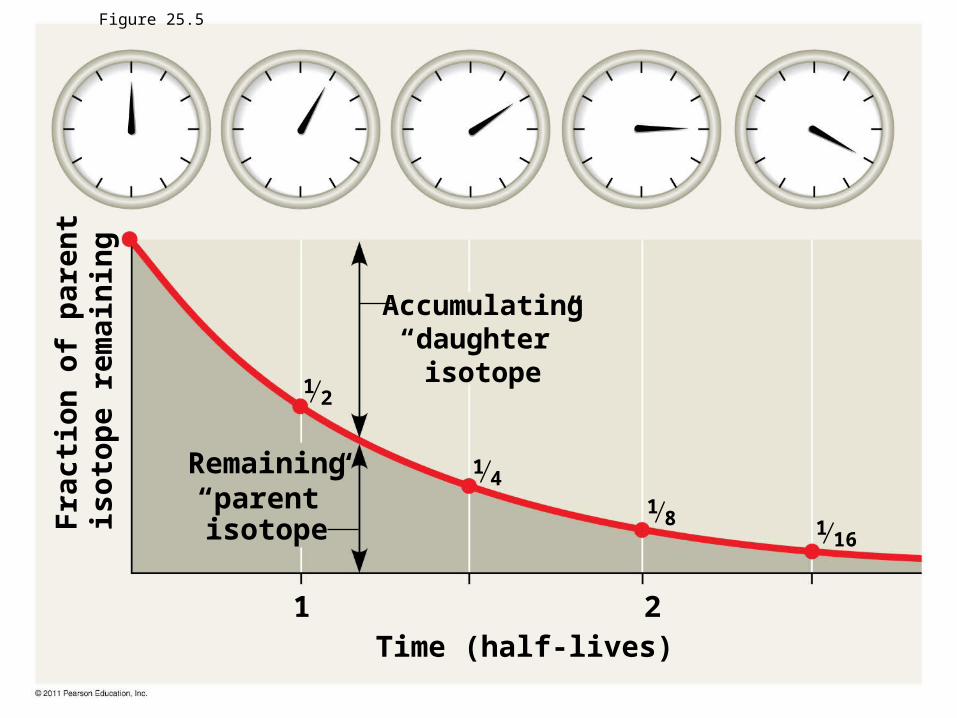
Radiometric Dating:
● Certain naturally occurring elements / isotopes are radioactive, and they decay (break down) at predictable rates
● An isotope (the “parent”) loses particles from its nucleus to form a isotope of the new element (the “daughter”)
● The rate of decay is expressed in a “half-life”

0
50
100
150
200
250
0 5 10 15 20
Amount
Tim
e
Parent
Daughter
Accumulating “daughter”
isotope
Fra
ctio
n o
f p
aren
t is
oto
pe
rem
ain
ing
Remaining “parent” isotope
Time (half-lives)1 2 3 4
12
14
18 1
16
Figure 25.5

Half life= the amount of time it takes for ½ of a radioactive element to decay.
To determine the age of a fossil:1) compare the amount of the “parent”
isotope to the amount of the “daughter” element
2) knowing the half-life, do the math to calculate the age!

Parent Isotope Daughter Half-Life
Uranium-238 Lead-206 4.5 billion years
Uranium-235 Lead-207 704 million years
Thorium-232 Lead-208 14.0 billion years
Rubidium-87 Strontium-87 48.8 billion years
Potassium-40 Argon-40 1.25 billion years
Samarium-147 Neodymium-143 106 billion years

Radioactive Dating:
Example: Carbon 14
● Used to date material that was once alive
● C-14 is in all plants and animals
(C-12 is too, but it does NOT decay!)
● When an organism dies, the amount of C-14 decreases because it is being converted back to N-14 by radioactive decay
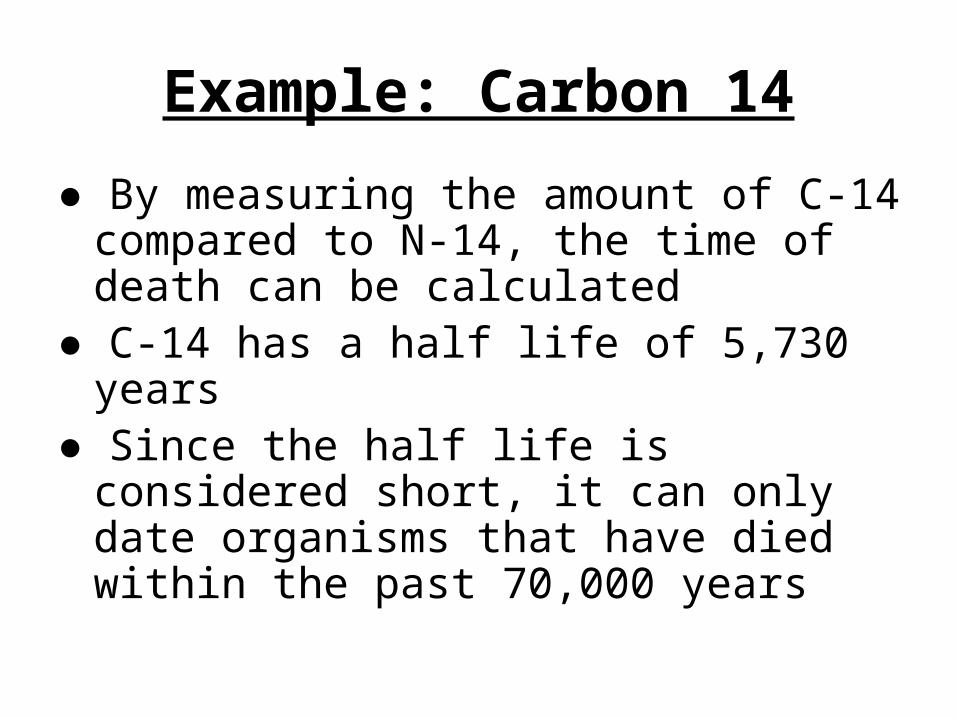
Example: Carbon 14
● By measuring the amount of C-14 compared to N-14, the time of death can be calculated
● C-14 has a half life of 5,730 years● Since the half life is considered short, it
can only date organisms that have died within the past 70,000 years

Radioactive Decay of Potassium-40
0
20
40
60
80
100
120
140
160
180
200
220
0 0.5 1 1.5 2 2.5 3 3.5 4 4.5 5 5.5 6 6.5 7 7.5 8 8.5 9 9.5 10 10.5 11
Time (billions of years)
Am
ou
nt
of
Po
tas
siu
m-4
0 (g
)
What is the half-life of Potassium-40?How many half-lives will it take for Potassium-40 to decay to 50 g? How long will it take for Potassium-40 to decay to 50 g?

Radioactive Decay of Potassium-40
0
20
40
60
80
100
120
140
160
180
200
220
0 0.5 1 1.5 2 2.5 3 3.5 4 4.5 5 5.5 6 6.5 7 7.5 8 8.5 9 9.5 10 10.5 11
Time (billions of years)
Am
ou
nt
of
Po
tas
siu
m-4
0 (g
)
What is the half-life of Potassium-40? 1.2 billion yearsHow many half-lives will it take for Potassium-40 to decay to 50 g? 2 half-livesHow long will it take for Potassium-40 to decay to 50g? 2.6 billion yrs.
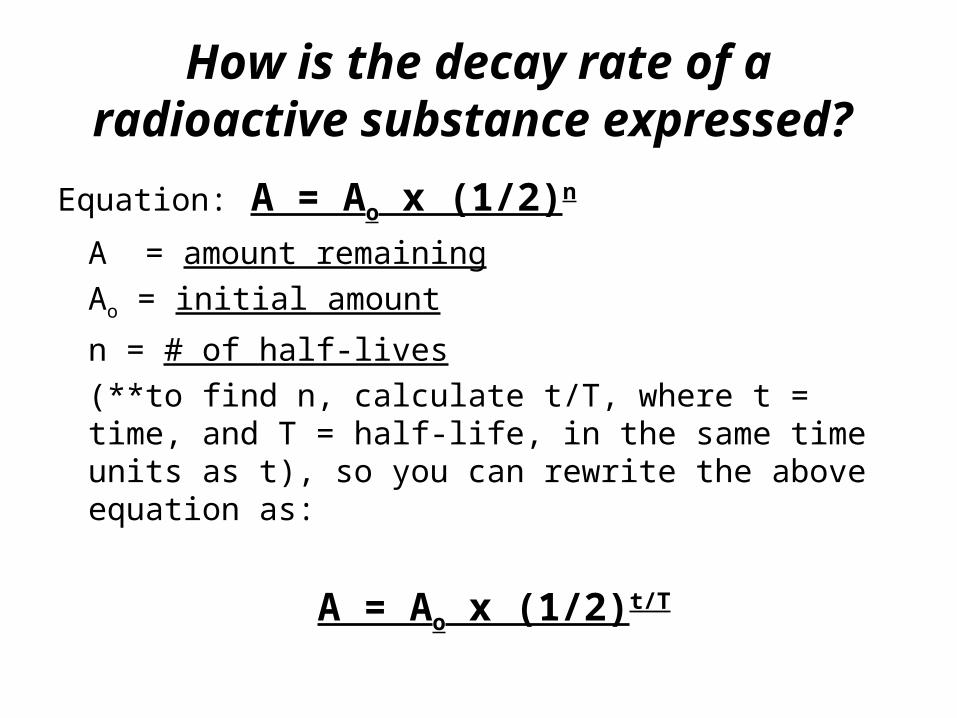
How is the decay rate of a radioactive substance expressed?
Equation: A = Ao x (1/2)n
A = amount remaining
Ao = initial amount
n = # of half-lives
(**to find n, calculate t/T, where t = time, and T = half-life, in the same time units as t), so you can rewrite the above equation as:
A = Ao x (1/2)t/T

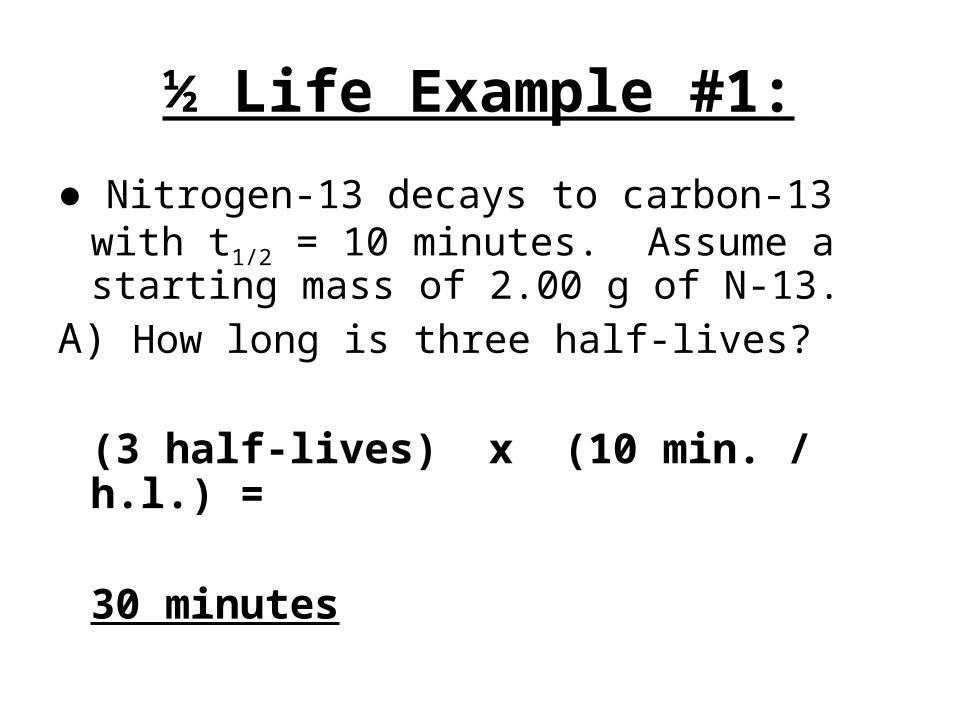
½ Life Example #1:
● Nitrogen-13 decays to carbon-13 with t1/2 = 10 minutes. Assume a starting mass of 2.00 g of N-13.
A) How long is three half-lives?
B) How many grams of the isotope will still be present at the end of three half-lives?
½ Life Example #1:
● Nitrogen-13 decays to carbon-13 with t1/2 = 10 minutes. Assume a starting mass of 2.00 g of N-13.
A) How long is three half-lives?
(3 half-lives) x (10 min. / h.l.) =
30 minutes

½ Life Example #1:
● Nitrogen-13 decays to carbon-13 with t1/2 = 10 minutes. Assume a starting mass of 2.00 g of N-13.
B) How many grams of the isotope will still be present at the end of three half-lives?
2.00 g x ½ x ½ x ½ = 0.25 g

½ Life Example #1:
● Nitrogen-13 decays to carbon-13 with t1/2 = 10 minutes. Assume a starting mass of 2.00 g of N-13.
B) How many grams of the isotope will still be present at the end of three half-lives?
A = Ao x (1/2)n
A = (2.00 g) x (1/2)3
A = 0.25 g
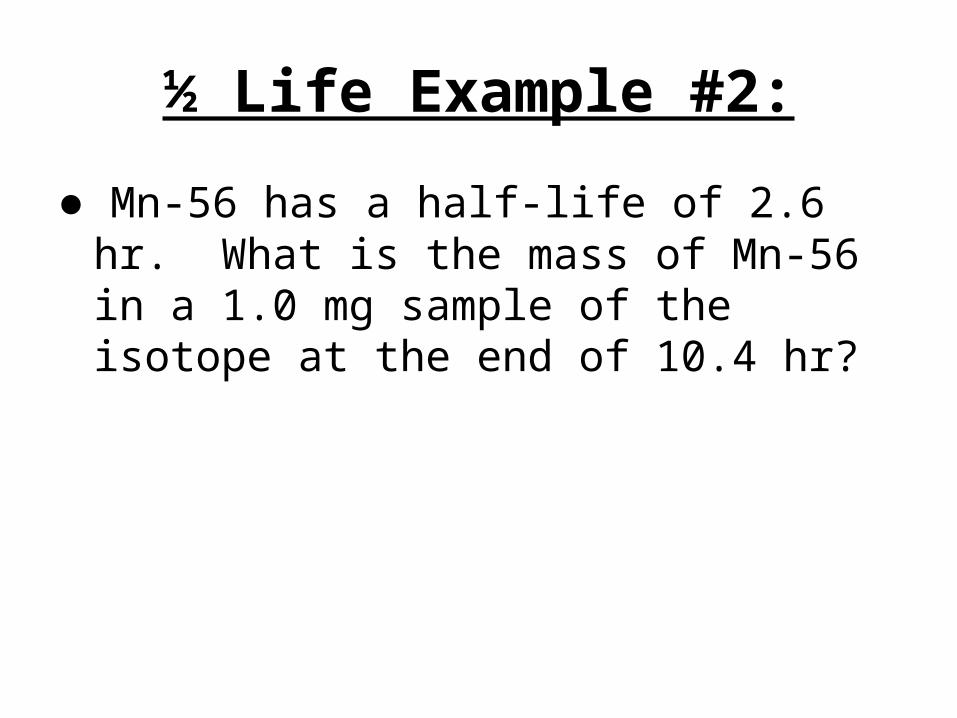
½ Life Example #2:
● Mn-56 has a half-life of 2.6 hr. What is the mass of Mn-56 in a 1.0 mg sample of the isotope at the end of 10.4 hr?

½ Life Example #2:
● Mn-56 has a half-life of 2.6 hr. What is the mass of Mn-56 in a 1.0 mg sample of the isotope at the end of 10.4 hr?
A = ? n = t / T = 10.4 hr / 2.6 hr
A0 = 1.0 mg n = 4 half-lives
A = (1.0 mg) x (1/2)4 = 0.0625 mg

½ Life Example #3:
● Strontium-90 has a half-life of 29 years. What is the mass of strontium-90 in a 5.0 g sample of the isotope at the end of 87 years?

½ Life Example #3:
● Strontium-90 has a half-life of 29 years. What is the mass of strontium-90 in a 5.0 g sample of the isotope at the end of 87 years?
A = ? n = t / T = 87 yrs / 29 yrs
A0 = 5.0 g n = 3 half-lives
A = (5.0 g) x (1/2)3
A = 0.625 g

*The history of living organisms and the history of Earth are inextricably linked:
● Formation and subsequent breakup of
Pangaea affected biotic diversity

BIOGEOGRAPHY: the study of the past and present distribution of species
● Formation of Pangaea - 250 m.y.a.
(Permian extinction)
● Break-up of Pangaea – 180 m.y.a.
(led to extreme cases of geographic isolation!)
EX: Australian marsupials!
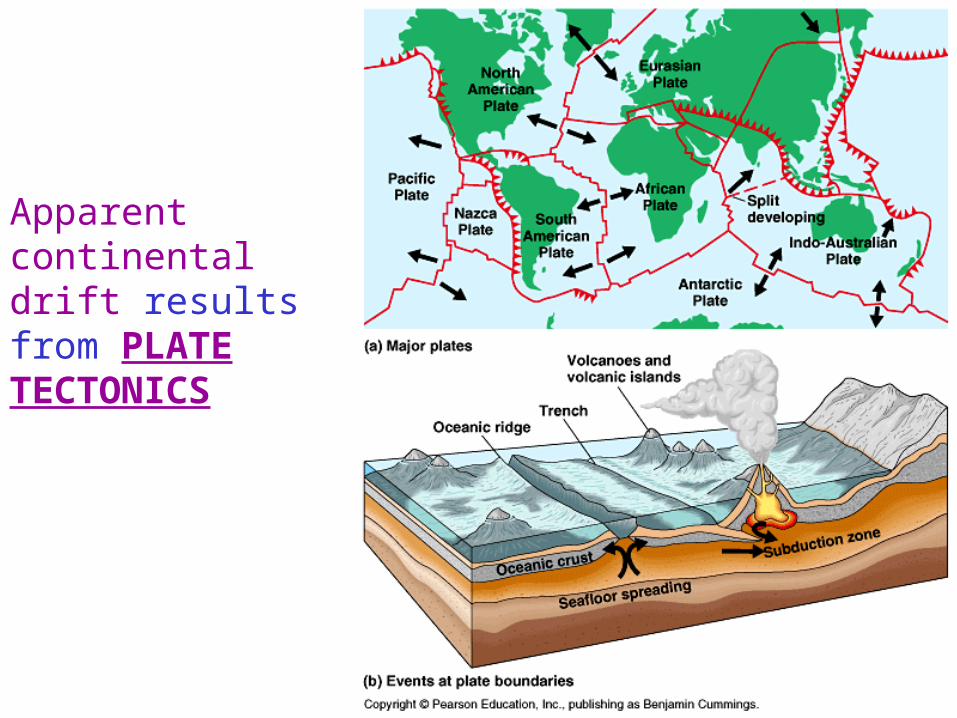
Apparent continental drift results from PLATE TECTONICS

Plate Tectonics:
● At three points in time, the land masses of Earth have formed a supercontinent: 1.1 billion, 600 million, and 250 million years ago
● According to the theory of plate tectonics, Earth’s crust is composed of plates floating on Earth’s mantle
Crust
Mantle
Outercore
Innercore

● Tectonic plates move slowly through the process of continental drift
● Oceanic and continental plates can collide, separate, or slide past each other
● Interactions between plates cause the formation of mountains and islands, and earthquakes
Plate Tectonics:
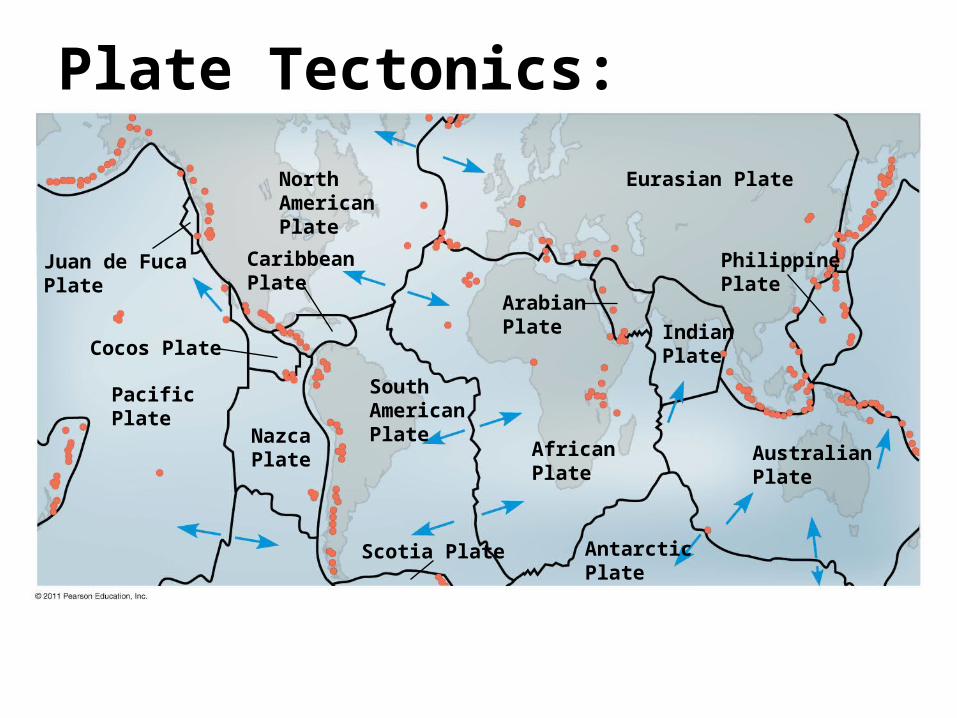
Juan de FucaPlate
NorthAmerican Plate
CaribbeanPlate
Cocos Plate
PacificPlate
NazcaPlate
SouthAmericanPlate
Eurasian Plate
Philippine Plate
Indian Plate
African Plate
Antarctic Plate
Australian Plate
Scotia Plate
Arabian Plate
Plate Tectonics:

Consequences of Continental Drift:
● Formation of the supercontinent Pangaea about 250 million years ago had many effects
– A deepening of ocean basins
– A reduction in shallow water habitat
– A colder and drier climate inland
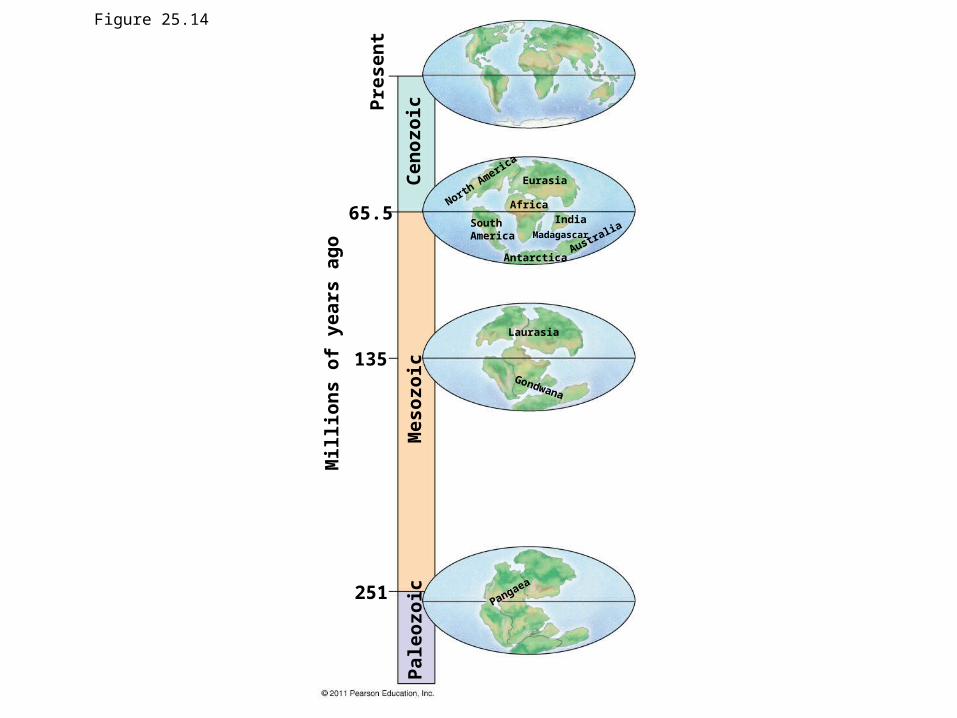
Figure 25.14
65.5
135
251
Pre
sen
t
Cen
ozo
ic
North Americ
a
Eurasia
Africa
SouthAmerica
India
Antarctica
Madagascar
Australia
Mes
ozo
icP
aleo
zoic
Mil
lio
ns
of
year
s ag
oLaurasia
Gondwana
Pangaea

● The first photosynthetic organisms released oxygen into the air and altered Earth’s atmosphere
● Members of Homo sapiens have changed the land, water, and air on a scale and at a rate unprecedented for a single species!

(CE)
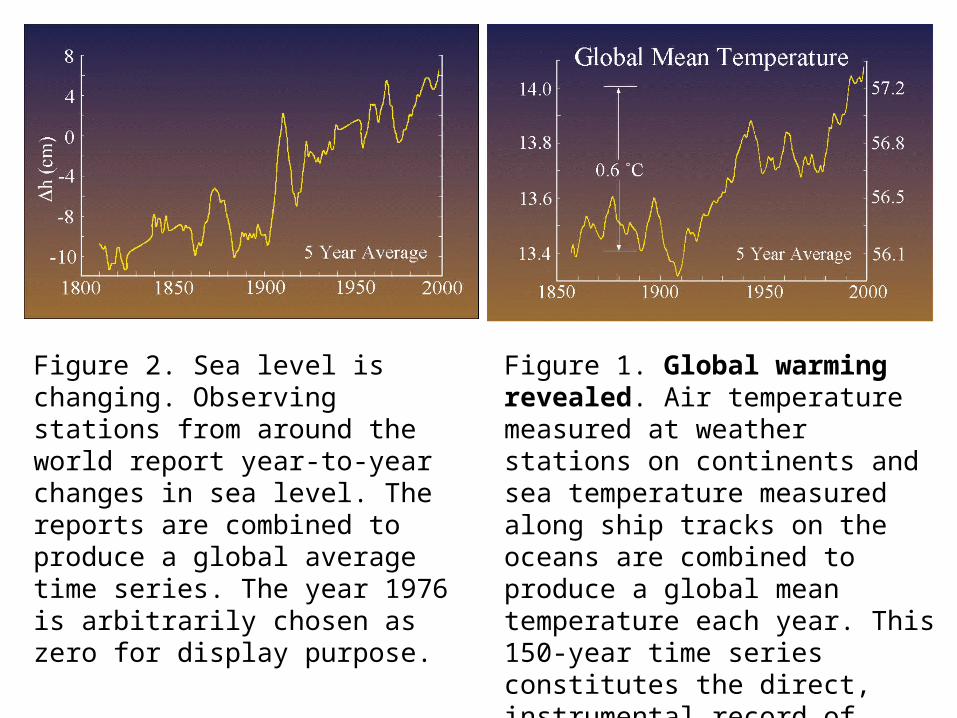
Figure 2. Sea level is changing. Observing stations from around the world report year-to-year changes in sea level. The reports are combined to produce a global average time series. The year 1976 is arbitrarily chosen as zero for display purpose.
Figure 1. Global warming revealed. Air temperature measured at weather stations on continents and sea temperature measured along ship tracks on the oceans are combined to produce a global mean temperature each year. This 150-year time series constitutes the direct, instrumental record of global warming.
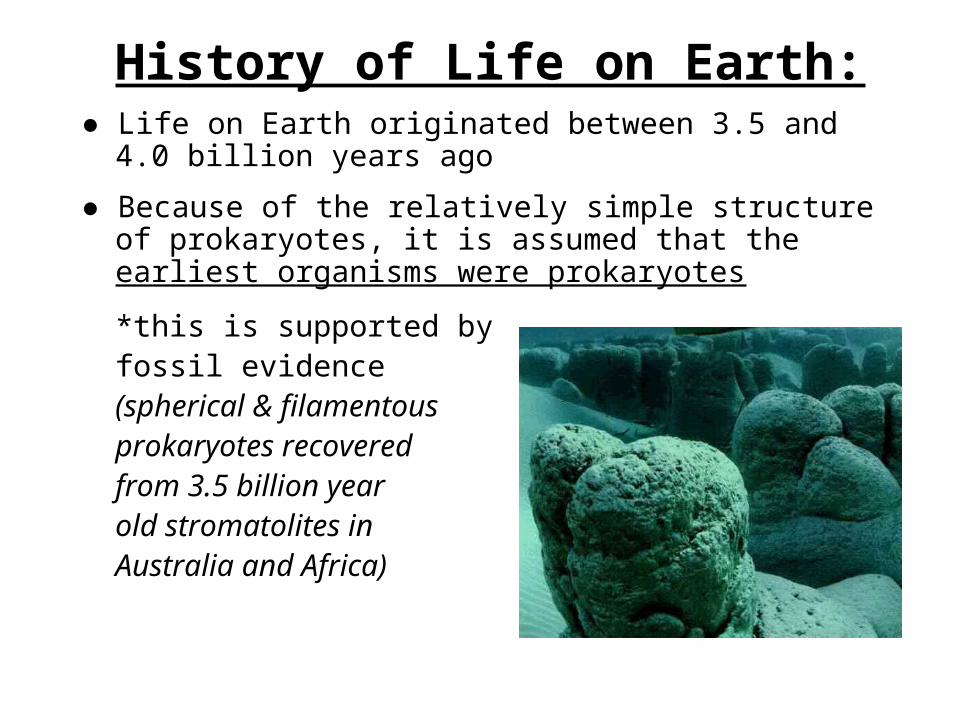
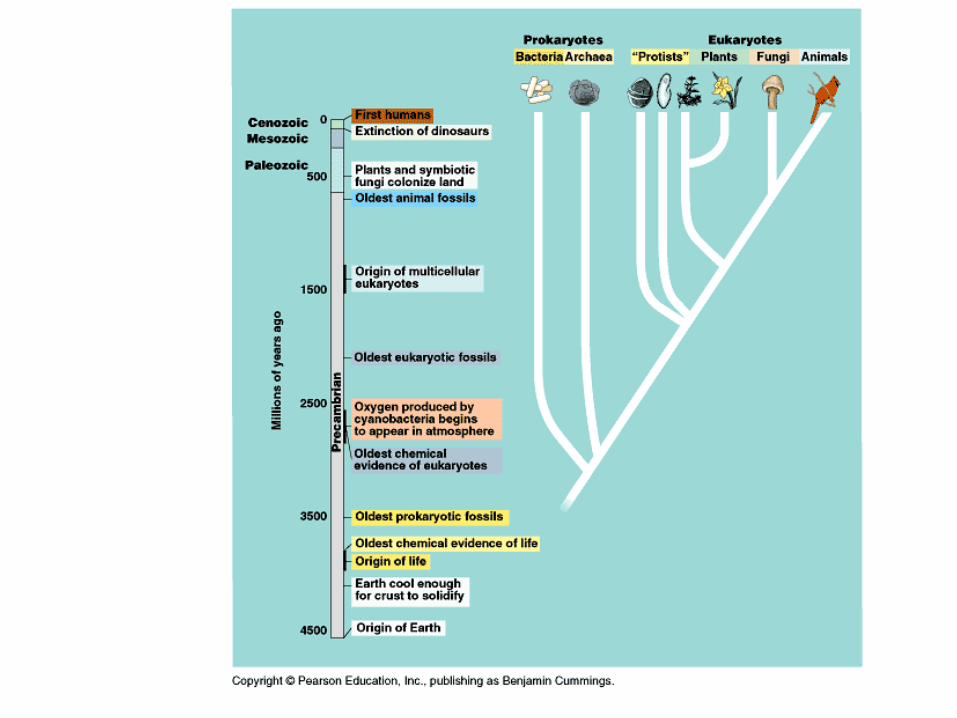
History of Life on Earth:● Life on Earth originated between 3.5 and 4.0 billion
years ago
● Because of the relatively simple structure of prokaryotes, it is assumed that the earliest organisms were prokaryotes
*this is supported by fossil evidence (spherical & filamentous prokaryotes recovered from 3.5 billion year old stromatolites in Australia and Africa)
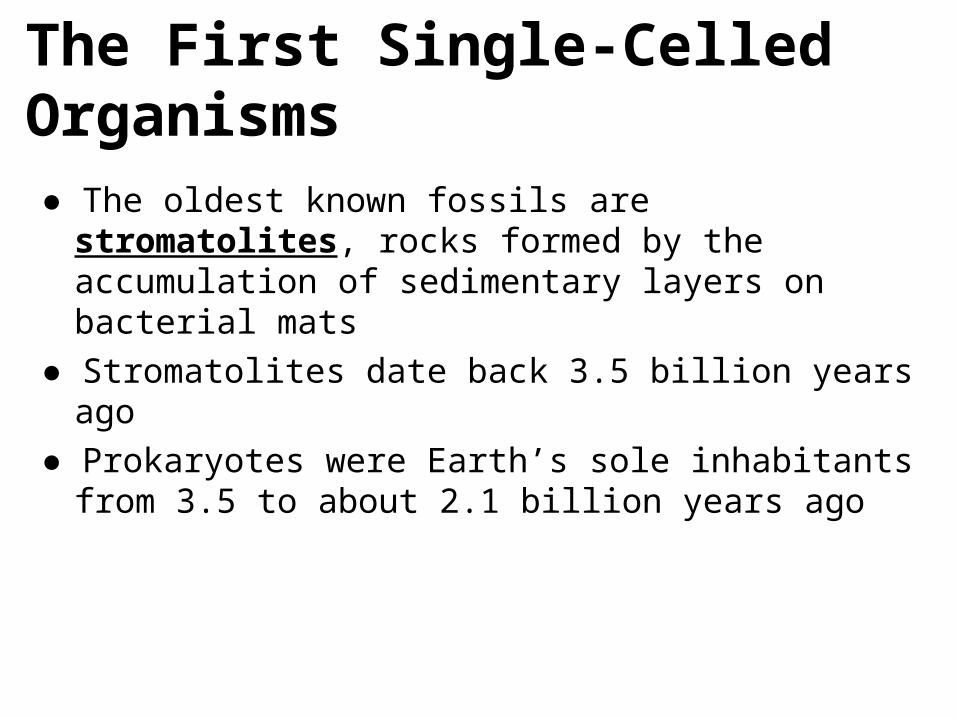
The First Single-Celled Organisms● The oldest known fossils are stromatolites, rocks
formed by the accumulation of sedimentary layers on bacterial mats
● Stromatolites date back 3.5 billion years ago
● Prokaryotes were Earth’s sole inhabitants from 3.5 to about 2.1 billion years ago
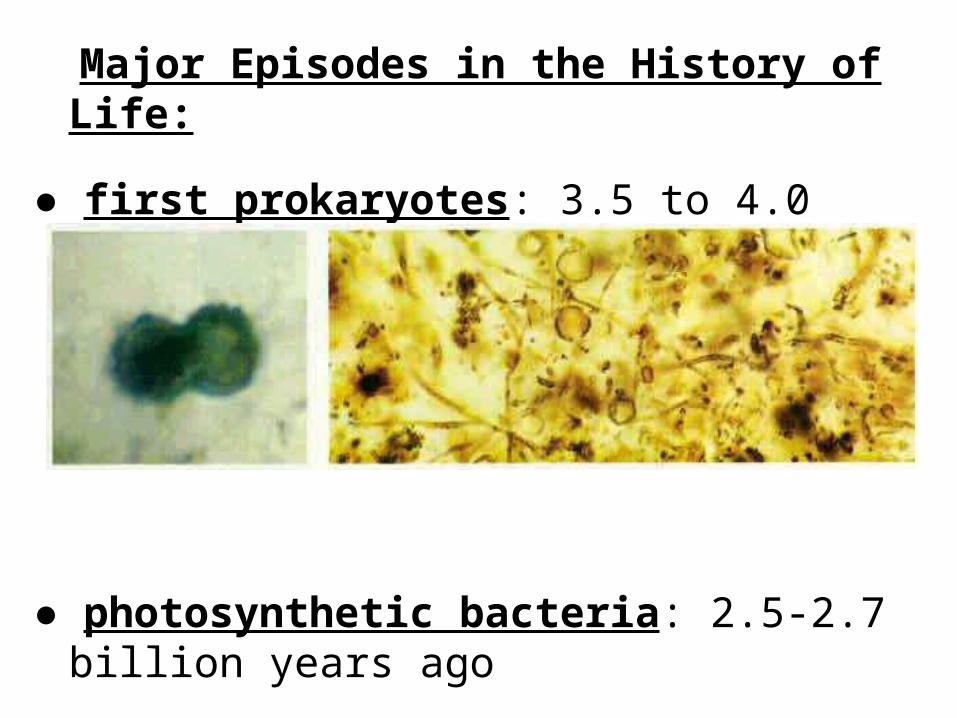
Major Episodes in the History of Life: ● first prokaryotes: 3.5 to 4.0 billion years ago
● photosynthetic bacteria: 2.5-2.7 billion years ago

Photosynthesis and the Oxygen Revolution● Most atmospheric oxygen (O2) is of biological
origin
● This “oxygen revolution” from 2.7 to 2.3 billion years ago caused the extinction of many prokaryotic groups
● Some groups survived and adapted using cellular respiration to harvest energy

Figure 25.8
“Oxygen revolution”
Time (billions of years ago)
4 3 2 1 0
1,000
100
10
1
0.1
0.01
0.0001
Atm
osp
he
ric
O2
(pe
rce
nt
of
pre
sen
t-d
ay
leve
ls;
log
sc
ale
)
0.001
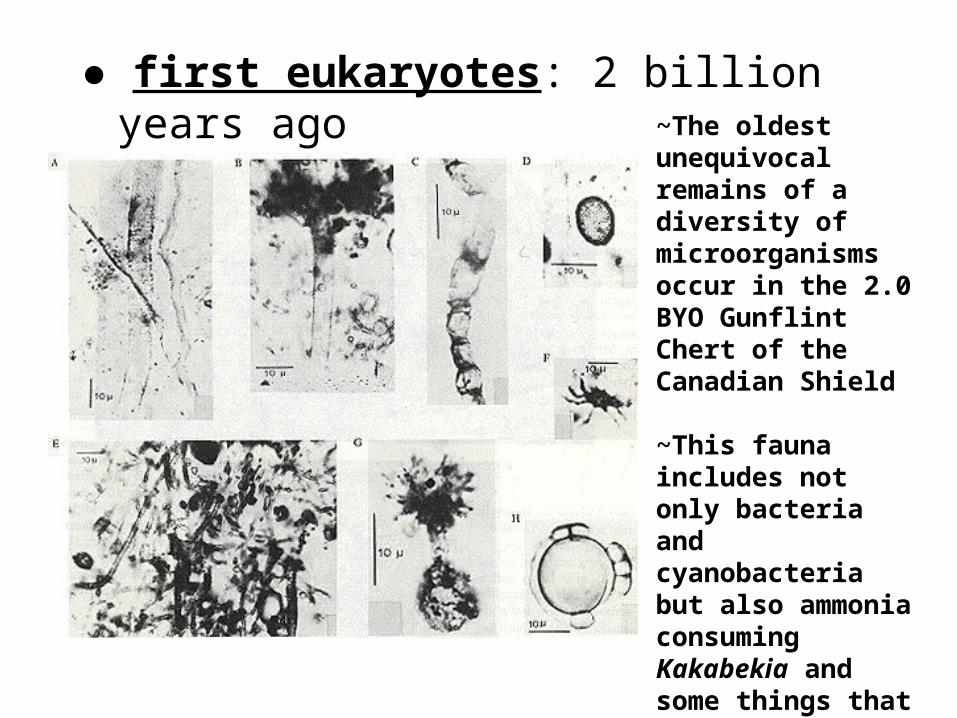
● first eukaryotes: 2 billion years ago~The oldest unequivocal remains of a diversity of microorganisms occur in the 2.0 BYO Gunflint Chert of the Canadian Shield
~This fauna includes not only bacteria and cyanobacteria but also ammonia consuming Kakabekia and some things that ressemble green algae and fungus-like organisms


The First Eukaryotes
● The oldest fossils of eukaryotic cells date back 2.1 billion years
● Eukaryotic cells have a nuclear envelope, mitochondria, endoplasmic reticulum, and a cytoskeleton
● The endosymbiont theory proposes that mitochondria and plastids (chloroplasts and related organelles) were formerly small prokaryotes living within larger host cells
● An endosymbiont is a cell that lives within a host cell

Endosymbiont Theory:
● The prokaryotic ancestors of mitochondria and plastids probably gained entry to the host cell as undigested prey or internal parasites
● In the process of becoming more interdependent, the host and endosymbionts would have become a single organism
● Serial endosymbiosis supposes that mitochondria evolved before plastids through a sequence of endosymbiotic events

Figure 25.9-1
Plasma membrane
DNA
Cytoplasm
Ancestralprokaryote
Nuclear envelope
Nucleus Endoplasmic reticulum

Figure 25.9-2
Plasma membrane
DNA
Cytoplasm
Ancestralprokaryote
Nuclear envelope
Nucleus Endoplasmic reticulum
Aerobic heterotrophicprokaryote
Mitochondrion
Ancestralheterotrophic eukaryote

Figure 25.9-3
Plasma membrane
DNA
Cytoplasm
Ancestralprokaryote
Nuclear envelope
Nucleus Endoplasmic reticulum
Aerobic heterotrophicprokaryote
Mitochondrion
Ancestralheterotrophic eukaryote
Photosyntheticprokaryote
Mitochondrion
Plastid
Ancestral photosyntheticeukaryote
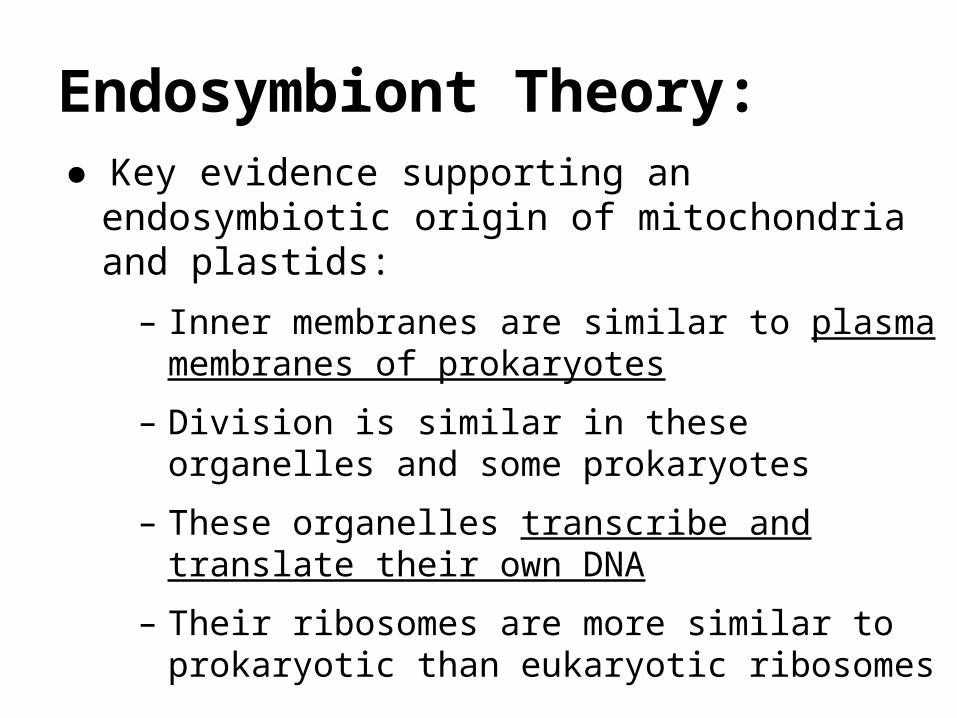
● Key evidence supporting an endosymbiotic origin of mitochondria and plastids:
– Inner membranes are similar to plasma membranes of prokaryotes
– Division is similar in these organelles and some prokaryotes
– These organelles transcribe and translate their own DNA
– Their ribosomes are more similar to prokaryotic than eukaryotic ribosomes
Endosymbiont Theory:
The Origin of Multicellularity
● The evolution of eukaryotic cells allowed for a greater range of unicellular forms
● A second wave of diversification occurred when multicellularity evolved and gave rise to algae, plants, fungi, and animals
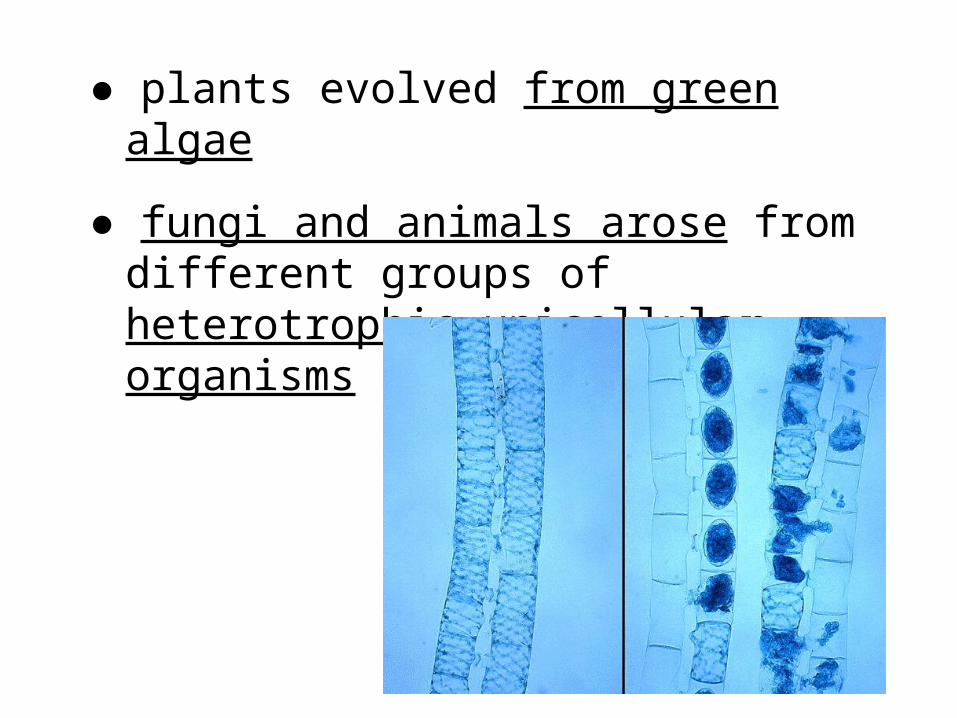
● plants evolved from green algae
● fungi and animals arose from different groups of heterotrophic unicellular organisms

● first animals (soft-bodied invertebrates): 550-700 million years ago
● first terrestrial colonization by plants and fungi:
475-500 million years ago
plants transformed the landscape and created new opportunities for all forms of life


The Cambrian Explosion
● The Cambrian explosion refers to the sudden appearance of fossils resembling modern animal phyla in the Cambrian period (535 to 525 million years ago)
● A few animal phyla appear even earlier: sponges, cnidarians, and molluscs
● The Cambrian explosion provides the first evidence of predator-prey interactions

Sponges
Cnidarians
Echinoderms
Chordates
Brachiopods
Annelids
Molluscs
Arthropods
Ediacaran Cambrian
PROTEROZOIC PALEOZOIC
Time (millions of years ago)
635 605 575 545 515 485 0
The “Big Five” Mass Extinction Events
● In each of the five mass extinction events, more than 50% of Earth’s species became extinct
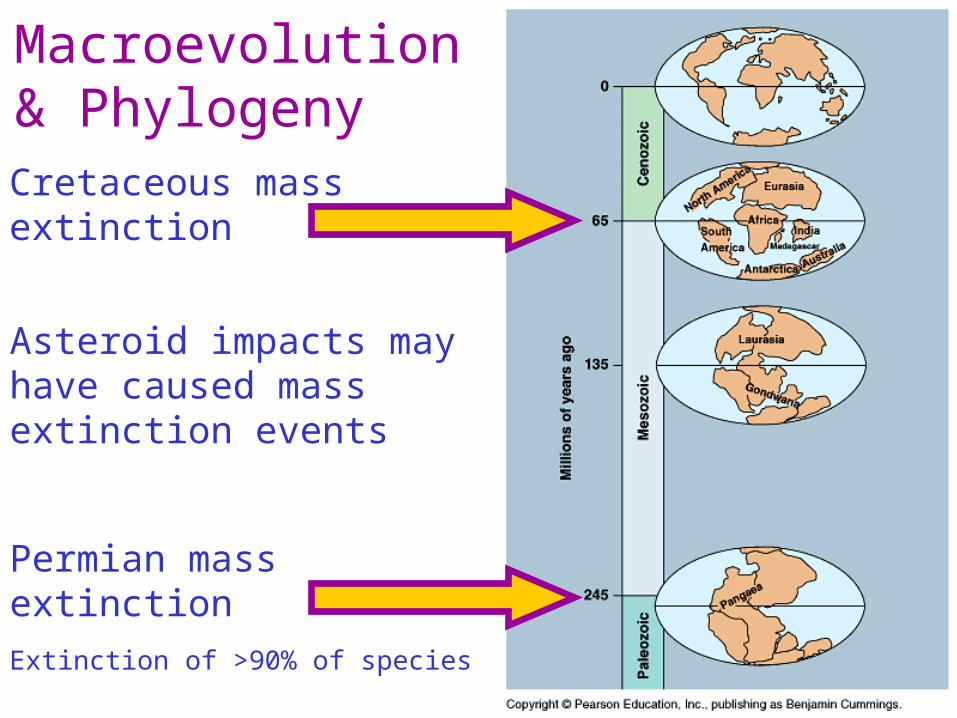
Permian mass extinction
Extinction of >90% of species
Macroevolution & PhylogenyCretaceous mass extinction
Asteroid impacts may have caused mass extinction events

Mass extinctions:
● Permian (250 m.y.a.): 90% of marine animals; Pangaea merges
● Cretaceous (65 m.y.a.): death of dinosaurs, 50% of marine species; low angle comet

NORTH AMERICA
YucatánPeninsula
Chicxulubcrater
Consequences of Mass Extinctions
● Mass extinction can alter ecological communities and the niches available to organisms
● It can take from 5 to 100 million years for diversity to recover following a mass extinction
● The percentage of marine organisms that were predators increased after the Permian and Cretaceous mass extinctions
● Mass extinction can pave the way for adaptive radiations

Pre
dat
or
gen
era
(per
cen
tag
e o
f m
arin
e g
ener
a) 50
40
30
20
10
0EraPeriod
542 488 444 416
E O S D
359 299
C
251
P Tr
200 65.5
J C
Mesozoic
P N
Cenozoic
0
Paleozoic
145 Q
Cretaceous massextinction
Permian massextinction
Time (millions of years ago)
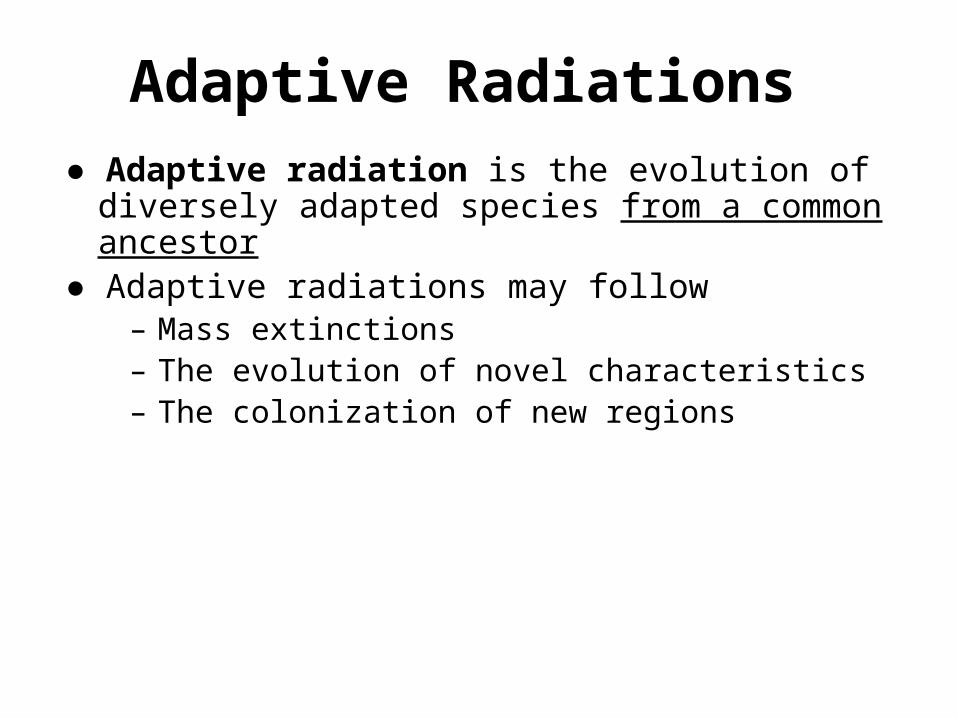
Adaptive Radiations
● Adaptive radiation is the evolution of diversely adapted species from a common ancestor
● Adaptive radiations may follow– Mass extinctions– The evolution of novel characteristics– The colonization of new regions
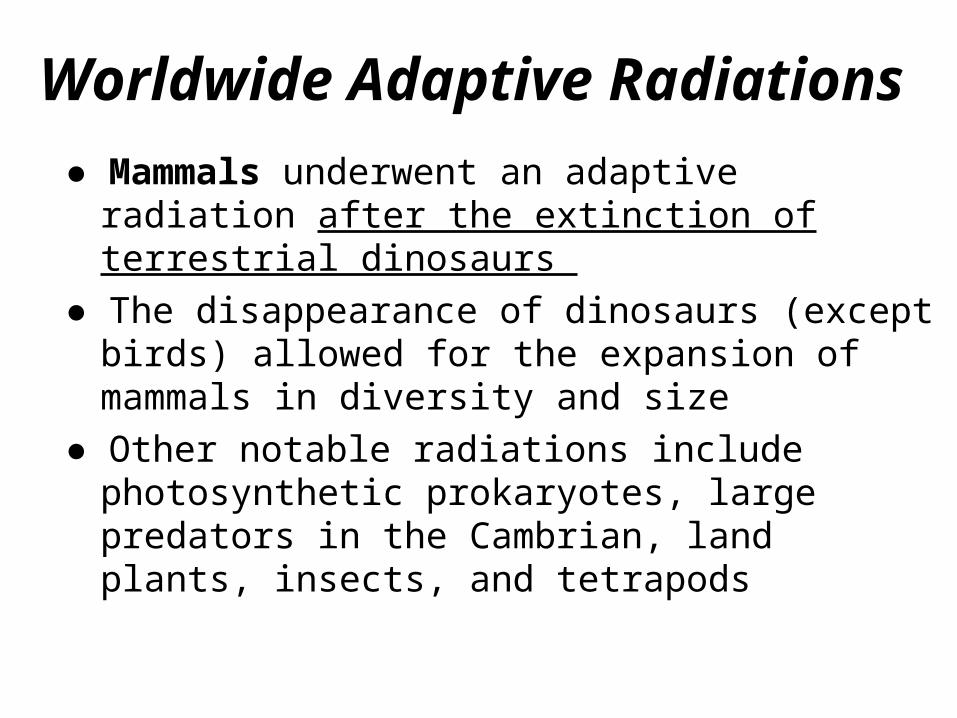
Worldwide Adaptive Radiations
● Mammals underwent an adaptive radiation after the extinction of terrestrial dinosaurs
● The disappearance of dinosaurs (except birds) allowed for the expansion of mammals in diversity and size
● Other notable radiations include photosynthetic prokaryotes, large predators in the Cambrian, land plants, insects, and tetrapods

Ancestralmammal
ANCESTRALCYNODONT
250 200 150 100 50 0Time (millions of years ago)
Monotremes(5 species)
Marsupials(324 species)
Eutherians(5,010 species)

Regional Adaptive Radiations
● Adaptive radiations can occur when organisms colonize new environments with little competition
● The Hawaiian Islands are one of the world’s great showcases of adaptive radiation
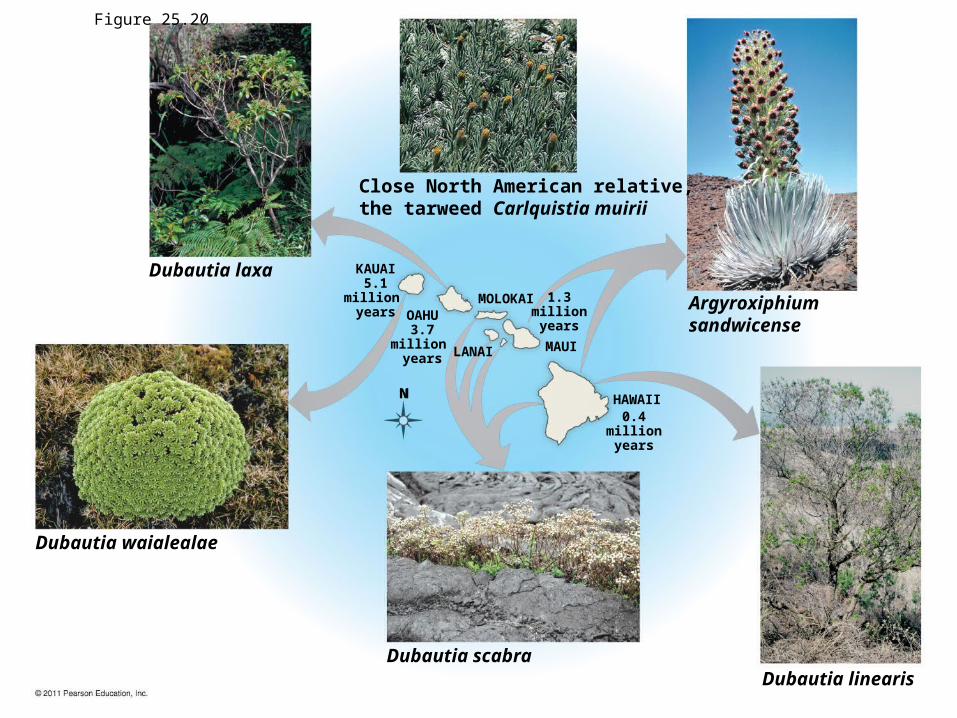
Close North American relative,the tarweed Carlquistia muirii
KAUAI5.1
million years OAHU
3.7million years
1.3millionyears
MOLOKAI
LANAI MAUI
HAWAII0.4
millionyears
N
Argyroxiphium sandwicense
Dubautia laxa
Dubautia scabraDubautia linearis
Dubautia waialealae
Figure 25.20

Evolution is not goal oriented:
● Evolution is like tinkering — it is a process in which new forms arise by the slight modification of existing forms

Evolutionary Novelties
● Most novel biological structures evolve in many stages from previously existing structures
● Complex eyes have evolved from simple photosensitive cells independently many times
● Natural selection can only improve a structure in the context of its current utility

(a) Patch of pigmented cells (b) Eyecup
Pigmented cells(photoreceptors)
Pigmented cells
Nerve fibersNerve fibers
Epithelium
CorneaCornea
Lens
Retina
Optic nerveOptic nerveOptic
nerve
(c) Pinhole camera-type eye (d) Eye with primitive lens (e) Complex camera lens-type eye
EpitheliumFluid-filled cavity
Cellularmass(lens)
Pigmented layer (retina)


