65 Li & Fung Limited Interim Report 2019 Notes to Condensed Interim Financial Information Notes to Condensed Interim Financial Information 1 General Information Li & Fung Limited and its subsidiaries are principally engaged in managing the supply chain for retailers and brands worldwide with over 230 offices across key production countries globally. The Company is a limited liability company incorporated in Bermuda. The address of its registered office is Victoria Place, 5 th Floor, 31 Victoria Street, Hamilton HM 10, Bermuda. The Company’s shares are listed on the Stock Exchange. This condensed interim financial information is presented in US dollars, unless otherwise stated. This condensed interim financial information was approved for issue on 22 August 2019. 2 Basis of Preparation and Accounting Policies The unaudited condensed interim financial information (“the interim financial information”) has been reviewed by the Company’s audit committee and, in accordance with Hong Kong Standard on Review Engagements 2410 “Review of Interim Financial Information Performed by the Independent Auditor of the Entity” issued by the Hong Kong Institute of Certified Public Accountants (“HKICPA”), by the Company’s auditor, PricewaterhouseCoopers. This interim financial information has been prepared in accordance with Hong Kong Accounting Standard (“HKAS”) 34, “Interim Financial Reporting” issued by the HKICPA and Appendix 16 of the Listing Rules. This interim financial information should be read in conjunction with the annual financial statements for the year ended 31 December 2018, which were prepared in accordance with Hong Kong Financial Reporting Standards (“HKFRSs”). As at 30 June 2019, the Group recorded net current liabilities of US$519 million (31 December 2018 (restated): US$45 million) which was primarily due to the long-term notes of US$751 million which will become due in May 2020 and the recognition of current lease liabilities of US$132 million (31 December 2018 (restated): US$129 million) upon the adoption of HKFRS 16 Leases (Note 2(a)). In August 2019, the Group received US$300 million cash from bringing in Temasek Holdings (Private) Limited (“Temasek”) as our strategic investor of LF Logistics Holdings Limited (“LF Logistics”) (Note 21). In addition, the Group has secured approximately US$857 million in committed bank facilities with tenure up to 2022, of which US$557 million are still unused as at 30 June 2019. With the US$300 million receipt from Temasek, the Group’s cash balance of US$811 million and unused committed bank facilities of US$557 million, the directors consider the Group has adequate resources to meet its liabilities as and when they fall due and continue its operations for the foreseeable future. Accordingly, the directors have prepared the condensed interim financial information on a going concern basis. Except as described in (a) below, the accounting policies applied are consistent with those of the annual financial statements for the year ended 31 December 2018, as described in those annual financial statements. Taxes on income in the interim periods are accrued using the tax rates that would be applicable to expected total annual earnings.
Transcript
65Li & Fung Limited Interim Report 2019Notes to Condensed Interim Financial Information
Notes to Condensed Interim Financial Information
1 General InformationLi & Fung Limited and its subsidiaries are principally engaged in managing the supply chain for retailers and brands worldwide with over 230 offices across key production countries globally.
The Company is a limited liability company incorporated in Bermuda. The address of its registered office is Victoria Place, 5th Floor, 31 Victoria Street, Hamilton HM 10, Bermuda.
The Company’s shares are listed on the Stock Exchange.
This condensed interim financial information is presented in US dollars, unless otherwise stated. This condensed interim financial information was approved for issue on 22 August 2019.
2 Basis of Preparation and Accounting PoliciesThe unaudited condensed interim financial information (“the interim financial information”) has been reviewed by the Company’s audit committee and, in accordance with Hong Kong Standard on Review Engagements 2410 “Review of Interim Financial Information Performed by the Independent Auditor of the Entity” issued by the Hong Kong Institute of Certified Public Accountants (“HKICPA”), by the Company’s auditor, PricewaterhouseCoopers.
This interim financial information has been prepared in accordance with Hong Kong Accounting Standard (“HKAS”) 34, “Interim Financial Reporting” issued by the HKICPA and Appendix 16 of the Listing Rules. This interim financial information should be read in conjunction with the annual financial statements for the year ended 31 December 2018, which were prepared in accordance with Hong Kong Financial Reporting Standards (“HKFRSs”).
As at 30 June 2019, the Group recorded net current liabilities of US$519 million (31 December 2018 (restated): US$45 million) which was primarily due to the long-term notes of US$751 million which will become due in May 2020 and the recognition of current lease liabilities of US$132 million (31 December 2018 (restated): US$129 million) upon the adoption of HKFRS 16 Leases (Note 2(a)).
In August 2019, the Group received US$300 million cash from bringing in Temasek Holdings (Private) Limited (“Temasek”) as our strategic investor of LF Logistics Holdings Limited (“LF Logistics”) (Note 21). In addition, the Group has secured approximately US$857 million in committed bank facilities with tenure up to 2022, of which US$557 million are still unused as at 30 June 2019.
With the US$300 million receipt from Temasek, the Group’s cash balance of US$811 million and unused committed bank facilities of US$557 million, the directors consider the Group has adequate resources to meet its liabilities as and when they fall due and continue its operations for the foreseeable future. Accordingly, the directors have prepared the condensed interim financial information on a going concern basis.
Except as described in (a) below, the accounting policies applied are consistent with those of the annual financial statements for the year ended 31 December 2018, as described in those annual financial statements.
Taxes on income in the interim periods are accrued using the tax rates that would be applicable to expected total annual earnings.
Li & Fung Limited Interim Report 201966 Notes to Condensed Interim Financial Information (continued)
2 Basis of Preparation and Accounting Policies (continued)
(a) New standard, new interpretation and amendments to existing standards adopted by the GroupThe following new standard, new interpretation and amendments to existing standards are mandatory for accounting periods beginning on or after 1 January 2019:
HKAS 19 Amendment Plan amendment, curtailment or settlementHKAS 28 Amendment Long-term Interests in Associates and Joint VenturesHKFRS 9 Amendment Prepayment Features with Negative CompensationHKFRS 16 LeasesHK(IFRIS) — Int 23 Uncertainty over Income Tax TreatmentsAnnual Improvement Project Annual Improvements 2015–2017 Cycle
The application of the above new standard, new interpretation and amendments effective in the current interim period has had no material effect on the amounts reported in the interim financial information and/or disclosures set out in the interim financial information, except for HKFRS 16 “Leases” as set out below.
HKFRS 16 LeasesHKFRS 16 Leases addresses the classification, measurement and derecognition of right-of-use assets and lease liabilities related to leases which had previously been classified as “operating leases” under the principle of HKAS 17 Leases. These liabilities are measured at the present value of the remaining lease payments, discounted using lessee’s incremental borrowing rate.
In accordance with the transition provisions in HKFRS 16, the new rule has been adopted retrospectively and comparative figures have been restated and the impact of the adoption is disclosed in Note 2(a)(ii).
(I) CHANGES IN ACCOUNTING POLICIES
Leased assetsAn arrangement, comprising a transaction or a series of transactions, is or contains a lease if the Group determines that the arrangement conveys a right to control the use of an identified asset for a period of time in exchange for consideration. Such determination is made on an evaluation of the substance of the arrangement, regardless of whether the arrangements take the legal form of a lease.
• Assets leased to the Group
Leases are initially recognized as a right-of-use asset and corresponding liability at the date of which the leased asset is available for use by the Group. Each lease payment is allocated between the liability and finance cost. The finance cost is charged to the consolidated profit and loss account over the lease period so as to produce a constant periodic rate of interest on the remaining balance of the liability for each period. The right-of-use asset is amortized on a straight-line basis over the shorter of the asset’s useful life and the lease term.
67Li & Fung Limited Interim Report 2019Notes to Condensed Interim Financial Information (continued)
2 Basis of Preparation and Accounting Policies (continued)
(a) New standard, new interpretation and amendments to existing standards adopted by the Group (continued)
(I) CHANGES IN ACCOUNTING POLICIES (continued)
Leased assets (continued)
• Assets leased to the Group (continued)
Assets leased to the Group and the corresponding liabilities are initially measured on a present value basis. Lease liabilities include the net present value of the following lease payments:
– fixed payments (including in-substance fixed payments), less any lease incentives receivable;
– variable lease payments that are based on an index or a rate; and
– payments of penalties for terminating the lease, if the lease term reflects the Group, as a lessee, exercising an option to terminate the lease.
The lease payments are discounted using the interest rate implicit in the lease, if that rate can be determined, or the incremental borrowing rate of respective entities. Right-of-use assets are measured at cost comprising the following:
– the amount of the initial measurement of lease liabilities;
– any lease payments made at or before the commencement date, less any lease incentive received;
– any initial direct costs; and
– restoration costs.
Payments associated with short-term leases and leases of low-value assets are recognized on a straight-line basis as an expense in the consolidated profit and loss account. Short-term leases are leases with a lease term of 12 months or less. Low-value assets comprise equipment and small items of office furniture.
• Assets leased out by the Group
A lease is classified as a finance lease if it transfers substantially all the risks and rewards incidental to ownership of an underlying asset. A lease is classified as an operating lease if it does not transfer substantially all the risks and rewards incidental to ownership of an underlying asset.
Where the Group leases out assets under operating leases, the assets are included in the consolidated balance sheet according to their nature and, where applicable, are amortized in accordance with the Group’s amortization policies.
Li & Fung Limited Interim Report 201968 Notes to Condensed Interim Financial Information (continued)
2 Basis of Preparation and Accounting Policies (continued)
(a) New standard, new interpretation and amendments to existing standards adopted by the Group (continued)
(II) IMPACT OF ADOPTION OF HKFRS 16The impact of the adoption of HKFRS 16 are as follows:
Consolidated Profit and Loss Account
Six months ended 30 June 2018
As previously reported HKFRS 16 Restated
US$’000 US$’000 US$’000
Continuing Operations
Operating profit 109,326 4,892 114,218
Non-cash interest expenses 329 7,174 7,503
Discontinued Operations
Loss for the period from Discontinued Operations (137,971) 655 (137,316)
Consolidated Balance Sheet
As at 31 December 2018
As previously reported HKFRS 16 Restated
US$’000 US$’000 US$’000
Assets
Property, plant and equipment 220,264 (18,291) 201,973
Right-of-use assets – 391,970 391,970
Other receivables, prepayments and deposits 179,549 (2,113) 177,436
Deferred tax assets 11,711 3,933 15,644
Liabilities
Accrued charges and sundry payables 592,868 (6,971) 585,897
Other long-term liabilities 25,861 (23,156) 2,705
Deferred tax liabilities 2,098 (405) 1,693
Lease liabilities
– Non-current portion – 291,164 291,164
– Current portion – 129,464 129,464
Equity
Reserves 1,203,259 (14,597) 1,188,662
69Li & Fung Limited Interim Report 2019Notes to Condensed Interim Financial Information (continued)
2 Basis of Preparation and Accounting Policies (continued)
(a) New standard, new interpretation and amendments to existing standards adopted by the Group (continued)
(II) IMPACT OF ADOPTION OF HKFRS 16 (continued)
Condensed Consolidated Cash Flow Statement
Six months ended 30 June 2018
As previously reported HKFRS 16 Restated
US$’000 US$’000 US$’000
Continuing Operations
Net cash (outflow)/inflow from operating activities (21,343) 78,475 57,132
Net cash outflow from financing activities (1,097,074) (78,475) (1,175,549)
(b) New standards and amendments to existing standards that have been issued but are not yet effective and have not been early adopted by the Group:The following new standards and amendments to existing standards have been issued and are mandatory for the Group’s accounting periods beginning on or after 1 January 2020 or later periods, but the Group has not early adopted them:
HKAS 1 and HKAS 8 Amendment Definition of Material1
HKFRS 3 Amendment Definition of Business1
HKFRS 10 and HKAS 28 Amendment Sale or Contribution of Assets between an Investor and its Associate or Joint Venture3
HKFRS 17 Insurance Contracts2
NOTES:1 Effective for annual periods beginning on or after 1 January 20202 Effective for annual periods beginning on or after 1 January 20213 Effective date to be determined
Li & Fung Limited Interim Report 201970 Notes to Condensed Interim Financial Information (continued)
3 Segment InformationOperating segments are reported in a manner consistent with the internal reporting provided to the chief operating decision maker. The chief operating decision-maker is responsible for allocating resources and assessing performance of the operating segments.
The Company is domiciled in Bermuda. The Company is a limited liability company incorporated in Bermuda. The address of its registered office is Victoria Place, 5th Floor, 31 Victoria Street, Hamilton HM 10, Bermuda and its Hong Kong office is at 11/F, LiFung Tower, 888 Cheung Sha Wan Road, Kowloon, Hong Kong. The Group is principally engaged in managing the supply chain for retailers and brands worldwide with over 230 offices across key production markets globally. Turnover represents revenue generated from sales and services rendered at invoiced value to customers outside the Group less discounts and returns.
In 2018, the Group divested the three Product Verticals to further simplify our business and facilitate sharper focus on the core sourcing business. The three Product Verticals are classified as Discontinued Operations and their net results for the period are excluded from the Products segments and presented separately as one-line item below net profit of the Continuing Operations. Further details of financial information of the Discontinued Operations are set out in Note 15 to the condensed interim financial information.
The Group’s management assesses the performance of the operating segments based on a measure of operating profit, referred to as core operating profit. This measurement basis includes profit of the operating segments before share of results of associated companies and joint venture, interest income, interest expenses, taxation, material gains or losses, which are of capital nature, non-operational related or acquisition related cost. This also excludes any gain or loss on remeasurement of contingent consideration payable and amortization of other intangible assets which are non-cash items. Other information provided to the Group’s management is measured in a manner consistent with that in the interim financial information.
71Li & Fung Limited Interim Report 2019Notes to Condensed Interim Financial Information (continued)
3 Segment Information (continued)
Services Products Elimination Total
US$’000 US$’000 US$’000 US$’000
Six months ended 30 June 2019 (Unaudited)
Turnover 4,701,976 666,226 (12,010) 5,356,192
Total margin 465,382 117,500 582,882
Operating costs (374,600) (103,307) (477,907)
Core operating profit 90,782 14,193 104,975
Gain on remeasurement of contingent consideration payable 621
One-off reorganization costs (7,884)
Amortization of other intangible assets (14,527)
Operating profit 83,185
Interest income 3,305
Interest expenses
Non-cash interest expenses (7,391)
Cash interest expenses (33,003)
(40,394)
Share of net losses of associated companies and joint venture (5)
Profit before taxation 46,091
Taxation (8,989)
Net profit for the period 37,102
Depreciation and amortization 107,445 16,726 124,171
30 June 2019 (Unaudited)
Non-current assets (other than financial assets at fair value through other comprehensive income and deferred tax assets) 2,226,686 708,819 2,935,505
Li & Fung Limited Interim Report 201972 Notes to Condensed Interim Financial Information (continued)
3 Segment Information (continued)
Services Products Elimination Total
US$’000 US$’000 US$’000 US$’000
(Restated) (Restated) (Restated)
Six months ended 30 June 2018 (Unaudited)
Continuing Operations
Turnover 5,100,514 762,693 (12,867) 5,850,340
Total margin 486,707 126,821 613,528
Operating costs (371,002) (113,531) (484,533)
Core operating profit 115,705 13,290 128,995
Amortization of other intangible assets (14,777)
Operating profit 114,218
Interest income 7,571
Interest expenses
Non-cash interest expenses (7,503)
Cash interest expenses (25,155)
(32,658)
Share of net profits of associated companies and joint venture 843
Profit before taxation 89,974
Taxation (13,150)
Profit for the period from Continuing Operations 76,824
Discontinued Operations
Loss for the period from Discontinued Operations (137,316)
Net loss for the period (60,492)
Depreciation and amortization (Continuing Operations) 101,787 15,413 117,200
31 December 2018 (Audited and restated)
Non-current assets (other than financial assets at fair value through other comprehensive income and deferred tax assets) 2,234,467 713,091 2,947,558
73Li & Fung Limited Interim Report 2019Notes to Condensed Interim Financial Information (continued)
3 Segment Information (continued)
Supplementary analysis for the Services segment by Supply Chain Solutions and Logistics Services is as follows:
Unaudited
Six months ended 30 June
2019 2018
US$’000 US$’000
Turnover
Supply Chain Solutions 4,143,585 4,559,933
Logistics Services 563,451 542,905
Elimination (5,060) (2,324)
4,701,976 5,100,514
Unaudited
Six months ended 30 June
2019 2018
US$’000 US$’000
(Restated)
Core operating profit
Supply Chain Solutions 47,804 75,305
Logistics Services 42,978 40,400
90,782 115,705
The geographical analysis of turnover to external customers and non-current assets of the Continuing Operations (other than financial assets at fair value through other comprehensive income and deferred tax assets) is as follows:
Turnover
Non-current assets (other than financial assets at fair
value through other comprehensive income and deferred tax assets)
Unaudited Unaudited Audited
Six months ended 30 June 30 June 31 December
2019 2018 2019 2018
US$’000 US$’000 US$’000 US$’000
(Restated)
United States of America 3,481,595 3,860,235 1,056,522 1,064,356
Europe 900,953 938,669 669,295 664,664
Asia 634,693 659,935 1,108,492 1,117,447
Rest of the world 338,951 391,501 101,196 101,091
5,356,192 5,850,340 2,935,505 2,947,558
Li & Fung Limited Interim Report 201974 Notes to Condensed Interim Financial Information (continued)
3 Segment Information (continued)
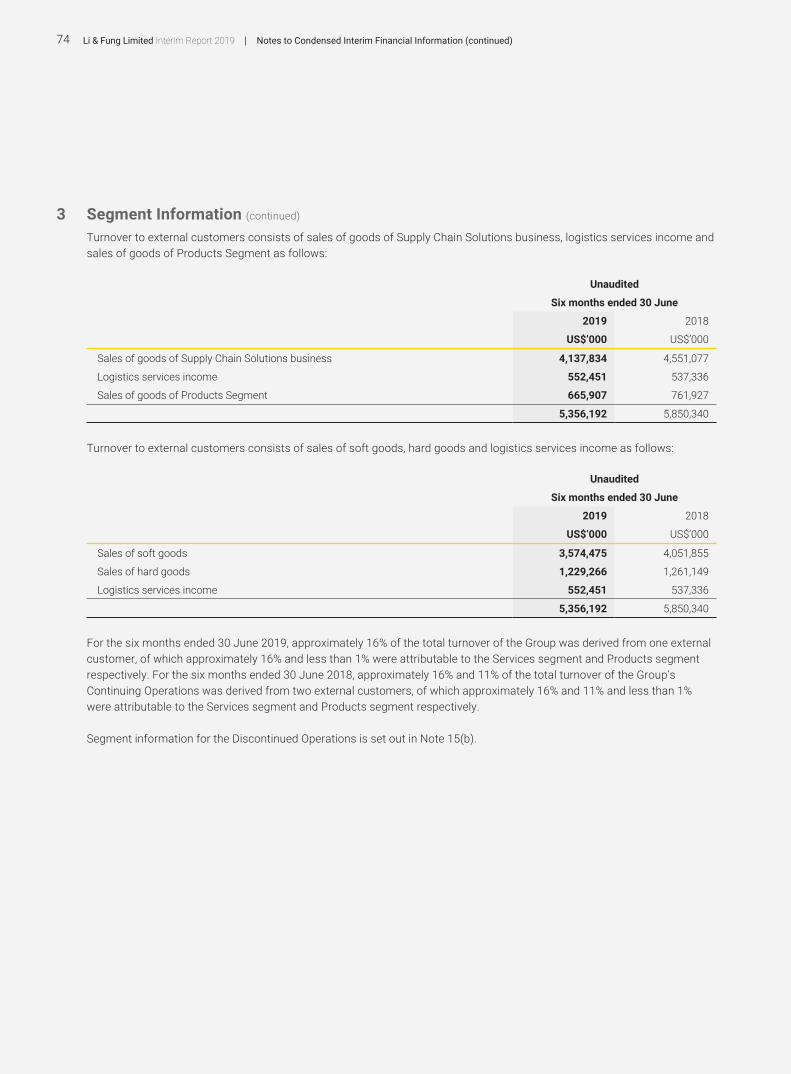
Turnover to external customers consists of sales of goods of Supply Chain Solutions business, logistics services income and sales of goods of Products Segment as follows:
Unaudited
Six months ended 30 June
2019 2018
US$’000 US$’000
Sales of goods of Supply Chain Solutions business 4,137,834 4,551,077
Logistics services income 552,451 537,336
Sales of goods of Products Segment 665,907 761,927
5,356,192 5,850,340
Turnover to external customers consists of sales of soft goods, hard goods and logistics services income as follows:
Unaudited
Six months ended 30 June
2019 2018
US$’000 US$’000
Sales of soft goods 3,574,475 4,051,855
Sales of hard goods 1,229,266 1,261,149
Logistics services income 552,451 537,336
5,356,192 5,850,340
For the six months ended 30 June 2019, approximately 16% of the total turnover of the Group was derived from one external customer, of which approximately 16% and less than 1% were attributable to the Services segment and Products segment respectively. For the six months ended 30 June 2018, approximately 16% and 11% of the total turnover of the Group’s Continuing Operations was derived from two external customers, of which approximately 16% and 11% and less than 1% were attributable to the Services segment and Products segment respectively.
Segment information for the Discontinued Operations is set out in Note 15(b).
75Li & Fung Limited Interim Report 2019Notes to Condensed Interim Financial Information (continued)
4 Operating Profit from Continuing OperationsOperating profit from Continuing Operations is stated after crediting and charging the following:
Unaudited
Six months ended 30 June
2019 2018
US$’000 US$’000
(Restated)
Crediting
Gain on remeasurement of contingent consideration payable* 621 –
Charging
Staff costs including directors’ emoluments 323,027 354,792
Amortization of system development, software and other license costs 6,713 4,551
Amortization of other intangible assets* 14,527 14,777
Amortization of prepaid premium for land leases 1 1
Amortization of right-of-use assets 77,479 75,265
Depreciation of property, plant and equipment 25,451 22,606
Net loss on disposal of property, plant and equipment 926 183
One-off reorganization costs* 7,884 –
* Excluded from the core operating profit
5 TaxationHong Kong profits tax has been provided at the rate of 16.5% (2018: 16.5%) on the estimated assessable profits for the period. Taxation on overseas profits has been calculated on the estimated assessable profits for the period at the rates of taxation prevailing in the countries in which the Group operates.
The amount of taxation charged to the consolidated profit and loss account represents:
Unaudited
Six months ended 30 June
2019 2018
US$’000 US$’000
(Restated)
Current taxation
– Hong Kong profits tax 2,670 2,686
– Overseas taxation 11,289 15,730
Deferred taxation (4,970) (5,266)
8,989 13,150
Li & Fung Limited Interim Report 201976 Notes to Condensed Interim Financial Information (continued)
6 Interim Dividend
Unaudited
Six months ended 30 June
2019 2018
US$’000 US$’000
Proposed, of HK$0.01 (equivalent to US$0.001) (2018: HK$0.03 (equivalent to US$0.004)) per ordinary share (Note) 10,962 32,745
Note:Final dividend of US$43,848,000 for the year ended 31 December 2018 were paid in June 2019 (2018: final dividend of US$21,830,000 for the year ended 31 December 2017 and a special dividend of US$519,549,000 were paid in May 2018).
7 Earnings/(Losses) per ShareThe calculation of basic earnings/(losses) per share is based on the Group’s profit attributable to Shareholders of US$20,532,000 (2018 (Restated): based on the Group’s profit attributable to Shareholders arising from the Continuing Operations of US$48,224,000 and the Group’s losses attributable to Shareholders arising from the Discontinued Operations of US$134,318,000) and on the weighted average number of 8,391,324,000 (2018: 8,376,564,000) shares in issue during the period.
The diluted earnings per share for the six months ended 30 June 2019 was calculated by adjusting the weighted average number of 8,391,324,000 (2018: 8,376,564,000) ordinary shares in issue by 115,262,000 (2018: 93,414,000) to assume conversion of all dilutive potential ordinary shares granted under the Company’s Share Option and Share Award Scheme. For the determination of dilutive potential ordinary share granted under the Company, a calculation is done to determine the number of shares that could have been acquired at fair value (determined as the average annual market share price of the Company’s shares) based on the monetary value of the subscription rights attached to outstanding Share Options. The number of shares calculated as above is compared with the number of shares that would have been issued assuming the exercise of the Share Options and vesting Award Shares.
77Li & Fung Limited Interim Report 2019Notes to Condensed Interim Financial Information (continued)
8 Capital Expenditure
Intangible assets
Property, plant and equipment
Right-of-use assets
US$’000 US$’000 US$’000
(Restated) (Restated)
Six months ended 30 June 2019
Net book amount as at 1 January 2019 (Audited) 2,321,294 201,973 391,970
Net book amount as at 30 June 2018 (Unaudited) 2,329,702 191,014 435,695
NOTE:Amortization of intangible assets included amortization of system development, software and other license costs of US$6,713,000 (2018: US$4,551,000) and amortization of other intangible assets arising from business combinations of US$14,527,000 (2018: US$14,777,000).
Li & Fung Limited Interim Report 201978 Notes to Condensed Interim Financial Information (continued)
9 Trade and Bills ReceivableThe ageing of trade and bills receivable based on invoice date is as follows:
Current to 90days
91 to 180 days
181 to 360 days
Over 360 days Total
US$’000 US$’000 US$’000 US$’000 US$’000
Balance at 30 June 2019 (Unaudited) 746,331 30,106 15,269 6,838 798,544
Balance at 31 December 2018 (Audited) 905,138 97,862 18,625 18,611 1,040,236
All trade and bills receivable are either repayable within one year or on demand. Accordingly, the fair values of the Group’s trade and bills receivable were approximately the same as their carrying values as at 30 June 2019.
A significant portion of the Group’s business is on sight letter of credit, usance letter of credit up to a tenor of 120 days, documents against payment or customers’ letter of credit to suppliers. The balance of the business is on open account terms which are often covered by customers’ standby letters of credit, bank guarantees, credit insurance or under a back-to-back payment arrangement with suppliers.
There is no concentration of credit risk with respect to trade receivables, as the Group has a large number of customers internationally dispersed.
10 Trade and Bills PayableThe ageing of trade and bills payable based on invoice date is as follows:
Current to 90days
91 to 180 days
181 to 360 days
Over 360 days Total
US$’000 US$’000 US$’000 US$’000 US$’000
Balance at 30 June 2019 (Unaudited) 1,430,555 65,969 3,734 13,195 1,513,453
Balance at 31 December 2018 (Audited) 1,592,934 109,264 18,072 16,547 1,736,817
The fair values of the Group’s trade and bills payable were approximately the same as their carrying values as at 30 June 2019.
79Li & Fung Limited Interim Report 2019Notes to Condensed Interim Financial Information (continued)
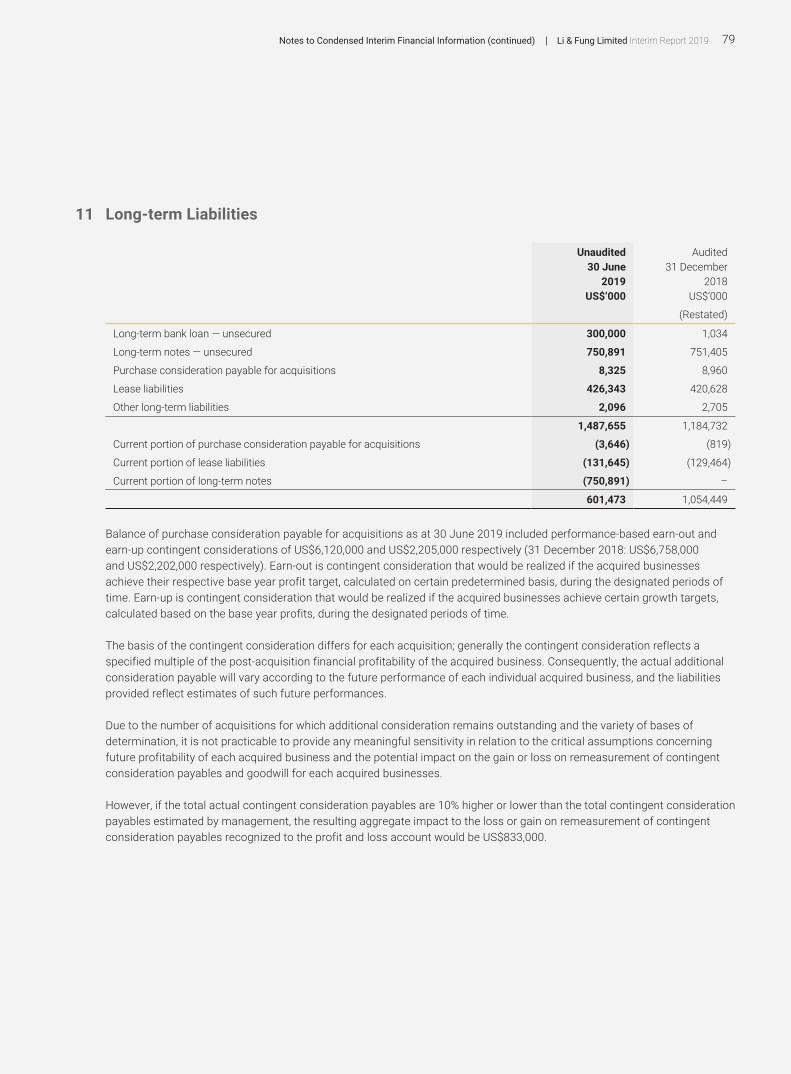
11 Long-term Liabilities
Unaudited 30 June
Audited 31 December
2019 2018US$’000 US$’000
(Restated)
Long-term bank loan — unsecured 300,000 1,034
Long-term notes — unsecured 750,891 751,405
Purchase consideration payable for acquisitions 8,325 8,960
Lease liabilities 426,343 420,628
Other long-term liabilities 2,096 2,705
1,487,655 1,184,732
Current portion of purchase consideration payable for acquisitions (3,646) (819)
Current portion of lease liabilities (131,645) (129,464)
Current portion of long-term notes (750,891) –
601,473 1,054,449
Balance of purchase consideration payable for acquisitions as at 30 June 2019 included performance-based earn-out and earn-up contingent considerations of US$6,120,000 and US$2,205,000 respectively (31 December 2018: US$6,758,000 and US$2,202,000 respectively). Earn-out is contingent consideration that would be realized if the acquired businesses achieve their respective base year profit target, calculated on certain predetermined basis, during the designated periods of time. Earn-up is contingent consideration that would be realized if the acquired businesses achieve certain growth targets, calculated based on the base year profits, during the designated periods of time.
The basis of the contingent consideration differs for each acquisition; generally the contingent consideration reflects a specified multiple of the post-acquisition financial profitability of the acquired business. Consequently, the actual additional consideration payable will vary according to the future performance of each individual acquired business, and the liabilities provided reflect estimates of such future performances.
Due to the number of acquisitions for which additional consideration remains outstanding and the variety of bases of determination, it is not practicable to provide any meaningful sensitivity in relation to the critical assumptions concerning future profitability of each acquired business and the potential impact on the gain or loss on remeasurement of contingent consideration payables and goodwill for each acquired businesses.
However, if the total actual contingent consideration payables are 10% higher or lower than the total contingent consideration payables estimated by management, the resulting aggregate impact to the loss or gain on remeasurement of contingent consideration payables recognized to the profit and loss account would be US$833,000.
Li & Fung Limited Interim Report 201980 Notes to Condensed Interim Financial Information (continued)
12 Share Capital, Share Options and Award Shares
Number of shares Equivalent to
(in thousand) HK$’000 US$’000
Authorized
At 1 January 2019, ordinary shares of HK$0.0125 each 12,000,000 150,000 19,231
At 30 June 2019, ordinary shares of HK$0.0125 each 12,000,000 150,000 19,231
Issued and fully paid
At 1 January 2019, ordinary shares of HK$0.0125 each 8,506,586 106,332 13,633
At 30 June 2019, ordinary shares of HK$0.0125 each 8,506,586 106,332 13,633
Details of Share Options granted by the Company pursuant to the 2003 Option Scheme and 2014 Option Scheme and outstanding at 30 June 2019 are as follows:
NOTE:(1) Following the spin-off and separate listing of Global Brands, the exercise price applicable to the Share Options outstanding on the record date for
the distribution in specie (i.e. 7 July 2014) was adjusted from HK$14.50 to HK$12.12 with effect from 31 August 2014.
Subsequent to 30 June 2019, no Shares have been allotted and issued under the 2003 Option Scheme and 2014 Option Scheme.
The Share Options outstanding at 30 June 2019 had a weighted average remaining contractual life of 0.91 years (31 December 2018: 0.79 years).
81Li & Fung Limited Interim Report 2019Notes to Condensed Interim Financial Information (continued)
12 Share Capital, Share Options and Award Shares (continued)
Details of Award Shares granted by the Company pursuant to the Share Award Scheme and outstanding at 30 June 2019 are as follows:
The fair value of the Award Shares was calculated based on the market price of the Company’s shares at the respective grant date.
No Award Shares were awarded by the Company to eligible persons pursuant to the Share Award Scheme during the period.
13 Perpetual Capital SecuritiesOn 3 November 2016 and 8 November 2012, the Company issued perpetual subordinated capital securities (the “Perpetual Capital Securities”) with an aggregate principal amount of US$650 million and US$500 million respectively. The Perpetual Capital Securities do not have maturity date and the distribution payments can be deferred at the discretion of the Company. Therefore, the Perpetual Capital Securities are classified as equity instruments and recorded in equity in the consolidated balance sheet. The Company redeemed US$500 million Perpetual Capital Securities issued on 8 November 2012 in full on 25 May 2018. The balances as at 30 June 2019 and 31 December 2018 included the accrued distribution payments.
Li & Fung Limited Interim Report 201982 Notes to Condensed Interim Financial Information (continued)
Balance at 30 June 2018 (13,923) 7,646 190,451 72,051 3,579 4,633 (14,114) (192,634) 57,689
NOTES:(a) Treasury shares represent the excess shares issued for settlement of consideration for certain prior year acquisitions and shares issued and
purchased for Share Award Scheme held by the escrow agent.
(b) Capital reserve represents amount set aside from the profit of certain overseas subsidiaries of the Group in accordance with local statutory requirements.
Li & Fung Limited Interim Report 201984 Notes to Condensed Interim Financial Information (continued)
15 Discontinued OperationsThe results of the Discontinued Operations are presented in the consolidated profit and loss account in accordance with HKFRS 5 “Non-current Assets Held for Sale and Discontinued Operations”. The consolidated statement of comprehensive income and condensed consolidated cash flow statement distinguish the Discontinued Operations from the Continuing Operations.
(a) Results of the Discontinued Operations have been included in the consolidated profit and loss accounts as follows:
For the six months ended 30 June 2018
US$’000
(Restated)
Turnover 382,235
Cost of sales (298,146)
Gross Profit 84,089
Selling and distribution expenses (27,294)
Merchandising and administrative expenses (76,565)
Core operating loss (19,770)
Amortization of other intangible assets (3,682)
Operating loss (23,452)
Interest income 157
Interest expenses (1,068)
Loss before taxation (24,363)
Taxation 825
Loss after taxation (23,538)
Loss on disposal of business and others (Note 15(e)) (113,778)
Loss for the period from Discontinued Operations (137,316)
Attributable to:
Shareholders of the three Product Verticals (134,318)
Non-controlling interest (2,998)
(137,316)
85Li & Fung Limited Interim Report 2019Notes to Condensed Interim Financial Information (continued)
15 Discontinued Operations (continued)
(a) Results of the Discontinued Operations have been included in the consolidated profit and loss accounts as follows: (continued)
STATEMENT OF COMPREHENSIVE INCOME OF THE DISCONTINUED OPERATIONS
For the six months ended 30 June 2018
US$’000
(Restated)
Loss for the period (137,316)
Other comprehensive income:
Items that may be reclassified subsequently to profit or loss
Currency translation differences 15,409
Total items that may be reclassified subsequently to profit or loss 15,409
Total other comprehensive income for the period, net of tax 15,409
Total comprehensive expense for the period (121,907)
Attributable to:
Shareholders of the three Product Verticals (118,909)
Non-controlling interest (2,998)
(121,907)
(b) Geographical analysis of turnover of the Discontinued OperationsFor the period ended 30 June 2018, the turnover consists of sales to United States of America of US$186,326,000, Europe of US$105,993,000, Asia of US$65,608,000 and Rest of the world of US$24,308,000.
Li & Fung Limited Interim Report 201986 Notes to Condensed Interim Financial Information (continued)
15 Discontinued Operations (continued)
(c) Operating profit of the Discontinued OperationsOperating profit of the Discontinued Operations is stated after charging the following:
For the six months ended 30 June 2018
US$’000
(Restated)
Charging:
Cost of inventories sold 298,146
Amortization of system development, software and other license costs 515
Amortization of other intangible assets (excluded from the core operating profit) 3,682
Amortization of right-of-use assets 2,366
Depreciation of property, plant and equipment 3,251
Staff costs including directors’ emoluments 36,906
(d) Disposed net assets of the Discontinued Operations at the date of disposal are as follows:
US$’000
(Restated)
Intangible assets 1,632,176
Property, plant and equipment 40,394
Right-of-use assets 12,455
Other non-current assets 9,556
Trade and other receivables 170,313
Inventories 130,268
Cash and bank balances 128,826
Other current assets 45
Trade and other payables (236,687)
Lease liabilities (13,110)
Other current liabilities (16,112)
Other non-current liabilities (92,410)
1,765,714
Remeasurement loss recognized in previous year (592,363)
1,173,351
Less: Non-controlling interest (6,226)
Net assets disposed 1,167,125
87Li & Fung Limited Interim Report 2019Notes to Condensed Interim Financial Information (continued)
15 Discontinued Operations (continued)
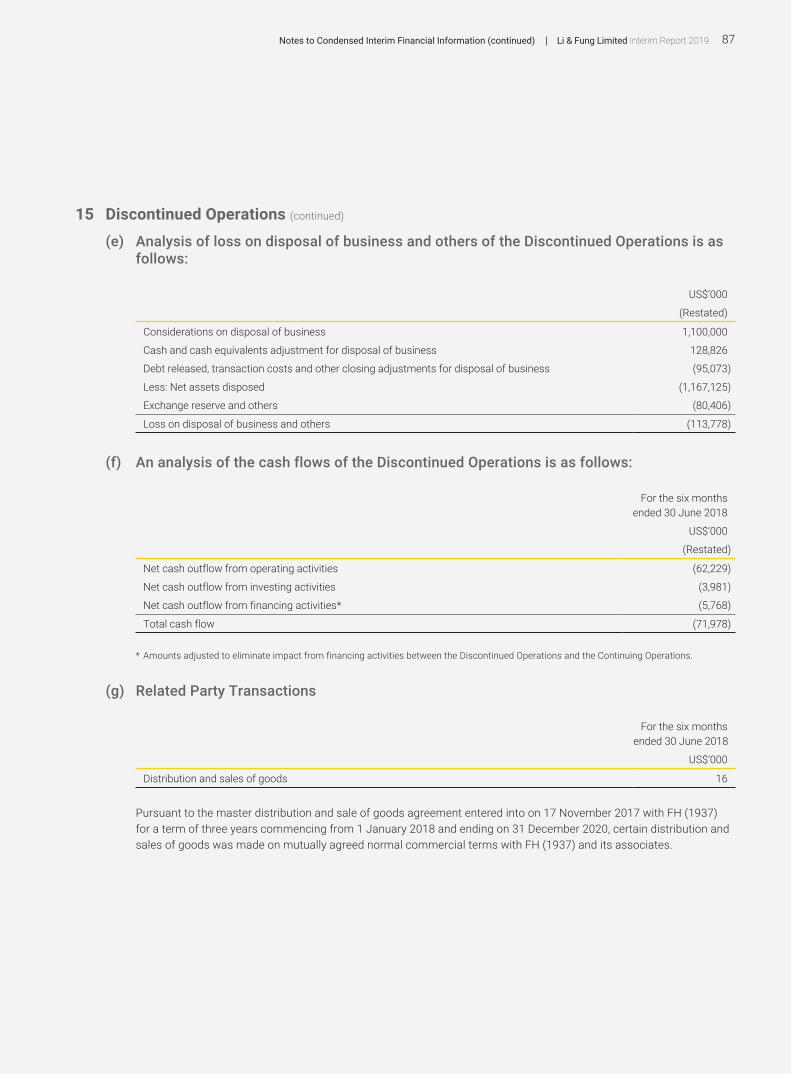
(e) Analysis of loss on disposal of business and others of the Discontinued Operations is as follows:
US$’000
(Restated)
Considerations on disposal of business 1,100,000
Cash and cash equivalents adjustment for disposal of business 128,826
Debt released, transaction costs and other closing adjustments for disposal of business (95,073)
Less: Net assets disposed (1,167,125)
Exchange reserve and others (80,406)
Loss on disposal of business and others (113,778)
(f) An analysis of the cash flows of the Discontinued Operations is as follows:
For the six months ended 30 June 2018
US$’000
(Restated)
Net cash outflow from operating activities (62,229)
Net cash outflow from investing activities (3,981)
Net cash outflow from financing activities* (5,768)
Total cash flow (71,978)
* Amounts adjusted to eliminate impact from financing activities between the Discontinued Operations and the Continuing Operations.
(g) Related Party Transactions
For the six months ended 30 June 2018
US$’000
Distribution and sales of goods 16
Pursuant to the master distribution and sale of goods agreement entered into on 17 November 2017 with FH (1937) for a term of three years commencing from 1 January 2018 and ending on 31 December 2020, certain distribution and sales of goods was made on mutually agreed normal commercial terms with FH (1937) and its associates.
Li & Fung Limited Interim Report 201988 Notes to Condensed Interim Financial Information (continued)
16 Contingent Liabilities
Unaudited Audited
30 June 31 December
2019 2018
US$’000 US$’000
Guarantees in respect of banking facilities granted to: Associated company – 750
17 Capital Commitments
Unaudited Audited
30 June 31 December
2019 2018
US$’000 US$’000
Contracted but not provided for:
Property, plant and equipment 6,433 14,248
System development, software and other license costs 1,354 2,756
7,787 17,004
18 Related Party Transactions from Continuing OperationsThe Continuing Operations of the Group had the following material transactions with its related parties during the six months ended 30 June 2019 and 2018:
UnauditedSix months ended 30 June
2019 2018
Note US$’000 US$’000
(Restated)
Distribution and sales of goods (i) 6,897 9,231
Operating leases rental and license fee received (ii) 2,218 2,226
Sourcing and supply chain management services income (iii) 471,515 636,331
Logistics related services income (iv) 4,422 9,286
Sourcing and supply chain management services income (v) – 13,692
Service fee income (vi) 12,304 6,295
Rental income (vii) 1,645 880
Ancillary sourcing and logistics income (viii) 1,376 1,481
Underlying FOB value of ordered products (viii) 15,084 4,460
89Li & Fung Limited Interim Report 2019Notes to Condensed Interim Financial Information (continued)
18 Related Party Transactions from Continuing Operations (continued)
NOTES:
(i) Pursuant to the master distribution and sale of goods agreement entered into on 17 November 2017 with FH (1937) for a term of three years commencing from 1 January 2018 and ending on 31 December 2020, certain distribution and sales of goods was made on mutually agreed normal commercial terms with FH (1937) and its associates.
(ii) Pursuant to the master lease agreement for leasing of properties or sub-leasing and/or licensing arrangement dated 14 November 2016 entered into with FH (1937) and its associates for a term of three years ending 31 December 2019, the Group had rental charge for certain properties leased from FH (1937) and its associates during the period based on mutually agreed normal commercial terms. For the six months ended 30 June 2019, aggregate operating lease rental and license fee received approximated to US$2,218,000 (2018:US$2,226,000).
(iii) Pursuant to the buying agency agreement entered into with Global Brands Group on 14 November 2016, the Group provided sourcing and supply chain management services to Global Brands Group and its associates for a term of three years, commencing on 9 July 2017 and ending on 31 March 2020. For the six months ended 30 June 2019, the Group provided sourcing and supply chain management services to Global Brands Group with an aggregate income, consisting of commission and FOB of all products and components sourced, of approximately US$471,515,000 (2018: US$636,331,000).
(iv) Pursuant to the master agreement for provision of logistics-related services entered into on 17 November 2017, the Group provided certain logistics-related services to FH (1937) and its associates for a term of three years ending 31 December 2020. For the six months ended 30 June 2019, the aggregate service income, excluding the passed-through costs for direct freight forwarding, approximated to US$4,422,000 (2018: US$9,286,000).
(v) Pursuant to the sourcing and supply chain management agreement entered into with Trinity on 7 June 2017, the Group provided sourcing and supply chain management services to Trinity and its associates for a term from 1 June 2017 to 31 December 2019. Trinity ceased to be a related party to the Group from 18 April 2018 and the commission received for sourcing and supply chain management services provided to Trinity for the period from 1 January 2018 to 17 April 2018 was US$1,522,000 and the underlying FOB value of the ordered products was US$12,170,000.
(vi) Pursuant to services agreement entered into with LH Pegasus Holding Limited (“LH Pegasus”), an indirect subsidiary of FH (1937) on 3 April 2018, the Group provided certain back office functions related to IT, human resources, finance and accounting, corporate services and global transaction services to LH Pegasus and its subsidiaries for a term from 3 April 2018 to 31 December 2019. For the six months ended 30 June 2019, aggregate services fee received was US$12,304,000 (2018: US$6,295,000).
(vii) Pursuant to master property agreement entered into with LH Pegasus on 3 April 2018, the Group and LH Pegasus had rental and license fee to and from one another for certain sub-lease and license office, showroom and warehouse premises for a term from 3 April 2018 to 31 December 2020. For the six months ended 30 June 2019, aggregate rental and license fee received approximated to US$1,645,000 (2018: US$880,000).
(viii) Pursuant to ancillary sourcing, logistics and trading services agreement entered into with LH Pegasus on 3 April 2018 for a term from 3 April 2018 to 31 December 2020. The Group provided agency-based sourcing and logistics services to LH Pegasus. LH Pegasus provide principal trading services to the Group. For the six months ended 30 June 2019, aggregate amount of the Group’s ancillary sourcing income, logistics service income excluding the pass-through costs for direct freight forwarding and trading services expenses including the underlying FOB value of the ordered products was approximated to US$16,460,000 (2018: US$5,941,000).
(ix) For the period from 1 January 2018 to 31 October 2018, the Group charged FH (1937) for costs incurred on certain centralized office support functions (including corporate services, regional information technology support and human resources) on an actual recovery basis, amounting to US$14,253,000 for the six-months ended 30 June 2018.
(x) Pursuant to a services agreement entered into with Fung Corporate Services Group Limited (“FCSG”) in November 2018 (“Service Agreement”), certain employees of the Group who provide centralized office support functions were transferred to FCSG to consolidate centralized offices support functions among different Fung Group companies. Based on the specific services provided under the Services Agreement, FSCG charged the Group on an actual costs recovery basis, amounting to US$27,500,000 for the six months ended 30 June 2019 (2018: Nil).
Save as above, the Group had no material related party transactions during the period.
Li & Fung Limited Interim Report 201990 Notes to Condensed Interim Financial Information (continued)
19 Financial Risk ManagementThe Group’s activities expose it to a variety of financial risks: market risk (including foreign exchange risk, fair value interest rate risk, cash flow interest rate risk and price risk), credit risk, and liquidity risk. The Group’s overall risk management program focuses on the unpredictability of financial markets and seeks to minimize potential adverse effects on the Group’s financial performance. The Group uses derivative financial instruments to hedge certain risk exposures.
(a) Market Risk(I) FOREIGN EXCHANGE RISK
Most of the Group’s cash balances are HK dollar and US dollar deposits with major global financial institutions and most of the Group’s borrowings are denominated in US dollars.
The Group’s revenues and payments are predominantly transacted in US dollars. Therefore, it considers there is no significant risk exposure in relation to foreign exchange rate fluctuations. There are small portions of sales and purchases transacted in different currencies, for which the Group arranges hedging through foreign exchange forward contracts.
For transactions that are subject to foreign exchange risk, the Group hedges its foreign currency exposure once it receives confirmed orders or enters into customer transactions. To mitigate the impact from changes in foreign exchange rates, the Group regularly reviews its operations in these countries and makes necessary hedging arrangements in certain currencies against the US dollar.
However, the Group does not enter into foreign currency hedges with respect to the local financial results and long-term equity investments of its non-US dollar foreign operations for either income statements or balance sheet reporting purposes. Since the Group’s functional currency is the US dollar, it is subject to exchange rate exposure from the translation of foreign operations’ local results to US dollars at the average rate for the period of group consolidation. The Group’s net equity investments in non-US dollar-denominated businesses are also subject to unrealized translation gain or loss on consolidation. Fluctuation of relevant currencies against the US dollar will result in unrealized gain or loss from time to time, which is reflected as movement in exchange reserve in the consolidated statement of changes in equity.
From a medium-to long-term perspective, the Group manages the operations in the most cost-effective way possible within its global network. The Group strictly prohibits any financial derivative arrangement merely for speculation.
(II) PRICE RISKThe Group is exposed to price risk because of investments held by the Group and classified on the consolidated balance sheet as available-for-sale financial assets. The Group maintains these investments for long-term strategic purposes and the Group’s overall exposure to price risk is not significant.
At 30 June 2019 and up to the date of the Group’s interim financial information, the Group held no material financial derivative instruments except for certain foreign exchange forward contracts entered into for hedging of foreign exchange risk exposure on sales and purchases transacted in different currencies. At 30 June 2019, fair value of foreign exchange forward contracts entered into by the Group amounted to US$789,000 (31 December 2018: US$3,985,000), which has been reflected in full in the Group’s consolidated balance sheet as derivative financial instruments assets.
91Li & Fung Limited Interim Report 2019Notes to Condensed Interim Financial Information (continued)
19 Financial Risk Management (continued)
(a) Market Risk (continued)
(III) CASH FLOW AND FAIR VALUE INTEREST RATE RISKAs the Group has no significant interest-bearing assets, the Group’s income and operating cash flows are substantially independent of changes in market interest rates.
The Group’s interest rate risk arises mainly from US dollar denominated bank borrowings and the US dollar denominated long-term notes issued. Bank borrowings at variable rates expose the Group to cash flow interest rate risk. The Group’s policy is to maintain a diversified mix of variable and fixed rate borrowings based on prevailing market conditions.
(b) Credit RiskCredit risk mainly arises from trade and other receivables as well as cash and bank balances of the Group. The Group’s principal trading business carries a higher credit risk profile given that it is acting as a supplier and therefore takes full counterparty risk of its customers in terms of accounts receivable and inventory.
In addition, as the Group provides working capital solutions to the suppliers via LF Credit by selectively settling accounts payable earlier at a discount, it also assumes direct counterparty risk for the customers for such receivables. With the increased insolvency risk among global brands and retail customers, the Group has deployed a global credit risk management framework with tightened risk profile, and applied prudent policies to manage its credit risk with such receivables that include, but are not limited to, the measures set out below:
(i) The Group selects customers in a cautious manner. Its credit control team used a risk assessment system to evaluate the financial strength of individual customers prior to agreeing on the trade terms. It is not uncommon that the Group requires securities (such as standby or commercial letter of credit, or bank guarantee) from customers that fall short of the required minimum score under its risk assessment system;
(ii) A significant portion of trade receivable balances are covered by trade credit insurance or factored to external financial institutions on a non-recourse basis;
(iii) It has established a credit risk system with a dedicated team, and tightened policies to ensure on-time recoveries from trade debtors; and
(iv) It has put in place rigid internal policies that govern provisions made for both inventories and receivables to motivate business managers to step up the efforts in these two areas so as and to avoid any significant impact on their financial performance.
(c) Liquidity RiskPrudent liquidity risk management implies maintaining sufficient cash on hand and the availability of funding through an adequate amount of committed credit facilities from the Group’s bankers.
Management monitors rolling forecasts of the Group’s liquidity reserve (comprises undrawn borrowing facilities and cash and cash equivalents) on the basis of expected cash flow.
Li & Fung Limited Interim Report 201992 Notes to Condensed Interim Financial Information (continued)
20 Fair Value EstimationThe table below analyses financial instruments carried at fair value, by valuation method. The different levels have been defined as follows:
• Quoted prices (unadjusted) in active markets for identical assets or liabilities (level 1).
• Inputs other than quoted prices included within level 1 that are observable for the asset or liability, either directly (that is, as prices) or indirectly (that is, derived from prices) (level 2).
• Inputs for the asset or liability that are not based on observable market data (that is, unobservable inputs) (level 3).
The following table presents the Group’s financial assets and liabilities that are measured at fair value at 30 June 2019.
Level 1 Level 2 Level 3 Total
US$’000 US$’000 US$’000 US$’000
Asset
Financial assets at FVOCI
— Club debentures – – 4,694 4,694
Derivative financial instrument used for hedging – 789 – 789
Total assets – 789 4,694 5,483
Liabilities
Purchase consideration payable for acquisitions – – 8,325 8,325
Total liabilities – – 8,325 8,325
The following table presents the Group’s financial assets and liabilities that are measured at fair value at 31 December 2018.
Level 1 Level 2 Level 3 Total
US$’000 US$’000 US$’000 US$’000
Assets
Financial assets at FVOCI
– Club debentures – – 4,601 4,601
Derivative financial instrument used for hedging – 3,985 – 3,985
Total assets – 3,985 4,601 8,586
Liabilities
Purchase consideration payable for acquisitions – – 8,960 8,960
Total liabilities – – 8,960 8,960
93Li & Fung Limited Interim Report 2019Notes to Condensed Interim Financial Information (continued)
20 Fair Value Estimation (continued)
The fair values of financial instruments traded in active markets are based on quoted market prices at the balance sheet date. A market is regarded as active if quoted prices are readily and regularly available from an exchange, dealer, broker, industry group, pricing service, or regulatory agency, and those prices represent actual and regularly occurring market transactions on an arm’s length basis. The quoted market price used for financial assets held by the Group is the current bid price. These instruments are included in level 1.
The fair values of financial instruments that are not traded in an active market (for example, over-the-counter derivatives) are determined by using valuation techniques. These valuation techniques maximize the use of observable market data where it is available and rely as little as possible on entity specific estimates. If all significant inputs required to fair value an instrument are observable, the instrument is included in level 2.
If one or more of the significant inputs is not based on observable market data, the instrument is included in level 3.
Specific valuation techniques used to value financial instruments include:
• Quoted market prices or dealer quotes for similar instruments.
• The fair value of forward foreign exchange contracts is determined using forward exchange rates at the balance sheet date, with the resulting value discounted back to present value.
• Other techniques, such as discounted cash flow analysis, are used to determine fair value for the remaining financial instruments.
There were no significant transfer of assets between level 1, level 2 and level 3 fair value hierarchy classifications during the period.
The following summarizes the major methods and assumptions used in estimating the fair values of the significant assets and liabilities classified as level 2 or 3 and the valuation process for assets and liabilities classified as level 3:
Derivative financial instruments used for hedgingThe Group relies on bank valuations to determine the fair value of financial assets/liabilities which in turn are determined using discounted cash flow analysis. These valuations maximize the use of observable market data. Foreign currency exchange prices are the key observable inputs in the valuation.
Purchase consideration payable for acquisitionsThe Group recognizes the fair value of those purchase considerations for acquisitions, as of their respective acquisition dates as part of the consideration transferred in exchange for the acquired businesses. These fair value measurements require, among other things, significant estimation of post-acquisition performance of the acquired businesses and significant judgment on time value of money. These calculations use cash flow projections for post-acquisition performance. The discount rate used is based on the prevailing incremental cost of borrowings of the Group at the time of acquisitions, which approximated to 2.5%.
Li & Fung Limited Interim Report 201994 Notes to Condensed Interim Financial Information (continued)
20 Fair Value Estimation (continued)
The following table presents the changes in level 3 instruments for the six months ended 30 June 2019 and 2018.
2019 2018
Purchase Consideration
Payable for Acquisitions Others
Purchase Consideration
Payable for Acquisitions Others
US$’000 US$’000 US$’000 US$’000
Opening balance as at 1 January (Audited) 8,960 4,601 61,583 4,338
Fair value gains – 93 – 250
Settlement – – (6,025) –
Remeasurement of purchase consideration payable for acquisitions (621) – – –
Others (14) – (396) –
Closing balance as at 30 June (Unaudited) 8,325 4,694 55,162 4,588
21 Subsequent EventOn 28 June 2019, the Group entered into a subscription agreement with an indirect wholly-owned subsidiary of Temasek, pursuant to which Temasek has agreed to acquire approximately 21.7% interest of LF Logistics, a wholly-owned subsidiary of the Company at the balance sheet date, for a cash consideration of US$300 million through subscription of new shares issued by LF Logistics. This transaction was completed on 8 August 2019.
22 Approval of Interim Financial InformationThe interim financial information was approved by the Board of Directors on 22 August 2019.