1. Report No. FHWA/LA.13/510 2. Government Accession No. 3. Recipient's Catalog No. 4. Title and Subtitle Automated Enforcement and Highway Safety Final Report 5. Report Date November 2013 6. Performing Organization Code LTRC Project Number: 10-3SS State Project Number: 30000203 7. Author(s) Susan Herbel, Cambridge Systematics Richard Retting, Sam Schwartz Engineering Elizabeth Wemple, P.E., Cambridge Systematics 8. Performing Organization Report No. 8527-001 9. Performing Organization Name and Address Cambridge Systematics 555 12 th Street, Suite 1600 Oakland, CA 94607 10. Work Unit No. 11. Contract or Grant No. 12. Sponsoring Agency Name and Address Louisiana Department of Transportation and Development P.O. Box 94245 Baton Rouge, LA 70804-9245 13. Type of Report and Period Covered Technical Report May 2011- May 2013 14. Sponsoring Agency Code 15. Supplementary Notes 16. Abstract The objectives of the Automated Enforcement and Highway Safety Research study were to conduct a literature review of national research related to the effectiveness of Red Light Camera (RLC) programs in changing crash frequency, crash severity, crash costs, and violations; to identify red light running program noteworthy practices, strengths, weaknesses, opportunities, and barriers; establish a record of current RLC applications in Louisiana communities and the observed safety impact of the programs; conduct a survey to understand public perception of RLC programs in Louisiana; review the existing statewide RLC policy, compare it to noteworthy practices, and identify potential improvements; and develop a guidebook for implementing red light camera programs. The research led to recommendations to modify state policy to improve public support for RLC. Potential modifications include enhanced public education programs, additional signage and clarification on the determination of right turn on red violations at signalized intersections with red light cameras. The research also includes recommendations to maximize local agency involvement in site selection. 17. Key Words Red Light Camera, traffic engineering, automated enforcement, crash reduction, Louisiana 18. Distribution Statement Unrestricted. This document is available through the National Technical Information Service, Springfield, VA 21161. 19. Security Classif. (of this report) 20. Security Classif. (of this page) 21. No. of Pages 22. Price TECHNICAL REPORT STANDARD PAGE
Transcript
1. Report No. FHWA/LA.13/510
2. Government Accession No. 3. Recipient's Catalog No.
4. Title and Subtitle Automated Enforcement and Highway Safety Final Report
5. Report Date
November 2013 6. Performing Organization Code LTRC Project Number: 10-3SS State Project Number: 30000203
7. Author(s)
Susan Herbel, Cambridge Systematics Richard Retting, Sam Schwartz Engineering Elizabeth Wemple, P.E., Cambridge Systematics
8. Performing Organization Report No. 8527-001
9. Performing Organization Name and Address Cambridge Systematics 555 12th Street, Suite 1600 Oakland, CA 94607
10. Work Unit No.
11. Contract or Grant No.
12. Sponsoring Agency Name and Address
Louisiana Department of Transportation and Development P.O. Box 94245 Baton Rouge, LA 70804-9245
13. Type of Report and Period Covered
Technical Report May 2011- May 2013
14. Sponsoring Agency Code
15. Supplementary Notes
16. Abstract
The objectives of the Automated Enforcement and Highway Safety Research study were to conduct a literature review of national research related to the effectiveness of Red Light Camera (RLC) programs in changing crash frequency, crash severity, crash costs, and violations; to identify red light running program noteworthy practices, strengths, weaknesses, opportunities, and barriers; establish a record of current RLC applications in Louisiana communities and the observed safety impact of the programs; conduct a survey to understand public perception of RLC programs in Louisiana; review the existing statewide RLC policy, compare it to noteworthy practices, and identify potential improvements; and develop a guidebook for implementing red light camera programs. The research led to recommendations to modify state policy to improve public support for RLC. Potential modifications include enhanced public education programs, additional signage and clarification on the determination of right turn on red violations at signalized intersections with red light cameras. The research also includes recommendations to maximize local agency involvement in site selection.
17. Key Words
Red Light Camera, traffic engineering, automated enforcement, crash reduction, Louisiana
18. Distribution Statement Unrestricted. This document is available through the National Technical Information Service, Springfield, VA 21161.
19. Security Classif. (of this report)
20. Security Classif. (of this page)
21. No. of Pages
22. Price
TECHNICAL REPORT STANDARD PAGE
Project Review Committee
LTRC appreciates the dedication of the following Project Review Committee Members in
guiding this research study to fruition.
LTRC Administrator/Manager
Kirk Zeringue, P.E.
Members
Peter Allain, P.E., PTOE, Louisiana Department of Transportation and
Development
Robert Canfield, P.E., Consultant
Dan Magri, P.E., Louisiana Department of Transportation and Development
Tony Tramel, P.E., PTOE, Lafayette Consolidated Government
Marie Walsh, Ph.D., LTAP/LTRC
Directorate Implementation Sponsor
Richard Savoie, P.E.
DOTD Chief Engineer
LTRC Automated Enforcement and Highway Safety
by
Susan Herbel, Cambridge Systematics, Inc.
Richard Retting, Sam Schwartz Engineering
Elizabeth Wemple, P.E., Cambridge Systematics, Inc.
Cambridge Systematics, Inc.
4800 Hampden Lane, Suite 800
Bethesda, MD 20814
LTRC Project No. 10-3SS
State Project No. 30000203
conducted for
Louisiana Department of Transportation and Development
Louisiana Transportation Research Center
The contents of this report reflect the views of the author/principal investigator who is
responsible for the facts and the accuracy of the data presented herein. The contents do not
necessarily reflect the views or policies of the Louisiana Department of Transportation and
Development or the Louisiana Transportation Research Center. This report does not
constitute a standard, specification, or regulation.
November 2013
iii
ABSTRACT
The objectives of the Automated Enforcement and Highway Safety Research study were to
conduct a literature review of national research related to the effectiveness of Red Light
Camera (RLC) programs in changing crash frequency, crash severity, crash costs, and
violations; identify red light running program noteworthy practices, strengths, weaknesses,
opportunities, and barriers; establish a record of current RLC applications in Louisiana
communities and the observed safety impact of the programs; conduct a survey to understand
public perception of RLC programs in Louisiana; review the existing statewide RLC policy,
compare it to noteworthy practices, identify potential improvements; and develop a
guidebook for implementing red light camera programs. The research led to
recommendations to modify state policy to improve public support for red light cameras.
Potential modifications include enhanced public education programs, additional signage, and
clarification on right-turn-on-red violations at signalized intersections with red light cameras.
The research also includes recommendations to maximize local agency involvement in site
selection.
v
IMPLEMENTATION STATEMENT
This study was conducted to summarize currently understood research about the
effectiveness of red light cameras at signalized intersections and to understand public
perceptions about red light cameras at signalized intersections. The research led to
recommendations to modify state policy to improve public support for red light cameras and
development of a public education guidebook for communities considering implementing red
light cameras.
The potential outcomes from implementing the results of this research project and
distributing the project guidebook include improved public support for red light cameras in
Louisiana, implementation of red light cameras in more communities in Louisiana, and
reduced frequency and severity of angle crashes at signalized intersections in Louisiana.
vii
TABLE OF CONTENTS
ABSTRACT ............................................................................................................................. iii
Tier 2 151 to 300 citations equivalent fully paid per calendar month $28.00
Tier 3 301 Plus citations equivalent fully paid per calendar month $15.50
Source: Final Contract Document, Exhibit D: Compensation and Pricing. Provided by LCG DTT
Outreach. No formal public education plan was adopted, but intense reporting occurred on
this matter by print and electronic media during the adoption and implementation of the
SafeLight Program. Additionally the vendor implemented an initial media campaign. The
vendor program consisted of radio and television spots, a 30 day warning period before
violations were issued for the first group of cameras installed, and a press release when
subsequent intersections were outfitted with the cameras. The LCG Council appropriated
$50,000 in Fiscal Year 2010-2011 to begin a safety-oriented campaign, and a similar
allocation has been appropriated for Fiscal Year 2011-2012 to continue the outreach.
Violations. LCG Council approved the RLC ordinance on September 21, 2006, and the
contract with Redflex was signed in 2007. The DTT releases a monthly table of violations
on its website. The total number of violations from the start of the program through March
2011 is 48,538.
An adjudication bureau of local attorneys hears appeals. If violators wish to take the matter
further, they can appeal to the 15th Judicial District Court. Since the program’s inception, no
violator has proceeded to the 15th Judicial District Court, and no violations have been
overturned other than those determined by the Adjudication Bureau during the initial appeal
process. According to LCG, Redflex initially scheduled approximately 10 hearings every
week, but currently holds between four and six hearings a year.
Effectiveness. According to the SafeLight/SafeSpeed Lafayette Program Status Report to
LCG dated July 20, 2011, the program has not been operational long enough to perform a
technically and statistically significant comparison of before and after crashes at intersections
with RLCs. Lafayette has performed a trend analysis of traffic crash data, comparing data
from the current operating time with the same amount of time prior to installation at an
intersection. For instance, if a SafeLight intersection has been operating for 14 months, the
data are compared with the data from 14 months prior to installation. A reduction in crashes
21
as well as improvement in driver behavior appears to be occurring. Table 4 summarizes this
information.
Table 4 Summary of traffic crashes at SafeLight locations within 100 ft
Summary of Traffic Crashes at SafeLight Locations Within 100’ Before Period After Period Difference Percent Change
Total Crashes 332 117 215 -65% Right Angle Crashes 131 56 75 -57%
Rear-End Crashes 118 40 78 -66% Source: Traffic Crash Statistics at SafeLight Locations, Program Status Report, July 20, 2011
Public Opinion. David Walker with Market Research and Analysis conducted two traffic
safety public opinion surveys 2001 and 2005 in Louisiana: Traffic and Public Safety in
Lafayette Parish (2001) and Signal Light Cameras in Louisiana (2005). The majority
(65 percent) of those surveyed in the Signal Light Cameras in Louisiana survey support the
placement of cameras at traffic signals, with 23 percent identifying red light running as a
frequent traffic violation and 82 percent reporting red light running as either extremely or
very dangerous. The results from the Traffic and Public Safety in Lafayette Parish survey
were similar, with 65 percent indicating red light running as extremely dangerous and
25 percent indicating that it is very dangerous. The majority of respondents (64 percent)
supported cameras at signal lights and 72 percent thought cameras would reduce the
frequency of red light running. Table 5 shows public opinion regarding cameras at
intersection prior to implementation.
Table 5 Public opinion of RLCs before installation
Do you support or oppose the use of cameras at traffic signals? (pre implementation) Support Oppose Don’t Know
Traffic & Public Safety, Lafayette, 2001 64% 30% 6% Signal Light Cameras, Louisiana Voters, 2005 63% 16% 21%
Source: Signal Light Cameras: State of Louisiana, July 31-August 3, 2005, and Traffic and Public Safety: Lafayette Parish, October 11-13, 2001, Market Research and Analysis
Southern Media and Opinion conducted subsequent opinion polls and prepared a report after
implementation of RLCs at intersections. These include two for Lafayette Parish in 2008 and
2009 and a statewide poll in 2009. A majority (71.2 percent in 2008 and 73 percent in 2009)
of those surveyed in Lafayette believe the use of cameras will reduce the number of people
who drive through red lights. Table 6 displays the survey responses related to support/
opposition of RLCs.
22
Table 6 Public opinion of RLCs after installation
Do you support or oppose the use of cameras at intersections with red lights? (post implementation) Strongly Support Support (Neutral) Oppose Strongly Oppose Don’t Know
Source: Lafayette Parish Public Opinion Survey, April 2008 & August 2009; Louisiana Voters Public Opinion Survey, August 2009, Southern Media & Opinion Research, Inc.
Public opinion surveys have not been conducted prior to or since the implementation of RLC programs in Baton Rouge.
Results of Tier 1 Public Opinion Intercept Survey
This section provides a summary of the responses to the Tier 1 survey questions by region
(Baton Rouge, Lafayette, Alexandria, and statewide).
Presence of RLC Program
Respondents were asked whether there is a RLC program where they live or work. As
expected, a higher percentage of participants in Baton Rouge and Lafayette indicated a RLC
program where they live (70.9 percent and 74 percent, respectively) and where they work
(90 percent and 74.7 percent, respectively) compared to respondents in Alexandria or
statewide. However, although Alexandria currently does not have a RLC program,
37.1 percent of Alexandria respondents indicated a RLC program where they live. Figure 1
summarizes the participant responses by region.
Figure 1 Percentage of respondents with a RLC Program by where they live/work
70.9%
90.0%
74.0% 74.7%
38.8% 38.8%37.1%
46.8%
0%
10%
20%
30%
40%
50%
60%
70%
80%
90%
100%
Live Work
Baton Rouge Lafayette Alexandria Statewide
23
Opinion on Whether RLR is a Problem
Tier 1 respondents were asked whether red light running is a problem where they live. Of
those who indicated yes or no, the results were nearly divided. In Baton Rouge, 43.6 percent
of respondents believe red light running is a problem in the community in which they live,
compared to 34.6 percent who do not believe it is a problem. Conversely in Lafayette, 32
percent believe it is a problem, while 41.3 percent do not. Nearly 39 percent of Alexandria
respondents believe it is a problem, while 34.7 percent do not. Finally, 35.7 percent of the
statewide respondents indicated red light running is a problem compared to 42.6 percent who
indicated otherwise. Figure 2 summarizes these results. Accounting for the error rates,
respondents are essentially evenly split in their opinion as to whether red light running is a
problem.
Figure 2
Percentage of respondents who believe red light running is a problem
The results in Figure 2 differ slightly from the public opinion survey conducted by Market
Research and Analysis for Lafayette in 2005. In that survey, respondents were asked, “How
much of a problem do you believe red light running is in your community? Would you say
it’s an extremely big problem, big problem, somewhat of a problem, or not a problem?” In
the Lafayette survey, 58 percent of respondents felt red light running was either an extremely
big problem or big problem with an additional 27 percent indicating they felt like it was
somewhat of a problem. In this survey, only 9 percent of respondents did not believe red
light running was a problem in their community as opposed to 41 percent in this survey. Five
percent did not know or would not say.
43.6%
34.6%
19.0%
2.8%
32.0%
41.3%
23.3%
3.3%
38.8%
34.7%
22.4%
4.1%
35.7%
42.6%
14.4%
7.3%
0%
5%
10%
15%
20%
25%
30%
35%
40%
45%
50%
Yes No Don't know No opinion
Baton Rouge Lafayette Alexandria Statewide
24
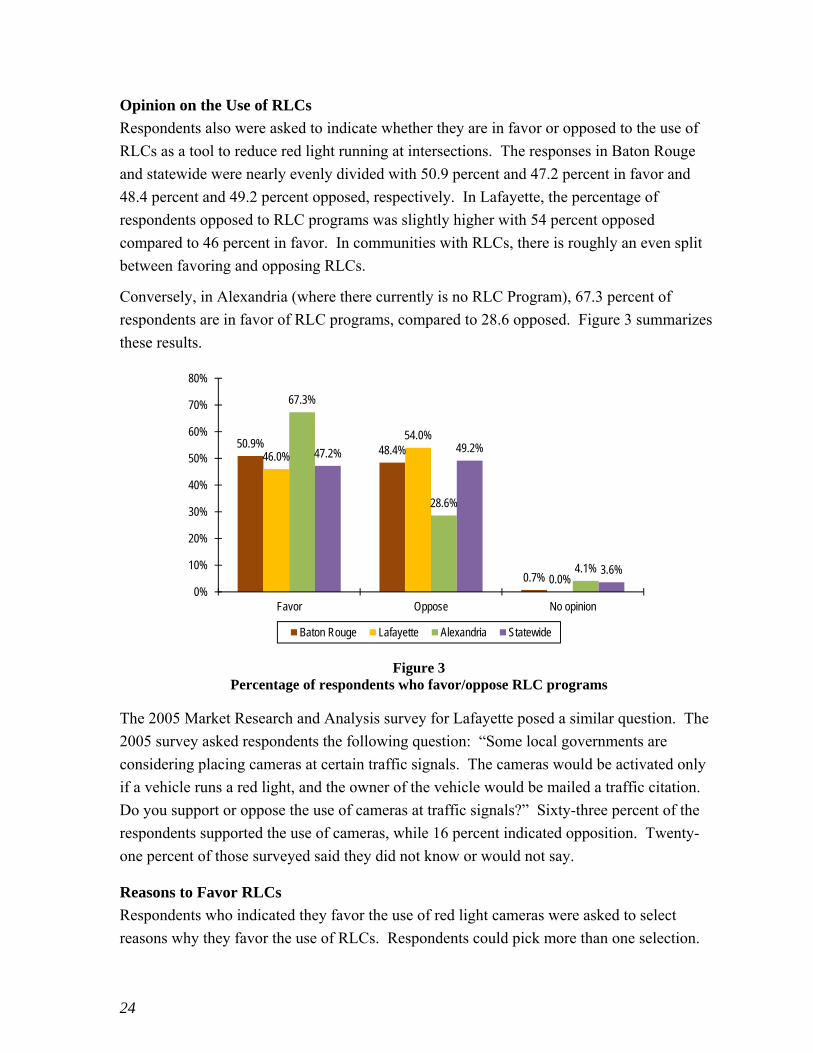
Opinion on the Use of RLCs
Respondents also were asked to indicate whether they are in favor or opposed to the use of
RLCs as a tool to reduce red light running at intersections. The responses in Baton Rouge
and statewide were nearly evenly divided with 50.9 percent and 47.2 percent in favor and
48.4 percent and 49.2 percent opposed, respectively. In Lafayette, the percentage of
respondents opposed to RLC programs was slightly higher with 54 percent opposed
compared to 46 percent in favor. In communities with RLCs, there is roughly an even split
between favoring and opposing RLCs.
Conversely, in Alexandria (where there currently is no RLC Program), 67.3 percent of
respondents are in favor of RLC programs, compared to 28.6 opposed. Figure 3 summarizes
these results.
Figure 3 Percentage of respondents who favor/oppose RLC programs
The 2005 Market Research and Analysis survey for Lafayette posed a similar question. The
2005 survey asked respondents the following question: “Some local governments are
considering placing cameras at certain traffic signals. The cameras would be activated only
if a vehicle runs a red light, and the owner of the vehicle would be mailed a traffic citation.
Do you support or oppose the use of cameras at traffic signals?” Sixty-three percent of the
respondents supported the use of cameras, while 16 percent indicated opposition. Twenty-
one percent of those surveyed said they did not know or would not say.
Reasons to Favor RLCs
Respondents who indicated they favor the use of red light cameras were asked to select
reasons why they favor the use of RLCs. Respondents could pick more than one selection.
50.9% 48.4%
0.7%
46.0%
54.0%
0.0%
67.3%
28.6%
4.1%
47.2% 49.2%
3.6%
0%
10%
20%
30%
40%
50%
60%
70%
80%
Favor Oppose No opinion
Baton Rouge Lafayette Alexandria Statewide
25
Their options included: “Reduces red light running,” “reduces crashes,” and “encourages
drivers to obey traffic laws.” Respondents could also fill in their own responses. With the
exception of Alexandria respondents, the most popular reason to favor RLCs is to encourage
drivers to obey traffic laws. Reducing crashes elicited the highest response for Alexandria
respondents. Figure 4 summarizes the percentage of respondents selecting each option by
region.
Figure 4
Reasons to support RLC programs (among those who favor)
While the “other” responses varied, a common response was RLCs encourage drivers to pay
more attention. Others responded RLCs encourage drivers to obey traffic laws and reduce
angle crashes, making them feel safer.
Reasons to Oppose RLCs
Of the Tier 1 combined survey respondents, the 581 respondents who indicated they oppose
the use of RLCs were asked to select reasons why they oppose RLC use. Respondents were
asked to select from the following options: “It is just a program to increase revenue for local
government and/or the police department,” “RLCs go against our system of justice since no
police officer actually witnessed the driver committing the offense,” and “Do not think they
are effective.” Respondents could select as many reasons as appropriate and also fill in their
own response.
From the selections provided, the greatest percentage of respondents indicated RLC use goes
against our system of justice and is a program to increase revenue. Fewer respondents
indicated RLCs are not effective or selected the other category. These results are
summarized in Figure 5.
71.4
%
66.0
%
81.6
%
10.2
%
69.6
%
58.0
%
81.2
%
8.7%
60.6
%
75.8
%
72.7
%
9.1%
65.7
%
67.9
%
81.6
%
6.2%
0%
10%
20%
30%
40%
50%
60%
70%
80%
90%
Reduce RLR Reduce crashes Obey Traffic Laws Other
Baton Rouge Lafayette Alexandria Statewide
26
Figure 5
Reasons to oppose RLC programs (among those who oppose)
This question also allowed respondents to provide an “other” response. While the responses
varied, several underlying opposition themes were identified:
Increases rear-end crashes and creates a more dangerous situation because people
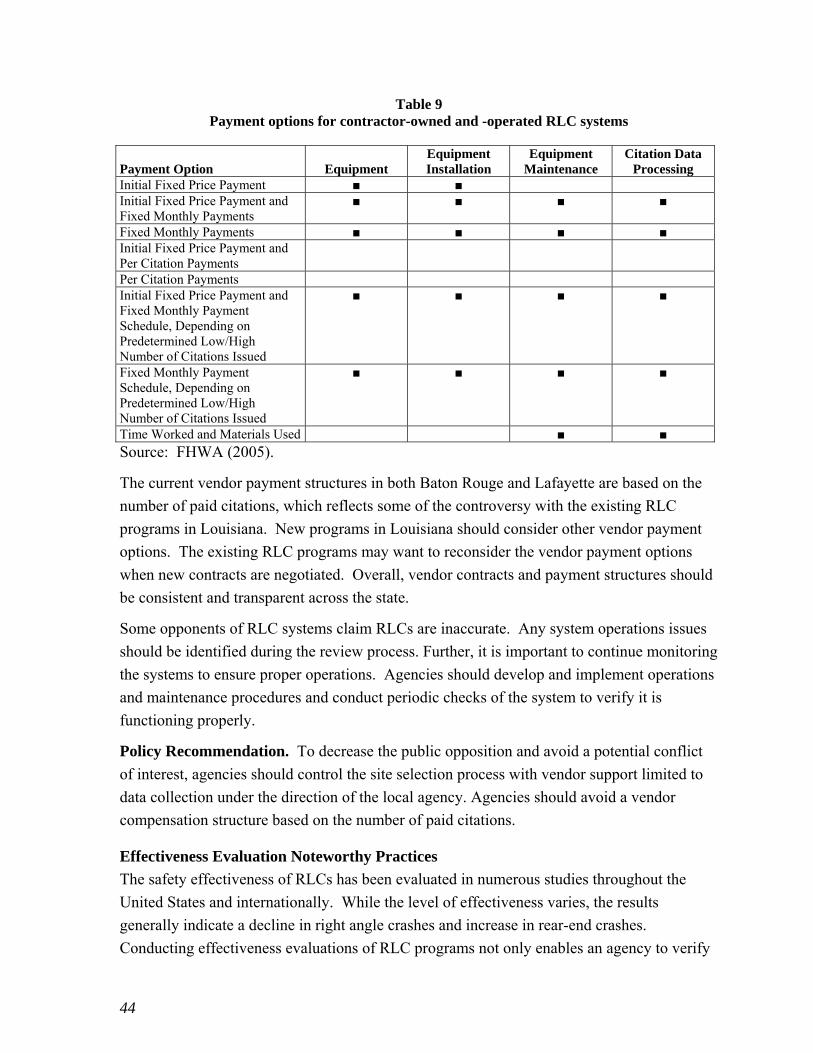
Fixed Monthly Payments ■ ■ ■ ■ Initial Fixed Price Payment and Per Citation Payments
Per Citation Payments Initial Fixed Price Payment and Fixed Monthly Payment Schedule, Depending on Predetermined Low/High Number of Citations Issued
■ ■ ■ ■
Fixed Monthly Payment Schedule, Depending on Predetermined Low/High Number of Citations Issued
■ ■ ■ ■
Time Worked and Materials Used ■ ■
Source: FHWA (2005).
The current vendor payment structures in both Baton Rouge and Lafayette are based on the
number of paid citations, which reflects some of the controversy with the existing RLC
programs in Louisiana. New programs in Louisiana should consider other vendor payment
options. The existing RLC programs may want to reconsider the vendor payment options
when new contracts are negotiated. Overall, vendor contracts and payment structures should
be consistent and transparent across the state.
Some opponents of RLC systems claim RLCs are inaccurate. Any system operations issues
should be identified during the review process. Further, it is important to continue monitoring
the systems to ensure proper operations. Agencies should develop and implement operations
and maintenance procedures and conduct periodic checks of the system to verify it is
functioning properly.
Policy Recommendation. To decrease the public opposition and avoid a potential conflict
of interest, agencies should control the site selection process with vendor support limited to
data collection under the direction of the local agency. Agencies should avoid a vendor
compensation structure based on the number of paid citations.
Effectiveness Evaluation Noteworthy Practices
The safety effectiveness of RLCs has been evaluated in numerous studies throughout the
United States and internationally. While the level of effectiveness varies, the results
generally indicate a decline in right angle crashes and increase in rear-end crashes.
Conducting effectiveness evaluations of RLC programs not only enables an agency to verify
45
the program is resulting in the intended outcome, i.e., a reduction in RLR crashes, the results
can also be used to educate the public on the effectiveness of the cameras for improving
safety. Many opponents of RLCs claim they are ineffective in reducing crashes, and
effectiveness evaluations can provide documentation to refute this claim (assuming a decline
in targeted crashes).
The type of study methodology used for evaluating effectiveness of the RLCs (site-specific
or as a whole) is a significant factor in the reliability of the results. Simple observational
before/after studies are commonly used by agencies to evaluate the effectiveness of safety
treatments. While this methodology is simple, it lends itself to two significant flaws – the
results may be biased due to the effects of regression-to-the mean and lack of control sites.
Regression to the mean is a statistical phenomenon in which a period with a comparatively
high observed crash frequency will likely be followed by a comparatively lower crash
frequency. This also applies to the converse situation; a low crash frequency period will
probably be followed by a high crash frequency period. Since RLCs are intended to be
installed at high crash locations, it is likely the result of a simple before after study will
overestimate the effectiveness of the RLCs in reducing crashes. Additionally, the simple
before/after study does not account for changes in conditions at the camera site or in the
broader community, such as traffic volumes, driver behavior, or weather, which can impact
crash frequency.
Advanced statistical evaluation methods can provide a more accurate estimate of the
effectiveness of RLCs by accounting for the potential effects of regression to the mean
through the use of control sites. These methods include: observational before/after study
using a comparison group, observational before/after study using the Empirical Bayes
method, and cross-sectional studies. The HSM provides more information on evaluation
study types.
An additional challenge with evaluating RLC effectiveness is the potential for spillover
effects at intersections without RLCs. FHWA (2005) defined “spillover effect” as “the
expected effect of RLCs on intersections other than the ones actually treated, resulting from
jurisdiction-wide publicity and the general lack of knowledge of where RLCs are installed.”
Spillover effects actually increase the effectiveness of RLCs by spreading the benefits to
other intersections in the jurisdiction. However, due to spillover effects, the actual
effectiveness of RLCs may be underestimated, particularly when the evaluation study method
has a strong reliance on comparison sites.
Previous RLC evaluation efforts can also provide some insight into considerations for the
evaluation study design. The 2005 FHWA report on Safety Evaluations of Red Light
46
Cameras identified a number of lessons learned based on previous studies for developing a
defensible RLC evaluation. These include:
Number of treatment sites. Evaluating a low number of sites provides results with a
low level of significance.
RLC “spillover effects” in the same city. The RLC may impact the crash
experience at control or comparison sites located in the same city. Therefore it may
be necessary to use control or comparison sites located in similar cities for the
evaluation or a study design that does not rely on comparison sites.
Differences in crash investigations and reporting practices between jurisdictions.
This can make it difficult to aggregate results or to make comparisons between
different jurisdictions.
Defining “red light-running crashes.” Previous studies have lacked a precise
definition of what constitutes a red light crash, making it difficult to compare results.
Also, police crash report forms do not always clearly differentiate between angle and
turning crashes, and it is difficult to determine whether a right turn on red crash was
“legal.”
RLC effects on rear-end crashes. Since many previous studies have indicated an
increase in rear-end crashes with implementation of RLCs, it is imperative to consider
this crash type in the analysis and to provide a tradeoff analysis for the reduction in
right angle crashes. An economic analysis provides a quantitative result that can help
the public understand these tradeoffs.
Exposure changes between before/after periods. Many RLC evaluation studies
have not accounted for changes in traffic volumes during the before and after periods.
Exposure is a major determinant of intersection crashes and should be accounted for
in the evaluation methodology.
Regression to the mean effects. Since RLCs are targeted at intersections with a high
RLR crash experience, evaluation studies are subject to the effects of regression to the
mean. If not accounted for in the evaluation study methodology, this may cause an
overestimation of the effectiveness of the RLCs in reducing crash frequency or crash
severity.
Yellow interval improvements (and other intersection improvements) made at
the time of RLC installation. It can be difficult to distinguish between the effects of
47
RLCs and other intersection improvements. However, since some studies have
shown that other intersection improvements can be just as effective in reducing RLR
crashes, it is important to separate the effects of these other improvements from RLCs
when evaluating effectiveness.
Disaggregate effects by signalization variables. Little knowledge currently exists
on the effects of signalization variables (i.e., cycle length and yellow and all-red
interval combinations). However, these effects would be useful in planning RLC
programs or explaining the different results across sites or jurisdictions.
Effect of signage. Previous evaluations have provided varying results on the effects
of signage at intersections with RLCs, as well as other intersections in the
jurisdiction. These effects need to be further investigated.
Public education level. The impacts of public education on the effectiveness of a
RLC program needs to be further investigated.
Definition of red light violation. Defining what constitutes a red light violation may
affect public perception and citation practices. For example, the amount of time
allotted as a “grace period” after the signal turns red prior to issuing a ticket could
have different impacts on the number of citations issued.
Relationship between changes in violations and changes in crashes. A
relationship has not yet been established; however, such a relationship would make it
much easier to evaluate RLC installations.
As previously mentioned in the discussion of the effects of RLCs on rear-end crashes, an
economic analysis would help the public understand the tradeoffs between a potential
increase in rear-end crashes and a decrease in angle crashes associated with the installation of
a RLC. Relative crash frequency may not change significantly, but crash severity will likely
decrease because rear-end crashes are usually less severe than angle crashes. Similar crash
effects are associated with the installation of traffic signals. The economic benefits of
reducing angle crashes would be greater than the disbenefit of an increase in rear-end
crashes. An economic evaluation also provides a method to compare the cost effectiveness
of RLCs to the cost effectiveness of other countermeasures aimed at reducing RLR crashes at
intersections.
In addition to the economic burden and the potential lack of data/methodological expertise in
smaller communities to produce valid statistical evaluations, a multitude of evaluation
48
findings (some based on limited data or weak study designs) inevitably produces mixed
results and confuses the issue of camera effectiveness.
Policy Recommendation. The effectiveness of RLCs in reducing fatal and serious injury
crashes has been demonstrated numerous times in the research; hence, local governments in
Louisiana need not be required to document the crash effectiveness of individual programs.
Conducting crash effectiveness evaluations using statistically reliable methods is likely to be
beyond many local practitioners’ skill levels. The policy should be modified to eliminate the
annual reporting requirement of changes in crash frequency or severity at RLC deployments.
To more reliably evaluate the effectiveness of RLCs in Louisiana, it would be appropriate for
LTRC or DOTD to conduct a multi-jurisdictional crash analysis based on statistically valid
methodology and robust crash data. As an alternative and for the purposes of transparency,
agencies should include information about outputs of the project as part of public education
activities. This could include information such as citations issued and use of funds.
Evaluation of Policies Recommendations
The following recommendations to the existing state policy are proposed:
1. Modify the photo enforcement policy to require public education programs be conducted
prior to and throughout deployment of a RLC program.
2. Modify the policy to clarify the type of crashes under consideration in the automated
enforcement portion from “vehicle/pedestrian” crashes to “crashes that can be avoided
with an automated enforcement countermeasure.”
3. Modify the photo enforcement policy to required enhanced methods for screening
signalized intersections to identify sites with potential for safety improvement.
4. Modify the photo enforcement policy to require signs indicating electronic traffic
enforcement be installed at the specific installation location and at jurisdictional limits of
the local governments.
5. Modify the Law Revised Statute Title 32 Section 232 (RS 32:232) or the photo
enforcement policy to achieve a consistent definition of a red light violation. Louisiana
law requires vehicles to clear the intersection prior to the signal indication changing to
red. The MUTCD indicates the vehicle shall not enter the intersection during a steady
red indication. Either the policy or the statute should be modified for consistency.
6. The state automated enforcement policy permits motorists to enter the intersection to turn
right on a red light after stopping and, as necessary, yielding to pedestrians and other
motorists without receiving a red light running citation. Drivers that do not stop prior to
turning right on red are in violation of the law and subject to enforcement. Agencies
49
should operate their RLC programs consistent with this policy, and it should be
consistently deployed across the state. Imposing a reduced fine for right-turn-on-red
violations, as compared to traditional red light violations, may increase public support for
enforcing these common violations, and should be incorporated into state policy.
7. To decrease the public opposition and avoid a potential conflict of interest, agencies
should control the site selection process with vendor support limited to data collection
under the direction of the local agency. Agencies avoid a compensation structure based
on the number of paid citations.
8. Eliminate the requirement for local agencies to report effectiveness of RLC deployments.
Finally, the policy recommendations identified to address the public’s positive and negative
opinions of RLC programs were evaluated according to the following qualitative criteria:
Implementation – Who would be responsible for implementing the change and is the
recommendation likely to be relatively easy or relatively difficult to implement?
Consistency with Louisiana practices – How consistent is the recommendation with
existing Louisiana practices? More consistency with existing practices will make it
easier for practitioners and stakeholders to adapt to the recommended change.
Effectiveness – How effective is the recommendation likely to be in changing public
attitudes about RLCs? Is making the recommended change likely to yield a large or
small change in public perception of RLCs?
Benefits to public perception – Would making the recommended change have a
positive or negative impact on public perception? At a qualitative level, what is the
magnitude of the impact to public perception?
Table 10 shows the results of the qualitative evaluation of each of these recommended policy
changes.
50
Table 10 Evaluation of recommended policy changes
Policy Implementation Consistency with Other Practices Effectiveness
Benefits to Public Perception
1. Public education throughout RLC Deployment.
DOTD to change policy. Cities only have to conduct public education prior to installation now. Instead this would be a continuous program and thus would require additional revenues to implement.
Extending public education program is consistent with local practices.
Perhaps the most effective and valuable policy change.
A well developed public education program could have significant positive impacts on public reactions to RLC programs.
2. Type of crashes for site selection should potentially respond to automated enforcement.
DOTD to change policy. Clarifies the type of crashes to evaluate. No major change in type of site analysis or data needs. Not difficult to implement.
Clarifies types of crashes for evaluation. Crash evaluation already required. Consistent with other practices.
Automated enforcement will be more effective in reducing crashes if appropriate crash types are targeted. This clarifies crash types for consideration.
Public perception of effectiveness will be enhanced with appropriate crash types targeted.
3. Modify the photo enforcement policy to require enhanced methods for screening signalized intersections to identify sites with potential for safety improvement.
DOTD to change policy, DOTD may have to provide staff support to identify appropriate network screening method and support data needs.
Enhanced methods would be new to practitioners. Would require training and possibly additional crash summary information from DOTD.
Would improve the likelihood of identifying sites with meaningful potential to respond to automated enforcement.
As sites positively respond to automated enforcement, public perception of value will improve.
4. Photo enforcement signs at installation and jurisdictional boundary.
Cities are required to install signs at sites with RLC. This change would require cities to install additional signs. Marginal additional expense.
Signs are already a requirement so this is consistent with existing practices.
Consistent with expense, this would have an incremental additional effect of providing information to the public about automated enforcement in a community.
Incremental benefit of public having early information that photo enforcement is implemented in the community.
5. Consistency between MUTCD and automated enforcement definition of violation.
May be the most difficult policy recommendation to implement as one option is to revise the Louisiana Statutes.
Would be a new definition of a red light violation so would be a change to the public and would require education.
Having consistent definitions would reduce one argument for opposing RLC programs.
Consistency would have a small benefit to public perception. Each increment will add value.
51
Policy Implementation Consistency with Other Practices Effectiveness
Benefits to Public Perception
6. Ensure consistent implementation of state policy regarding permitting right-turn-on-red after stop without a citation.a Consider a reduced fine for right-turn-on-red violations
No policy change is required.
Consistent with other practice in state.
No impact on effectiveness of a program.
Consistent enforcement may improve public perception of RLC program.
7. The implementing agency should not involve the vendor in the site selection process; avoid a compensation structure based on the number of paid citations.
Limited challenges to implementation for new programs. Would not be possible for agencies to modify existing contracts.
Depending on contracting periods, there may be differences between current contract practices and new practices. Cities with existing contracts could renegotiate address issue.
Would be beneficial to public opinion about revenue neutrality.
Would be beneficial to public opinion about revenue neutrality.
Would require practitioner and public education to accept effectiveness research from other locations and not spend additional funding to research effectiveness.
Would reduce unnecessary public spending on data collection and studies.
Without appropriate public and practitioner education, the public may react negatively if local effectiveness evaluations are not conducted.
*Providing the motorist appropriately enters the intersection after stopping to confirm no
pedestrians or vehicle conflicts.
Comparison of Traditional Enforcement to Red Light Cameras
A high-level comparative analysis was conducted to compare the costs and benefits of
automated red light enforcement versus traditional traffic enforcement. Law enforcement
colleagues and partners both inside Louisiana and in other states were contacted to gather
information used in the comparative analysis to determine the approximate costs associated
with traditional RLR enforcement. The literature review, community interviews, technology
vendors, and sources in other states were used to identify and compare cost elements of
automated enforcement.
A key objective of this comparative analysis was to match, as closely as possible, the costs
and benefits of 24-hours-a-day, 7-days-a-week (24/7) coverage of automated red light
enforcement with traditional police traffic enforcement. It is unlikely municipal agencies in
Louisiana are able to assign police officers to enforce RLR at specific intersections on a 24/7
52
basis, but the comparative analysis made this assumption to match the costs and benefits of
24/7 coverage provided by RLCs.
Table 11 provides a summary of costs, benefits, and potential negative effects associated
with traditional police traffic enforcement and RLCs. RLCs could also be compared to other
engineering improvements such as roundabouts or grade changes; however, the analysis was
beyond the scope of this project. The costs associated with traditional enforcement
considered officer salary, use of a patrol car, additional time required to attend traffic court,
and a fraction of a supervisor’s salary. Training costs incurred when a new officer is hired
were excluded. RLC costs considered include the costs to lease, install, maintain, and service
camera equipment, as well the costs associated with installation and maintenance of warning
signs and police officer oversight.
In terms of benefits, monetary values were not estimated; it was assumed the same reductions
in angle crashes reported for RLCs would apply to traditional enforcement. Some additional
benefits were assumed for traditional enforcement (i.e., other violations detected such as
DUI, unlicensed drivers, and crime deterrence). If legally authorized, RLC technology can
also be used to enforce speeding laws. Data were not available; therefore, the comparative
analysis did not account for the respective numbers of RLR citations (and associated fine
revenue) issued by RLCs versus traditional traffic enforcement.
As for potential negative effects, an increase in rear-end crashes (as reported in some studies)
was assumed for both automated red light enforcement and traditional traffic enforcement.
Some additional potential negative effects were assumed (see Table 2). Additional
assumptions and references used in the analysis are provided in Appendix D.
Table 11 Comparison of traditional enforcement versus RLCs
Traditional Enforcement Red Light Cameras Cost
Officer salary - Two (24/7)
$240,000
Patrol car - Two $284,700Court time $16,000Fraction of Sgt. Salary $15,000Total $555,700
Vendor payments $42,000Installation (amortized over 10 years)
$4,400
Maintenance $15,000Install warning signs (amortized over 10 years)
‐ Increase in rear-end crashes ‐ Public controversy
This basic comparative analysis suggests automated red light enforcement is more cost
effective than traditional enforcement, primarily because of its ability to function 24/7
without the need to be accompanied by either police officers or patrol vehicles. The added
value of using police officers is the ability to detect violations other than RLR and to
apprehend criminals. Public controversy associated with automated enforcement is a
potential negative effect that must be considered when comparing red light cameras with
traditional enforcement. Including comparative costs analyses in the ongoing public
education campaign could help enhance public perception of automated enforcement.
55
CONCLUSIONS
RLC programs have been used in over 500 cities (IIHS) in the U.S. to augment efforts by law
enforcement to curb intersection crashes in general and red light running crashes in
particular. RLC program implementation has reduced angle crashes and injury crashes in a
majority of the cities; however, rear–end crashes increased in many jurisdictions. A majority
of the studies also show a decline in the number of RLR violations at intersections following
RLC program implementation.
Jurisdictions with RLC programs in operation generally have higher support among residents
than jurisdictions without RLC programs. Approximately two-thirds of the drivers perceive
an increased likelihood of receiving a ticket if they commit a RLR violation at an intersection
with automated enforcement. Critics view RLC programs as a means to generate revenue
rather than improve safety.
Comprehensive crash data analysis is recommended by federal and state guidance documents
for investigating intersections with an unusually high number of RLR violations and crashes.
Violation data may not be the only basis of analysis, as violations may not necessarily
directly translate to a RLR crash problem. Vehicle characteristics, intersection design and
operations, and driver behavior are central to RLR phenomenon. Engineering and education
countermeasures should be the first line of action adopted by traffic engineers to mitigate
RLR violations and crashes. Intersections that continue to exhibit abnormal levels of RLR
violations even after engineering and educational countermeasures have been in operation are
typical candidates for RLCs.
The Red Light Safety Program in Baton Rouge and the SafeLight Program in Lafayette were
implemented in response to high crash frequency. They underwent similar implementation
methods using a network approach. Deployment is similar with permanent, fixed cameras at
intersections taking multiple digital images and outreach primarily through press releases to
the media. The vendors in Baton Rouge and Lafayette are contracted to manage installation,
maintenance, and citations. They are compensated when fines are paid.
Lafayette Consolidated Government maintains a record of crash data available for public
review online, and the SafeLight citation information per intersection is updated regularly.
Baton Rouge DPW has had difficulty collecting data both before and after implementation
due to insufficient access to and inaccuracies in crash reports. Traffic engineers typically use
crash data three years before and after active implementation to make scientific comparisons.
Baton Rouge’s program has not been operating long enough to undergo traffic study
comparisons until this year, and data for the 2010 calendar year is not yet available from
DOTD. Therefore safety effectiveness evaluations have not yet been conducted.
56
The public opinion survey conducted in this project showed an even split between
respondents who perceive RLR to be a problem and those who do not. Similarly,
respondents were evenly split between being in favor of and opposed to RLC programs.
Opposition was slightly higher in the regions with RLC programs compared to regions
without. Whether or not an individual feels RLR is a problem may influence whether they
support or oppose a RLC program. For example, those who believe RLR is a problem are
more likely to support a RLC program than those who do not believe RLR is a problem.
Among those who favor RLC programs, the leading reasons to support the program (in order
of response) are it encourages drivers to obey traffic laws, reduces crashes, and reduces RLR.
Conversely, the leading reasons respondents oppose RLC programs is because respondents
believe it is just a program to increase revenue and RLCs go against our system of justice. A
smaller proportion feels RLCs are ineffective. Respondents also provided several other
reasons to oppose RLC programs, such as RLCs increase rear-end crashes, removes officer
discretion, disagree with a private company having a financial interest in the system, violates
privacy, discriminates against certain sociodemographic groups, and imposes responsibility
on vehicle owner, even if they were not driving the vehicle.
While almost half of the respondents are opposed to RLC programs, they did identify strate-
gies that could be used in their community to help change their mind. The most popular
strategy was to provide more information about how the revenue from the RLCs is actually
used. Other strategies that might change their mind include using the revenue to improve
safety in the community, providing better warning about when and where RLC programs are
going to be implemented, and educating the public on the effectiveness of RLCs.
57
RECOMMENDATIONS
The project recommendations are:
1. Modify the photo enforcement policy to require public education programs be conducted
prior to and throughout deployment of a RLC program.
2. Modify the policy to clarify the type of crashes under consideration in the automated
enforcement portion from “vehicle/pedestrian” crashes to “crashes that can be avoided
with an automated enforcement countermeasure.”
3. Modify the photo enforcement policy to require enhanced methods for screening
signalized intersections to identify sites with potential for safety improvement.
4. Modify the photo enforcement policy to require signs indicating electronic traffic
enforcement be installed at the specific installation location and at jurisdictional limits of
the local governments.
5. Modify the Law Revised Statute Title 32 Section 232 (RS 32:232) or the photo
enforcement policy to achieve a consistent definition of a red light violation. Louisiana
law requires vehicles to clear the intersection prior to the signal indication changing to
red. The MUTCD indicates the vehicle shall not enter the intersection during a steady
red indication. The State automated enforcement policy allows for a citation to be issued
if the motorist is beyond the stop bar at the beginning of a red indication, which is
permissible according to MUTCD procedures. It is recommended the state further
evaluate these issues and consider revising RS 32:232 to provide consistency with the
MUTCD.
6. Develop and maintain a consistent approach applying the state automated enforcement
policy related to right turns on red. Existing policy permits motorists to enter the
intersection to turn right on a red light after stopping and, as necessary, yielding to
pedestrians and other motorists without receiving a red light running citation. Drivers that
do not stop prior to turning right on red are in violation of the law and subject to
enforcement. Imposing a reduced fine for right-turn-on-red violations may increase
public support for enforcing these common violations, and should be incorporated into
state policy.
7. Control the site selection process with vendor support limited to data collection or other
activities at the discretion of the agency to decrease the public opposition and avoid a
potential conflict of interest. Agencies should avoid a vendor compensation structure
based on the number of paid citations.
8. Eliminate the requirement for agencies to report effectiveness of RLC deployments.
59
ACRONYMS, ABBREVIATIONS, AND SYMBOLS
AASHTO American Association of State Highway and Transportation Officials
ATS American Traffic Solutions
DOTD Department of Transportation and Development
DPW Department of Public Works
DTT Department of Traffic and Transportation
DUI Driving Under the Influence
FHWA Federal Highway Administration
HSM Highway Safety Manual
IIHS Insurance Institute of Highway Safety
ITE The Institute of Transportation Engineers
LCG Lafayette Consolidated Government
LTRC Louisiana Transportation Research Center
MUTCD Manual of Uniform Traffic Control Device
NCHRP National Cooperative Highway Research Program
NHTSA National Highway Traffic Safety Administration
OMV Office of Motor Vehicles
RIP Research In Progress
RLC Red Light Camera
RLR Red Light Running
RS Revised Statute
61
REFERENCES
1. Bochner, B. and Walden, T. (2010). Effectiveness of Red Light Cameras, Texas Transportation Institute, http://tti.tamu.edu/group/stsc/files/2011/03/Red light-camera-effectiveness-070610-w-Garland-correction.pdf - Accessed July 2011.
2. Burkey, M. and Obeng, K. (2004). A Detailed Investigation of Crash Reduction Resulting from Red Light Cameras in Small Urban Areas, U.S. Department of Transportation, Research and Special Programs Administration, Washington, DC.
3. Council, F., Persaud, B., Eccles, K., Lyon, C., and Griffith, M. (2005). Safety Evaluation of Red Light Cameras: Executive Summary, Federal Highway Administration, Report No. FHWA HRT-05-049.
4. Cunningham, C. M. and Hummer, J. S. (2004). Evaluating the Use of Red Light Running Photographic Enforcement Using Collisions and Red Light Running Violations, North Carolina Governor’s Highway Safety Program, Raleigh, NC.
5. Federal Highway Administration and National Highway Traffic Safety Administration (2003). Guidance for Using Red Light Cameras, http://www.nhtsa.gov/people/injury/enforce/guidance03/guidancereport.pdf - Accessed August 2011.
6. Frangos, G. E. (undated). Automated Enforcement: 10-Year Evaluation of Red Light Running Detection, Howard County, Maryland, Howard County Traffic Division, Columbia, Maryland.
7. Garber, N. J., Miller, J. S., Eslambolchi, S., Khandelwal, R., Mattingly, K. M., Sprinkle, K. M., and Wachendorf, P. L. (2005). An Evaluation of Red Light Camera (Photo-Red) Enforcement Programs In Virginia: A Report in Response to a Request by Virginia’s Secretary of Transportation, Virginia Transportation Research Council, Report No. VTRC 05-R21, Charlottesville, VA.
8. Hu, W., McCartt, A. T., and Teoh, E. (2011). Effects of Red Light Camera Enforcement on Fatal Crashes in Large US Cities, Insurance Institute of Highway Safety, http://www.iihs.org/research/topics/pdf/r1151.pdf - Accessed July 2011.
9. Insurance Institute of Highway Safety (2011). Status Report, Special Issue: Red Light Running, Vol. 46, No. 1, http://www.iihs.org/externaldata/srdata/docs/sr4601.pdf - Accessed July 2011.
10. Insurance Institute of Highway Safety, Questions and Answers: Red Light Cameras, http://www.iihs.org/research/qanda/rlr.aspx, Accessed March 2013
11. Kyrychenko, S. Y. and Retting, R. (2004). Review of A Detailed Investigation of Crash Reduction Resulting from Red Light Cameras in Small Urban Areas, Insurance Institute of Highway Safety, Arlington, VA.
12. Langland-Orban, B., Pracht, E. E., and Large, J. T. (2008). Red Light Running Cameras: Would Crashes, Injuries, and Automobile Insurance Rates Increase If They Are Used In Florida?, Florida Public Health Review, Vol. 5, pp. 1-7.
62
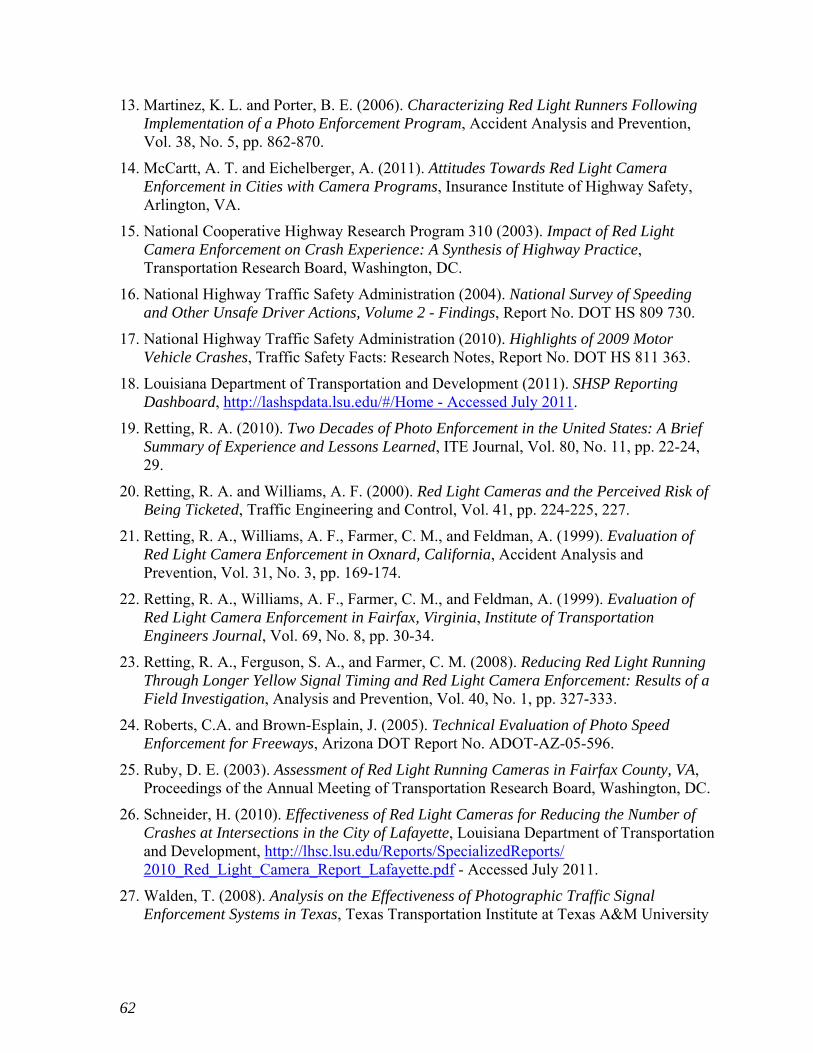
13. Martinez, K. L. and Porter, B. E. (2006). Characterizing Red Light Runners Following Implementation of a Photo Enforcement Program, Accident Analysis and Prevention, Vol. 38, No. 5, pp. 862-870.
14. McCartt, A. T. and Eichelberger, A. (2011). Attitudes Towards Red Light Camera Enforcement in Cities with Camera Programs, Insurance Institute of Highway Safety, Arlington, VA.
15. National Cooperative Highway Research Program 310 (2003). Impact of Red Light Camera Enforcement on Crash Experience: A Synthesis of Highway Practice, Transportation Research Board, Washington, DC.
16. National Highway Traffic Safety Administration (2004). National Survey of Speeding and Other Unsafe Driver Actions, Volume 2 - Findings, Report No. DOT HS 809 730.
17. National Highway Traffic Safety Administration (2010). Highlights of 2009 Motor Vehicle Crashes, Traffic Safety Facts: Research Notes, Report No. DOT HS 811 363.
18. Louisiana Department of Transportation and Development (2011). SHSP Reporting Dashboard, http://lashspdata.lsu.edu/#/Home - Accessed July 2011.
19. Retting, R. A. (2010). Two Decades of Photo Enforcement in the United States: A Brief Summary of Experience and Lessons Learned, ITE Journal, Vol. 80, No. 11, pp. 22-24, 29.
20. Retting, R. A. and Williams, A. F. (2000). Red Light Cameras and the Perceived Risk of Being Ticketed, Traffic Engineering and Control, Vol. 41, pp. 224-225, 227.
21. Retting, R. A., Williams, A. F., Farmer, C. M., and Feldman, A. (1999). Evaluation of Red Light Camera Enforcement in Oxnard, California, Accident Analysis and Prevention, Vol. 31, No. 3, pp. 169-174.
22. Retting, R. A., Williams, A. F., Farmer, C. M., and Feldman, A. (1999). Evaluation of Red Light Camera Enforcement in Fairfax, Virginia, Institute of Transportation Engineers Journal, Vol. 69, No. 8, pp. 30-34.
23. Retting, R. A., Ferguson, S. A., and Farmer, C. M. (2008). Reducing Red Light Running Through Longer Yellow Signal Timing and Red Light Camera Enforcement: Results of a Field Investigation, Analysis and Prevention, Vol. 40, No. 1, pp. 327-333.
24. Roberts, C.A. and Brown-Esplain, J. (2005). Technical Evaluation of Photo Speed Enforcement for Freeways, Arizona DOT Report No. ADOT-AZ-05-596.
25. Ruby, D. E. (2003). Assessment of Red Light Running Cameras in Fairfax County, VA, Proceedings of the Annual Meeting of Transportation Research Board, Washington, DC.
26. Schneider, H. (2010). Effectiveness of Red Light Cameras for Reducing the Number of Crashes at Intersections in the City of Lafayette, Louisiana Department of Transportation and Development, http://lhsc.lsu.edu/Reports/SpecializedReports/2010_Red_Light_Camera_Report_Lafayette.pdf - Accessed July 2011.
27. Walden, T. (2008). Analysis on the Effectiveness of Photographic Traffic Signal Enforcement Systems in Texas, Texas Transportation Institute at Texas A&M University
63
28. Washington, S. and Shin, K. (2005). Impact of Red Light Cameras (Automated Enforcement) on Safety in Arizona, Arizona Department of Transportation, Report No. FHWA-AZ-05-550.
65
APPENDIX A
Tier 1 Survey
67
APPENDIX B
Tier 2 Survey
Hello, my name is ________________. In late December or early January, you responded to a survey about red light cameras and indicated willingness to participate in a follow-up telephone interview. We do not record anyone’s name and we do not share any of your personal information or telephone number with anyone outside the Transportation Research Center. Do you have about five minutes to participate in this eight question survey now?
IF THE RESPONDENT SAYS YES: Great… thanks ! QUESTION 1.
IF THE RESPONDENT SAYS NO: Okay, thanks for your time and interest in the initiative.
Please answer yes, no, or I don’t know to the following questions.
1. Do you believe red light cameras are effective in improving traffic safety at intersections? a) Yes. b) No. c) Don’t know.
2. Have you received a ticket for running a red light during the past two years? a) Yes. (If yes, ask: Was this a police-issued ticket or a red light camera ticket? Yes,
no, don’t know) b) No. c) Don’t know.
3. Has someone you know received a ticket for running a red light during the past two years? a) Yes. (If yes, ask: Was this a police-issued ticket or a red light camera ticket? Yes,
no, don’t know) b) No. c) Don’t know.
4. In your opinion, how likely is it for someone to get caught if they run a red light? a) Not likely. b) Likely. c) Very likely. d) Don’t know.
5. I’m going to read a few statements to you, please select the statement that best reflects your views: NOTE TO SURVEYOR – ASK ITEMS “a” THROUGH “e” IN RANDOM ORDER.
a) Red light cameras are just a way for the police department to make money.
68
ASK THIS QUESTION ONLY IF THE RESPONDENT SELECTED OPTION 5A – What types of information about the REVENUE from red light camera programs would influence your opinion?
Pause and wait to see if respondent provides answers. If the respondent provides an answer, record it.
If the respondent does not provide an answer, make suggest:
a) Information about ticket revenue and spending, b) Information about costs of crashes and emergency response, c) Costs of intersection safety improvements, d) Fees paid to red light camera vendors, e) Something else?
b) Red light cameras go against our system of justice because no law enforcement
officer actually witnessed the driver committing the offense. ASK THIS QUESTION ONLY IF THE RESPONDENT SELECTED OPTION 5b
What would you do to ensure that justice could be served with red light cameras?
Pause and wait to see if respondent provides answers. If the respondent
provides an answer, record it.
If the respondent does not provide an answer, suggest possibilities such as: a) The use of video to backup the red light camera photos. b) Assurance that a sworn law enforcement officer viewed the red light
camera photos and issued a ticket. c) Limiting the penalty for red light camera tickets to a fine, with no
points or other effects on insurance. d) Something else?
c) Red light cameras are an effective way to give tickets to drivers for running red lights. d) Red light cameras make it easier for law enforcement to do their jobs. e) None of these reflect my views.
6. Select the statement that best reflects your views; the majority of drivers: a) Believe a yellow light is just a suggestion. b) Believe you can enter an intersection on a yellow light. c) Slow down immediately on a yellow light and prepare to stop. d) Don’t know
69
7. Please answer yes, no, or I don’t know to the following question. Do you believe warning signs and media attention about red light cameras stop people from running red lights? a) Yes. b) No. c) Don’t know.
8. For this last question, where would you like to see red light camera revenues used in your community?
Pause and wait to see if respondent provides answers. If the respondent provides an
answer, record it.
If the respondent does not provide an answer, make suggest: a) Safety projects in schools/colleges. b) Safety projects near parks/recreational areas. c) Road maintenance projects. d) Intersection improvements. e) New roads. f) Others.
That was the last question, thank you. We will be integrating your ideas from this survey into our research and policy guidelines for automated enforcement in Louisiana. I appreciate your time, have a nice day.
71
APPENDIX C
Current State Automated Enforcement Policy
73
APPENDIX D
Data Assumptions and References used in Comparison of
Traditional Enforcement versus Red Light Cameras
Vendor payments for deployment of camera technology: Based on the following payment structure reported in Lafayette, LA and an estimate of 88 paid citations per month per intersection (based on average data across all monitored intersections in Lafayette):
The number of paid citations from 1 to 150 per month at each intersection will be paid at $39 each
The number of paid citations from 151 to 300 per month at each intersection will be paid at $39 each
The number of paid citations exceeding 300 per month at each intersection will be paid at $39 each
In 2010 an estimated 1,051 red light camera citations were paid in Lafayette across 12 monitored intersections. Officer salary & fringe: When nonsworn personnel are excluded, local police departments cost $116,500 per officer to operate for 2007. Source: U.S. Department of Justice, Office of Justice Programs, Bureau of Justice Statistics. 2010. Local Police Departments, 2007. http://bjs.ojp.usdoj.gov/content/pub/pdf/lpd07.pdf Assuming $120,000 per year based on inflation since 2007, and 2,000 working hours per year, an hourly cost of $60 is estimated. Patrol car: $16.25/hr based on FEMA rate schedule http://www.fema.gov/government/grant/pa/eqrates.shtm Court time: assumes 4 days per month for a police officer assigned full‐time to traffic enforcement Fraction of Sgt. Salary: assumes a ratio of 1 Sergeant to 8 police officers Red light camera costs: based on interviews with red light camera vendors Officer oversight for red light cameras: assumes ¼ of officer salary; this cost is assumed to be the same for a single intersection or multiple intersections monitored by red light cameras