20
NRPA Americans’ Engagement with Parks Survey
| Date post: | 15-Apr-2018 |
| Category: |
Documents |
| Upload: | nguyendung |
| View: | 217 times |
| Download: | 2 times |
National Recreation and Park Association | I
NRPA Americans’ Engagement with Parks Survey


National Recreation and Park Association | 1
INTRODUCTIONThe vast offerings of the local park and recreation agency improve the lives of people throughout our nation. For some people, there is not a better way to improve one’s physical and mental health or reconnect to nature than a brisk walk through the park. For others, the local park and recreation agency’s summer camp and afterschool care offerings allow them to hold a job to ensure a brighter future for them and their family. Whatever the motivations, Americans are heavily engaged with the local parks and recreation agency that transforms their town or city into a vibrant, connected community.
In early 2016, the National Recreation and Park Association released the results of a Penn State University study it commis-sioned that found Americans cherish their local public park and recreation services. The report titled Americans’ Broad-Based Support for Local Recreation and Park Services found that Americans almost unanimously agree that their communities benefit from their local public parks, even if they themselves are not regular park users. Even more remarkable was that the results from this survey virtually matched those from a similar NRPA/Penn State study from 25 years earlier.
The overriding takeaway from the study is that the general public is an untapped advocate to spread the public park and recre-ation story. To build upon this momentum, NRPA Research has developed several new research initiatives to tap this passion to further spread the word that park and recreation agencies offer essential quality-of-life services to communities.
One of these initiatives is NRPA Park Pulse, a monthly poll of Americans on park and recreation related issues. Some of the poll questions are serious (e.g., impact of Zika on summertime activities, prohibiting tobacco products from public parks) while others are more fun (e.g., being inspired by the Olympics to be more physically active). But in all cases, Park Pulse represents a fresh opportunity to demonstrate the many ways park and recreation agencies better our communities to policymakers, key stakeholders, the media, and the general public.
The second research initiative is a broad, annual survey of Americans about how they interact with their local park and rec-reation agency and their willingness to financially support these valuable resources. With the data collected each summer and the results published in the fall, the NRPA Americans’ Engagement with Parks Survey probes Americans’ usage of parks, the key reasons that drive their use and the greatest challenges preventing greater usage. Each year, the study will weigh the importance of public parks in Americans’ lives, including how parks compare to other services and offerings of local govern-ments, while demonstrating how parks turn our local towns and cities into vibrant, dynamic communities and that parks and recreation is a solution to many of the challenges facing our communities.
The key findings of the inaugural edition of the NRPA Americans’ Engagement with Parks Survey include:
• Americans on average visit their local park and recreation facilities approximately 29 times a year. Three in five survey respondents report having visited a local park and/or recreation facility within a month of participating in the survey, in-cluding two in five having done so within the previous seven days. Millennials and parents are more frequent park users.
• The reasons Americans visit their local park and recreation facilities are as diverse as they are: a place to be with family and friends, to be more physically active, to be closer to nature, to access quality, affordable child care, and to learn a new skill or craft.
• What keeps people from greater enjoyment of their local park and recreation facilities is a lack of time, concerns about safety at both the park and walking to/from the park, a lack of awareness of park locations/offerings and not finding programming that matches their interests.
• Nine in 10 Americans agree that parks and recreation are important services delivered by their local government.
• Three in four Americans agree that the NRPA Three Pillars of Conservation, Health and Wellness, and Social Equity represent what they see as the priorities for their local park and recreation agency.
• Seven in 10 Americans say they are more likely to vote for local politicians who make park and recreation funding a priority.
• Three-quarters of Americans support increased local government spending for park and recreation agencies — spanning nearly every demographic group and both sides of the political spectrum — with solid support for a nearly 30 percent local government funding increase for parks and recreation.

2 | NRPA Americans’ Engagement with Parks Survey
90% of Americans agree that parks and recreation are
important local government services (comparable to police/fire, schools, transportation)
3 in 4 Americans agree that Conservation, Health and Wellness, and Social Equity represent
what they see as the priorities for their local park and recreation agency
70% of Americans
say they are more likely to vote for local politicians
who make park and recreation funding a priority
29 times a year
75% of Americans support increased local government
spending for park and recreation agencies
Number of times Americans visit their local park and recreation facilities on average

National Recreation and Park Association | 3
KEY FINDINGSWhen Do Americans Visit Their Local Parks and Recreation Facilities?
NRPA’s vision is that “everyone will have easy access to park and recreation opportunities in sustainable communities.” Easy access includes having a park, open space, recreation center or some other recreation facility nearby that they can travel to and from safely. When there are high-quality amenities and programming that match the residents’ needs and desire, Ameri-cans flock to their park and recreation facilities.
Seven in 10 survey respondents indicate that there is a local park, open space or recreation center within walking distance from their home. Interestingly, in three of four Census regions — the Northeast, Midwest, and West — the percentage of Amer-icans reporting having a local park they could walk to rises to 75 percent. Conversely, only three in five survey respondents living in the South indicate that there is a park within walkable distance of their homes.
While there were no significant differences in park availability reported in terms of the sur-vey respondents’ race or ethnicity, Millennials and Gen Xers are significantly more likely to report having a park and/or recreation facility that is within walkable distance than do Baby Boomers. The lower percentages reported by older Americans may reflect both a decline in mobility associated with age and lowered awareness of park and recreation opportuni-ties located near them.
Parks and recreation is deeply engrained in the lifestyles of people throughout the Unit-ed States. Some people visit their local parks once or twice a year, while others do so once or twice this week.
On average, Americans visit their local park and recreation facilities just under 29 times per year. A third of survey respon-dents who indicate they visited a local park and/or recreation facility within the past 12 months report having visited said facilities between one and five times. Twenty-one percent of survey respondents report between six and 10 annual visits, with another 18 percent indicating between 11 and 20 visits within the past 12 months. Sixteen percent visited their local park and recreation facilities between 21 and 50 times over the past year while 12 percent indicate having done so at least 51 times over the past 12 months.
Who are more likely to be power users of local park and recreation facilities? Reporting more frequent visits to local park and recreation fa-cilities are Millennials, those that identify them-selves as Hispanic and parents. On the other end of the spectrum, Baby Boomers make far less frequent visits to their local parks.
7 in 10 Americans Can Walk to a Local Park, Open Space or Recreation Center
Multiple parks/facilities
(Percentage Distribution of Respondents)
within walking distance
A single park or recreationfacility nearby
No park/recreation facilty
29% 34%
36%
(Percentage Distribution of Respondents Who Have Visited Park/Recreation Facility in Past Year)
Frequency of Visits to Local Parks or Recreation Facility
1-5 times
6-10 times
11-20 times
21-50 times
51+ times
16%
12%
33%
21%18%
4 | NRPA Americans’ Engagement with Parks Survey
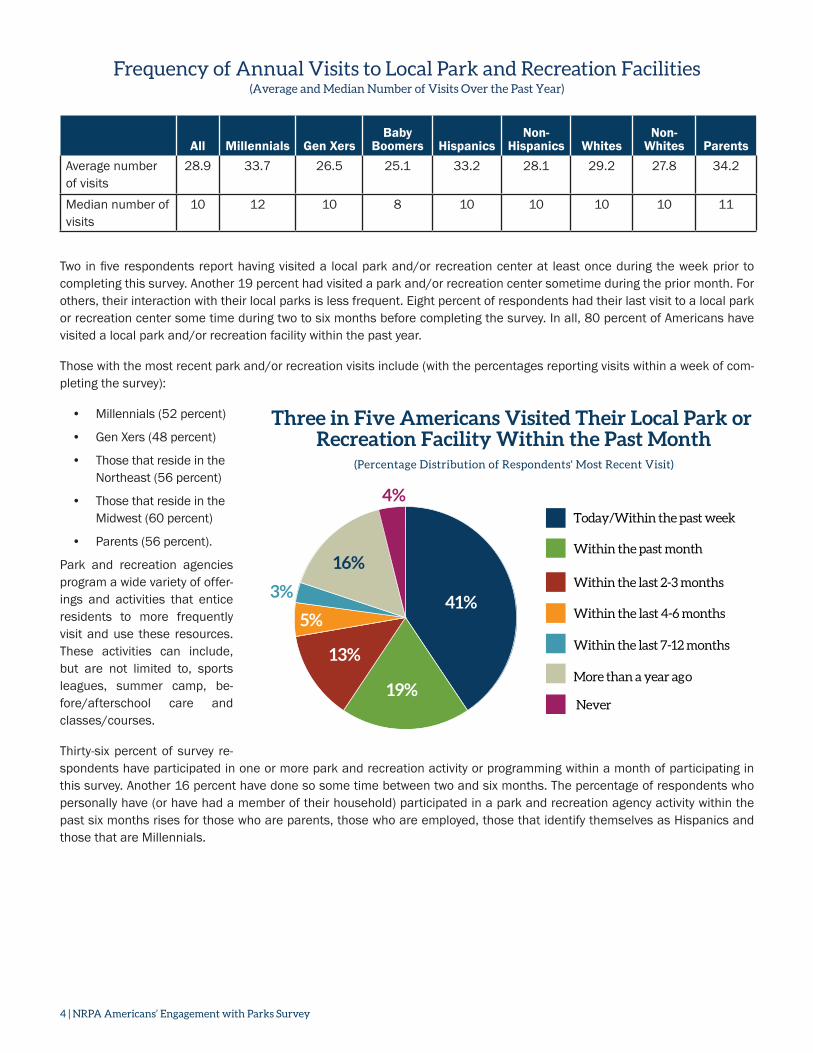
Two in five respondents report having visited a local park and/or recreation center at least once during the week prior to completing this survey. Another 19 percent had visited a park and/or recreation center sometime during the prior month. For others, their interaction with their local parks is less frequent. Eight percent of respondents had their last visit to a local park or recreation center some time during two to six months before completing the survey. In all, 80 percent of Americans have visited a local park and/or recreation facility within the past year.
Those with the most recent park and/or recreation visits include (with the percentages reporting visits within a week of com-pleting the survey):
• Millennials (52 percent)
• Gen Xers (48 percent)
• Those that reside in the Northeast (56 percent)
• Those that reside in the Midwest (60 percent)
• Parents (56 percent).
Park and recreation agencies program a wide variety of offer-ings and activities that entice residents to more frequently visit and use these resources. These activities can include, but are not limited to, sports leagues, summer camp, be-fore/afterschool care and classes/courses.
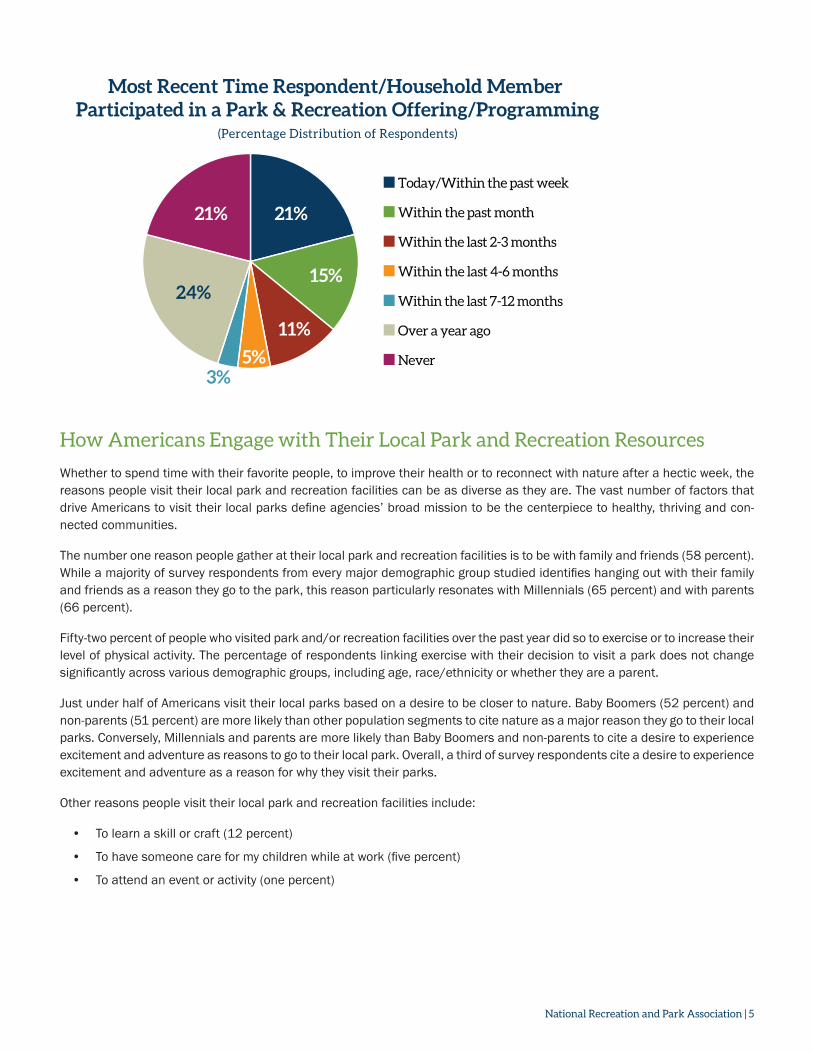
Thirty-six percent of survey re-spondents have participated in one or more park and recreation activity or programming within a month of participating in this survey. Another 16 percent have done so some time between two and six months. The percentage of respondents who personally have (or have had a member of their household) participated in a park and recreation agency activity within the past six months rises for those who are parents, those who are employed, those that identify themselves as Hispanics and those that are Millennials.
Three in Five Americans Visited Their Local Park or Recreation Facility Within the Past Month
(Percentage Distribution of Respondents' Most Recent Visit)
Today/Within the past week
Within the past month
Within the last 2-3 months
Within the last 4-6 months
Within the last 7-12 months
More than a year ago
Never
41%
19%
13%
5%
16%
3%
4%
Frequency of Annual Visits to Local Park and Recreation Facilities (Average and Median Number of Visits Over the Past Year)
All Millennials Gen XersBaby
Boomers HispanicsNon-
Hispanics WhitesNon-
Whites ParentsAverage number of visits
28.9 33.7 26.5 25.1 33.2 28.1 29.2 27.8 34.2
Median number of visits
10 12 10 8 10 10 10 10 11
National Recreation and Park Association | 5
Most Recent Time Respondent/Household Member Participated in a Park & Recreation Offering/Programming
(Percentage Distribution of Respondents)
Today/Within the past week
Within the past month
Within the last 2-3 months
Within the last 4-6 months
Within the last 7-12 months
Over a year ago
Never
21%21%
24%
3%5%
11%
15%
How Americans Engage with Their Local Park and Recreation Resources
Whether to spend time with their favorite people, to improve their health or to reconnect with nature after a hectic week, the reasons people visit their local park and recreation facilities can be as diverse as they are. The vast number of factors that drive Americans to visit their local parks define agencies’ broad mission to be the centerpiece to healthy, thriving and con-nected communities.
The number one reason people gather at their local park and recreation facilities is to be with family and friends (58 percent). While a majority of survey respondents from every major demographic group studied identifies hanging out with their family and friends as a reason they go to the park, this reason particularly resonates with Millennials (65 percent) and with parents (66 percent).
Fifty-two percent of people who visited park and/or recreation facilities over the past year did so to exercise or to increase their level of physical activity. The percentage of respondents linking exercise with their decision to visit a park does not change significantly across various demographic groups, including age, race/ethnicity or whether they are a parent.
Just under half of Americans visit their local parks based on a desire to be closer to nature. Baby Boomers (52 percent) and non-parents (51 percent) are more likely than other population segments to cite nature as a major reason they go to their local parks. Conversely, Millennials and parents are more likely than Baby Boomers and non-parents to cite a desire to experience excitement and adventure as reasons to go to their local park. Overall, a third of survey respondents cite a desire to experience excitement and adventure as a reason for why they visit their parks.
Other reasons people visit their local park and recreation facilities include:
• To learn a skill or craft (12 percent)
• To have someone care for my children while at work (five percent)
• To attend an event or activity (one percent)

6 | NRPA Americans’ Engagement with Parks Survey
The fact that people visit their local park and recreation facilities for an array of reasons, and that these factors differ signifi-cantly by demographic segments, highlights the importance of park and recreation professionals doing all they can to fully understand the constituents they serve. For example, the interests, desires and needs of Millennials do not match those of Baby Boomers. Delivering a one-size-fits-all offering to their community guarantees low satisfaction and underutilization of the agencies’ facilities and programming.
One resource that can assist agencies with understanding their constituents is the NRPA Facility Market Reports. These customized reports provide detailed demographic and market research data on the residents living near park and recreation facilities. In addition, surveys, community meetings and interactive engagement tools provide valuable feedback that helps identify the optimal mix of service offerings to deliver to the community.
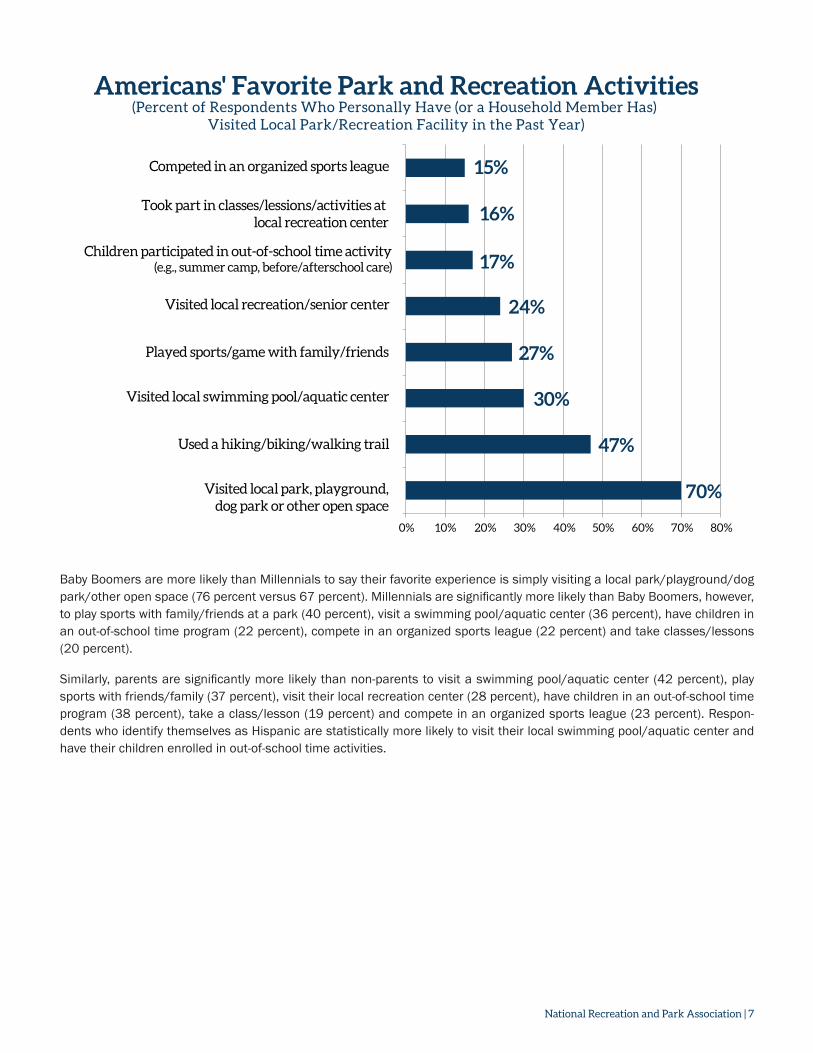
The reasons people visit their local park and recreation facilities track closely with what they identify as their favorite activities. Seven in 10 Americans who indicated visiting some sort of park or recreation facility over the past year did so at a local park, playground, dog park or some other local open space. Just under half of survey respondents walked, jogged, biked and/or hiked on a local trail (47 percent), while 30 percent visited a local swimming pool/aquatic center.
Other activities that Americans partake in at local park and recreation facilities include:
• Playing sports with family and friends (27 percent)
• Visiting the local recreation/senior center (24 percent)
• Having children participate in out-of-school time programs (e.g., summer camp, before/afterschool care) (17 percent)
• Taking part in classes/lessons at local recreation center (16 percent)
• Participating in local sports leagues (15 percent)
0% 10% 20% 30% 40% 50% 60% 70%
To be with family or friends
To exercise/be physically active
To be closer to nature
To experience excitement/adventure
To a learn a skill/craft
To have someone care for my children
Key Reasons for Visiting Park and Recreation Facilities(Percent of Respondents Who Personally Have (or a Household
Member Has) Visited Local Park/Recreation Facility in the Past Year)
5%
12%
33%
48%
52%
58%
National Recreation and Park Association | 7
Baby Boomers are more likely than Millennials to say their favorite experience is simply visiting a local park/playground/dog park/other open space (76 percent versus 67 percent). Millennials are significantly more likely than Baby Boomers, however, to play sports with family/friends at a park (40 percent), visit a swimming pool/aquatic center (36 percent), have children in an out-of-school time program (22 percent), compete in an organized sports league (22 percent) and take classes/lessons (20 percent).
Similarly, parents are significantly more likely than non-parents to visit a swimming pool/aquatic center (42 percent), play sports with friends/family (37 percent), visit their local recreation center (28 percent), have children in an out-of-school time program (38 percent), take a class/lesson (19 percent) and compete in an organized sports league (23 percent). Respon-dents who identify themselves as Hispanic are statistically more likely to visit their local swimming pool/aquatic center and have their children enrolled in out-of-school time activities.
Americans' Favorite Park and Recreation Activities(Percent of Respondents Who Personally Have (or a Household Member Has)
Visited Local Park/Recreation Facility in the Past Year)
0% 10% 20% 30% 40% 50% 60% 70% 80%
Visited local park, playground,dog park or other open space
Used a hiking/biking/walking trail
Visited local swimming pool/aquatic center
Played sports/game with family/friends
Visited local recreation/senior center
Children participated in out-of-school time activity(e.g., summer camp, before/afterschool care)
Took part in classes/lessions/activities at local recreation center
Competed in an organized sports league 15%
16%
17%
24%
27%
30%
47%
70%

8 | NRPA Americans’ Engagement with Parks Survey
Challenges to Greater Engagement with Parks and Recreation
As much as Americans use their local park and recreation facilities, three-quarters of survey respondents identify barriers that are keeping them or other members of their household from enjoying these community resources even more. These barriers represent challenges (and perhaps opportunities) for park and recreation professionals to identify solutions to further improve the accessibility of their offerings to the public.
The biggest barrier keeping Americans from greater enjoyment of their local park and recreation facilities is a lack of time (39 percent). This issue is particularly acute for both Millennials and Gen Xers (both at 45 percent) and for those currently employed (47 percent).
The second biggest concern noted is a lack of quality facilities near one’s home (20 percent), with higher percentages of Mil-lennials (28 percent) and those that identify as non-white (26 percent) more likely to indicate this.
Other top barriers that prevent people from greater enjoyment of their local park and recreation facilities include:
• Concern about personal safety at the park or recreation facility (17 percent)
• Unaware of the park location or offerings (16 percent, including 23 percent of Millennials)
• Offerings of local parks/recreation facilities not matching area of interest (14 percent, although the percentages are high-er for Millennials (18 percent) and those that identify themselves as Hispanic (19 percent))
• Excessive costs/fees (14 percent, with higher percentages for Millennials and those that identify themselves as either Hispanic or non-white).
Barriers Preventing Greater Enjoyment of Local Park and Recreation Facilities
(Percent of Respondents)
0% 5% 10% 15% 20% 25% 30% 35% 40% 45%
Lack of time
Lack of quality facilities near my home
Concern about my personal safety atparks/recreation facilities
Unaware of the location/offerings
Offerings do not match my interests
Excessive costs/fees
Concern about traveling to/frompark/recreation facility
No barrier preventing enjoyment of local parks/recreation facilities 25%
13%
14%
14%
16%
17%
20%
39%

National Recreation and Park Association | 9
A major determinant for the number of visits a person makes to their local park and recreation facilities is whether they can safely travel to and from their nearest local park, playground, open space or recreation center. Nearly three in five Americans feel “completely” or “very” safe walking to and from their local park and recreation facility (58 percent) while another 29 per-cent characterize the walk as being “somewhat safe.” Nevertheless, 14 percent of Americans feel unsafe walking to and from their local park and recreation facilities.
An unsafe walk means people are less likely to take advantage of everything their local park and recreation agency has to offer. Only 38 percent of survey respondents who have not visited a park or recreation facility over the past year perceive the walk to and from such facilities as being safe. By comparison, 89 percent of survey respondents who have visited a park or recreation facility at least once in the past year report that they feel safe walking to and from their local parks. Further, survey respondents without a safe way to walk to parks visit these facilities 40 percent fewer times per year than do those that feel safe walking to and from their local parks.
To mitigate these issues, NRPA created its Safe Routes to Parks campaign, which combines environmental and policy strat-egies that promote safe and equitable access to parks. Safe Routes to Parks efforts vary across communities but generally include one or all of the following: (1) conducting assessments to identify gaps and barriers in park access; (2) building, im-proving and maintaining public infrastructure, such as sidewalks, crossings and trails to create safe walking, biking and transit routes to parks; and/or (3) enhancing programming, community engagement and amenities to increase perceived safety and attract local residents to the park.
Perceived Safety Walking to Local Park, Open Space or Recreation Center
(Percentage Distribution of Respondents)
Completely Safe
Very Safe
Somewhat Safe
Somewhat Unsafe
Very Unsafe
Completely Unsafe
26%
32%
29%
8%
3% 3%

10 | NRPA Americans’ Engagement with Parks Survey
Importance of Parks and Recreations to Our Communities
While Americans may disagree — at times passionately — about the proper role of government and public provision of services at the state and federal level, they view many of the services provided by their local government as vital for their day-to-day life. This includes services that promote public safety, the education of children, social welfare, utilities and transportation. Also on the list of important offerings delivered by their local governments are those delivered by their local park and recreation agency.
An overwhelming majority of Americans — nine in 10 to be specific — identify parks and recreation as an important service provided by their local government. Strong supporters of parks and recreation span across every segment of the population: Examples include:
• Generations: Millennials (93 percent), Gen Xers (94 per-cent) and Baby Boomers (85 percent)
• Race: Those that identify as white (89 percent) or non-white (93 percent)
• Ethnicity: Those that identify as Hispanic (92 percent) or non-Hispanic (89 percent)
• Household formation: House-holds with children (94 per-cent) and those without chil-dren (87 percent)
• Political views: Democrats (91 percent), Republicans (89 percent) and Tea Party members (92 percent)
Americans place nearly the same level of importance on parks and recreation as they do on virtually every other major service delivered by their local government. Whereas 90 percent of survey respondents view parks and recreation as an important ser-vice provided by local government, other services compare favorably, including:
• Public safety: Fire/EMT (98 percent) and Police (97 percent)
• Water/Utilities (97 percent)
• Roads/Transportation (97 percent)
• Education (92 percent)
• Economic development (92 percent)
• Social services (89 percent)
Important
Not Important
Americans Agree That Parks and Recreation Are an Important Service Provided by Their Local Government
(Percentage Distribution of Respondents)
90%
10%

National Recreation and Park Association | 11
The widespread support for parks and recreation results from the many ways that these valuable resources impact our communi-ties. This may be the local corner park where friends and family meet on a sunny weekend afternoon or the walking or biking trail where we blow off steam after a hard day at work. These agencies are leaders in their communities in providing valuable services for children, including, before and afterschool care, summer camps and hosting sports leagues that teach the importance of physical activity, the thrill of victory and the value of teamwork.
The diverse offerings of local park and recreation agencies unite communities through their tireless efforts in the areas of Con-servation, Health and Wellness, and Social Equity. The National Recreation and Park Association ties these concepts together into its Three Pillars, providing a clear vision of the mission of parks and recreation in our towns and cities.
Americans agree that the NRPA Three Pillars represent what they see as key goals for their local park and recreation agency, with nearly equal percentages seeing each pillar as a critical function of their local agency.
• Seventy-six percent of survey respondents rate as either “extremely” or “very” important that their local park and rec-reation agency focuses on health and wellness, including providing residents with improved access to healthy food and increased opportunities for physical activity.
• Seventy-four percent of Americans see as an “extremely” or “very” important role for their agency to devote resources to conservation, including the protection of open space and engaging their communities in conservation practices.
• Seventy-two percent of survey respondents support their park and recreation agency devoting efforts to improve social equity, including ensuring all people in their communities can access the benefits of local parks, regardless of race, age, income or any other characteristic.
Parks andRecreation
Police Fire(inc. EMT)
Education Water/Utilities
Roads/Transportation
EconomicDevelopment
Social Services
Importance of Parks and Recreation Compared to Other Local Government Provided Services
(Percent of Respondents)
0%
10%
20%
30%
40%
50%
60%
70%
80%
90%
100%90%
97% 98%92%
97% 97%92%
89%
Somewhat Important Very Important Extremely Important

12 | NRPA Americans’ Engagement with Parks Survey
Much like how parks and recreation enjoys strong support across virtually every demographic group in the United States, the support for the NRPA Three Pillars is firm with nearly every segment of the U.S. population. Nevertheless, there are segments that are more likely to see the Pillars as areas of focus for their local park and recreation agencies. Examples include:
• Millennials: Health and Wellness (83 percent), Conservation (76 percent) and Social Equity (79 percent)
• Non-whites: Health and Wellness (87 percent), Conservation (74 percent) and Social Equity (77 percent)
• Hispanics: Health and Wellness (86 percent), Conservation (77 percent) and Social Equity (80 percent)
• Parents: Health and Wellness (84 percent), Conservation (80 percent) and Social Equity (81 percent)
Nor is the support for the NRPA Three Pillars a partisan issue. In fact, solid majorities of people who identify themselves as Dem-ocrats, Republicans or members of the Tea Party also agree that the Pillars represent what they see as the key priorities for their local park and recreation agencies.
• Democrats: Health and Wellness (83 percent), Conservation (81 percent) and Social Equity (81 percent)
• Republicans: Health and Wellness (73 percent), Conservation (71 percent) and Social Equity (65 percent)
• Tea Party members: Health and Wellness (76 percent), Conservation (72 percent) and Social Equity (73 percent)
Americans View the NRPA Three Pillars as Their Park and Recreation Agency's Priorities
(Percent of Respondents Indicating the Pillars Are Either "Extremely" or "Very" Important)
0%
10%
20%
30%
40%
50%
60%
70%
80%
Health and Wellness Conservation Social Equity
76% 74% 72%

National Recreation and Park Association | 13
Taking a more detailed look at what the NRPA Three Pillars entail, Americans reaffirm their support for the broad, vital mission of park and recreation agencies. Specifically, they agree that their local agencies should consider the NRPA Three Pillars when designing, funding and delivery their offerings to the community.
In terms of health and wellness, survey respondents indicate that it is “extremely” or “very” important that agencies offer facilities and services that improve both mental health (76 percent) and physical health (71 percent). Younger, non-white and/or Hispanic survey respondents are most likely to support one or both of these goals.
Similarly, survey respondents agree that the two conservation-oriented tactics — conserving the natural environment and protecting open space — should be important considerations for park and recreation agencies as they design, fund and de-liver their services. Seventy-nine percent say it is “extremely” or “very” important that agencies work to conserve the natural environment, while 76 percent agree that agencies need to protect open space. Millennials and parents of children are most likely to support either conservation tactic.
In terms of social equity, 74 percent of survey respondents see it as “extremely” or “very” important that their park and recreation agency ensures that all members of their community have equitable access to parks, recreation facilities and programming. In addition, two-thirds of Americans agree that their local agency must address the needs of the underserved population in their community. The populations most likely to support the tactics linked to the social equity pillar are Millen-nials, non-whites and parents.
Important NRPA Pillar Tactics for Park and Recreation Agencies
(Percent of Respondents Indicating Tactic Is Either "Extremely" or "Very" Important)
0%
10%
20%
30%
40%
50%
60%
70%
80%
90%
100%
Offering facilities andservices that improve
physical health
Offering facilities andservices that improve
mental health
Conserving the natural environment
Protecting open space
Ensuring all membersof the community have
equitable access toparks, recreation
facilities, and programs
Addressing the needs of
underserved populations
71%76%
79% 76% 74%66%
Health and Wellness Conservation Social Equity

14 | NRPA Americans’ Engagement with Parks Survey
Political Support for Increased Park and Recreation Funding
Local governments face the challenge of meeting their constituents many needs and desires in an environment of tight bud-gets. Local political leaders have to make critical, tough decisions on how to allocate tax revenues to each of their jurisdiction’s many initiatives. As a result, it is critical that local government policymakers understand the park and recreation mission and the level of importance their constituents place on the agency’s offerings. Americans agree that park and recreation agencies deserve the financial resources that support, sustain and expand their offerings.
The survey findings presented in this report thus far demonstrate both widespread usage of park and recreation facilities and a broad agreement among Americans that park and recreation agencies are important partners in their community. As a re-sult, it should be of little surprise that most Americans also indicate they are more likely to vote for local politicians that make park and recreation funding a priority.
Seventy-two percent of survey respondents say that they are either “much more likely” or “somewhat more likely” to vote for a local politician (e.g., mayor, county executive, council members, etc.) that makes park and recreation funding a priority. More specifically, 26 percent of respondents indicate they are “much more likely” to vote for politicians who make park and recre-ation funding a priority, while another 46 percent say they are “somewhat more likely.”
Americans More Likely to Vote for Local Politicians That Make Park and Recreation Funding a Priority
(Percent of Respondents)
0%
10%
20%
30%
40%
50%
60%
70%
80%
90%
All Democrat Republican 5+ park visits per
year
1-4 park visits per
year
No park visits
per year
Much more likely to vote for person Somewhat more likely to vote for person
72%
80%
70%
83%
70%
40%

National Recreation and Park Association | 15
This support for local political leaders who make parks and recreation a funding priority includes Millennials (76 percent), Gen Xers (77 percent) and those that are parents (81 percent). Further, the support for park and recreation advocating politicians crosses the political aisle with 80 percent of Democrats and 70 percent of Republicans indicating the same. Even more nota-bly, this support does not waver by the survey respondent’s race, ethnicity or income level.
Park and recreation agencies deliver their services to the community in a remarkably efficient manner. According to data collect-ed through NRPA’s agency-performance benchmarking resource (PRORAGIS) and presented in the 2016 NRPA Field Report, the typical park and recreation agency has operating expenditures of less than $7.00 per month for each resident that it serves. As a matter of perspective, that is less than a quarter per day for each resident served by the park and recreation agency.
Americans overwhelmingly support their local governments to increase how much they spend on public park and recreation services. Three-quarters of survey respondents say they want their local governments to increase park and recreation spend-ing, split between 27 percent indicating that they would “definitely” support increased spending and another 47 percent stating that they would “probably” support higher spending.
Americans Support Greater Government Funding for Local Park and Recreation
(Percent of Respondents That Support Increased Spending for Local Park and Recreation Services)
0%
10%
20%
30%
40%
50%
60%
70%
80%
90%
74%81%
69%
85%
71%
44%
All Democrat Republican 5+ park visits per
year
1-4 park visits per
year
No park visits
per year

16 | NRPA Americans’ Engagement with Parks Survey
The backing for higher park and recreation funding comes from nearly every segment of survey respondents but is particularly robust from Millennials (84 percent) and parents (83 percent). Higher park and recreation funding also enjoys bipartisan sup-port, with 81 percent of Democrats and 69 percent of Republicans in agreement. Large majorities of respondents by differing race, ethnicities and income strata would support more robust park and recreation funding.
A deeper glance at the data also finds that it takes one simple visit to a local park or recreation facility to gain the support for increased funding. Forty-four percent of survey respondents who did not visit a park or recreation facility over the past year support higher agency funding. This percentage soars to 71 percent of Americans who visited a park between one and four times over the past year.
Americans would support substantially increased funding for their park and recreation agency. The typical survey respondent indicates they would support their local government to increase its park and recreation spending by roughly a third to $9.00 per month per resident, nearly 30 percent above the current median level.
Americans Support a Significant Increase in Park and Recreation Spending by Local Governments
(Percentage Distribution of Respondents That Support Increased Funding for Local Park and Recreation Services)
All Democrat Republican5+ Park Visits
per Year1-4 Park Visits
per YearNo Park Visits
per Year$7.50 per resident, per month 23% 20% 24% 20% 29% 29%
$8.00 per resident, per month 22% 22% 25% 19% 25% 32%
$9.00 per resident, per month 15% 11% 14% 16% 18% 9%
$10.00 per resident, per month 28% 33% 28% 33% 18% 21%
$11.00 per resident, per month 3% 3% 2% 3% 4% 2%
More than $11.00 per resident, per month
9% 10% 6% 10% 6% 7%

National Recreation and Park Association | 17
CONCLUSIONAmericans see the offerings of their local park and recreation agency as a vital contributor to their communities. Four in five people have visited a local park and/or recreation facility within the past year, with an average of 29 visits per year. It is their frequent, regular and all-inclusive engagement that breeds the strong, unwavering support for parks and recreation. Further, the backing for parks crosses nearly every segment of the public, coast-to-coast.
Local park and recreation agencies are leaders in their communities in terms of conservation, health and wellness, and social equity. The wealth of facility types and program offerings reflects the diversity of the populations that they serve and their needs and desires. Where some see their local park as a place to work out and blow off some steam, others turn to their local agency for critical services that improve lives (e.g., out-of-school time programs). In terms of the NRPA Three Pillars, parks and recreation offers solid, effective solutions to issues affecting our communities.
The way parks and recreation has integrated itself into the lives of most Americans highlights that the services it provides are not a luxury, but rather a crucial, essential service delivered by local governments. This study’s findings make it clear that voters are more likely to support candidates who openly advocate increased agency funding for mayor, county executive, city/town/county council, and other local government offices. Further, these same voters back increased park and recreation funding to ensure improved and more accessible services in their community.
Park and recreation professionals can use the results from this inaugural edition of the Americans’ Engagement with Park Survey to reaffirm what they likely already suspected: The public highly values the work that they and their colleagues deliver to their community every day. The public’s strong support for parks and recreation further makes the case to local political leaders, stakeholders and the media for larger and more stable funding. Also, it is critical to share these findings with the general public as an opportunity to educate them on the broad impact agencies have in their community. The parks and rec-reation story is just too great to keep to ourselves.
ABOUT THE SURVEYThe 2016 Americans’ Engagement with Parks Survey is a new annual survey research series of the National Recreation and Park Association focused on the general public’s interaction with parks and recreation. The goal of this research series is to better understand Americans’ use of local park and recreation facilities and their willingness to fund these resources.
To explore these issues, the Research Department at the National Recreation and Park Association created a 38-question survey and engaged Wakefield Research to collect data from a random sample of 1,000 American adults that are an accurate representation of U.S. adults ages 18 and above. The data was collected with an online survey in which survey respondents had received an email invitation from Wakefield Research. The margin of error of the response is +/- 3.1 percentage points at the 95 percent confidence level.
The survey instrument and final report were created by the NRPA Research Department, which is solely responsible for their content.

18 | NRPA Americans’ Engagement with Parks Survey
22377 Belmont Ridge Road
Ashburn, VA 20148-4501
800.626.NRPA (6772)
www.nrpa.org
© 2016 National Recreation and Park Association


