NASA Technical Memorandum 84500 PRELIMINARY ANALYSIS OF STS-3 ENTRY DATA FOR THE ORBITER WINDWARD CENTERLINE David A. Throckmorton, H. Harris Hamilton II, and E. Vincent Zoby June 1982 NI\SI\ National Aeronautics and Space Administration Langley Research Center Hampton, Virginia23665 JOHN F. KENNEDY SPACE DOCUMENTS DEPARTMENT J8RAII,' REFERENCE COpy JON 2S 1982 https://ntrs.nasa.gov/search.jsp?R=19820020699 2018-07-29T02:30:29+00:00Z
Transcript
NASA Technical Memorandum 84500
PRELIMINARY ANALYSIS OF STS-3 ENTRY
HEAT~TRANSFER DATA FOR THEORBITER WINDWARD CENTERLINE
PRELIMINARY ANALYSIS OF STS-3 ENTRY HEAT-TRANSFER DATAFOR THE ORBITER WINDWARD CENTERLI~E
David A. Throckmorton, H. Harris Hamilton II,and E. Vincent Zoby
SUMMARY
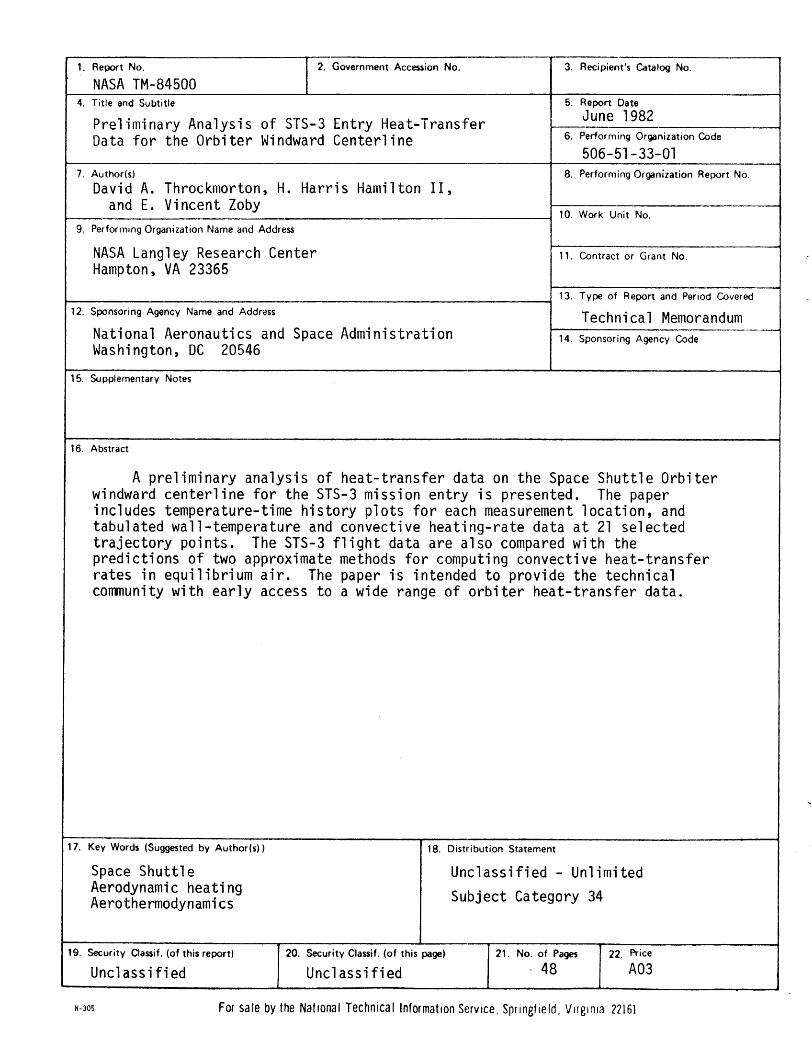
A preliminary analysis of heat-transfer data on the Space ShuttleOrbiter windward centerline for the STS-3 mission entry is presented.The paper includes temperature-time history plots for each measurementlocation, and tabulated wall-temperature and convective heating-ratedata at 21 selected trajectory points. The STS-3 flight data are alsocompared with the predictions of two appproximate methods forcomputing convective heat-transfer rates in equilibrium air. Thepaper is intended to provide the technical community with early accessto a wide range of orbiter heat-transfer data.
INTRODUCTION
Temperature measurements obtained at the aerodynamic surface ofthe orbiter's thermal protection system (TPS) provide fordetermination of the aerothermodynamic environment to which theorbiter is subjected during entry from Earth orbit. The measuredtemperatures are used in a rigorous analysis of heat conductionwithin, and reradiation from, the TPS in order to determine convectiveheat-transfer rates. Convective heating-rate data for the orbiter'swindward centerline from the STS-3 mission entry are presented. Theflight data are compared with the results of two approximate methodsfor computing convective heat-transfer rates.
SYMBOLS AND ACRONYMS
DFI
h
TPS
development flight instrumentation
altitude
free-stream Mach number
free-stream pressure
convective heat-transfer rate
thermal protection system
TPS surface temperature
free-stream temperature
x/L
Poo
non-dimensional body length (L=32.89 m)
free-stream velocity
angle-of-attack
free-stream density
DATA SOURCE
2
During the orbital flight test missions, the orbiter has onboardan instrumentation system referred to as the development flightinstrumentation (DFI). The OFI is comprised of over 4500 sensors,associated data-handling electronics, and recorder, which provide datato enable postflight certification of orbiter subsystems design.Included among the OF! are measurements of the orbiter's aerodynamicsurface temperature at over 200 surface locations. These measurementsare obtained from thermocouples mounted within the thermal protectionsystem, in thermal contact with the aerodynamic surface coating.Sixteen of these thermocouples are located along the vehicle'swindward centerline (fig. 1). DFI thermal data are recorded once eachsecond throughout the entry time period. The measuredtemperature-time histories provide for determination of surface heattransfer rates.
CONVECTIVE HEATING-RATE DETERMINATION
The measured time-histories of surface temperature are smoothedand subjected to an interactive review proce~s to assure that thesmoothed data provide an accurate representation of the rawtemperature data. An inverse, one-dimensional, transient analysis ofheat conduction within the TPS, and reradiation from the TPS surface,is used to determine convective heat-transfer rates (ref. 1). Theuncertainty of heating rates determined by this method has beenassessed (ref. 1) to be less than ~ 10 percent.
ANALYTICAL TECHNIQUES
The approximate heating method of Zoby (ref. 2) uses a rapidinviscid flow-field procedure, laminar and turbulent heating equationswhich can be computed for constant or variable-entroPY edgeconditions, and equilibrium-air correlations~ The flow environmentalong the windward centerline of the orbiter is approximated by usingan equivalent axisymmetric body. Resulting heating-rate calculationshave been validated for both laminar and turbulent flow conditions bycomparison with experimental ground-test data and results of morerigorous predictions (refs. 3 and 4) at shuttle flight designconditions. It ha~previously been used in the analysis of orbiterentry heating data (refs. 5 and 6).
The approximate heating method of Hamilton (ref. 7) is based on a"local infinite swept cylinder analysis" which can be used tocalculate both laminar and turbulent heating rates on the windwardside of the orbiter. The method includes both equilibrium-airthermodynamic properties and variable boundary-layer-edge entropy.It has been shown to be in good agreement with wind-tunnel data, andhas also been previously used in the analysis of orbiter entry heatingdata (ref. 7).
STS-3 RESULTS
Temperature Data
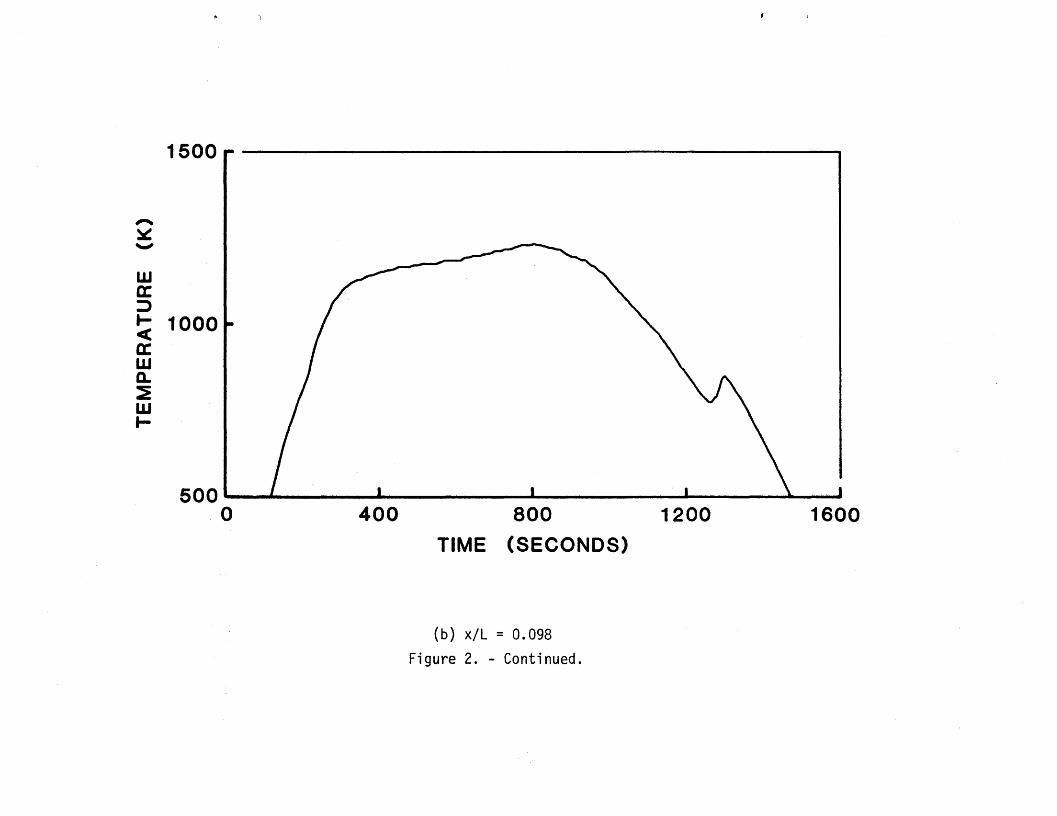
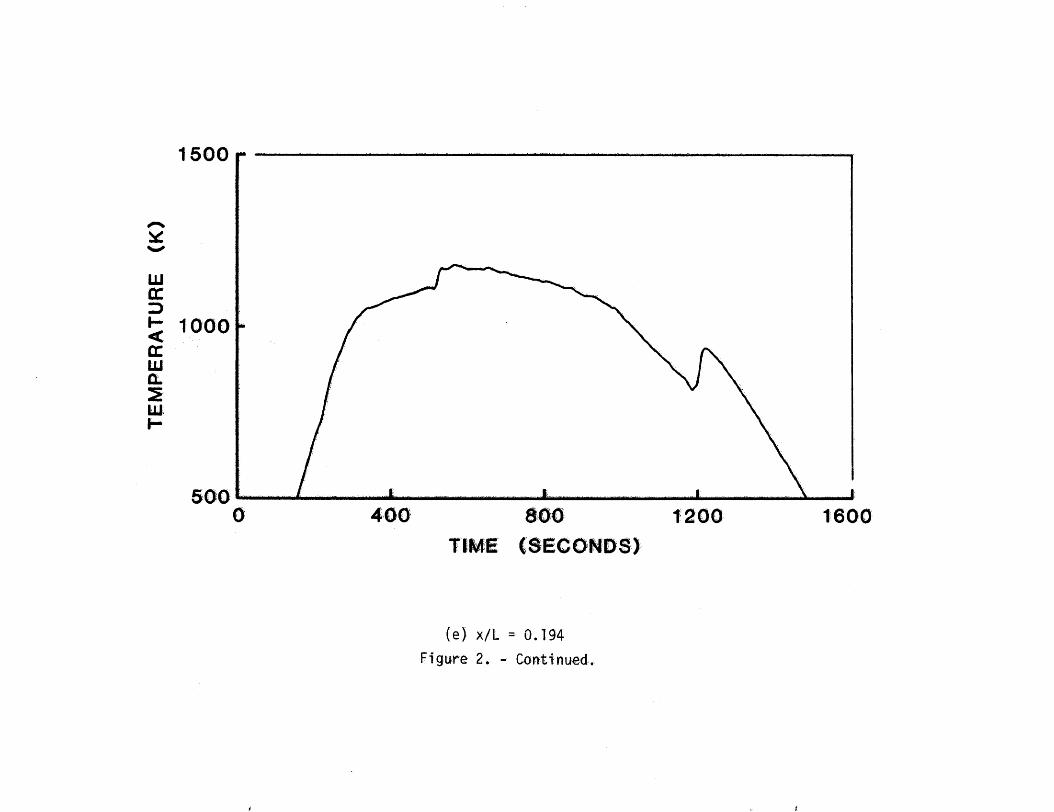
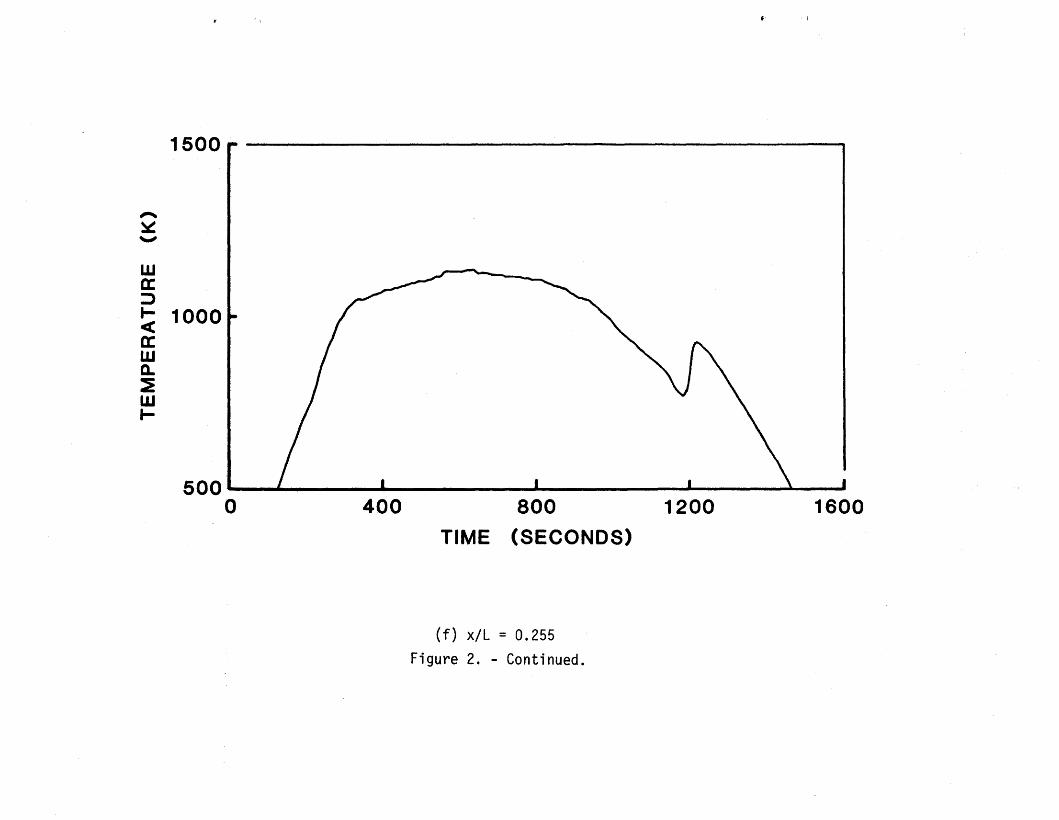
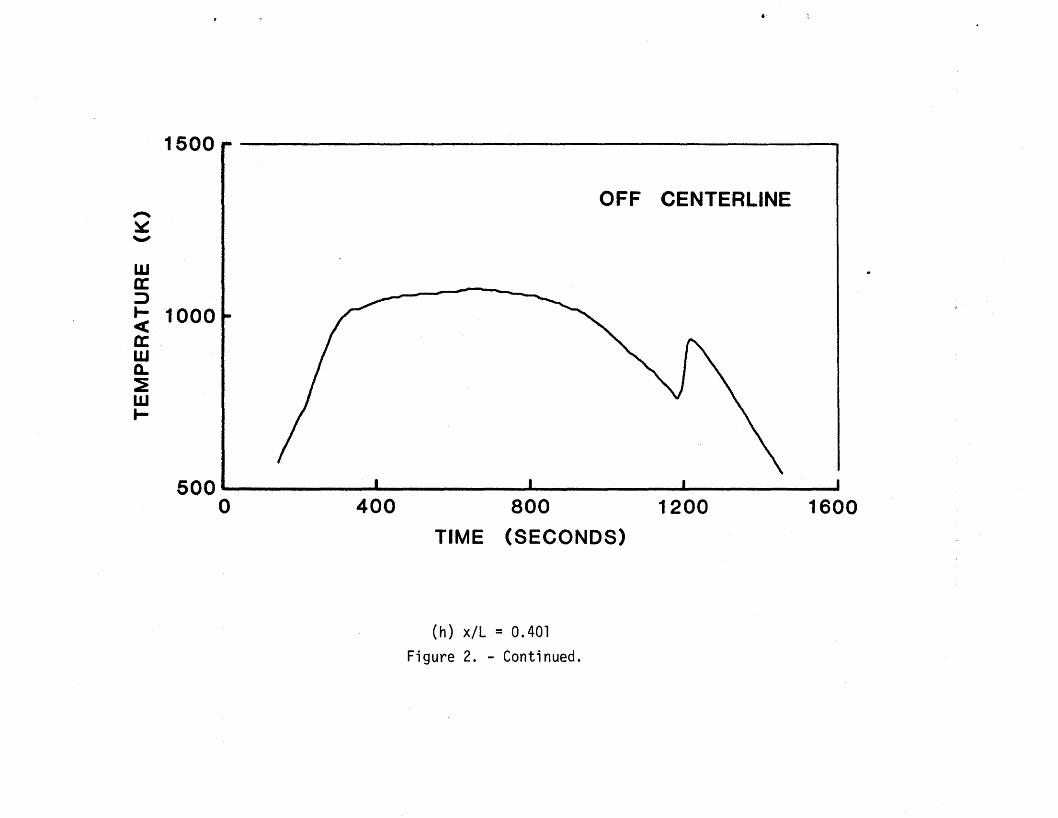
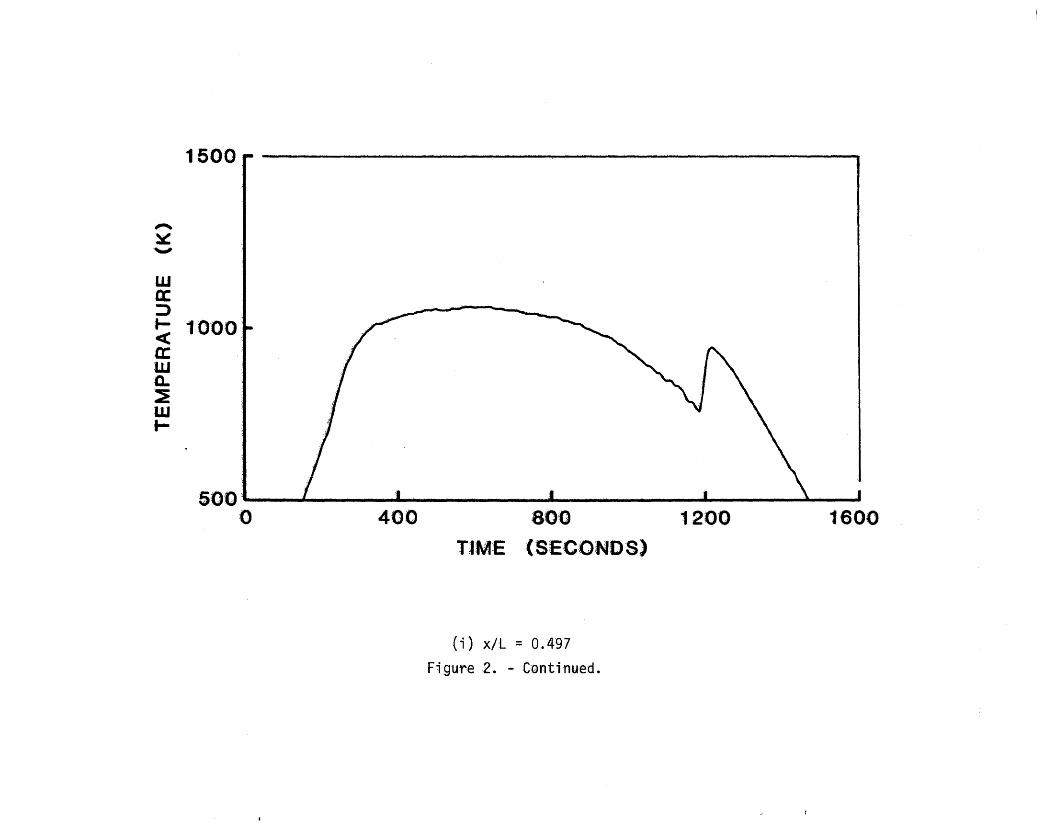
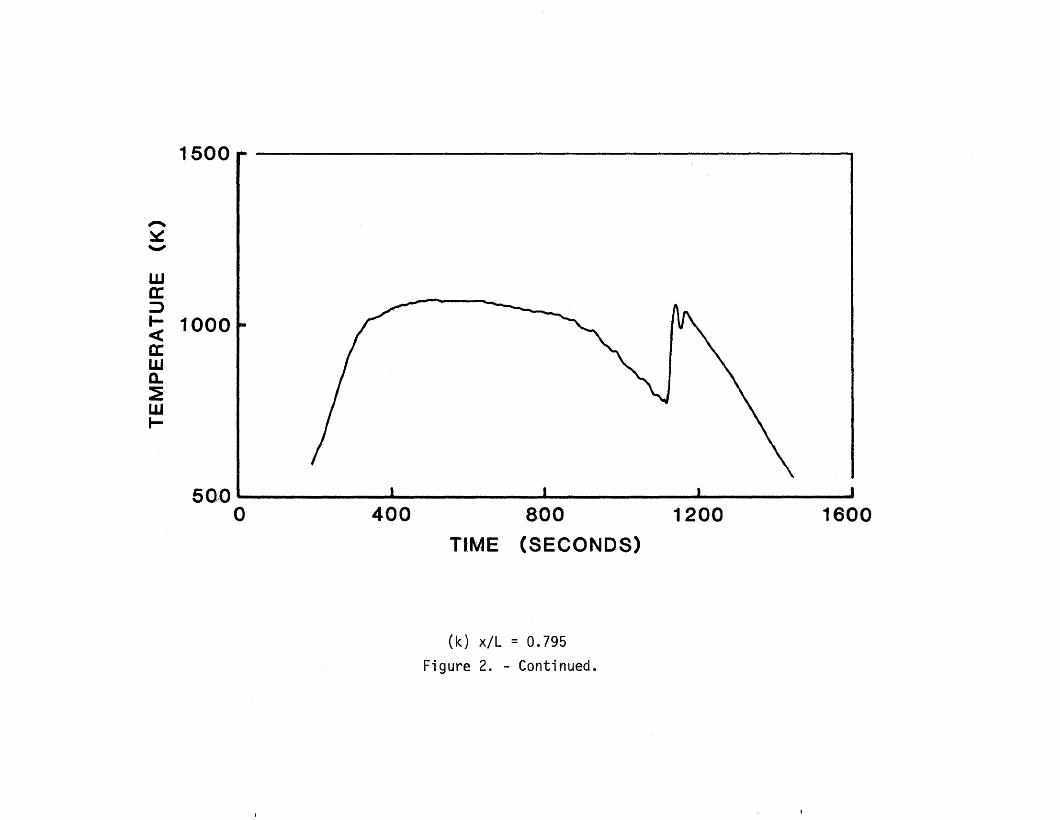
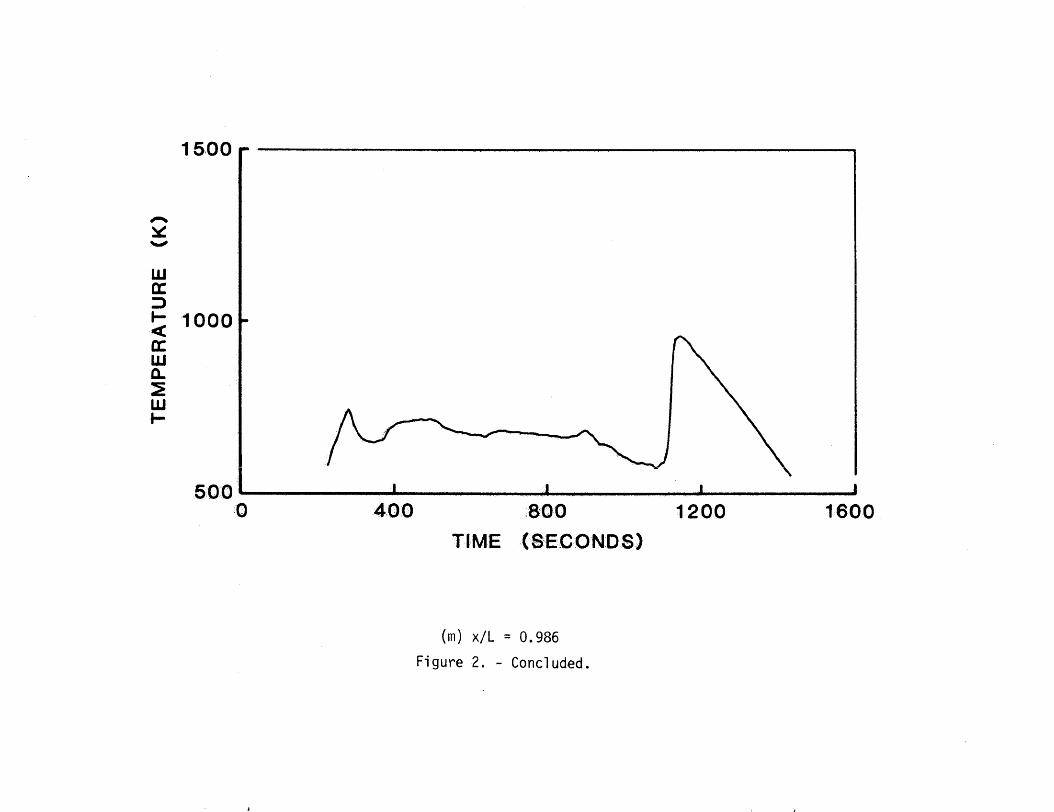
Smoothed temperature-time histories are shown in figure 2. Themeasurement location at x/L = 0.285 is part of an experiment (ref. 8)to investigate heating within gaps between TPS tiles.' Data are notpresented for the measurements at x/L = 0.297 and 0.402 as thesemeasurements were part of an experiment (ref. 9) to investigate thecatalytic efficiency of the TPS surface coating material. Data arepresented, however, for a measurement which is located at x/L = 0.401,but 1.14 meters off of the plane of symmetry. No data are presentedfor the measurements located at x/L = 0.691 and 0.946, as theseinstruments did not operate properly on STS-3.
Heat-Transfer Data
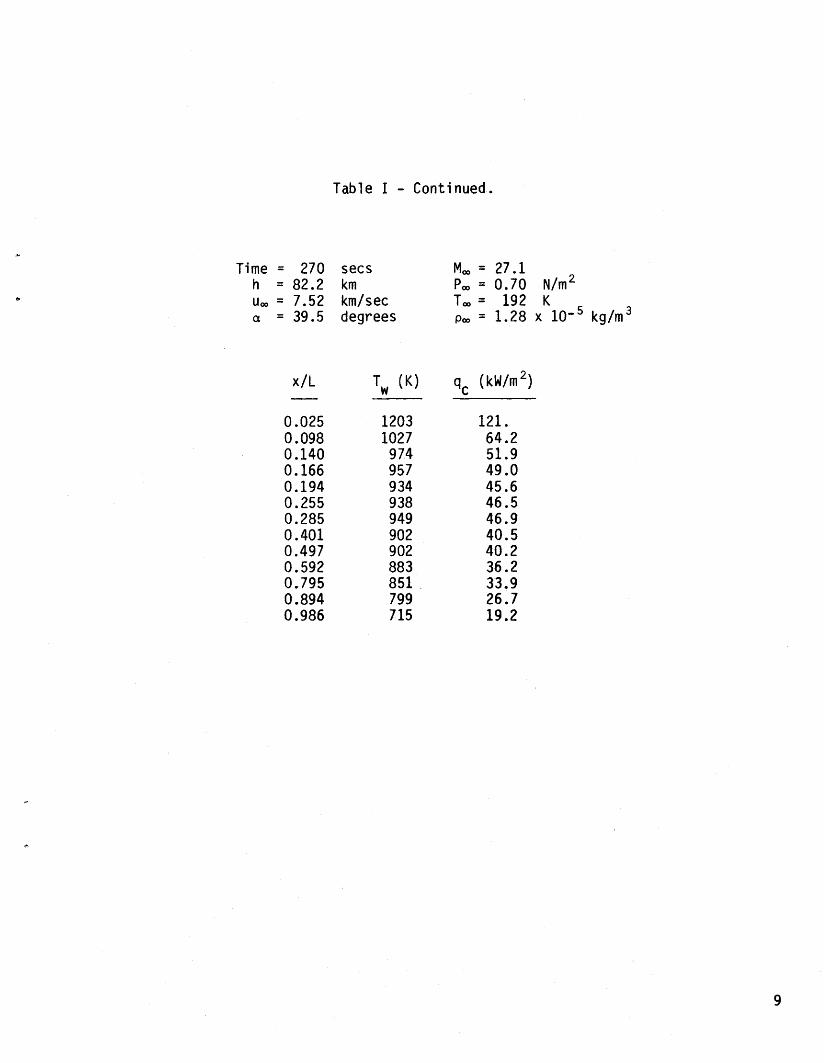
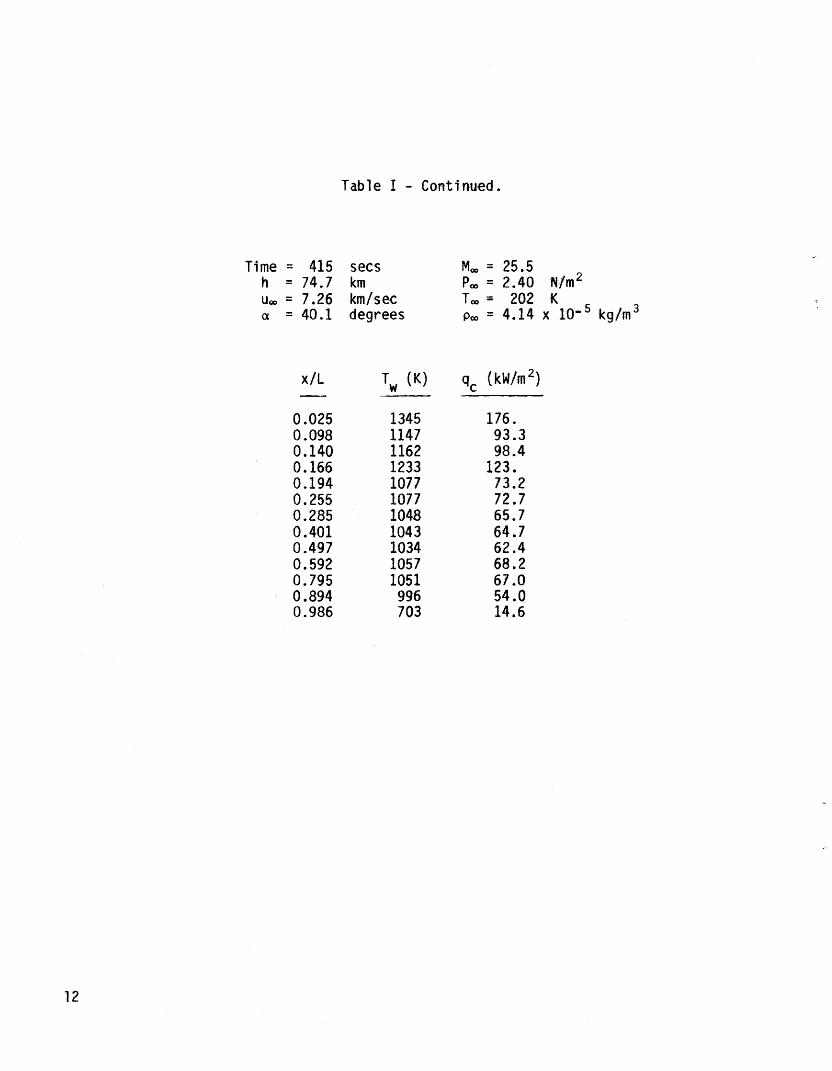
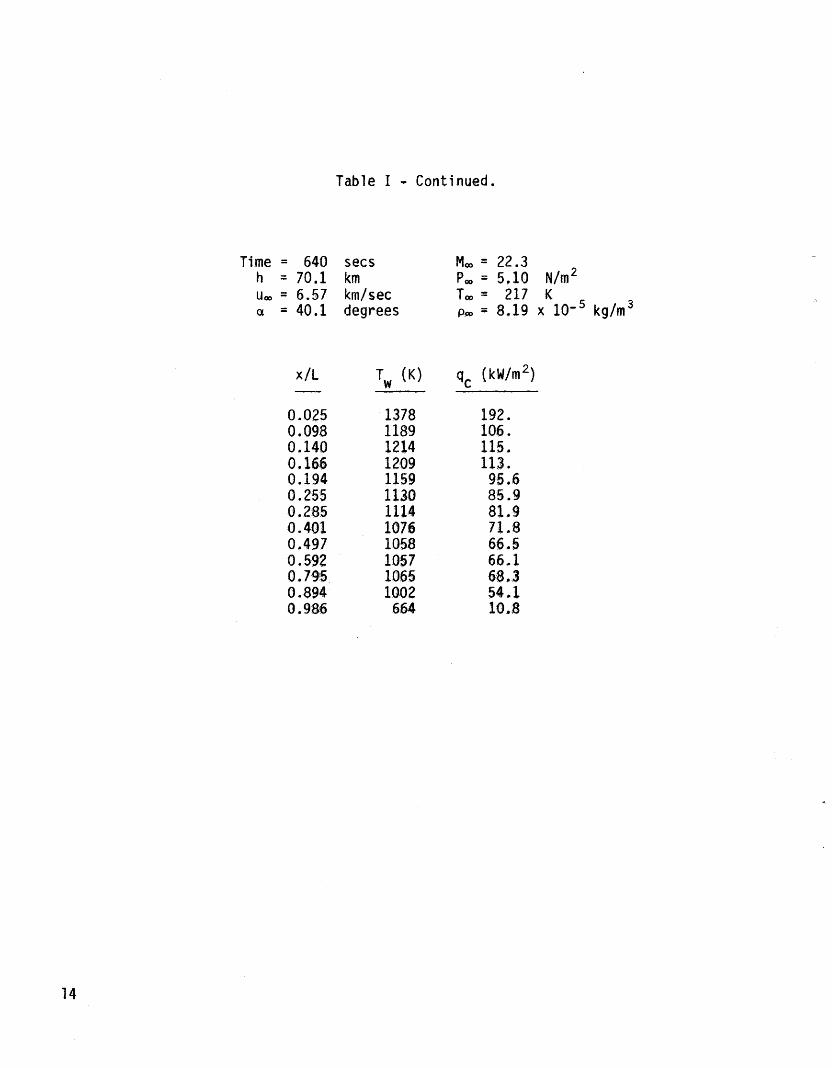
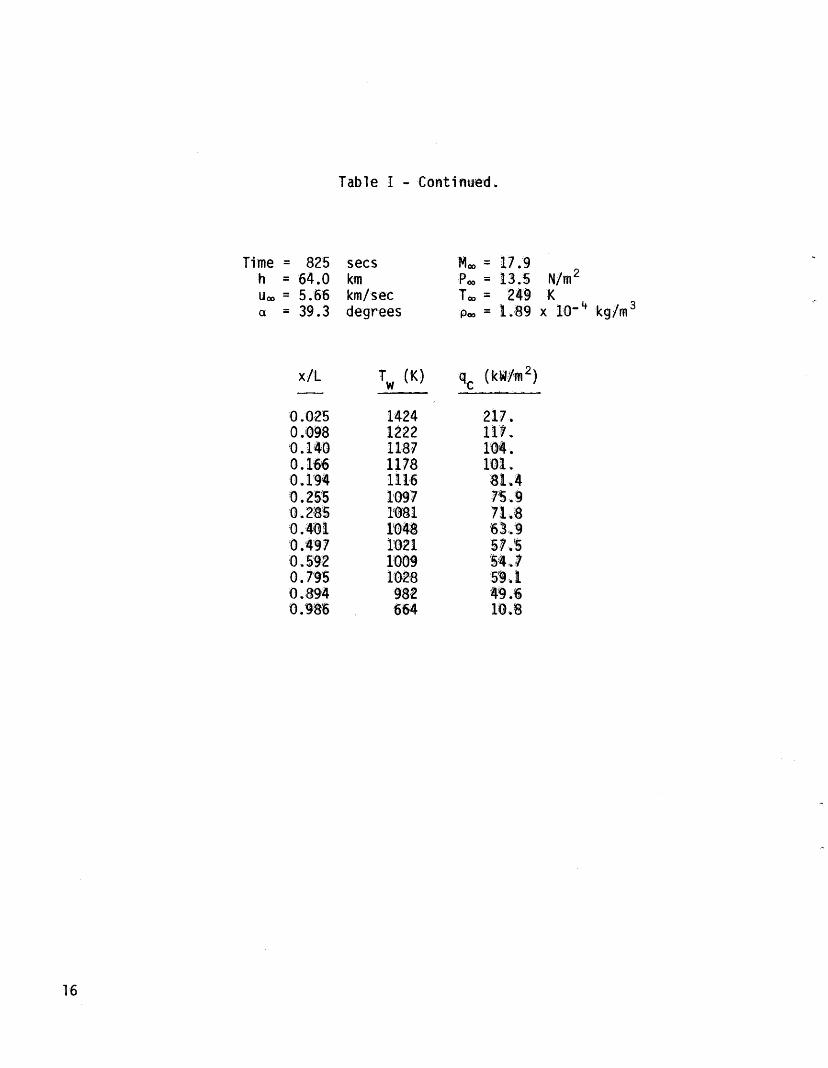
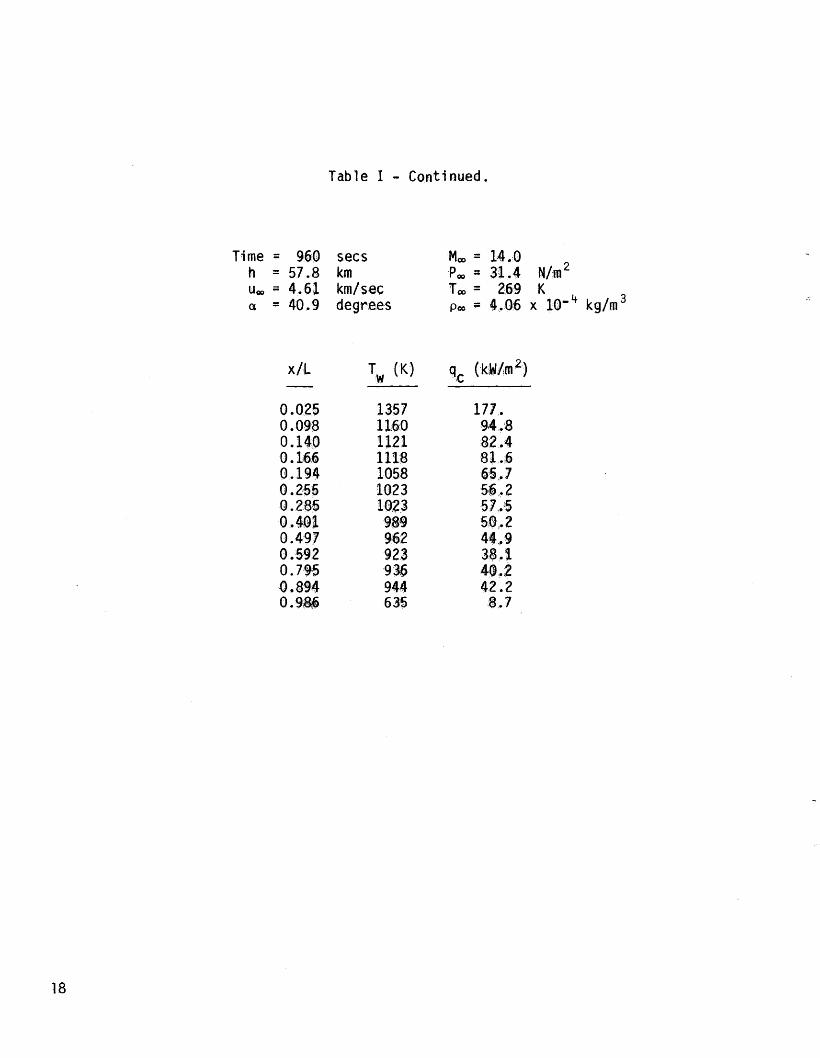
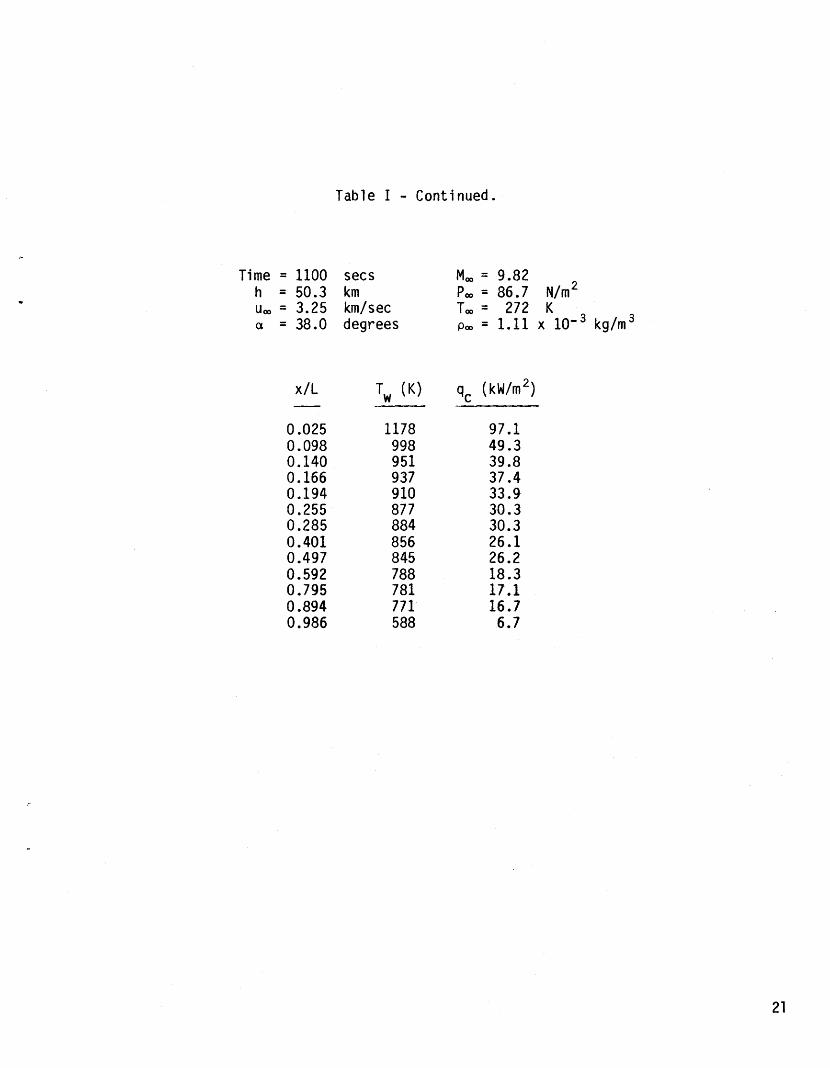
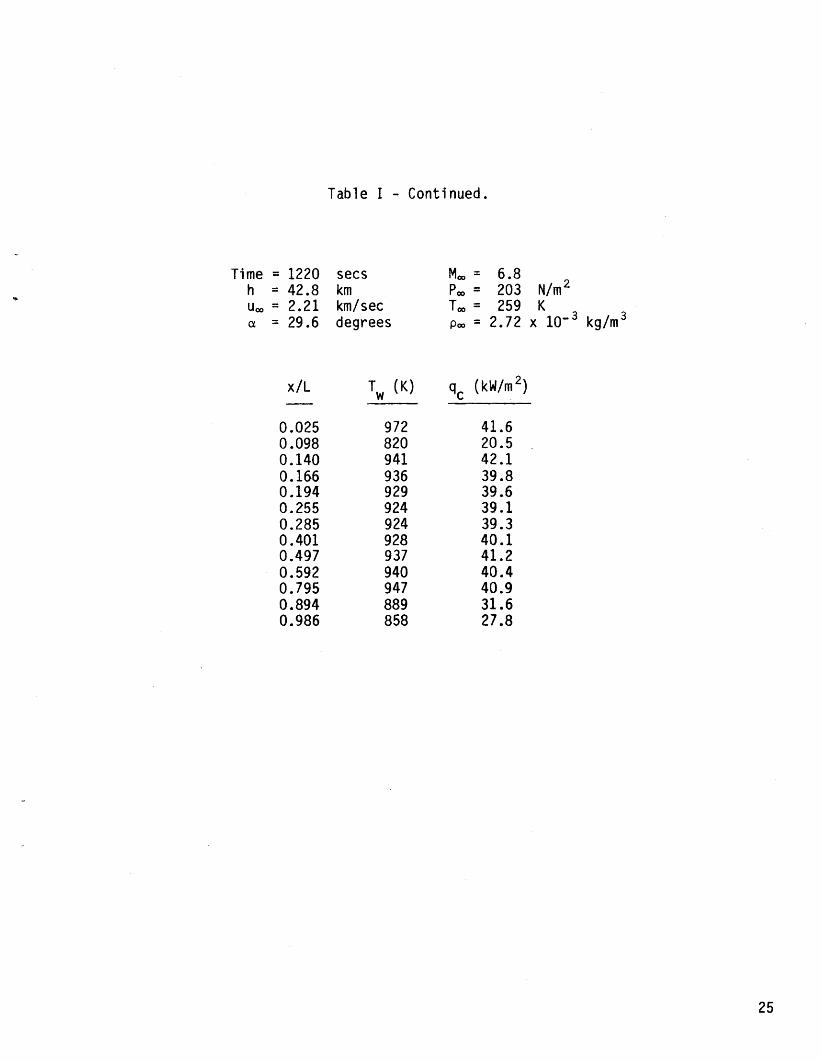
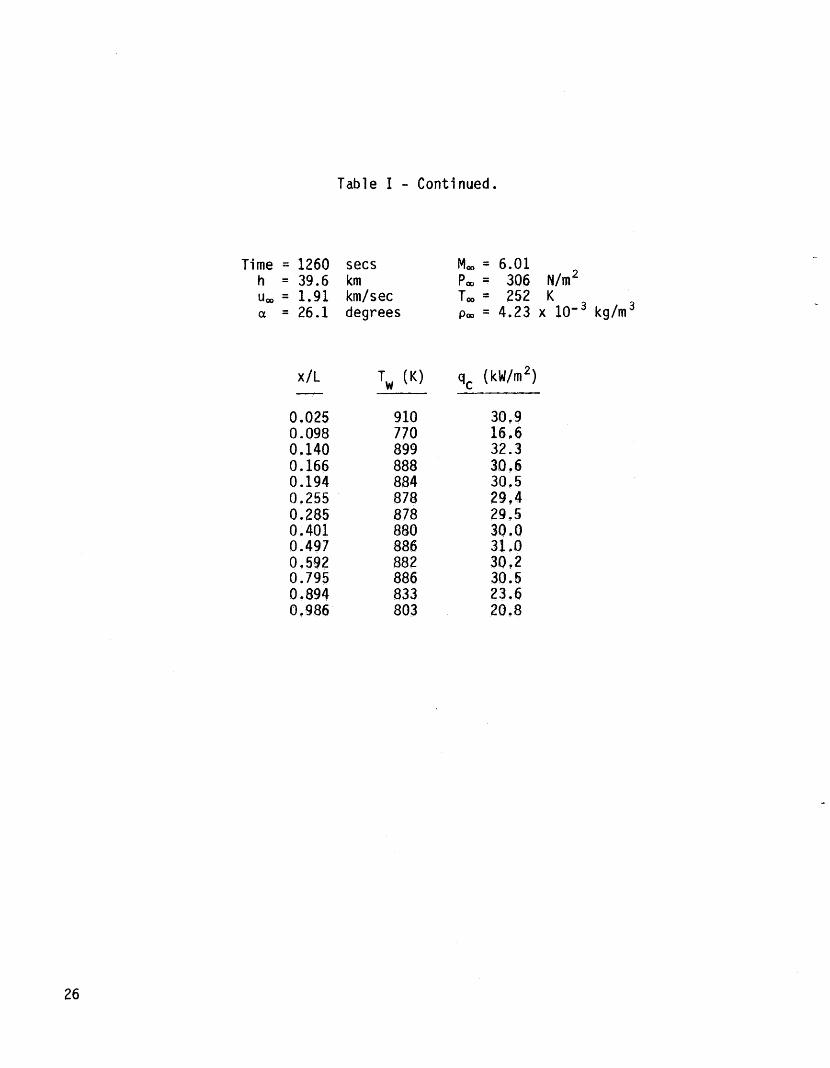
Windward centerline convective heat-transfer data, determined bythe method of reference 1, are tabulated in Table I for 21 trajectorypoints. These trajectory points span the entire portion of the entrywhich is- of aerothermodynamic interest. The first points are prior topeak aerodynamic heating, and the last point is after boundary-layertransition has occurred over 90 percent of the vehicle1s windwardcenterline.
Flight Environment Definition - Table I also contains informationwhich describes the flight environment at each trajectory point.Determination of the flight environment parameters was accomplishedthrough a process of reconstruction of the orbiter entry trajectory,modeling of the atmosphere on the day of entry, and correlation ofthese two data sets to provide an analytically~consistent definitionof the entry flight environment. The vehicle state parameters ofa1t i tude, veloci ty, and angl e of attack were determined through thetrajectory reconstruction process of reference 10. Free-streamtemperature was determined by the process of reference 11, whichcombines atmospheric modeling with direct measurement of atmosphericprofiles on the day of entry. Atmospheric density was determinedthrough a correlation of local surface pressure coefficient withfree-stream dynamic pressure. The correlation function was generatedusing both wind-tunnel and flow-field computational results.Aerodynamic surface pressure was measured at a point on the windward
3
4
centerline at x/L = 0.025. The measured pressure was input to thecorrelation function in order to determine dynamic pressure.*Consideration of the vehicle velocity then provided for thedetermination of the atmospheric density. Free-stream pressure wasdetermined by applying the gas law to the temperature and densitydata. The flight environment information contained in Table I wasused as input to the analytical methods in generating the flightpredictions to be discussed in the following section.
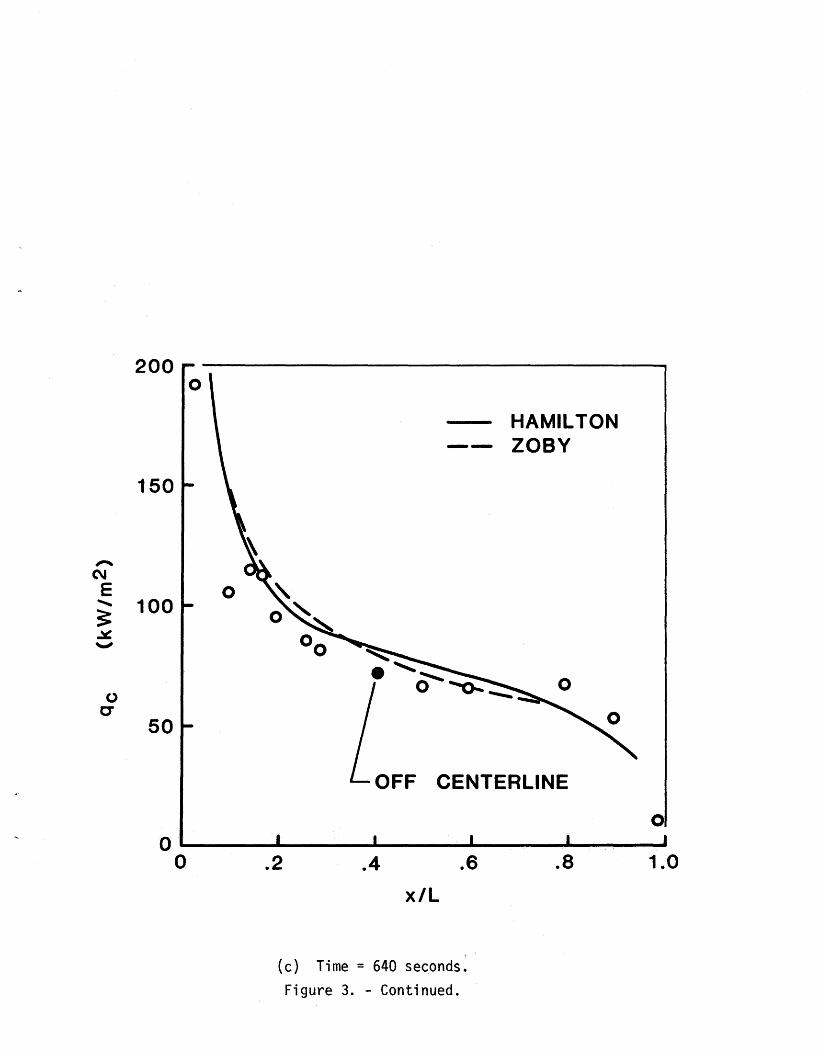
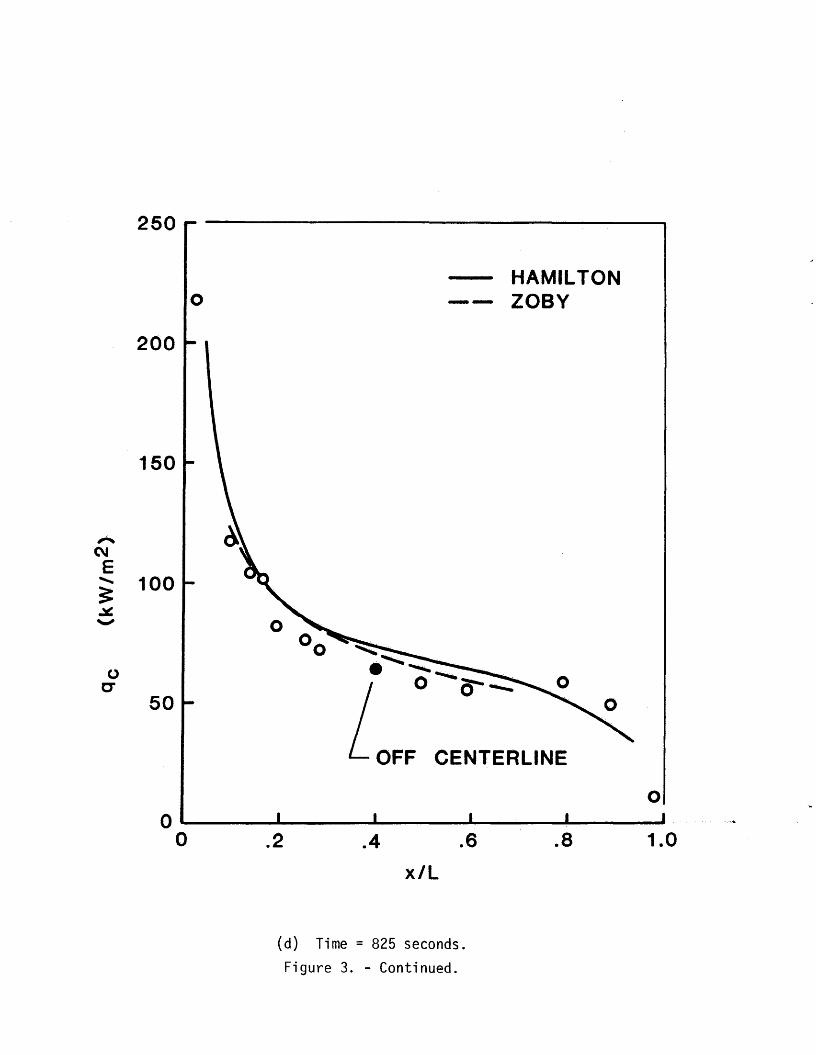
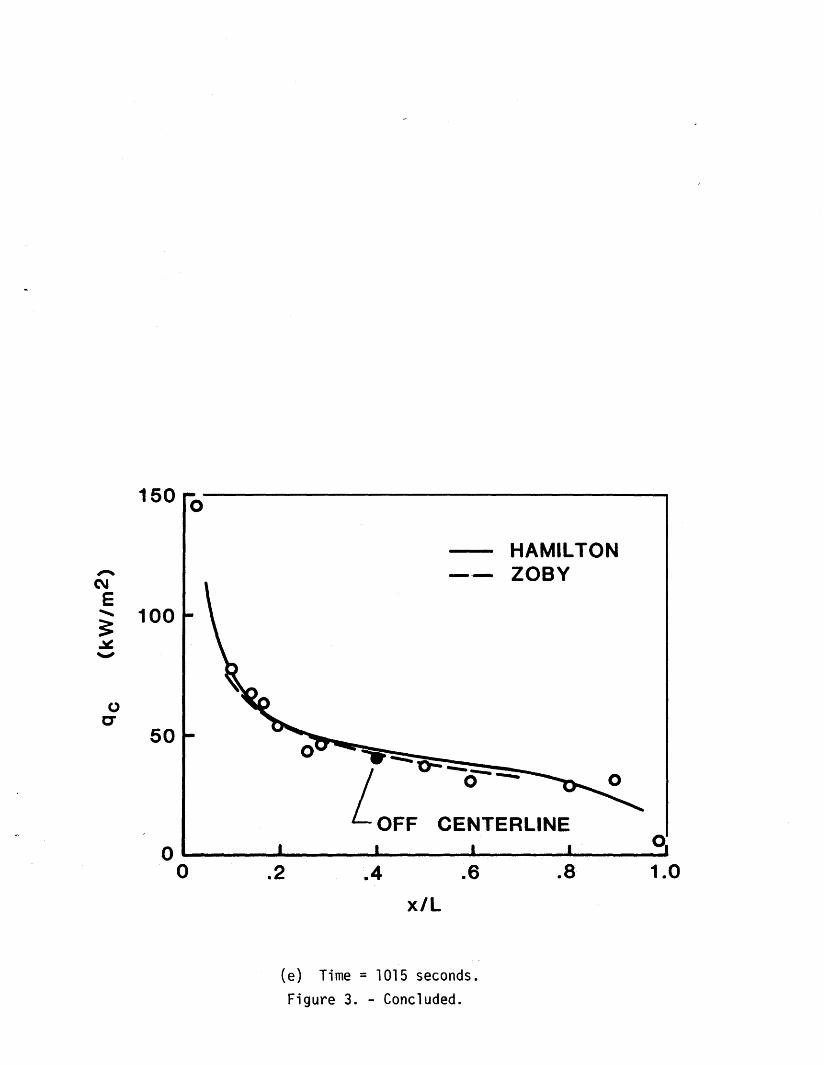
Heat-Transfer Distributions
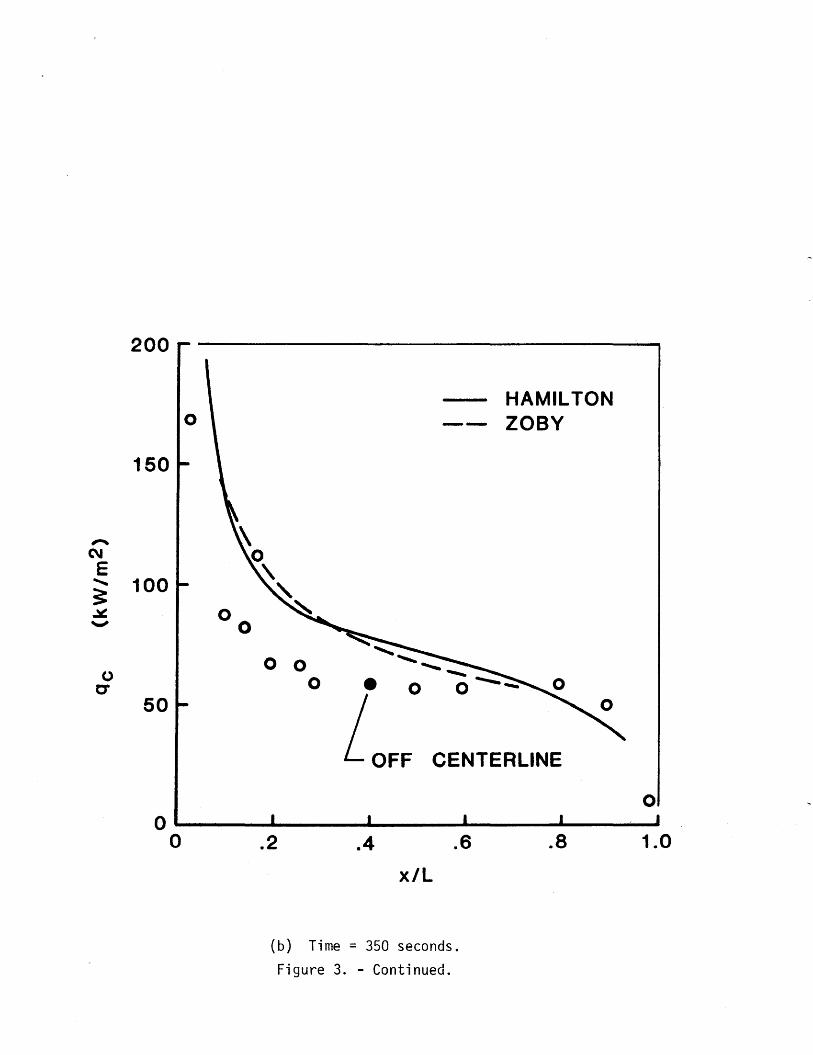
Flight-measured heat-transfer distributions at five trajectorypoints, along with the approximate equilibrium-chemistry predictionsof Hamilton and Zoby, are shown in figure 3. At time = 270 seconds,(fig. 3(a)), the flight data on the forward portion of the vehicleare as much as 35-percent lower than the equilibrium predictions;while on the aft portion of the vehicle, the flight data andpredictions are in relatively good agreement. The large disparitybetween prediction and flight data on the forward portion of thevehicle is attributed to nonequilibrium chemistry in the shock layerin flight.
At time:: 350 seconds (fig. 3(b», the comparison betweenpredictions and flight data is similar to that for the previous time.However t note that the data point at x/L :: 0.166 is substantiallyhigher than the surrounding data. The TPS tile which contains thismeasurement was previously coated with a highly catalytic material onSTS-2, as part of the experiment of reference 9. Although the coatingwas cleaned from this tile prior to STS-3, the STS-3 data indicatethat the catalytic efficiency of the surface of this tile remainsgreater than that of the surrounding baseline instrumented tiles.
In figure 3(c), time:: 640 seconds, heating to the forwardportion of the vehicle has increased substantially from the levelsobserved at the previous time, and downstream of x/L :: 0.10,approaches the levels of the equilibrium predictions. The increasedheating is probably the result of increased catalytic efficiency ofthe tile surface due to surface contamination--the contaminationresulting from the melting of an acoustic-sensor cover at thislocation and deposition of melted material on the surface of thethermally-instrumented tiles downstream. Acoustic sensors are locatedon the vehicle centerline at x/L = 0.106 and x/L :: 0.204. Postflightvisual inspection of the TPS confirms that these sensors are a sourceof TPS contamination. The apparent occurrence, in time, of thecont ami nat ion 1s evidenced by a sudden and si gn1 f1cant temperature'~
rise which occurs at a time of 520 seconds (figs. 2(e) and (g». Thisphenomenon was previously observed at several centerline measurementlocations on STS-2 (ref. 6).
*The correlation of local pressure coefficient with free-streamdynamic pressure was performed by R. C. Blanchard of the LangleyResearch Center and is to be described in a future publication.
r:
At the later times (figs. 3(d) and (e)), the agreement betweenflight data and equilibrium-chemistry predictions becomesprogressively better. It should be noted, however, that on STS-2 atapproximately the same altitude/velocity/angle-of-attack condition asthat of figure 3(e), nonequilibrium predictions indicate thatsignificant nonequilibrium effects should still be evident in theheat-transfer data (ref. 12). Also, on STS-2, the coated tiles of theCatalytic Surface Experiment (ref. 13) provided evidence ofnonequilibrium chemistry effects in the boundary layer at similarflight conditions.
CONCLUDING REMARKS
Apreliminary analysis of orbiter windward-centerlineheat-transfer data from the STS-3 mission entry is presented. Theflight data were compared with the predictions of two appproximatemethods for computing convective heat-transfer rates in air inchemical equilibrium. The comparisons indicate that at altitudesgreater than 60 kilometers, flight heat-transfer rates aresignificantly influenced by nonequilibrium chemistry effects. Ataltitudes below 60 kilometers, the flight data and equilibriumchemistry predictions are in good agreement. However, even at theseconditions, other computations and experiment indicate thatsignificant nonequilibrium chemistry effects should still be evident.
REFERENCES
1. Throckmorton, D. A.: Benchmark Aerodynamic Heat Transfer Datafrom the First Flight of the Space Shuttle Orbiter. AIAA Paper82-0003, January 1982.
2. Zoby, E. V.; Moss, J. N.; and Sutton, K.: Approximate ConvectiveHeating Equations for Hypersonic Flows. Journal of Spacecraftand Rockets, vol.18, no. 1, January 1981.
3. Rakich, J. V.; and Lanfranco, M. J.: Numerical Computation ofSpace Shuttle Laminar Heating and Surface Streamlines. Journalof Spacecraft and Rockets, vol. 14, no.5, May 1977.
4. Goodrich, W. D.; Li, C. P.; Houston, C. K.; Chiu, P. B.; andOlmedo, L.: Numerical Computations of Orbiter Flowfields andLaminar Heating Rates. Journal of Spacecraft and Rockets,vol. 14, no. 5, May 1977.
5. Zoby, E. V.: Comparisons of Free-flight Experimental andPredicted Heating Rates for the Space Shuttle. AlAA Paper82-0002, January 1982.
6. Zoby, E. V.: Analysis of STS-2 Experimental Heating Rates andTransition Data. AlAA Paper 82-0822, June 1982.
5
6
7. Hamilton, H. H. II: Approximate Method of Predicting Heating onthe Windward Side of Space Shuttle Orbiter and Comparisons toFlight Data. AIAA Paper 82-0823, June 1982.
8. Pitts, W. C.: Flight Measurements of Tile Gap Heating on theSpace Shuttle. AlAA Paper 82-0840, June 1982.
9. Stewart, O. A.; and Rak lch , J. V.: Catalytic Surface EffectsExperiment on Space Shuttle. AIAA Paper 81-1143, June 1981.
10. Compton, H. R.; Findlay, J. T.; Kelly, G. M.; and Heck, M.l.:Shuttle (STS-1) Entry Trajectory Reconstruction. AIAA Paper81-2459, November 1981.
11. Price, J. M.; and Blanchard, R. c.: Determination of AtmosphericProperties for STS-l Aerothermodyn~nic Investigations. AIAAPaper 81-2430, November 1981.
12. Shinn, J. l.; Moss, J. N.; and Simmonds, A. l.: Viscous ShockLayer Heating Analysis for the Shuttle Windward Plane withSurface Finite Catalytic Recombination Rates. AIAA Paper82-0842, June 1982.
13. Rakich, J. V.; and Stewart, D. A.: Results of a FlightExperiment on the. Catalytic Efficiency of the Space ShuttleHeat Shield. AIAA Paper B2~0944, June 1982.
David A. Throckmorton, H. Harris Hamilton II,and E. Vincent Zoby
~------------------------------i 10. Work Unit No.9. Performing Organization Name and Address
NASA Langley Research CenterHampton, VA 23365
11. Contract or Grant No.
13. Type of Report and Period Covered
12. Sponsoring Agency Name and Address
National Aeronautics and Space AdministrationWashington, DC 20546
Technical Memorandum14. Sponsoring Agency Code
15. Supplementary Notes
16. Abstract
A preliminary analysis of heat-transfer data on the Space Shuttle Orbiterwindward centerline for the STS-3 mission entry is presented. The paperincludes temperature-time history plots for each measurement location, andtabulated wall-temperature and convective heating-rate data at 21 selectedtrajectory points. The 5T5-3 flight data are also compared with thepredictions of two approximate methods for computing convective heat-transferrates in equilibrium air. The paper is intended to provide the technicalconmunity with early access to a wide range of orbiter heat-transfer data.
17. Key Words (Suggested by Author(s)) 18. Distribution Statement
Space ShuttleAerodynamic heatingAerothermodynamics
Unclassified - UnlimitedSubject Category 34
19. Security C1assif. (of this report}
Unclassified20. Security Classif. (of this page)
Unclassified21. No. of Pages
, 4822. Price
A03
N-30S For sale by the National Technical Information Service, Springfield. Virginia 22161