Nuclear Engineering and Design 238 (2008) 3080–3085
Contents lists available at ScienceDirect
Nuclear Engineering and Design
journa l homepage: www.e lsev ier .com/ locate /nucengdes
Flow visualization in a pebble bed reactor experiment using PIV and refractiveindex matching techniques
Yassin A. Hassan ∗, E.E. Dominguez-OntiverosDepartment of Nuclear Engineering, Texas A&M University, College Station, TX, USA
a r t i c l e i n f o
Article history:Received 28 March 2007Received in revised form 11 January 2008Accepted 11 January 2008
a b s t r a c t
In the advanced gas-cooled pebble bed reactors for nuclear power generation, the fuel is spherical coatedparticles. The energy transfer phenomenon requires detailed understanding of the flow and temperaturefields around the spherical fuel pebbles. Detailed information of the complex flow structure within the bedis needed. Generally, for computing the flow through a packed bed reactor or column, the porous mediaapproach is usually used with lumped parameters for hydrodynamic calculations and heat transfer. Whilethis approach can be reasonable for calculating integral flow quantities, it may not provide all the detailedinformation of the heat transfer and complex flow structure within the bed. The present experimental
study presents the full velocity field using particle image velocimetry technique (PIV) in a conjunction withmatched refractive index fluid with the pebbles to achieve optical access. Velocity field measurements
the c
1
tinreaicfdeantf
dflses
cAaUrpflwdetic
ptbcui
0d
are presented delineating
. Introduction
The Generation IV International Forum findings relative tohe future nuclear systems (sustainability, security and reliabil-ty, economy, non-proliferation and physical protection) have givenew impetus to graphite-moderated high-temperature gas-cooledeactors (HTGRs). The high modular HTGR concept exhibits inher-nt safety features due to the low power density and the largemount of graphite present in the core which gives a large thermalnertia in the event of accidents as loss of coolant. These passiveoncepts were first introduced in German HTR-Module (pebbleuel) design (Lohnert, 1990; Lohnert and Reutler, 1983). The fuelesign of fissile kernels coated with carbon and silicon carbide lay-rs mixed with graphite is suitable for reaching very high burnupnd ensures a full confinement of volatile fission products duringormal and abnormal situations. Other characteristics of HTGR arehe capability of providing high temperature heat and suitabilityor various power conversion cycles.
In pebble bed reactor cores, the gas flows around randomlyistributed spheres. The understanding of such complex unsteady
ows is important. This requires a variety of analysis techniques andimulation tools. These range from simple one-dimensional mod-ls (Rousseau and Greyvenstein, 2002) that do not capture all theignificant physical phenomena to large-scale three-dimensional
omputational fluid dynamics (CFD) codes (Van Staden et al., 2002).huge number of grids is needed to resolve the flow structure
round the spheres that require huge CPU time and memory.nfortunately, there are only few studies (Calis et al., 2001) which
epresent a similar flow around randomly distributed spheres as inebble bed modular reactors (PBMRs) under high Reynolds numberow conditions. Furthermore, most of the turbulence models thatere used for these simulations are eddy viscosity models whichoes not resolve the flow field appropriately where curved flowsxist. There is a scarce of the experimental velocity data for valida-ions of these models. The aim of the present experimental studys to provide some data for code validation and to investigate theomplex of the flow structure.
A typical packed bed is a column where a fluid is flowing throughacked grain-like material. One important and particular applica-ion involves energy transfer as in the advanced gas-cooled pebbleed reactors for nuclear power generation. In this case, a “fuelompact” is in the form of spherical coated particles. A partic-lar approach to obtain flow velocity fields of interstitial space
n a packed bed configuration is the use of the particle trackingelocimetry (PTV) technique (Hassan et al., 1992). One of the diffi-ulties using this method when used in porous media is the need forptical access of the medium. In order to overcome this complexity,he solid particles used as packing material and the fluid flowing
hrough the column can be chosen in such a way that their refrac-ive indices are matched. In such way, the optical access required forTV technique can be achieved. Other optical measuring techniquesncluding qualitative flow visualization, point measurements such
Y.A. Hassan, E.E. Dominguez-Ontiveros / Nuclear Engineering and Design 238 (2008) 3080–3085 3081
; (c) p
ava
2
(fscslNaaf(as
mv(iPls(iwAtopwsftTnth
ltmsoT
3
Puflt
twupss0fiwature was monitored using a type-k thermocouple installed insidethe loop’s reservoir tank. The flow was allowed to flow for at least30 min before the image acquisition started. Various flow rates wereinvestigated, the calculated Re range between 50 and 550 based on
s laser Doppler velocimetry (LDV). However, this technique pro-ides one point measurement and not a full field measurement suchs particle image velocimetry (PIV).
. Refractive index matching
Several other studies have used matching of refractive indexMRI) approach to achieve optical accessibility. There are manyactors that influence the decision of which materials to useuch as toxicity, flammability, reactivity, viscosity, density andost. Hendriks and Aviram (1982) used an aqueous zinc iodideolution to match the refractive index (RI) of polymethyl methacry-ate (PMMA), RI = 1.4873, Dybbs and Edwards (1984) along withorthrup et al. (1991) used mixtures of silicone oils, while, Chennd Fan (1992) used an aqueous sodium iodide solution. Narrow etl. (2000) developed an equation to predict the RI of the solution asunction of temperature, concentration and wavelength. Haam et al.2000) used p-cymene to match PMMA particles for laser-Dopplernemometry. Recently, Daviero et al. (2001) used a sodium chlorideolution for refractive index matching.
After reviewing the literature several promising liquids thateet the criteria of acceptable toxicity, flammability, reactivity,
iscosity, density and price are selected. p-Cymene (1.49), ethyl1.36) and benzyl (1.54) alcohol mixture, and an aqueous sodiumodide solution (1.49 at ∼60% concentration) that matched withMMA (1.4873). The isopropyl alcohol (1.38) and methylnaphtha-ene (1.615) mixture and diethylphthalate (1.51) were matched withoda-lime glass (1.504). Additionally, a sample of fluoropolymerFEP) was tested in water to determine the matching refractivendex quality. PMMA beads, soda-lime glass beads and (FEP) tubes
ere immersed in their respective RI matching fluids. Using anbbe refractometer and visual inspection it was determined that
he best match was accomplished using a 60% volume aque-us sodium iodide solution as shown in Fig. 1. However, smallarticles were found in the solution that could cause problemsith particle imaging techniques. For this reason p-cymene was
elected. p-Cymene does react with the PMMA and should care-ully be monitored if it is used. The alcohol solutions also proved
o be prohibitively corrosive with the PMMA and soda-lime glass.he matching of the diethylphthalate to the soda-lime glass wasot close enough to be effective in reducing the light refrac-ion. The matching between the water and FEP was reasonable;owever, the transparency of FEP was poor. Table 1 shows a
TKSSF
-cymene; (d) RI matched sodium iodide solution.
ist of solid materials commonly used in experimental facili-ies where optical transparency is needed. These solids can be
atched with a compatible liquid in Table 2. Additional informationuch as dynamic viscosity, density, reactivity, hazard level amongther parameters of importance for each liquid are presented inable 2.
. Experimental setup
A vertical column (3 cm × 3 cm × 35 cm) was constructed out ofMMA and randomly packed with 4.7-mm PMMA beads. The col-mn was connected to a closed loop with a reservoir and pump. Theow was controlled by means of a flow valve in the loop betweenhe pump and the column.
A flow meter (McMillan 100 series) was connected to the loopo measure the flow rate. The flow loop and reservoir were filledith p-cymene and pumped through the loop. The PTV systemsed a laser as an illumination source. The laser sheet impingederpendicular to the column’s axial plane. A high-resolution/high-peed camera (4700 fps) was placed perpendicular to the laserheet plane. The camera had an equivalent viewing area of about.6 cm × 0.5 cm. This configuration allowed us to measure velocityelds in the X–Y plane with reasonable time resolution. The flowas kept constant during the data acquisition process and temper-
eflon AF 1.29–1.31 Present8 glass 1.51 Pokusaev et al. (2004)tyrene–divinyl-benzene 1.5903 Cui and Adrian (1997)ilica gel 1.452 Cui and Adrian (1997)used quartz 1.4584
3082Y.A
.Hassan,E.E.D
ominguez-O
ntiveros/N
uclearEngineering
andD
esign238
(2008)3080–3085
Table 2Matching refractive index of fluids and their properties
Fluid Refractive Index CAS # Hazard Fire Reactivity Density(g/cm3)
All presented levels in the table are ranked in a 0–5 scale being 0 the lowest level.
Y.A. Hassan, E.E. Dominguez-Ontiveros / Nuclear Engineering and Design 238 (2008) 3080–3085 3083
p
R
wtirt
4
f
Fa
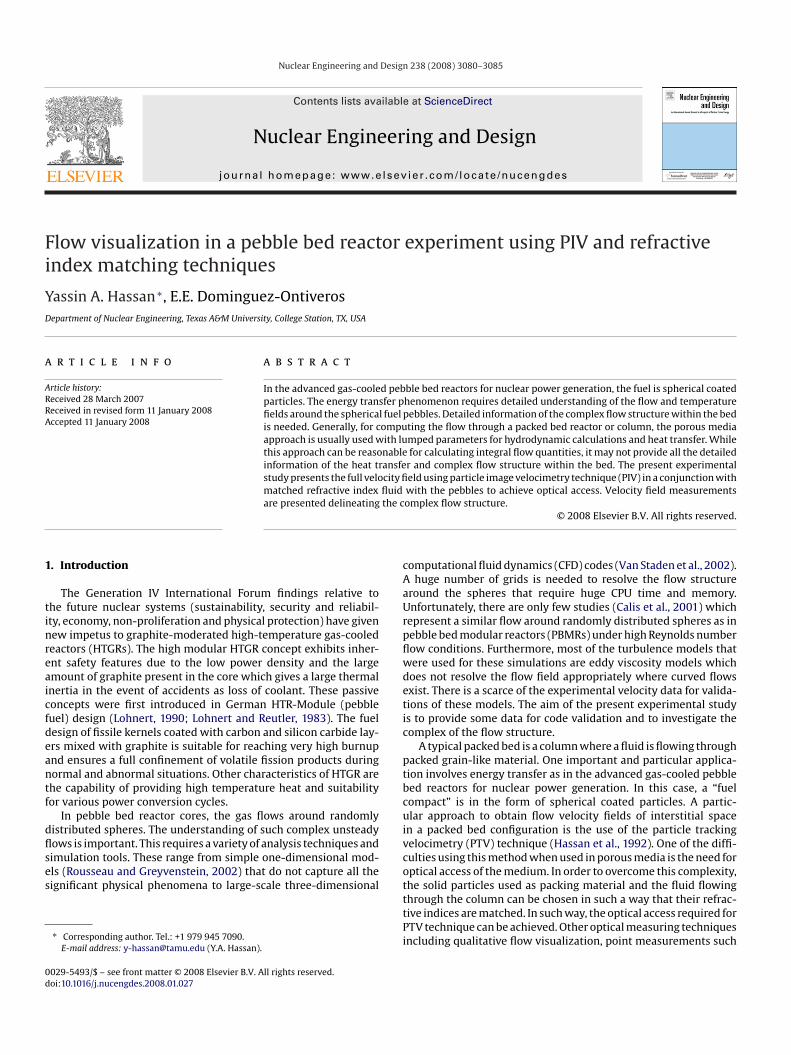
Fig. 2. The experimental facility.
article diameter using the following equation:
ep = DpVs�
(1 − s)�(1)
here Dp is the particle diameter, Vs is the superficial velocity, � ishe density of the fluid (853 kg/m3), � is the porosity (0.31), and �s the dynamic viscosity of the fluid (1.195E−3 Pa-s). Several flowates and different pebble sizes are being investigated. Fig. 2 showshe setup of the experimental facility.
. Experimental results
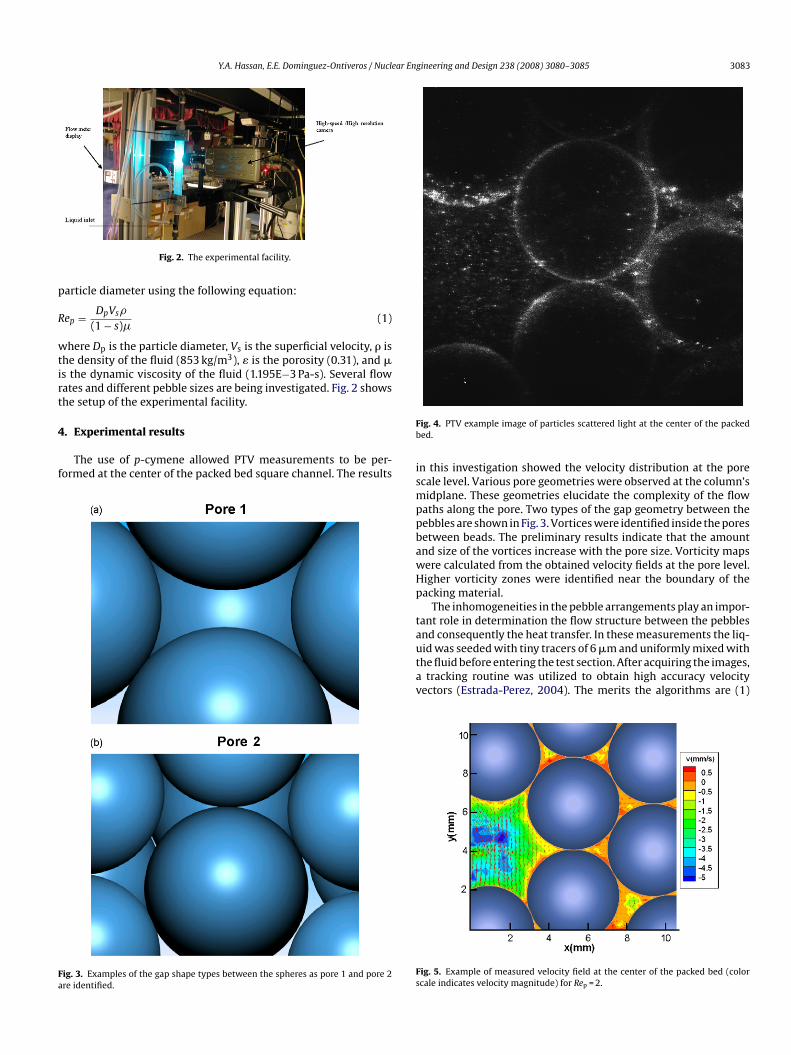
The use of p-cymene allowed PTV measurements to be per-ormed at the center of the packed bed square channel. The results
ig. 3. Examples of the gap shape types between the spheres as pore 1 and pore 2re identified.
Fb
ismppbawHp
tautav
Fs
ig. 4. PTV example image of particles scattered light at the center of the packeded.
n this investigation showed the velocity distribution at the porecale level. Various pore geometries were observed at the column’sidplane. These geometries elucidate the complexity of the flow
aths along the pore. Two types of the gap geometry between theebbles are shown in Fig. 3. Vortices were identified inside the poresetween beads. The preliminary results indicate that the amountnd size of the vortices increase with the pore size. Vorticity mapsere calculated from the obtained velocity fields at the pore level.igher vorticity zones were identified near the boundary of theacking material.
The inhomogeneities in the pebble arrangements play an impor-ant role in determination the flow structure between the pebblesnd consequently the heat transfer. In these measurements the liq-
id was seeded with tiny tracers of 6 �m and uniformly mixed withhe fluid before entering the test section. After acquiring the images,
tracking routine was utilized to obtain high accuracy velocityectors (Estrada-Perez, 2004). The merits the algorithms are (1)
ig. 5. Example of measured velocity field at the center of the packed bed (colorcale indicates velocity magnitude) for Rep = 2.
3084 Y.A. Hassan, E.E. Dominguez-Ontiveros / Nuclear En
Paptcaoue
rp
osv
tfvsa
psidpcticcm
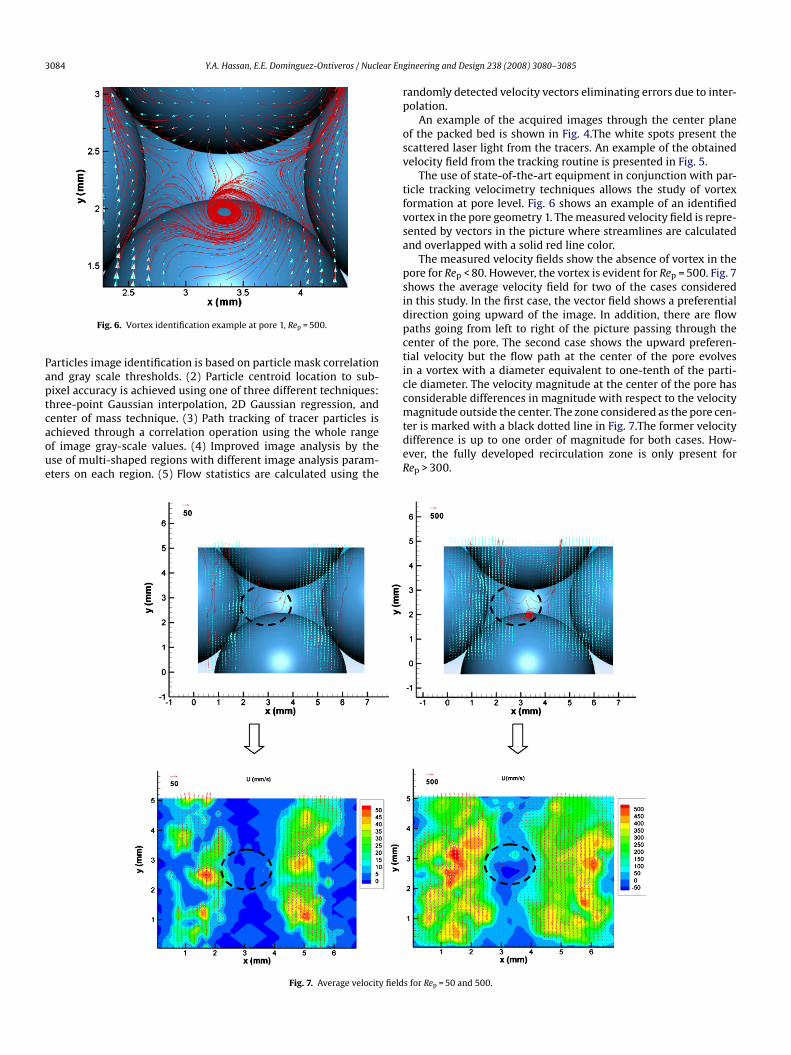
Fig. 6. Vortex identification example at pore 1, Rep = 500.
articles image identification is based on particle mask correlationnd gray scale thresholds. (2) Particle centroid location to sub-ixel accuracy is achieved using one of three different techniques:hree-point Gaussian interpolation, 2D Gaussian regression, and
enter of mass technique. (3) Path tracking of tracer particles ischieved through a correlation operation using the whole rangef image gray-scale values. (4) Improved image analysis by these of multi-shaped regions with different image analysis param-ters on each region. (5) Flow statistics are calculated using the
tdeR
Fig. 7. Average velocity field
gineering and Design 238 (2008) 3080–3085
andomly detected velocity vectors eliminating errors due to inter-olation.
An example of the acquired images through the center planef the packed bed is shown in Fig. 4.The white spots present thecattered laser light from the tracers. An example of the obtainedelocity field from the tracking routine is presented in Fig. 5.
The use of state-of-the-art equipment in conjunction with par-icle tracking velocimetry techniques allows the study of vortexormation at pore level. Fig. 6 shows an example of an identifiedortex in the pore geometry 1. The measured velocity field is repre-ented by vectors in the picture where streamlines are calculatednd overlapped with a solid red line color.
The measured velocity fields show the absence of vortex in theore for Rep < 80. However, the vortex is evident for Rep = 500. Fig. 7hows the average velocity field for two of the cases consideredn this study. In the first case, the vector field shows a preferentialirection going upward of the image. In addition, there are flowaths going from left to right of the picture passing through theenter of the pore. The second case shows the upward preferen-ial velocity but the flow path at the center of the pore evolvesn a vortex with a diameter equivalent to one-tenth of the parti-le diameter. The velocity magnitude at the center of the pore hasonsiderable differences in magnitude with respect to the velocityagnitude outside the center. The zone considered as the pore cen-
er is marked with a black dotted line in Fig. 7.The former velocityifference is up to one order of magnitude for both cases. How-ver, the fully developed recirculation zone is only present forep > 300.
s for Rep = 50 and 500.
ar En
5
psaivarubv
R
B
C
CC
C
D
D
E
H
H
H
L
L
N
N
N
P
R
S
Y.A. Hassan, E.E. Dominguez-Ontiveros / Nucle
. Conclusions
An experimental investigation was performed to study the com-lex structure through the voids of packed bed. Most of the previoustudies were restricted to understand the global parameters suchs pressure drop, drag force exerted on particles and overall poros-ty of the bed. Detailed qualitative and quantitative information ofelocity fields were obtained using particle tracking velocimetrynd matched refractive index fluid. The velocity distribution in aandomly packed bed was obtained. The obtained data would beseful for enhancing our understanding of flow through packeded and to be utilized in the computational fluid dynamic codealidation.
eferences
udwig, R., 1994. Refractive index matching methods for liquid flow investigations.Experiments in Fluids (17), 350–355.
alis, H.P.A., Nijenhuis, J., Paikert, B.C., Dautzenberg, F.M., Van Den Bleek, C.M., 2001.CFD modeling and experimental validation of pressure drop and flow profile ina novel structured catalytic reactor packing. Chemical Engineering Science 56,1713–1720.
argille-Sacher Laboratories Inc., 2005. http://www.cargille.com.hen, R.C., Fan, L.-S., 1992. Particle image velocimetry for characterizing the flow
structure in three-dimensional gas–liquid–solid fluidized beds. Chemical Engi-neering Science 47 (13/14), 3615–3622.
ui, M.M., Adrian, R.J., 1997. Refractive index matching and marking methodsfor highly concentrated solid–liquid flows. Experiments in Fluids (22), 261–264.
aviero, G.J., Roberts, P.J.W., Maile, K., 2001. Refractive index matching in large-scalestratified experiments. Experiments in Fluids 31, 119–126.
ybbs, A., Edwards, R.V., 1984. An index matched flow system for measurement offlow in complex geometries. In: Proceedings of the International Symposiumon the Application of Anemometry to Fluid Mechanics, Lisbon, Portugal, pp.171–184.
V
W
gineering and Design 238 (2008) 3080–3085 3085
strada-Perez, C., 2004. Improved particle tracking algorithm (PTV) using mask crosscorrelation technique. M.S. Thesis. Texas A&M University.
aam, S.J., Brodkey, R.S., Fort, I., Klaboch, L., Placnik, M., Vanecek, V., 2000. LaserDoppler anemometry measurements in an index of refraction matched columnin the presence of dispersed beads part I. International Journal of MultiphaseFlow 26, 1401–1418.
assan, Y.A., Blanchat, T.K., Seeley Jr., C.H., Canaan, R.E., 1992. Simultaneous velocitymeasurements of both components of a two-phase flow using particle imagevelocimetry. International Journal of Multiphase Flow 18, 371–395.
endriks, F., Aviram, A., 1982. Use of zinc iodide solutions in flow research. Reviewof Scientific Instruments 53 (1).
ohnert, G., 1990. Technical design features and essential safety-related propertiesof the HTR-module. Nuclear Engineering and Design 121 (2), 259–275.
ohnert, G., Reutler, H., 1983. The modular HTR-a new design of high temperaturepebble bed reactor. Nuclear Energy-Journal of the British Nuclear Energy Society22 (June (3)), 197.
arrow, T.L., Yoda, M., Abdel-Khalik, S.I., 2000. A simple model for the refractiveindex of sodium iodide aqueous solutions. Experiments in Fluids 28, 282–283.
guyen, T.T., Biadillah, Y., Mongrain, R., Brunette, J., Tardif, J.C., Bertrand, O.F., 2004. Amethod for match the refractive index and kinematic viscosity of a blood analogfor flow visualization in hydraulic cardiovascular models. Journal of BiomedicalEngineering (126), 529–535.
okusaev, B.G., Karlov, S.P., Shreiber, I., 2004. Immersion tomography of a gas–liquidmedium in a granular bed. Theoretical Foundations of Chemical Engineering 39,1–5.
ousseau, P.G., Greyvenstein, G.P., 2002. One-dimensional reactor model for the inte-grated simulation of the PBMR power plant. In: Meyer, J.P. (Ed.), Proceedings of1st International Conference on Heat Transfer Fluid Mechanics and Thermody-namics. Kruger Park, South Africa.
tohr, M., Roth, K., Jahne, B., 2003. Measurement of 3D pore-scale flow in index-matched porous media. Experiments in Fluids (35), 159–166.
an Staden, M.P., Janse Van Rensburg, C., Viljoen, C.F., 2002. CFD simulation of heliumgas cooled pebble bed reactor. In: Meyer, J.P. (Ed.), Proceedings of 1st Inter-national Conference on Heat Transfer Fluid Mechanics and Thermodynamics.Kruger Park, South Africa.
edd M.W., 2003.“Determination of PSD using laser diffraction”. http://www.erpt.org/032Q/Wedd-00.html.