CONFIDENTIAL TerraTherm, Inc., 2010, All Rights Reserved. Numerical Calculations of Heating Solvents Recovery Services of New England (SRSNE) Southington, Connecticut Prepared for: SRSNE Site Group April 2010 Prepared by: 28900 Indian Point Keene, CA 93531 661-823-1620 TerraTherm is an exclusive licensee/owner of (a) U.S. Patent Nos. 4,984,594; 5,076,727; 5,114,497; 5,190,405; 5,221,827; 5,229,583; 5,244,310; 5,271,693; 5,318,116; 5,553,189; 5,656,239; 5,660,500; 5,997,214; 6,102,622; 6,419,423; 6,485,232; 6,543,539; 6,632,047; 6,824,328; 6,854,929; 6,881,009; 6,951,436; 6,962,466; and 7,004,678, (b) U.S. Patent Publication 2004-0228690, and (c) certain non-U.S. counterpart applications/patents of the above-referenced patents and application. Copyright 2010. The information and technology set forth herein are proprietary to The University of Texas at Austin and/or TerraTherm, Inc. All rights reserved.
Transcript
CONFIDENTIAL
TerraTherm, Inc., 2010, All Rights Reserved.
Numerical Calculations of Heating Solvents Recovery Services of New England
(SRSNE) Southington, Connecticut
Prepared for:
SRSNE Site Group
April 2010
Prepared by:
28900 Indian Point Keene, CA 93531
661-823-1620 TerraTherm is an exclusive licensee/owner of (a) U.S. Patent Nos. 4,984,594; 5,076,727; 5,114,497; 5,190,405; 5,221,827; 5,229,583; 5,244,310; 5,271,693; 5,318,116; 5,553,189; 5,656,239; 5,660,500; 5,997,214; 6,102,622; 6,419,423; 6,485,232; 6,543,539; 6,632,047; 6,824,328; 6,854,929; 6,881,009; 6,951,436; 6,962,466; and 7,004,678, (b) U.S. Patent Publication 2004-0228690, and (c) certain non-U.S. counterpart applications/patents of the above-referenced patents and application. Copyright 2010. The information and technology set forth herein are proprietary to The University of Texas at Austin and/or TerraTherm, Inc. All rights reserved.
Numerical Calculations of Heating Solvents Recovery Services of New England March 2010 Page i
CONFIDENTIAL
TerraTherm, Inc., 2010, All Rights Reserved.
TABLE OF CONTENTS
1.0 Introduction ............................................................................................................................ 1 2.0 Model Setup ........................................................................................................................... 2
2.1 Description of Calculations ........................................................................................... 2 3.0 Site-Specific Calculations Set Up .......................................................................................... 9
3.1 Treatment Area and Volume ........................................................................................ 9 3.2 Calculations Layers .................................................................................................... 10
4.0 Results – base case ............................................................................................................. 15 4.1 Heating of Each Segment .......................................................................................... 15 4.2 Heating of Entire Site ................................................................................................. 18 4.3 Basic System Design Parameters .............................................................................. 20
4.3.1 Process Equipment ................................................................................................ 20 4.3.2 Energy Demand ..................................................................................................... 20
5.0 Sensitivity Analysis .............................................................................................................. 22 5.1 Base Case Scenario................................................................................................... 22 5.2 Heater Spacing Versus Duration ................................................................................ 23 5.3 Vapor Cap Insulation .................................................................................................. 24 5.4 Horizontal and Vertical Groundwater Flux .................................................................. 26 5.5 Heater Boosting.......................................................................................................... 29
Numerical Calculations of Heating Solvents Recovery Servicse of New England April 2010 Page 1 of 34
CONFIDENTIAL
TerraTherm, Inc., 2010, All Rights Reserved.
1.0 INTRODUCTION
The purpose of the water and energy balance calculations is to investigate the importance of groundwater flux, heater spacing, power input, heater boosting, and thickness of vapor cover for the temperatures that can be achieved in-situ. Calculation output includes sizing parameters for the thermal treatment system.
A water and energy balance has been developed by TerraTherm to estimate the addition, removal, and loss of energy in each layer of the site separately, with the layers exchanging both fluids (water, steam, air) and energy along their boundaries. The calculations also estimate crucial heat losses along the top, sides, and bottom of the treatment zone, and the impact of groundwater flow into the treatment area, such that relatively accurate total energy demands are derived.
These water and energy balance calculations are referred to in the following sections as the “calculations.”
The result of the calculations will be used to select the heating approach and for sizing of the off-gas treatment system.
In the following sections the basic calculation setup is described along with the results of the conducted water and energy balance calculations.
Numerical Calculations of Heating Solvents Recovery Servicse of New England April 2010 Page 2 of 34
CONFIDENTIAL
TerraTherm, Inc., 2010, All Rights Reserved.
2.0 MODEL SETUP
2.1 Description of Calculations
The calculations are based on simplified mass and energy balance principles relevant for ISTD operation. The calculations can include up to 9 layers, each with different input and derived parameters, including: Surface area of the treatment zone
Depth of each calculation layer
Area of perimeter of each calculation layer
Porosity of each calculation layer
Initial water saturation in each calculation layer
Initial bulk density for each calculation layer
Initial heat capacity for each calculation layer
Initial thermal conductivity for each calculation layer
During the calculations, parameters such as thermal conductivity and heat capacity are changed automatically based on the water saturation of each layer, This means, for instance, that as a zone is drying out due to boiling and steam removal, the water saturation is reduced, and therefore both the heat capacity and thermal conductivity are reduced, such that only the remaining water contributes to these parameters. This gives a more realistic heating prediction than if constant values are assumed.
Numerical Calculations of Heating Solvents Recovery Servicse of New England April 2010 Page 3 of 34
CONFIDENTIAL
TerraTherm, Inc., 2010, All Rights Reserved.
Figure 2.1 shows a schematic cross-section of the calculation setup for the SRSNE Site.
ft bgs
10
Targ
et Treatm
en
t Zo
ne
2
9
14
17
22
28
Vapor cap
Fill (sand + gravel)
Outwash (unsaturated)
Outwash (saturated)
Till, (saturated)
Bedrock, broken
Bedrock
Figure 2.1. Schematic Cross-Section of the Calculations Setup for the SRSNE Site.
2.1.1.1 Water Mass Balance Methods
For each layer, the water mass balance is calculated as follows: Mnet extraction = Mout, liquid + Mout,vapor
Where M denotes cumulative water masses. Note that no fluids are injected when using the ISTD technology.
Numerical Calculations of Heating Solvents Recovery Servicse of New England April 2010 Page 4 of 34
CONFIDENTIAL
TerraTherm, Inc., 2010, All Rights Reserved.
The mass removal in the liquid form is a simple summation of flow rate measurements: Mout, liquid = Σ (mliquid x ∆t) Where the values for the flow rate mliquid is determined manually for each operational phase. For this site, small amounts of entrained liquids are expected in the vapor extraction system. No pumping wells are included in the design. Influx of groundwater in the calculations are based on numbers from the site-specific groundwater model provided by ARCADIS and as used in the Heat Dissipation Model /Ref. 1/. The water mass removal in the form of vapor (steam, water vapor) is calculated as follows: Mout,vapor = Σ (msteam x ∆t) = Σ (mtotal vapor – mnon-cond ) x ∆t Where msteam is the vapor flow rate made up of steam, mtotal vapor is the total incoming vapor flow rate, and mnon-cond is the vapor flow rate minus the steam component (air mostly). For these calculations, the steam extraction rates are calculated based on the energy injected by the ISTD system. The equation calculating the ratio between injected energy and extracted steam is derived based on observations made on several recent full-scale ISTD projects. Figure 2.2 illustrates the streams that take part in the water mass balance in the Heated Zone (HZ).
HZ mperimmperim
mbtm
msteammliq
Figure 2.2. Mass Balance Principles for Water (One Layer Shown for Simplicity).
Total water extraction rates are estimated by the sum of the measured flows: mextraction = mliquid + msteam
Numerical Calculations of Heating Solvents Recovery Servicse of New England April 2010 Page 5 of 34
CONFIDENTIAL
TerraTherm, Inc., 2010, All Rights Reserved.
The calculations keep track of the volume or mass of water stored in each layer, based on extracted water and estimates for the influx of water from the sides, bottom, and top by infiltration (the perimeter and bottom arrows shown on Figure 2.2). Mpresent, t1 = Mpresent, t0 - Mliquid – Msteam + Mbottom +Mperimeter
Where M denotes cumulative water masses. The quantity of water removed from the subsurface is readily measured during operations. Therefore, this quantity can be compared to a relatively accurate estimate of the pre-treatment quantity of water within each layer in the vadose zone, based on values of porosity and saturation for the different zones below the vapor cap and to the water table. Water entering the model domain in the saturated zone and not extracted as steam will leave the site on the down gradient edge of the Heated Zone. The energy carried away by the heated water is included in the calculations. For the SRSNE-Site it will be assumed that the surface cover is intact and graded to promote runoff to minimize any standing surface water thus reducing the potential for infiltration from the top through the vapor cover. 2.1.1.2 Energy Balance Estimation Methods
Cumulative energy (E) is calculated as a summation of enthalpy fluxes (Q): E = Σ (Q x ∆t) An estimated energy balance is maintained for each layer in the calculations based on energy delivered by the ISTD-heaters, energy extracted in the vapor and liquid streams and heat loss to the areas outside of the Heated Zone (HZ). Ein = Eout + Estorage + Eloss
The energy fluxes are related for each time step as follows: Qin = Qout + Qstorage + Qloss
Where Q denotes enthalpy flux (in BTU/hr). Figure 2.3 shows the schematic energy balance for one layer.
Numerical Calculations of Heating Solvents Recovery Servicse of New England April 2010 Page 6 of 34
CONFIDENTIAL
TerraTherm, Inc., 2010, All Rights Reserved.
HZ QperimQperim
Qbtm
QsteamQairQliqQin Qcap
Figure 2.3. Energy Balance Schematic (One Layer Shown for Simplicity).
The estimate for Qin will be based on ISTD energy input. The need for boosting heaters is addressed in the basic calculations layout. By boosting the heaters it will be possible to deliver more energy in layers difficult to heat. The total energy removal from each layer is estimated as follows: Qout = Qliq + Qnon cond. gas + Qsteam out
The energy flux in the extracted liquid is given by: Qliq = mliquid x cp, water x (T – T0) Where cp is heat capacity, and T0 is the ambient temperature. For the extracted vapor stream, the energy flux in vapor and steam is estimated as follows: Qnon cond. gas = mair x cp, air x (T – T0) Qsteam out = mcondensate x ∆Hsteam-ambient
Where m is mass flux, H is specific enthalpy (in BTU/lb), cp is heat capacity (in BTU/lb/F), and T is temperature. The enthalpy of the steam can be estimated from steam tables.
Numerical Calculations of Heating Solvents Recovery Servicse of New England April 2010 Page 7 of 34
CONFIDENTIAL
TerraTherm, Inc., 2010, All Rights Reserved.
The actual heat loss cannot be calculated using accurate measures. An estimate can be made based on thermal profiles at the bottom and top of each layer, and along the perimeter, using the following equation: Qheat loss = A x KT x dT/dz Where A is the surface area through which energy is conducted, KT is the thermal conductivity of the subsurface material, and dT/dz is the temperature gradient across the surface also expressed as (T1-T2)/(z1-z2). For the loss through the vapor cap, the temperature difference between the top and bottom of the layer can be used to calculate the gradient. For the calculations, it is assumed that the top of the vapor cap remains near ambient temperatures due to a combination of wind cooling, ventilation, and simple heat radiation. The area of the heated zone may be estimated based on the zone designated HZ, which is slightly larger than the footprint of the wells due to the heat migration outside. Heat loss through the bottom and sides are accounted for in a similar manner. The layers exchange energy by thermal conduction such that energy leaves the warmer layer and enters the cooler layer. All heat migration through the sides and through the vapor cap and the bottom layer are considered lost from the calculation domain. Heat migration from the bottom of a layer and into the top of the underlying layer remains as energy in the calculations if both layers are in the heated zone.
Numerical Calculations of Heating Solvents Recovery Servicse of New England April 2010 Page 8 of 34
CONFIDENTIAL
TerraTherm, Inc., 2010, All Rights Reserved.
In the calculations average layer temperatures are calculated based on the energy balance and the estimated heat capacity of each layer. The stored energy is related to the heated zone heat capacity, and the average temperature as follows: Estorage = Cp x (Tavg - T0) + msteam x Hsteam-ambient
Where Cp,site is the overall heat capacity of the heated layer, estimated from the volume, saturation, and specific heat capacity of the soil and water: Cp = Vsoil x cp, soil x Vwater x cp, water
The steam energy stored as a vapor at any given time is relatively small, and will be neglected in the calculations. For comparison with the measured temperatures, the energy balance can be used to estimate the average temperature (Tenergybal) of the heated volume: Tenergybal = T0 + Estorage/Cp,site = T0 + (Ein - Eout - Eloss)/ Cp,site The steam energy stored as a vapor at any given time is relatively small, and will be neglected in the calculations.
Numerical Calculations of Heating Solvents Recovery Servicse of New England April 2010 Page 9 of 34
CONFIDENTIAL
TerraTherm, Inc., 2010, All Rights Reserved.
3.0 SITE-SPECIFIC CALCULATIONS SET UP 3.1 Treatment Area and Volume The thermal treatment area at SRSNE is divided into three regions (Area 1, Area 2 and Area 3) as shown in Figure 3.1. Area 1 represents the shallow western portion of the Target Treatment Zone (TTZ), Area 2 represents the intermediate middle portion of the TTZ, while Area 3 represents the deeper eastern portion of the TTZ. The treatment depth in the three areas is 12 feet, 15 feet and 21 feet respectively.
Area 1Treatment depth: 12 ft
Area 2Treatment depth: 15 ft
Area 2Treatment depth: 21 ft
Figure 3.1. Thermal Treatment Areas at SRSNE. For simplicity, the calculations have been set up based on average depths across the entire TTZ. This simplification is not considered to affect the calculation results significantly since the important parameters for the mass and energy balances is the area and volume of the heated zone. Table 3.1 presents the estimated thermal treatment area and volume.
Numerical Calculations of Heating Solvents Recovery Servicse of New England April 2010 Page 10 of 34
CONFIDENTIAL
TerraTherm, Inc., 2010, All Rights Reserved.
Table 3.1. Area and Volume of the Thermal Treatment Zone.
Location Treatment
Area Treatment
Depth Treatment
Volume [ft2] [ft] [cy] Area 1 6,855 12 3,047 Area 2 36,560 15 20,311 Area 3 30,780 21 23,940 Total 74,195 47,298
The average treatment depth is calculated to be 17 feet based on the areas and volumes shown in Table 3.1. 3.2 Calculations Layers In the calculations, the TTZ was divided into nine layers based on the predominant geological properties of the formation present at the site, water saturation and the contaminant distribution. Layers 2 through 6 in the model are all within the TTZ, while the remaining layers are outside of the TTZ. Layer 1 represents the surface cover, while layers 7-9 represent the bedrock underlying the thermal treatment zone. Layers 5-9 are all considered to be initially saturated in the calculations. The layers and general geology in the calculations are shown in Figure 3.2.
Numerical Calculations of Heating Solvents Recovery Servicse of New England April 2010 Page 11 of 34
CONFIDENTIAL
TerraTherm, Inc., 2010, All Rights Reserved.
ft bgs
10
Targ
et Treatm
en
t Zo
ne
2
9
14
17
22
28
Vapor cap
Fill (sand + gravel)
Outwash, upper (unsaturated)
Outwash, lower (unsaturated)
Outwash (saturated)
Till (saturated)
Bedrock – broken
Bedrock 1
Bedrock 2
Layer 1
Layer 2
Layer 3
Layer 4
Layer 5
Layer 6
Layer 7
Layer 8
Layer 9
5
25
Figure 3.2. Calculation Layers and Geology. 3.2.1 Input Parameters for Calculations Input values of porosity, initial saturation and ambient temperature for the model layers appear in Table 3.2. These values serve as the starting basis for the energy balance calculations conducted in the model.
Numerical Calculations of Heating Solvents Recovery Servicse of New England April 2010 Page 12 of 34
CONFIDENTIAL
TerraTherm, Inc., 2010, All Rights Reserved.
Table 3.2. Porosity, Initial Saturation and Ambient Temperature for Each Layer in the Treatment Zone.
Layer Geology Top Bottom Thickness PorosityInitial
Porosity and saturation throughout the various layers of the TTZ may vary within the individual layers. 3.2.2 Heat Capacity Table 3.3 provides a summary of the heat capacity in the modeled zones. Table 3.3. Volume and Heat Capacity.
Heat Capacity Number Unit Total volume, TTZ 47,298 cy Solids volume 34,311 cy Air volume 2,063 cy Water volume 10,924 cy Soil weight 152,786,000 lbs soil Water weight 18,396,000 lbs water Soil heat capacity 38,197,000 BTU/F Water heat capacity 18,396,000 BTU/F
Total heat capacity, TTZ 56,593,000 BTU/F While the soil within the TTZ comprises nearly nine times the weight of the water within the TTZ, the heat capacity of the water in the TTZ is nearly half of that of the soil. Thus, it is apparent that the heat capacity of the water in the TTZ and therefore the flux of water moving through the TTZ are critical considerations in the design of the thermal remediation system. 3.3 Duration
Numerical Calculations of Heating Solvents Recovery Servicse of New England April 2010 Page 13 of 34
CONFIDENTIAL
TerraTherm, Inc., 2010, All Rights Reserved.
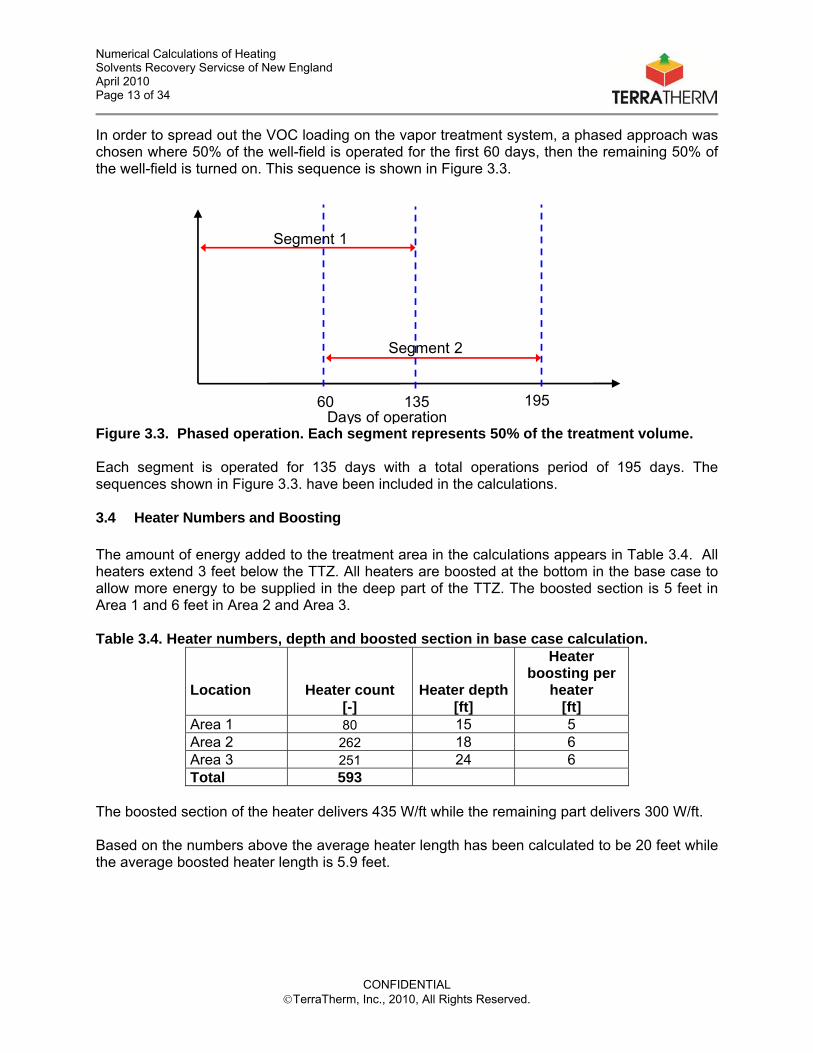
In order to spread out the VOC loading on the vapor treatment system, a phased approach was chosen where 50% of the well-field is operated for the first 60 days, then the remaining 50% of the well-field is turned on. This sequence is shown in Figure 3.3.
Days of operation60 135 195
Segment 1
Segment 2
Figure 3.3. Phased operation. Each segment represents 50% of the treatment volume. Each segment is operated for 135 days with a total operations period of 195 days. The sequences shown in Figure 3.3. have been included in the calculations. 3.4 Heater Numbers and Boosting The amount of energy added to the treatment area in the calculations appears in Table 3.4. All heaters extend 3 feet below the TTZ. All heaters are boosted at the bottom in the base case to allow more energy to be supplied in the deep part of the TTZ. The boosted section is 5 feet in Area 1 and 6 feet in Area 2 and Area 3. Table 3.4. Heater numbers, depth and boosted section in base case calculation.
Location Heater count Heater depth
Heater boosting per
heater [-] [ft] [ft] Area 1 80 15 5 Area 2 262 18 6 Area 3 251 24 6 Total 593
The boosted section of the heater delivers 435 W/ft while the remaining part delivers 300 W/ft. Based on the numbers above the average heater length has been calculated to be 20 feet while the average boosted heater length is 5.9 feet.
Numerical Calculations of Heating Solvents Recovery Servicse of New England April 2010 Page 14 of 34
CONFIDENTIAL
TerraTherm, Inc., 2010, All Rights Reserved.
3.5 Groundwater Influx For the base case, a water influx of 10 gpm was assumed. This value corresponds to the base case scenario in the Heat Dissipation Model described in /Ref. 1/. The water is assumed to flow only into the saturated part of the treatment zone (layer 5 and 6 in the model). The amount of water flowing into each layer is distributed based on the thickness of each of the two layers. In the base case 6.25 gpm is flowing into Layer 5 while 3.75 gpm is flowing into layer 6. Layer 7 only receives an inflow of groundwater corresponding to the amount of water extracted as steam from the layer.
Numerical Calculations of Heating Solvents Recovery Servicse of New England April 2010 Page 15 of 34
CONFIDENTIAL
TerraTherm, Inc., 2010, All Rights Reserved.
4.0 RESULTS – BASE CASE
This section presents the result of the base case scenario. Two calculations were conducted. The first calculation is performed on a single of the two segments to simulate the predicted average heat up of each layer in the TTZ as a function of time. The duration of the heating is 135 days in the calculation corresponding to the actual predicted operation time for each of the two segments. The second calculation is completed for the entire site with phased operation corresponding to a total duration of 195 days. The results from this calculation provide design numbers for the overall ISTD system design. In the base case the following input parameters are applied:
Heater spacing 15 feet, corresponding to a total of 593 heaters Heaters extend 3 feet into the bedrock Vapor cap thickness is 1 feet. Thermal conductivity for the cap is 0.15 W/m*K. 10 gpm horizontal influx of groundwater into the treatment area. No vertical influx. Heaters are boosted at the bottom. Boosted output is 435 W/ft compared to the regular
heater output at 300 W/ft. 4.1 Heating of Each Segment The heat-up and boiling of soil pore water occur simultaneously as the heat front moves away from the ISTD heater wells. The last regions to boil and achieve sufficient steam stripping and contaminant removal are the coolest locations within the TTZ, which typically correspond to the mid-points between the ISTD wells, termed “centroid” locations. Figure 4.1 shows the predicted average temperature in each segment as a function of time.
Numerical Calculations of Heating Solvents Recovery Servicse of New England April 2010 Page 16 of 34
Figure 4.1. Average Temperature Curves for Layer 2 to Layer 8 for a Segment. (Note: Layer 7 and 8 are both outside the TTZ) The results of the calculations indicate that the entire TTZ (layers 2 through 6) reaches average temperatures between 120°C and 160°C during the 135 day treatment period. The temperature reflects that the areas close to the heaters may reach temperatures above the boiling point due to drying-out. The upper part of the TTZ (layer 2) and the lower part (layers 5 and 6) have the lowest average temperatures (approximately 120 to 135°C) and are the last to achieve target temperature. This is due to the higher heat loss at the upper and lower boundary of the layer compared with the remainder of the treatment zone and for layers 5 and 6 due to cooling from the groundwater flowing into the treatment area. However, the simulation results indicate that these areas will achieve the target treatment temperature after approximately 85-90 days of operation. The calculations indicate a maximum average temperature in layers 3 and 4 (unsaturated outwash) of up to 160°C. Figure 4.2 depicts the temperature profiles at 25-day increments during operation including the final temperature at day 135 of operation, using the average temperature for each layer. Figure 4.3 shows the same plot, but with temperatures corrected for the local boiling points, which represents the temperatures achieved at the centroid locations.
Numerical Calculations of Heating Solvents Recovery Servicse of New England April 2010 Page 17 of 34
CONFIDENTIAL
TerraTherm, Inc., 2010, All Rights Reserved.
0
5
10
15
20
25
0 20 40 60 80 100 120 140 160 180
Temperature (C)D
epth
(ft
bg
s)
25 days
50 days
75 days
100 days
125 days
135 days
Figure 4.2. Average Temperature Profiles for a Segment.
0
5
10
15
20
25
0 20 40 60 80 100 120
Temperature (C)
De
pth
(ft b
gs) 25 days
50 days
75 days
100 days
125 days
135 days
17 ft bgs - bottom of TTZ
Figure 4.3. Average Temperature Profiles at Coolest Locations (Centroids) for a Segment.
Numerical Calculations of Heating Solvents Recovery Servicse of New England April 2010 Page 18 of 34
CONFIDENTIAL
TerraTherm, Inc., 2010, All Rights Reserved.
Note that the heating progresses fastest in unsaturated zone from 2 to 9 ft bgs (the unsaturated outwash). Figure 4.4 shows the calculated saturations for each layer during the thermal operations.
Figure 4.4. Average Saturation for a Segment. Note that all zones below the water table stay relatively wet since inflowing groundwater will re-saturate zones where a substantial amount of steam is produced and removed. The unsaturated zone (layers 2 through 4) is predicted to reach low saturations during the thermal treatment due to the water removed a steam without substantial recharge by inflowing water. 4.2 Heating of Entire Site The following sections show average temperatures and saturations for the entire site, taking into account that the two segments do not operate simultaneously during operation. These numbers are not important with respect to the remedy in each segment but indicate what average treatment temperatures to expect during the 195 days operation period. Figure 4.5 shows the predicted average temperature for the entire site as a function of time.
Numerical Calculations of Heating Solvents Recovery Servicse of New England April 2010 Page 19 of 34
Figure 4.5. Average Temperature Curves for Layer 2 to Layer 8 for a Segment. (Note: Layers 7 and 8 are both outside the TTZ.) The calculations indicate that all layers in the TTZ (layers 2 through 6) reaches average temperatures above 100°C. Figure 4.6 shows the calculated average saturations for each layer of the entire site during the thermal operations.
Figure 4.6. Average Temperature Profiles at Coolest Locations (Centroids) for a Segment.
Numerical Calculations of Heating Solvents Recovery Servicse of New England April 2010 Page 20 of 34
CONFIDENTIAL
TerraTherm, Inc., 2010, All Rights Reserved.
The final saturation for each layer in the calculation for the entire site is the same as indicated in Figure 4.4. The only difference is that the saturation decreased slower due to the longer operation period. 4.3 Basic System Design Parameters Based on the conducted calculations for the staged operation of the two segments, key numbers for sizing of the thermal treatment system and the ISTD system were obtained. 4.3.1 Process Equipment Tables 4.1 and 4.2 below present design parameters and effluent discharge estimates resulting from the calculations. Table 4.1. Process Equipment
Process Equipment Estimate
Based on Model Units ISTD power supply, max 4,052 kW Non-condensable vapor, max 1,300 scfm Condensable vapor (steam), max 5,386 lbs/hr Condensed liquid rate, max 10.8 gpm
Based on the calculated values, the vapor treatment system is designed to treat a minimum of 1,300 scfm of non-condensable vapor plus a minimum of 5,386 lbs of steam/hr. The liquid treatment system is designed to treat a minimum of 10.8 gpm of condensate. Table 4.2 shows the predicted water and vapor extraction rates and quantities. Table 4.2. Water and Vapor Extraction Rates and Total Volumes
Days
Water Vapor extracted Average
Rate Total
Volume Rate Total volume
gpm Gallons SCFM Million CF Period 1 30 4.2 181,000 650 28 Period 2 30 5.4 233,000 650 28 Period 3
30 9.6 414,000 1,300 56 Period 4
30 10.9 470,000 1,300 56 Period 5 30 7.5 323,000 1,300 56 Period 6 45 5.0 323,000 1,300 84
Total 195 1,944,000 309 Over the course of the thermal treatment, an estimated 1.9 million gallons of water and approximately 323 million cubic feet of non-condensable vapor will be extracted from the subsurface. 4.3.2 Energy Demand
Numerical Calculations of Heating Solvents Recovery Servicse of New England April 2010 Page 21 of 34
CONFIDENTIAL
TerraTherm, Inc., 2010, All Rights Reserved.
Table 4.3 summarizes the power usage by the ISTD and steam systems along with the effluent treatment system throughout the duration of the thermal treatment system operation. Table 4.3 Power Usage
Power and Steam Usage Duration
Power Usage ISTD
Power Usage Effluent Treatment
Total Power Usage
Days kWh kWh kWh Period 1 30 1,016,000 390,000 1,405,000 Period 2 30 1,306,000 445,000 1,751,000 Period 3 30 2,321,000 501,000 2,822,000 Period 4 30 2,612,000 501,000 3,113,000 Period 5 30 1,814,000 473,000 2,287,000 Period 6 45 1,814,000 612,000 2,426,000 Total 195 10,883,000 2,922,000 13,805,000
Based on the numerical calculations, it is estimated that a total energy input of approximately 10.9 million kW-hr of electricity must be injected into the subsurface. With the additional approximate 2.9 million kW-hr power demand of the effluent treatment system, the total estimated electrical energy consumption for the project is estimated at approximately 14 million kW-hr for the full scale remediation. The resulting total energy demand is larger than the energy needed just to heat the site to the target treatment temperatures. This is due to the removal of heat as steam, heat losses through the perimeter and the need to vaporize a minimum of approximately 30% of the pore water in the ISTD zone, which TerraTherm has found is necessary to achieve the required removal of CVOC contaminants.
Numerical Calculations of Heating Solvents Recovery Servicse of New England April 2010 Page 22 of 34
CONFIDENTIAL
TerraTherm, Inc., 2010, All Rights Reserved.
5.0 SENSITIVITY ANALYSIS
After setting up the basic scenario, a sensitivity analysis was performed to determine the sensitivity of heater spacing versus duration, vapor cap insulation and horizontal and vertical groundwater flux. In addition, the effect of boosting the heater output in the deepest sections was evaluated. Prior to deciding the proposed heating strategy as presented in the base case scenario described above, similar preliminary sensitivity calculations were performed to confirm the appropriateness of the design, and to make small adjustments for improved heating performance. The sections below present the impact of changes in important base case scenario assumptions and compared them to the actual final design (base case design). 5.1 Base Case Scenario Figure 5.1 shows the average temperature profiles at coolest locations (centroids) for a segment. This temperature profile is the base case for the sensitivity analysis, and all sensitivity calculations are compared to the base case average temperature profile.
0
5
10
15
20
25
0 20 40 60 80 100 120
Temperature (C)
Dep
th (
ft b
gs) 25 days
50 days
75 days
100 days
125 days
135 days
17 ft bgs - bottom of TTZ
Figure 5.1. Average Temperature Profile for Base Case Scenario.
Numerical Calculations of Heating Solvents Recovery Servicse of New England April 2010 Page 23 of 34
CONFIDENTIAL
TerraTherm, Inc., 2010, All Rights Reserved.
5.2 Heater Spacing Versus Duration For the ISTD method, the duration of heating is closely associated with the spacing between each of the heater wells. A sensitivity analysis was conducted using two different heater spacings apart from the 15 foot spacing as presented in the base case. Figures 5.2 and 5.3 presents the temperature profile with a heater spacing of 14 feet and 16 feet, respectively. In the base case 593 heaters will be placed in the treatment zone. If a 14 foot well spacing were chosen approximately 650 wells would have been used, while a 16 foot heater spacing would require a total of approximately 480 wells.
0
5
10
15
20
25
0 20 40 60 80 100 120
Temperature (C)
Dep
th (
ft bg
s)
25 days
50 days
75 days
100 days
125 days
135 days
17 ft bgs - bottom of TTZ
Figure 5.2. Average Temperature Profile with a 14 Foot Heater Spacing
Numerical Calculations of Heating Solvents Recovery Servicse of New England April 2010 Page 24 of 34
CONFIDENTIAL
TerraTherm, Inc., 2010, All Rights Reserved.
0
5
10
15
20
25
0 20 40 60 80 100 120
Temperature (C)D
epth
(ft
bgs
) 25 days
50 days
75 days
100 days
125 days
135 days
17 ft bgs - bottom of TTZ
Figure 5.3. Average Temperature Profile with a 16 Foot Heater Spacing A 14 foot heater spacing would speed up the overall heating process and the boiling point in the entire TTZ would be reached after approximately 85 days of operation compared to approximately 100 days in the base case. By using a 16 foot heater spacing it would not be possible to reach the boiling point at the very bottom of the treatment zone within 135 days of operation. 5.3 Vapor Cap Insulation The sensitivity for vapor cap insulation and its impact on achievable temperatures in the upper part of the treatment zone was evaluated by running calculations with three different vapor cap thermal conductivities. In the base case the thermal conductivity was assumed to be 0.15 W/m*K. A sensitivity analysis was conducted using a vapor cap thermal conductivity value of 0.25 and 0.35 W/m*K. Figures 5.4 and 5.5 present the temperature profile with a vapor cap thermal conductivity of 0.25 and 0.35 W/m*K. The latter value corresponds to the insulation value of a wet or poor vapor cap.
Numerical Calculations of Heating Solvents Recovery Servicse of New England April 2010 Page 25 of 34
CONFIDENTIAL
TerraTherm, Inc., 2010, All Rights Reserved.
0
5
10
15
20
25
0 20 40 60 80 100 120
Temperature (C)D
ep
th (
ft b
gs) 25 days
50 days
75 days
100 days
125 days
135 days
17 ft bgs - bottom of TTZ
Figure 5.4. Average Temperature Profile with a Vapor Cap Thermal Conductivity of 0.25 W/m*K.
Numerical Calculations of Heating Solvents Recovery Servicse of New England April 2010 Page 26 of 34
CONFIDENTIAL
TerraTherm, Inc., 2010, All Rights Reserved.
0
5
10
15
20
25
0 20 40 60 80 100 120
Temperature (C)D
epth
(ft
bgs)
25 days
50 days
75 days
100 days
125 days
135 days
17 ft bgs - bottom of TTZ
Figure 5.5. Average Temperature Profile with a Vapor Cap Thermal Conductivity of 0.35 W/m*K.
None of the proposed higher thermal conductivity values will be acceptable at the SRSNE site. The increase in thermal conductivity for the vapor cap would lead to a much higher heat loss at the surface and thus insufficient heat-up of the upper part of the treatment zone. By using a 0.25 W/m*K thermal conductivity for the vapor cap in the calculations, the temperature in the upper layer in the model reaches a steady state temperature at about 90 °C. For the 0.35 W/m*K vapor cap the steady state temperature is as low as 75 °C.
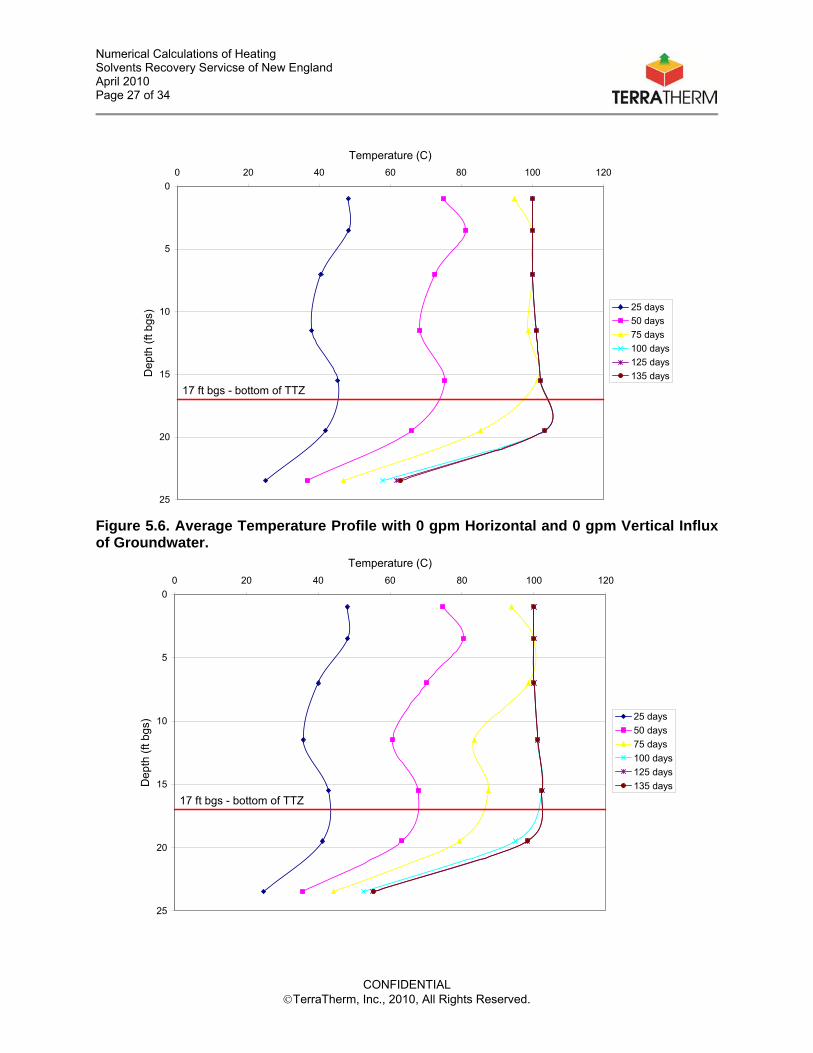
The insulation value of the vapor cap can either be improved by using a material with low thermal conductivity or by increasing the thickness of the cap. A 1 foot thick 0.15 W/m*K vapor cap as used in the base case scenario is acceptable for the SRSNE site. 5.4 Horizontal and Vertical Groundwater Flux Calculations have been performed to investigate the overall sensitivity of water influx into the treatment area. Scenarios have been run with a horizontal influx of 0 and 20 gpm respectively, and with a vertical influx of 3 and 6 gpm. In the base case scenario, a horizontal influx of groundwater to the target area of 10 gpm was assumed. No vertical influx of groundwater was applied in the base case scenario. The resulting average temperature profiles when the horizontal influx is varied are shown in Figures 5.6 through 5.7.
Numerical Calculations of Heating Solvents Recovery Servicse of New England April 2010 Page 27 of 34
CONFIDENTIAL
TerraTherm, Inc., 2010, All Rights Reserved.
0
5
10
15
20
25
0 20 40 60 80 100 120
Temperature (C)D
ept
h (f
t bgs
) 25 days
50 days
75 days
100 days
125 days
135 days
17 ft bgs - bottom of TTZ
Figure 5.6. Average Temperature Profile with 0 gpm Horizontal and 0 gpm Vertical Influx of Groundwater.
0
5
10
15
20
25
0 20 40 60 80 100 120
Temperature (C)
Dep
th (
ft bg
s)
25 days
50 days
75 days
100 days
125 days
135 days
17 ft bgs - bottom of TTZ
Numerical Calculations of Heating Solvents Recovery Servicse of New England April 2010 Page 28 of 34
CONFIDENTIAL
TerraTherm, Inc., 2010, All Rights Reserved.
Figure 5.7. Average Temperature Profile with 20 gpm Horizontal and 0 gpm Vertical Influx of Groundwater. The figures show that the sensitivity for horizontal groundwater influx is modest. The higher groundwater influx increase the time to get the lower part of the treatment area up to temperature, but even when assuming a horizontal influx of 20 gpm the entire treatment zone is up to temperature after 100 days of operation. It should be noted that this is true for the site as an average, but may not hold true at the up-gradient edge where the cool water enters. The resulting average temperature profiles when the vertical influx of groundwater is varied are shown in Figures 5.8 through 5.9. Figure 5.8. Average Temperature Profile with 10 gpm Horizontal and 3 gpm Vertical Influx of Groundwater.
0
5
10
15
20
25
0 20 40 60 80 100 120
Temperature (C)
Dep
th (
ft b
gs)
25 days
50 days
75 days
100 days
125 days
135 days
17 ft bgs - bottom of TTZ
Numerical Calculations of Heating Solvents Recovery Servicse of New England April 2010 Page 29 of 34
CONFIDENTIAL
TerraTherm, Inc., 2010, All Rights Reserved.
0
5
10
15
20
25
0 20 40 60 80 100 120
Temperature (C)D
epth
(ft
bgs)
25 days
50 days
75 days
100 days
125 days
135 days
17 ft bgs - bottom of TTZ
Figure 5.9. Average Temperature Profile with 10 gpm Horizontal and 6 gpm Vertical Influx of Groundwater. According to the sensitivity calculations, the temperature in the bottom of the treatment zone is almost not affected by varying th vertical influx of groundwater between 3 and 6 gpm. It should be noted that this is true for the site as an average, but may not hold true locally for zones of higher flow. 5.5 Heater Boosting The effects of adding more energy per unit length of heater near the bottom have been evaluated. In the base case scenario the lower approximately 6 feet of the heaters are boosted and the heaters are drilled 3 feet into the bedrock. The boosted sections of the heaters are able to deliver approximately 435 W per foot of heater to the treatment zone. By comparison the non-boosted sections only deliver approximately 300 W/ft. The effects of installing non-boosted heaters 3 and 5 feet into the bedrock was evaluated together with scenarios with boosted heaters installed 2 and 5 feet into the bedrock. The boosted section of the heaters starts approximately 3 feet above the bedrock in all scenarios where boosting is used e.g. the length of the boosted sections are approximately 5 and 8 feet in the two scenarios.
Numerical Calculations of Heating Solvents Recovery Servicse of New England April 2010 Page 30 of 34
CONFIDENTIAL
TerraTherm, Inc., 2010, All Rights Reserved.
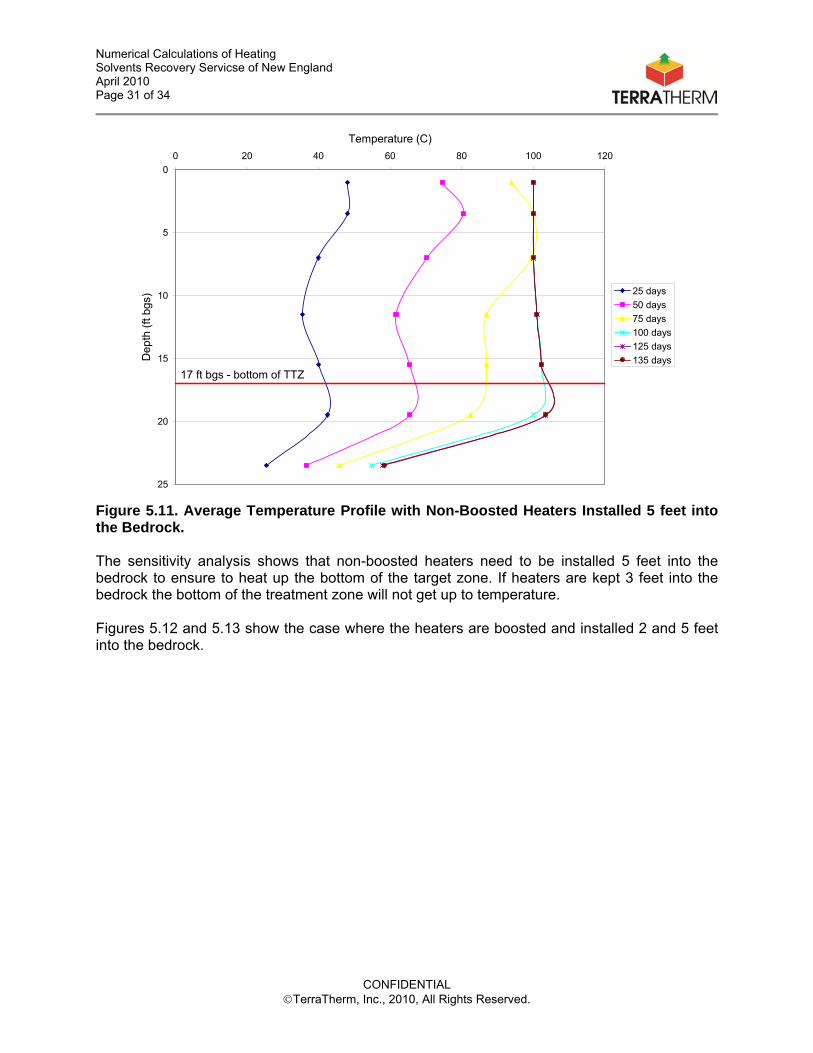
Figures 5.10 and 5.11 shows the situation where the heaters are installed 3 and 5 feet into the bedrock and none of the heaters are boosted.
0
5
10
15
20
25
0 20 40 60 80 100 120
Temperature (C)
De
pth
(ft b
gs) 25 days
50 days
75 days
100 days
125 days
135 days
17 ft bgs - bottom of TTZ
Figure 5.10. Average Temperature Profile with Non-Boosted Heaters Installed 3 feet into the Bedrock.
Numerical Calculations of Heating Solvents Recovery Servicse of New England April 2010 Page 31 of 34
CONFIDENTIAL
TerraTherm, Inc., 2010, All Rights Reserved.
0
5
10
15
20
25
0 20 40 60 80 100 120
Temperature (C)D
ep
th (
ft bg
s)
25 days
50 days
75 days
100 days
125 days
135 days
17 ft bgs - bottom of TTZ
Figure 5.11. Average Temperature Profile with Non-Boosted Heaters Installed 5 feet into the Bedrock. The sensitivity analysis shows that non-boosted heaters need to be installed 5 feet into the bedrock to ensure to heat up the bottom of the target zone. If heaters are kept 3 feet into the bedrock the bottom of the treatment zone will not get up to temperature. Figures 5.12 and 5.13 show the case where the heaters are boosted and installed 2 and 5 feet into the bedrock.
Numerical Calculations of Heating Solvents Recovery Servicse of New England April 2010 Page 32 of 34
CONFIDENTIAL
TerraTherm, Inc., 2010, All Rights Reserved.
0
5
10
15
20
25
0 20 40 60 80 100 120
Temperature (C)D
ep
th (
ft bg
s)
25 days
50 days
75 days
100 days
125 days
135 days
17 ft bgs - bottom of TTZ
Figure 5.12. Average Temperature Profile with Boosted Heaters Installed 2 feet into the Bedrock.
0
5
10
15
20
25
0 20 40 60 80 100 120
Temperature (C)
De
pth
(ft
bgs)
25 days
50 days
75 days
100 days
125 days
135 days
17 ft bgs - bottom of TTZ
Figure 5.13. Average Temperature Profile with Boosted Heaters Installed 5 feet into the Bedrock.
Numerical Calculations of Heating Solvents Recovery Servicse of New England April 2010 Page 33 of 34
CONFIDENTIAL
TerraTherm, Inc., 2010, All Rights Reserved.
The calculations show that a 2 foot boosted heater installation into the bedrock will not be sufficient to get the temperature at the bottom of the target zone up to temperature. By using boosted heaters and installing those 5 feet into bedrock, the bottom will be heated sufficiently during treatment. In the base case, the boosted heaters are installed 3 feet into the bedrock (see Figure 5.1) which also is found to be sufficient.
Numerical Calculations of Heating Solvents Recovery Servicse of New England April 2010 Page 34 of 34
CONFIDENTIAL
TerraTherm, Inc., 2010, All Rights Reserved.
6.0 REFERENCES /Ref. 1/ Heat Dissipation Model, Solvents Recovery Service of New England (SRSNE) Southington, Connecticut, TerraTherm, Inc. March 2010
KEMRON Environmental Services, Inc. 1359-A Ellsworth Industrial Boulevard
Atlanta, Georgia 30318
Submitted By: Reviewed By: ________________________ __________________________ Mark Clark Tommy Jordan, P.G. Project Manager Program Manager
Material Compatibility Study Southington, Connecticut January 25, 2010
1
INTRODUCTION
KEMRON Environmental Services, Inc. (KEMRON) is pleased to present the results of the Materials Compatibility Testing study. The treatability study was performed to evaluate the resistance of construction materials to degrade when subjected to site materials and conditions anticipated during full-scale thermal treatment. This report includes the methodology followed during each phase of the study, photographic documentation, and visual and weight degradation. KEMRON received duplicate samples of six metallic construction materials (coupons). These coupons were labeled B3, 20CB3, 304, AL6XN, C1023, and C276. In addition to the material coupons, KEMRON received a sample of Dense Non-aqueous Phase Liquid (DNAPL). TerraTherm indicated that this DNAPL material contained chlorinated contaminants from the site. Compatibility testing was conducted in two distinct phases. Initially, a sample of the DNAPL was heated to boiling, producing vapors which may be encountered during full-scale activities. This vapor was then passed through one reactor containing sand which was maintained at a temperature of approximately 700 degrees Celsius (oC). This reactor provided heating and retention of the vapors in order to degrade or break-down compounds in a manner anticipated during full-scale treatment. It was anticipated that in the first reactor chlorinated vapors from the DNAPL form hydrochloric acid. The hot acidic vapors were then passed into a second reactor containing samples of the test coupons and sand. The second reactor was maintained at a temperature of approximately 650 oC. This reactor served to expose the coupons to the highly degrading acid vapors. Finally, vapors from the second reactor were condensed and retained for use in Phase II of the study. Phase II of testing included subjecting the construction materials to lower temperatures and constantly condensing and vaporizing acidic compounds as may be experienced in the periphery of the thermal treatment areas. This phase was accomplished by boiling the acidic condensate from Phase I. The metal coupons were placed into Soxhlet columns connected to the condensate boiling flask. A cold water condenser was situated on the top Soxhlet column to condense the acidic vapors. As the acidic condensate boiled vapors passed over the coupons and were condensed in the condenser and allowed to fall back into the Soxhlet columns which exposed the coupons to the acidic liquid. When the volume of liquid reached the appropriate level within the columns the liquid siphoned back to the heating pot and the process was repeated.
PHASE I TESTING The high temperature phase of the testing was conducted using two cylindrical titanium reactors measuring approximately 6 inches in length and 3 inches in diameter. Each reactor was fitted with bolt-on end caps which contained stainless steel Swagelok fittings to allow the connection of inlet and outlet tubing to the reactors. Note that in further sections of this section of the report one end will be referred to as inlet and the other as outlet. Glass fiber material was placed over the opening of each Swagelok fitting, inside of the reactor, to prevent sand in the reactors from entering the tubing. The first reactor was filled with pre-cleaned sand only. The second reactor contained a coupon for each construction material furnished. KEMRON prepared this reactor by securing one end-cap onto the reactor. Approximately 3 inches of sand was then placed into the reactor. The coupons were then inserted into the sand so that they were oriented parallel to
Material Compatibility Study Southington, Connecticut January 25, 2010
2
the long axis of the reactor. Note that care was taken so that the coupons were surrounded on all sides by sand. The remainder of the reactor was filled with sand and then capped. The following is a sample photograph of the coupons prior to testing:
Prior to testing each coupon was cleaned using Alconox, dried and weighed. The following is a summary of the weights of each coupon utilized in Phase I.
Material Compatibility Study Southington, Connecticut January 25, 2010
3
TABLE 1
COUPON INITIAL
ID WEIGHT (g)
B 3 17.0097
20CB3 14.4856
304 10.6564
AL6XN 11.5524
C1023 11.0208
C276 13.4156
The reactors were placed into separate Fisher Isotemp muffle furnaces. A steam generating vessel consisting of a kitchen pressure cooker placed on a heating plate was connected to a breathing quality air source via a Swagelok connector. Stainless steel tubing was connected from the steam generator to a heating pot containing the site DNAPL material. This heating pot was also placed on a heating plate to allow heating of the DNAPL. Additional stainless steel tubing was used to connect the DNAPL heating pot to the inlet port of Reactor #1. Tubing was then utilized to attach the outlet port of Reactor #1 to the inlet port of Reactor #2. Finally, the outlet port from Reactor #2 was connected to a cold water condensing system using stainless steel tubing.
Material Compatibility Study Southington, Connecticut January 25, 2010
4
The following is a depiction of the test set-up for Phase I.
Furnace
Furnace 2
Steam Generator
Wat
er
Air
Water Out
Water In
Heat
Condenser
Condensate Collection
Material Compatibility Study Southington, Connecticut January 25, 2010
5
The picture below was taken during the actual set-up of during Phase I. In addition to the equipment shown a cold water condenser and condensate collection vessel was connected to Reactor #2 left of the picture.
Throughout testing activities in Phase I, air was passed through the steam generator and the remainder of the system at a rate of approximately 10 milliliters per minute (ml/min). Once the system was prepared KEMRON began treatment by heating each reactor to the appropriate operating temperature. Once the reactor target temperatures were achieved, KEMRON began heating the steam generator and DNAPL source. Specifically, the steam generator was heated to a target temperature of 110 oC, and the DNAPL source was heated to approximately 80 oC. TerraTherm had requested that the steam generator be used to constantly pass a flow of steam through the system at a rate equal to 10% of the quantity of condensate being collected during testing. However, KEMRON was unable to consistently maintain this rate of steam generation. In order to provide the appropriate amount of steam through the system, KEMRON periodically injected water into the hot generator at an amount equal to 10% of the condensate being collected. In the absence of water the steam generator provided heating of the air being injected into the treatment system. KEMRON tested the pH of the condensate being recovered on a daily basis. Results indicated that the average pH of the condensate was approximately 5 standard units. The pH monitoring was performed using both pH indicator paper and direct read instrument.
Material Compatibility Study Southington, Connecticut January 25, 2010
6
Following 10 days of DNAPL heating the testing was terminated and the system was dismantled. The material coupons from Reactor #2, rinsed, photographed and forwarded to a metallurgical laboratory contracted by TerraTherm for further evaluation. The following is a photograph of the post treatment coupons.
Note that due to the amount of damage to the coupons KEMRON had difficult identifying two of the coupons. Specifically, coupons C1023 and 304 labeled in the above picture were in question during coupon identification.
AL6XN
C276
C1023
20CB3
B3
304
Material Compatibility Study Southington, Connecticut January 25, 2010
7
Table 2 presents the final weights of each material coupon.
TABLE 2
COUPON INITIAL FINAL
ID WEIGHT (g) WEIGHT (g)
B 3 17.0097 17.0241
20CB3 14.4856 14.4966
304 10.6564 10.4960
AL6XN 11.5524 11.5639
C1023 11.0208 12.1520
C276 13.4156 13.4230
The data in Table indicates that with the exception of coupon C1023, all of the coupons increased in weight due to the testing conditions. As previously mentioned KEMRON collected condensate from Phase I testing. During testing KEMRON encountered several occurrences where condensate collection was interrupted. It was determined that the outlet lines from the reactors had gotten clogged. At these instances KEMRON disconnected the outlet lines from the reactors and removed the blockage. Upon dismantling of the system KEMRON observed that the glass fiber material used to prevent sand from entering the outlet lines had melted. KEMRON believes that this glass fiber material was the cause of the majority of the blockages. Over the 10 day testing period, KEMRON collected approximately 750 grams of clear condensate with a pH of 5 s.u.. On inspection of the titanium reactors used during Phase I testing, KEMRON observed significant oxidation and pitting of the inside of Reactor I, the sand only reactor. Specifically, KEMRON has outlined the portion of the reactor showing significant pitting.
Material Compatibility Study Southington, Connecticut January 25, 2010
8
PHASE II TESTING As previously outlined, Phase II testing was designed to evaluate the degradation of construction material when subjected to lower temperatures and acidic liquids and vapors. Testing was performed by boiling the condensate material from Phase I. The acidic vapors were passed through two Soxhlet columns containing the material test coupons and condensed in a colder water condenser. The condensed liquid fell back into the columns where they collected. When the liquid level in the columns reached a certain level they were returned to the heating pot via siphon tubes in the columns. The coupons were held within the columns using glass holders and glass fiber material. Specifically, coupons B3, 20CB3, and 304 were placed into one holder and coupons AL6XN, CL023, and C276 were placed into the second holder. The following is a photograph of the coupons within the glass holder:
Material Compatibility Study Southington, Connecticut January 25, 2010
9
The following is a diagram of the system set-up utilized for Phase II:
Water In
Water Out
Soxhlet 1
Soxhlet 2
Heat Source
Condensate Sample Still Pot
Set 1 Material coupons
Set 2 Material Coupons
Condenser
Material Compatibility Study Southington, Connecticut January 25, 2010
10
The photograph presented below is of the actual test set-up used for Phase II testing:
Material Compatibility Study Southington, Connecticut January 25, 2010
11
Testing was conducted for a period of 10 days. Over this 10-day period KEMRON calculated that the system cycled approximately 420 times, or once every 45 minutes. That is, liquid collected in the Soxhlet columns to the level it was siphoned back into the heating pot. During this 10 day period the condensate in the heating pot turned from clear to cloudy in the heating pot. At the completion of the 10 day period, testing was terminated and the system dismantled. The coupon materials were then removed from the system, rinsed, weighed and forwarded to TerraTherm’s metallurgical laboratory. The photograph below shows the coupons after the 10 day testing study.
AL6XN
C1023
C276
304
20CB3
B3
Material Compatibility Study Southington, Connecticut January 25, 2010
12
Table 3 summarizes the initial and final weights of the coupons used during Phase II testing:
TABLE 3
COUPON INITIAL FINAL
ID WEIGHT (g) WEIGHT (g)
B 3 16.6013 16.6603
20CB3 14.4763 14.4896
304 10.6211 10.6256
AL6XN 11.5402 11.5343
C1023 11.0019 11.0225
C276 13.4330 13.4397
Photographs and review of the coupon weights before and after testing indicate that the coupons in Phase II were less affected by the test conditions than those in Phase I. KEMRON Environmental Services, Inc. appreciates the opportunity to provide treatability testing to TerraTherm.
January 26, 2010 Transmitted Via Email Email Address: [email protected] Mr. Larry Conant TerraTherm, Inc. 10 Stevens Road Fitchburg, MA 01420 Subject: Laboratory Evaluation of 12 Corrosion Tested Coupons (Intertek-APTECH Report AES 09087234-3-1) (Final Report) Dear Mr. Conant: Intertek-APTECH is pleased to submit this report to TerraTherm, Inc. regarding the results of the laboratory evaluation of 12 corrosion-tested coupons. INTRODUCTION
Intertek-APTECH performed laboratory evaluation for corrosion mechanisms on 12 coupons. Two coupons from 6 different materials, as listed in Table 1, were selected by TerraTherm for corrosion testing at Kemron Industrial Services. The coupons were initially sent to Intertek-APTECH for weight and dimensional measurements prior to the corrosion testing. The first set of coupons referred as “Well samples” were then (reportedly) tested at 650°C hydrochloric acid vapor environment for 10 days (240 hours). The second set of coupons referred as” Piping samples” was tested in condensing hydrochloric acid environment at 100oC for 5 days ( 120 hours). At the end of the testing, Well samples and Piping samples were returned to Intertek-APTECH for evaluation. The objective of the laboratory evaluation was to:
1. Evaluate the coupons for corrosion mechanisms. 2. Calculate corrosion rate based on weight loss.
APPROACH
TerraTherm provided 12 coupons for initial weight and dimensional measurements. The coupons were documented in the as-received condition (Figures 1 and 2). The as-received dimensions of the coupons are summarized in Table 2.
Photographs were taken to document the post-test appearance of the coupons. The coupons were weighed before cleaning. The coupons were ultrasonically cleaned using citronox and rust remover to remove the corrosion products. The coupons were weighed after cleaning and documented in the as-cleaned condition (Figures 3 through 14). The general corrosion rates of the coupons were calculated (using Equation 1) by measuring the weight loss of test coupons. All the coupons were visually and microscopically examined for evidence of pitting/crevice corrosion. The corrosion rate1 of the coupons is calculated using: Corrosion Rate = )()( dTAWK ××÷× Equation 1
Where K – Corrosion constant (534) W – Weight loss, mg A – Surface area, in2 T – Time of exposure, hrs D – Density of material, gm/cm3 Corrosion rate – mils per year (mpy)
Table 1
ROSTER OF COUPON DESIGNATIONS AND THEIR RESPECTIVE MATERIAL GRADES
Material Class
Coupon ID
[650°C (1202°F)]
Coupon ID
[100°C (212°F)]
Stabilized Austenitic Stainless Steel (Alloy 20)
20CB3-13 20CB3-12
Austenitic Stainless Steel 304-03 304-01
Super Austenitic Stainless Steel AL6XN-2 AL6XN-1
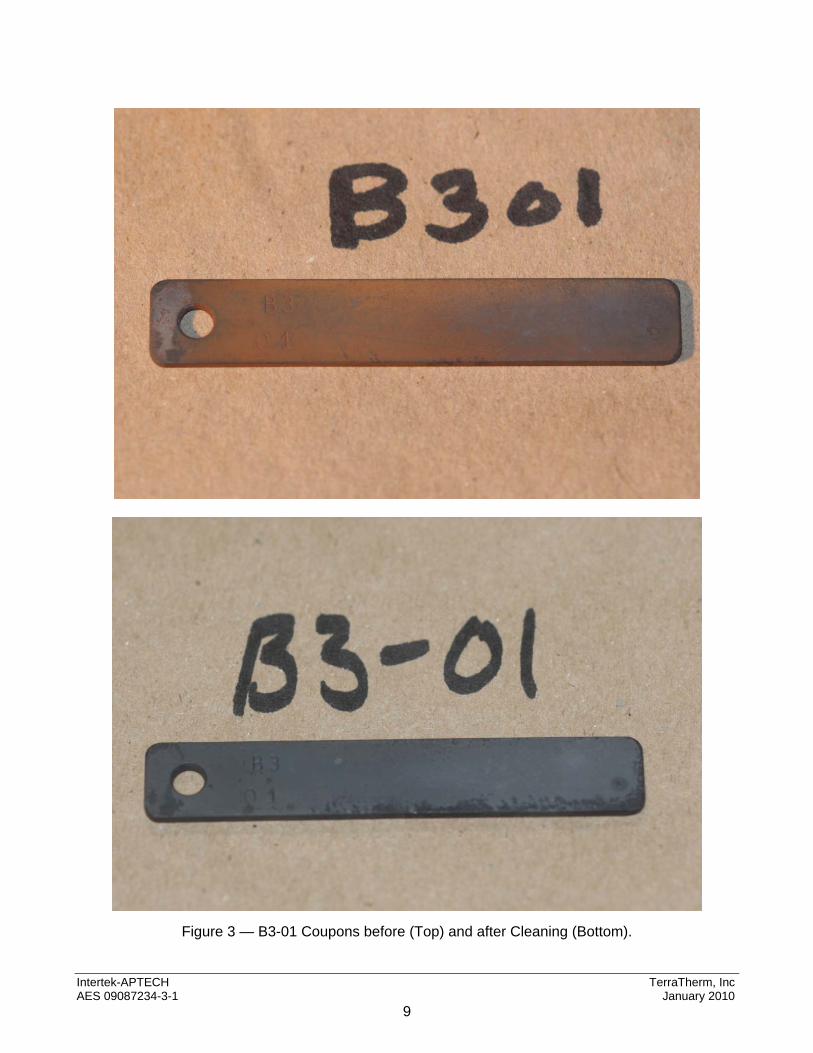
Hastelloy B3-01 B3-02
Carbon Steel C1023-1 C1023-2
Nickel-Chromium-Molybdenum Alloy
C276-2 C276-1
Intertek-APTECH TerraTherm, Inc AES 09087234-3-1 January 2010
2
Intertek-APTECH TerraTherm, Inc AES 09087234-3-1 January 2010
Visual and Microscopic Examination of the Well samples exhibited uniform corrosion on Coupons 304-03, AL6XN-2, and C1023-1. The other coupons in this batch did not exhibit pitting/crevice corrosion, but the surface appears to be tarnished. Representative photographs of the coupons are provided in Figures 3 through 8. Examination of the Piping samples did not exhibit corrosion or pitting. The coupons 304-01 and C1023-2 exhibited discoloration even after cleaning. Representative photographs of the coupons are provided in Figures 9 through 14. The weight loss and corrosion rate results of the tested coupons are presented in Tables 3 and 4.
Intertek-APTECH TerraTherm, Inc AES 09087234-3-1 January 2010
4
Table 3
WEIGHT LOSS AND GENERAL CORROSION RATE OF WELL SAMPLES AT 650°C (Vapor Phase)
Coupon ID number
Density (g/cm3)
Time (hr)
Surface Area
(sq. in) Initial
Weight (g)
Weight Before
Cleaning (g) Weight After Cleaning (g)
Weight Change
(mg)* Corrosion
Rate (mpy)
20CB3-13 8.08
240
3.51 14.485 14.50 14.49 -8.0 N/R
304-03 7.9 3.36 10.656 10.49 10.43 223.0 18.7
AL6XN-2 8.06 3.43 11.552 11.56 11.55 3.0 0.2
B3-01 9.22 3.57 17.009 17.02 17.01 0.0 N/R
C1023-1 7.86 3.47 11.020 11.98 9.06 1961.2 160.2
C276-2 8.94 3.46 13.415 13.42 13.42 -3.0 N/R *Negative values indicates weight gain N/R - Not reported due to weight gain
Table 4
WEIGHT LOSS AND GENERAL CORROSION RATE OF PIPING SAMPLES AT 100°C (Condensing Environment)
The corrosion rate calculation for the Well samples determined that carbon steel (C1023-1) and stainless steel (304-03) experienced the highest corrosion rates of 160.2 and 18.7 mpy, respectively. The other coupons in this batch showed no corrosion during the testing. Coupons 20CB3-13 and C-276 exhibited weight gain suggesting oxidation may have occurred during testing. High temperature oxidation typically results in oxide film on the surface resulting in weight gain. The thickness of the film formed depends on the exposure time and temperature. The corrosion rate of the carbon steel and 304 stainless steel is not unusual, as they are expected to corrode in the hydrochloric acid at elevated temperatures. The corroded coupons exhibited uniform
Intertek-APTECH TerraTherm, Inc AES 09087234-3-1 January 2010
5
corrosion, with no localized corrosion (i.e., pitting, crevice) observed on these coupons. The other coupons (C 276-2, B3-01, AL6XN-2, and 20 CB3-13) exhibited a tarnished appearance, which is likely due to the oxidation of the coupons and possible solution contamination at elevated temperatures. Based on the corrosion rate and examination, the Piping samples were unaffected by the testing conditions. Carbon steel exhibited the maximum corrosion rate (2.3 mpy), while the other coupon materials exhibited a corrosion rate between 0.1 and 0.4 mpy. The random discoloration observed on 304-01 and C1023-2 may be due to the contamination or initiation of random oxidation from the testing solution. CONCLUSION
Based on the characterization of the corrosion-tested coupons, the following conclusions were made:
1. Among the group of Well samples, carbon steel coupon (C1023-1) and stainless steel coupon (304-03) showed the highest corrosion rates. The super austenitic stainless steel, stabilized austenitic stainless steel, and nickel alloys showed good corrosion resistance. None of the Well samples exhibited any evidence of pitting or crevice corrosion.
2. The Piping samples showed a negligible corrosion rate (except carbon steel). The samples in
this group did not exhibit pitting or crevice corrosion. RECOMMENDATIONS
1. Should TerraTherm select one of the materials for application, Intertek-APTECH could perform a cost analysis on the selected materials. This cost analysis would involve a comparison of the purchase price of the material (cost of production, fixed costs) and cost of ownership (service life, inspection frequencies, etc).
2. If TerraTherm does not have a Risk Based Inspection (RBI) program for piping, Intertek-APTECH recommends implementation of a RBI program on the new piping material and existing piping to monitor corrosion, minimize inspection intervals, and plan for turnaround activities in the future.
Should you have any questions regarding this report, please contact me at Intertek-APTECH’s Houston office (832-593-0550) or by email at [email protected]. Sincerely, Velu Palaniyandi Supervisor, Metallurgical Services VP/rje cc: HOU File SV File REFERENCES
1. Denny .A .Jones, Principles and Prevention of Corrosion, 2nd Edition, P-31. NOTICE: This report was prepared by Intertek-APTECH as an account of work sponsored by the organization named herein. Neither Intertek-APTECH nor any person acting on behalf of Intertek-APTECH: (a) makes any warranty, express or implied, with respect to the use of any information, apparatus, method or process disclosed in this report or that such use may not infringe privately owned rights; or (b) assumes any liabilities with respect to the use of, or for damages resulting from the use of, any information, apparatus, method, or process disclosed in this report.
Intertek-APTECH TerraTherm, Inc AES 09087234-3-1 January 2010
Intertek-APTECH TerraTherm, Inc AES 09087234-3-1 January 2010
8
Figure 3 — B3-01 Coupons before (Top) and after Cleaning (Bottom).
Intertek-APTECH TerraTherm, Inc AES 09087234-3-1 January 2010
9
Figure 4 — C-276 Coupons before (Top) and after Cleaning (Bottom).
Intertek-APTECH TerraTherm, Inc AES 09087234-3-1 January 2010
10
Figure 5 — AL6XN-2 Coupons before (Top) and after Cleaning (Bottom).
Intertek-APTECH TerraTherm, Inc AES 09087234-3-1 January 2010
11
Figure 6 — 20 CB3-13 Coupons before (Top) and after Cleaning (Bottom).
Intertek-APTECH TerraTherm, Inc AES 09087234-3-1 January 2010
12
Figure 7 — 20 C1023-1 Coupons before (Top) and after Cleaning (Bottom).
Intertek-APTECH TerraTherm, Inc AES 09087234-3-1 January 2010
13
Figure 8 — 304-03 Coupons before (Top) and after Cleaning (Bottom).
Intertek-APTECH TerraTherm, Inc AES 09087234-3-1 January 2010
14
Figure 9 — C1023-2 Coupons before (Top) and after Cleaning (Bottom).
Intertek-APTECH TerraTherm, Inc AES 09087234-3-1 January 2010
15
Figure 10 — B3-02 Coupons before (Top) and after Cleaning (Bottom).
Intertek-APTECH TerraTherm, Inc AES 09087234-3-1 January 2010
16
Figure 11 — 304-01 Coupons before (Top) and after Cleaning (Bottom).
Intertek-APTECH TerraTherm, Inc AES 09087234-3-1 January 2010
17
Figure 12 — 20CB3-12 Coupons before (Top) and after Cleaning (Bottom).
Intertek-APTECH TerraTherm, Inc AES 09087234-3-1 January 2010
18
Figure 13 — AL6XN-1 Coupons before (Top) and after Cleaning (Bottom).
Intertek-APTECH TerraTherm, Inc AES 09087234-3-1 January 2010
19
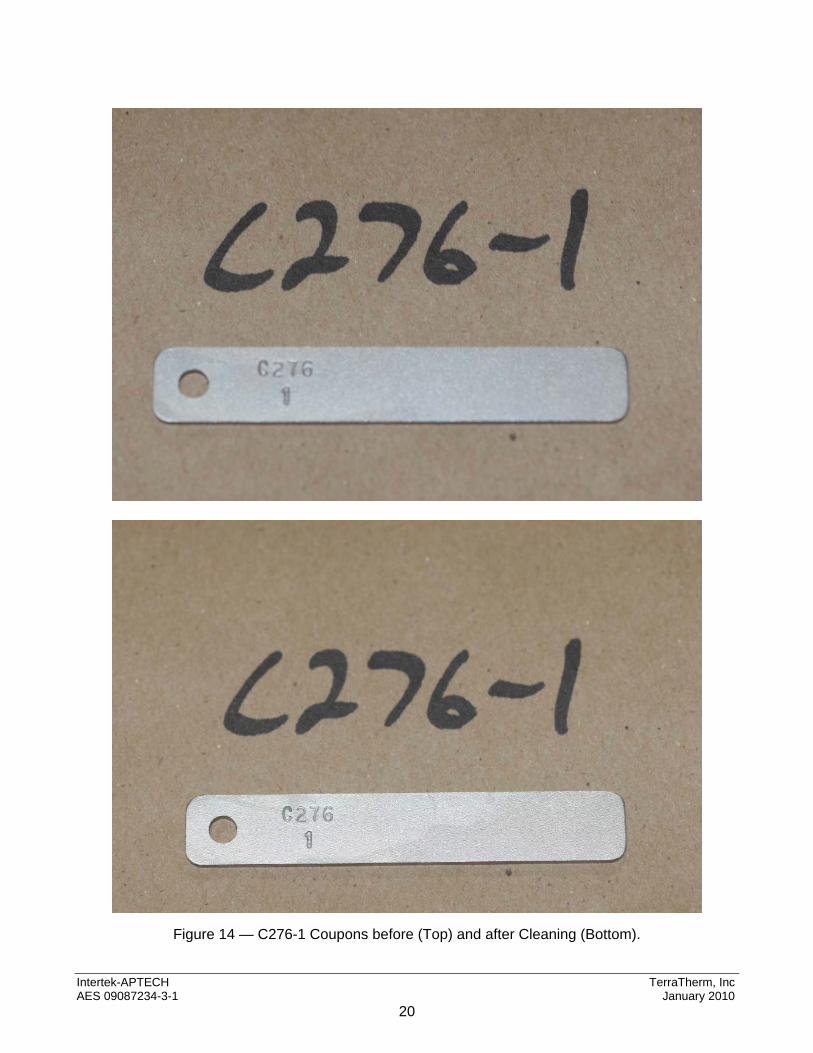
Figure 14 — C276-1 Coupons before (Top) and after Cleaning (Bottom).
Intertek-APTECH TerraTherm, Inc AES 09087234-3-1 January 2010
20
TERRATHERM 10 Stevens Road
Fitchburg, MA 01420 Phone: (978) 343-0300
Fax: (978) 343-2727
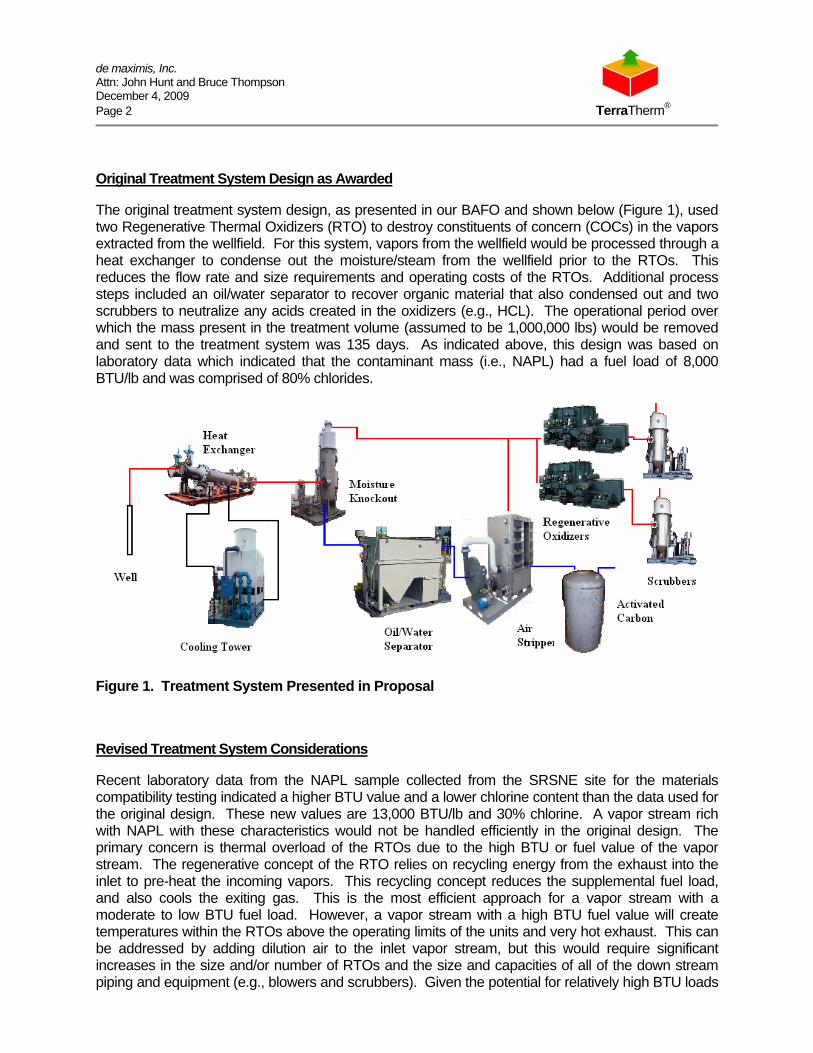
August 20, 2009 Bruce Thompson de maximis, inc. 200 Day Hill Road Suite 200 Windsor, CT 06095 Re: Summary of Analytical Results Dear Bruce: Attached please find the laboratory data report for the non aqueous phase liquid (NAPL) collected from the source area at the Solvents Recovery Service of New England, Inc. (SRSNE) Superfund Site in Southington, Connecticut. Data results indicate that the heat of combustion was higher than previous samples at 13,012 BTU/lb. This is consistent with the chloride content being lower than earlier estimates at 319,957 ppm and the presence of large quantities of non-chlorinated petroleum hydrocarbons including 1t,2-dimethylcyclopentane (11 Vol %), methylcyclohexane (1.1 Vol %), n-nonane (1.2 Vol %), 1-3 ethylmethylbenzene (1.4 Vol %), 1,3,5-trimethylbenzene (0.9 Vol %). These petroleum hydrocarbons are not reported in the previous volatile organic compound analysis. These data suggest a higher heat load to the oxidizer and a lower salt production due to the lower chlorine content. Given the variability of the DNAPL and NAPL present in the treatment zone, we expect to use these and other available data to establish the upper ranges of the design criteria (e.g., heat load and salt production rates) for the off-gas treatment system. Please contact me at the number above with any questions. Sincerely, TerraTherm, Inc. Robin Swift Project Manager cc: John Hunt, de maximis, inc. Encl.
HOUSTON LABORATORIES8820 INTERCHANGE DRIVE
HOUSTON, TEXAS 77054PHONE (713)660-0901
Certificate of Analysis
Number: 1030-2009060590-001A
July 07, 2009Robin SwiftTerra Therm, Inc.10 Stevens RoadFitchburg Maine 01420
Sample ID:Project Name :Project Number:Project Location:Sample Point:
Test
Heat of CombustionHeat of CombustionHeat of CombustionHeat of CombustionFlash Point, (PM)
Hydrocarbon Laboratory ManagerQuality Assurance: The above analyses are performed in accordance with ASTM, UOP or GPA guidelines for quality assurance,
unless otherwise stated.
Page 1 of 1
A 5/LHOUSTON LABORATORIES
8820 INTERCHANGE DRIVEHOUSTON, TEXAS 77054
PHONE (713)660-0901
Certificate of Analysis
Number: 1030-2009060590-001A
July 08, 2009Robin SwiftTerra Therm, Inc.10 Stevens RoadFitchburg Maine 01420
Sample ID:Project Name :Project Number:Project Location:Sample Point:
Final Boiling PointVolume % RecoveryVolume% Residue
Volume % Loss
Comments: Modified: Used 50 mL of sample, due to foaming.Visual color is dark straw.Residue and loss are observed.Temperatures are uncorrected for baromteric pressure.Sample cracked at 672°F and 94 volume % recovery.NR-No Result
Sample On: 03/27/2009 11:30
.JS^feu^L**
Hydrocarbon Laboratory Manager
Quality Assurance: The above analyses are performed in accordance with ASTM, UOP or GPA guidelines for quality assurance,unless otherwise stated
Test results meet all requirements of NELAC, unless specified in the narrative.
HOUSTON LABORATORY
8880 INTERCHANGE DRIVE
HOUSTON, TX 77054
(713)660-0901
Case Narrative for:
SPL, Inc.
Certificate of Analysis Number:
09071163Report To:
SPL, Inc.
Chris Staley
8820 Interchange Drive
Houston
TX
77054-
ph: (713)660-0901 fax:
Project Name:
Site:
Site Address:
PO Number:
State:
State Cert. No.:
Date Reported:
2009060590/RRR03865A
Houston, TX
Texas
T104704205-06-TX
SAMPLE RECEIPT:
All samples were received intact. The internal ice chest temperatures were measured on receipt and are recorded on the attached Sample ReceiptChecklist.
GENERAL REPORTING COMMENTS:
Results are reported on a wet weight basis unless dry-weight correction is denoted in the units field on the analytical report (" mg\kg-dry" or"ug\kg-dry").
Matrix spike (MS) and matrix spike duplicate (MSD) samples are chosen and tested at random from an analytical batch of "like" matrix to check forpossible matrix effect. The MS and MSD will provide site specific matrix data only for those samples which are spiked by the laboratory. Since theMS and MSD are chosen at random from an analytical batch, the sample chosen for spike purposes may or may not have been a samplesubmitted in this sample delivery group. The validity of the analytical procedures for which data is reported in this analytical report is determined bythe Laboratory Control Sample (LCS) and the Method Blank (MB). The Laboratory Control Sample (LCS) and the Method Blank (MB) areprocessed with the samples and the MS/MSD to ensure method criteria are achieved throughout the entire analytical process.
Some of the percent recoveries and RPD's on the QC report for the MS/MSD may be different than the calculated recoveries and RPD's using thesample result and the MS/MSD results that appear on the report because, the actual raw result is used to perform the calculations for percentrecovery and RPD.
Any other exceptions associated with this report will be footnoted in the analytical result page(s) or the quality control summary page(s).
Please do not hesitate to contact us if you have any questions or comments pertaining to this data report. Please reference the above Certificate ofAnalysis Number.
This report shall not be reproduced except in full, without the written approval of the laboratory. The reported results are only representative of thesamples submitted for testing.
SPL, Inc. is pleased to be of service to you. We anticipate working with you in fulfilling all your current and future analytical needs.
I certify that this data package is in compliance with the terms and conditions of the contract, both technically and for completeness, for other thanthe conditions detailed above. Release of the data contained in this hardcopy data package has been authorized by the Laboratory Manager or byhis designee, as verified by the following signature.
09071163 Page 1
7/29/2009
DateAgnes V. Vicknair
Project Manager Test results meet all requirements of NELAC, unless specified in the narrative.
HOUSTON LABORATORY
8880 INTERCHANGE DRIVE
HOUSTON, TX 77054
(713)660-0901
SPL, Inc.Certificate of Analysis Number:
09071163
Report To: SPL, Inc.
Chris Staley
8820 Interchange Drive
Houston
TX
77054-
ph: (713) 660-0901
Project Name:
Site:
Site Address:
2009060590/RRR03865A
Houston, TX
PO Number:
State: Texas
State Cert. No.: T104704205-06-TX
Date Reported:
fax: (713)660-6035
Fax To:
Client Sample ID
2009060590-001B
Lab Sample ID
09071163-01
Matrix
Liquid
Date Collected
3/27/2009
Date Received
7/22/2009 3:04:00 PM
COCIDH55633
HOLD
•
7/29/2009
Agnes V. Vicknair
Project Manager
Date
Kesavalu M. Bagawandoss Ph.D., J.D.
Laboratory Director
Ted Yen
Quality Assurance Officer
09071163 Page 2
7/29/2009 2:03:15 PM
HOUSTON LABORATORY
8880 INTERCHANGE DRIVE
HOUSTON, TX 77054
(713)660-0901
Client Sample ID:2009060590-001B
Analyses/Method Result QUAL
VOLATILE ORGANICS BY METHOD 8260B1,1,1,2-Tetrachloroethane
1,1,1 -Trichloroethane
1,1,2,2-Tetrachloroethane
1,1,2-Trichloroe thane
1,1-Dichloroethane
1,1-Dichloroethene
1,1-Dichloropropene
1,2,3-Trichlorobenzene
1,2,3-Trichloropropane
1,2,4-Trichlorobenzene
1,2,4-Trimethylbenzene
1,2-Dibromo-3-chloropropane
1,2-Dibromoethane
1,2-Dichlorobenzene
1,2-Dichloroethane
1,2-Dichloropropane
1,3,5-Trimethyl benzene
1,3-Dichlorobenzene
1,3-Dichloropropane
1,4-Dichlorobenzene
2,2-Dichloropropane
2-Butanone
2-Chloroethyl vinyl ether
2-Chlorotoluene
2-Hexanone
4-Chlorotoluene
4-lsopropyltoluene
4-Methyl-2-pentanone
Acetone
Acrylonitrile
Benzene
Bromobenzene
Bromochloromethane
Bromodichloromethane
Bromoform
Bromomethane
Carbon disulfide
Carbon tetrachloride
Chlorobenzene
ND2400000 J
NDNDND
94000
NDNDND
160000
7400000
NDNDNDNDND
2100000J
NDNDNDNDNDNDNDNDND
320000
NDNDNDNDNDNDNDNDNDNDNDND
Collected: 03/27/2009 0:00
Site: Houston, TX
Rep.Limit
50000
5000000
50000
50000
50000
50000
50000
50000
50000
50000
5000000
50000
50000
50000
50000
50000
5000000
50000
50000
50000
50000
200000
100000
50000
100000
50000
50000
100000
1000000
500000
50000
50000
50000
50000
50000
100000
50000
50000
50000
SPL Sample ID: 09071163-01
Dil. Factor Date Analyzed Analyst
MCL SW8260B Units: ug/Kg10000
1000000
10000
10000
10000
10000
10000
10000
10000
10000
1000000
10000
10000
10000
10000
10000
1000000
10000
10000
10000
10000
10000
10000
10000
10000
10000
10000
10000
10000
10000
10000
10000
10000
10000
10000
10000
10000
10000
10000
07/22/0918:19 LU L
07/22/0919:41 I_U_L
07/22/09 18:19 LU_L
07/22/09 18:19 LU_L
07/22/09 18:19 LU_L
07/22/09 18:19 LU_L
07/22/09 18:19 LU_L
07/22/0918:19 LU_L
07/22/09 18:19 LU L
07/22/09 18:19 LU_L
07/22/09 19:41 LU_L
07/22/0918:19 LU_L
07/22/0918:19 LU_L
07/22/09 18:19 LU_L
07/22/0918:19 LU_L
07/22/0918:19 LU_L
07/22/09 19:41 LU_L
07/22/09 18:19 LU_L
07/22/09 18:19 LU_L
07/22/09 18:19 LU_L
07/22/09 18:19 LU_L
07/22/09 18:19 LU_L
07/22/09 18:19 LU_L
07/22/09 18:19 LU_L
07/22/09 18:19 LU_L
07/22/0918:19 LU_L
07/22/0918:19 LU_L
07/22/0918:19 LU_L
07/22/09 18:19 LU_L
07/22/09 18:19 LU_L
07/22/09 18:19 LU_L
07/22/09 18:19 LU_L
07/22/09 18:19 LU_L
07/22/0918:19 LU_L
07/22/09 18:19 LU_L
07/22/09 18:19 LU_L
07/22/09 18:19 LU_L
07/22/0918:19 LU_L
07/22/0918:19 LU_L
Seq. #
5127154
5127155
5127154
5127154
5127154
5127154
5127154
5127154
5127154
5127154
5127155
5127154
5127154
5127154
5127154
5127154
5127155
5127154
5127154
5127154
5127154
5127154
5127154
5127154
5127154
5127154
5127154
5127154
5127154
5127154
5127154
5127154
5127154
5127154
5127154
5127154
5127154
5127154
5127154
Qualifiers: ND/U - Not Detected at the Reporting Limit
B/V - Analyte detected in the associated Method Blank
Qualifiers: ND/U - Not Detected at the Reporting Limit
B/V - Analyte detected in the associated Method Blank
J - Estimated value between MDL and PQL
E - Estimated Value exceeds calibration curve
N/C - Not Calculated - Sample concentration is greater than 4 times the amount of spike added. Control limits do not apply.
TNTC - Too numerous to count 09071163 Page 6
QC results presented on the QC Summary Report have been rounded. RPD and percent recovery values 7/29/2009 2:03:27 PMcalculated by the SPL LIMS system are derived from QC data prior to the application of rounding rules.
Qualifiers: ND/U - Not Detected at the Reporting Limit
BN - Analyte detected in the associated Method Blank
J - Estimated value between MDL and PQL
E - Estimated Value exceeds calibration curve
N/C - Not Calculated - Sample concentration is greater than 4 times the amount of spike added. Control limits do not apply.
09071163 Page 7
7/29/20092:03:27 PM
TNTC - Too numerous to count
QC results presented on the QC Summary Report have been rounded. RPD and percent recovery valuescalculated by the SPL LIMS system are derived from QC data prior to the application of rounding rules.
Qualifiers: ND/U - Not Detected at the Reporting Limit
B/V - Analyte detected in the associated Method Blank
J - Estimated value between MDL and PQL
E - Estimated Value exceeds calibration curve
N/C - Not Calculated - Sample concentration is greater than 4 times the amount of spike added. Control limits do not apply.
TNTC - Too numerous to count 09071163 Page 8
QC results presented on the QC Summary Report have been rounded. RPD and percent recovery values 7/29/2009 2:03:27 PMcalculated by the SPL LIMS system are derived from QC data prior to the application of rounding rules.
Qualifiers: ND/U - Not Detected at the Reporting Limit
B/V - Analyte detected in the associated Method Blank
J - Estimated value between MDL and PQL
E - Estimated Value exceeds calibration curve
N/C - Not Calculated - Sample concentration is greater than 4 times the amount of spike added. Control limits do not apply.
Ml - Matrix Interference
D - Recovery Unreportable due to Dilution
* - Recovery Outside Advisable QC Limits
TNTC - Too numerous to count
QC results presented on the QC Summary Report have been rounded. RPD and percent recovery valuescalculated by the SPL LIMS system are derived from QC data prior to the application of rounding rules.
Qualifiers: ND/U - Not Detected at the Reporting Limit
BA/ - Analyte detected in the associated Method Blank
J - Estimated value between MDL and PQL
E - Estimated Value exceeds calibration curve
N/C - Not Calculated - Sample concentration is greater than 4 times the amount of spike added. Control limits do not apply.
Ml - Matrix Interference
D - Recovery Unreportable due to Dilution
* - Recovery Outside Advisable QC Limits
TNTC - Too numerous to count
QC results presented on the QC Summary Report have been rounded. RPD and percent recovery valuescalculated by the SPL LIMS system are derived from QC data prior to the application of rounding rules.
Qualifiers: ND/U - Not Detected at the Reporting Limit
BN - Analyte detected in the associated Method Blank
J - Estimated value between MDL and PQL
E - Estimated Value exceeds calibration curve
N/C - Not Calculated - Sample concentration is greater than 4 times the amount of spike added. Control limits do not apply.
TNTC - Too numerous to count 09071163 Page 11
QC results presented on the QC Summary Report have been rounded. RPD and percent recovery values 7/29/2009 2:03:27 PMcalculated by the SPL LIMS system are derived from QC data prior to the application of rounding rules.
Ml - Matrix Interference
D - Recovery Unreportable due to Dilution
* - Recovery Outside Advisable QC Limits
HOUSTON LABORATORY
8880 INTERCHANGE DRIVE
HOUSTON, TX 77054
(713)660-0901Quality Control Report
SPL, Inc.2009060590/RRR03865A
Analysis:
Method:
Volatile Organics by Method 8260B
SW8260B
WorkOrder:
Lab Batch ID:
09071163
R279002
Matrix Spike (MS) / Matrix Spike Duplicate (MSP)
Sample Spiked: 09070822-01
RunID: K_090722C-5127157
Analysis Date: 07/22/2009 20:35
Preparation Date: 07/20/200914:03
Units: ug/kg-dry
Analyst: LU_L
Prep By: Method SW5030B
Analyte
cis-1,2-Dichloroethene
cis-1,3-Dichloropropene
m,p-Xylene
o-Xylene
trans-1,2-Dichloroethene
trans-1,3-Dichloropropene
1,2-Dichloroethene (total)
Xylenes .Total
Surr: 1,2-Dichloroethane-d4
Surr: 4-Bromofluorobenzene
Surr: Toluene-d8
SampleResult
NDNDNDNDNDNDNDNDNDNDND
MSSpikeAdded
1120
1120
2240
1120
1120
1120
2240
3360
2800
2800
2800
MSResult
9911100
2570
1200
8551000
1846
3770
2470
2760
2720
M S %Recovery
88.5
98.0
115107
76.4
89.4
82.44
11288.1
98.5
97.1
MSDSpikeAdded
1120
1120
2240
1120
1120
1120
2240
3360
2800
2800
2800
MSDResult
1020
1140
2520
1190
8831000
1903
3710
2520
2740
2710
MSD %Recovery
91.2
102113106
78.8
89.7
85.01
11089.9
97.8
96.9
RPD
2.97
3.99
2.02
0.840
3.18
0.332
3.068
1.64
2.04
0.753
0.137
RPDLimit
2020202020202020303030
LowLimit
6767698468566769787482
HighLimit
132116127114131131132127116125118
Qualifiers: ND/U - Not Detected at the Reporting Limit
BA/ - Analyte detected in the associated Method Blank
J - Estimated value between MDL and PQL
E - Estimated Value exceeds calibration curve
N/C - Not Calculated - Sample concentration is greater than 4 times the amount of spike added. Control limits do not apply.
Ml - Matrix Interference
D - Recovery Unreportable due to Dilution
* - Recovery Outside Advisable QC Limits
TNTC - Too numerous to count
QC results presented on the QC Summary Report have been rounded. RPD and percent recovery valuescalculated by the SPL LIMS system are derived from QC data prior to the application of rounding rules.
09071163 Page 12
7/29/2009 2:03:28 PM
Sample Receipt Checklist
AndChain of Custody
09071163 Page 13
7/29/2009 2:03:28 PM
HOUSTON LABORATORY
8880 INTERCHANGE DRIVE
HOUSTON, TX 77054
(713)660-0901
Sample Receipt Checklist
Workorder:
Date and Time Received:
Temperature:
09071163
7/22/2009 3:04:00 PM
24.0°C
Received By:
Carrier name:
Chilled by:
ffl
SPL
Not Chilled
*| Shipping container/cooler in good condition?
2 Custody seals intact on shippping container/cooler?
3 Custody seals intact on sample bottles?
4 Chain of custody present?
g Chain of custody signed when relinquished and received?
§ Chain of custody agrees with sample labels?
"j Samples in proper container/bottle?
o Sample containers intact?
g Sufficient sample volume for indicated test?
<] Q All samples received within holding time?
Received sample out of holding time logged with analysis, date onsample 3/27/09.
•\ <| _ Container/Temp Blank temperature in compliance?
Received sample with low coolant.
<| 2 Water - VOA vials have zero headspace?
<| g Water - Preservation checked upon receipt (except VOA*)?
*VOA Preservation Checked After Sample Analysis
Yes 0
Yes •
Yes •
Yes 0
Yes 0
Yes 0
Yes 0
Yes 0
Yes 0
Yes 0
Yes •
Yes •
Yes •
NoU
NoD
NoD
NoD
NoD
NoD
NoD
NoD
N o d
NoD
N o 0
NoD
NoD
Not Present D
Not Present 0
Not Present 0
VOA Vials Not Present 0
Not Applicable 0
SPL Representative:
Client Name Contacted:
Contact Date & Time:
Non ConformanceIssues:
Client Instructions:
09071163 Page 14
7/29/2009 2:03:28 PM
SPL, Inc.Analysis Request Chain of Custody Record
SPL-ENVZ£7Z£/ 'age 1_ of 1
S£L Work Order No.:
1Acct. Mate Code: Dept. Code
Report To: <r> T~\> I \ ,A ^ i <~.(Company Name): Q V L~ rAJCk VDCtXrOC^ \
Project/Station Name: Project/Station Number: Project/Station Location: Requested TAT
Yx<X) KkyrAddress a4X_ 24hr*
48hr*
72hr*
Standard
cHy/staegipfa>u5h>n H x 'Hlo5Li Special Instructions:
Indicate Billing Type:Address •Sfrm? D OtherIndicate Below
Credit Card Contact SPL, Inc for CC payment arrangements.
Terms: Cylinders will be rented for$10/cyI. All cylinders checked out areto be returned within 21 days,whether they contain sample or notCylinders not returned after 3D dayswill be considered lost and will bebilled at current replacement cost
500 Ambassador Caffery Pkwy. Scott. LA 70583(337) 237^775
9221Highvtay 23 Belle Chasse, LA 70037(504) 391-1337 • P.O. Box 3079 Laurel, MS 39442
(601)4280842
459 Hughes Dr. Traverse City, Ml 49636(616)347-5777•
1595 US 79 South Carthage, TX 75633(903) 693-6242
Note - As a convenience to our clients, this form is available in an electronic format Please contact one of our offices above for the form to be e-mailed to you.
irL
Page 1 of 1
HOUSTON LABORATORIES8820 INTERCHANGE DRIVE
HOUSTON, TEXAS 77054PHONE (713) 660-0901CERTIFICATE OF ANALYSIS
Number: 1030-2009060590-001C
Terra Therm, Inc.Robin Swift10 Stevens RoadFitchburg, Maine.
City/stateyzp PjTtMbUKfn LA A ni4l*5Contact: ^ ^ 1 _ I /k _ " * / +^r
Special Instructions:
SSftyflre^ *>f>*>oo ^ntzlm(CompanyNams): J~}AA\ & Net 30 day Acct. Check# Cash Recv'd
Indicate Billing Type:Address •Credit Card Contact SPL, Inc for CC payment arrangements.
Terms: Cylinders will be rented for$10/cyl. All cylinders checked out areto be returned within 21 days,whether they contain sample or notCylinders not returned after 30 dayswill be considered lost and will bebilled at current replacement cost.
Requited AnalysisCity/Stategip
Contact:Phone: Fax:
i Si
PO/Ref.No.: ^ \ (j j - Q Q ^
\Contract/Proposal #:
Cylinder Tracking Info *SampleType
(Sas/Liq.Solid)
* Surcharges May Apply
Comments
SampleDate
SampleTime
- u>Sample ID & Point
3SSS§Cylinder # Date Out Date In
LpAPL. 30L/4AAL. XhA/AP/_ Mt*Pi \ s \ ) \ j\ ,
Sampled By-Pj
Signature: f*\ £_Company Name^_
ti&± I <tfr& ~Th<rm>l/2.Relinquishedj
Signature:
rjjt Naroe<r , Time: Received By-Print Name^_ _«—
Signature: T*CJ £>)£Date: Time:
Relinquishecf By-Print Name:
Signature:Time: Received By-Print Name:
Signature:Date: Time:
Relinquished By-Print Name:
Signature:Time: Received By-Print Name:
Signature:Date: Time:
8820 interchange Dr, Houston.TX 77054
(713)660-0901
500 Ambassador Caffeiy Pkwy. Sam. LA 70583(337) 237-4775
9221Hlghway 23 Belle Chasse, LA 70037(504)391-1337
1595 US 79 Soulh Carthage. TX 75833
(903) 693-6242
••
P.O. Box 3079 Laurel, MS 39442
(601)428-0842
459 Hughes Or. Traverse City. Ml 49686(616)947-5777
SPL, Inc.Analysis Request Chain of Custody Record
Report To:(Company Name): Terra ThermAddress
10 Stevens Road
City/State/Zip Fitchburg, MA 01420Contact:Phone' 978-343-0300 Fax' 978-343-2727
Invoice To:(Company Name): Same as aboveAddress
City/State/ZipContact:Phone: Fax:
PO/Ref. No.: 9101-002
Contract/Proposal #:
WO# and Fraction
LNAPL/DNAPL
LNAPL/DNAPL
SampleDate
06/24/09
06/27/09
SampleTime
SampleType
(Gas/Liq.Solid)
LIQUID
LIQUID
Dup
licat
e
X
Com
posi
te
X
Spo
t
SPL Work Order No.:
RRRQ3379-02Project/Station Name:
SRSNE
SPL Work Order No.:
Project/Station Number:
Acct. Mate Code: Dept. Code
Project/Station Location:
Special Instructions: Client requesting analysis on both phases.
Indicate Billing Type:
Net 30 day Acct. V~\
Credit Card | |
* Terms: Cylinders will be rented for$10/cyl. All cylinders checked out areto be returned within 21 days,whether they contain sample or not.Cylinders not returned after 30 dayswill be considered lost and will bebilled at current replacement cost.
Cylinder Tracking Info *
Cylinder #
Sampled By-Print Name:
Signature:Relinquished By-Print Name:
Signature:Relinquished By-Print Name:
Signature:
Relinquished By-Print Name:
Signature:8820 Interchange Dr. Houston.TX 77054
(713)660-0901
500 Ambassador Caffery Pkwy. Scott, LA 70583
(337) 237-4775
Date:
Date:
Date:
Time:
Time:
Time:
Date Out Date In
Check# Cash Recv'd $
Contact SPL, Inc for CC payment arrangements.
Requested Analysis
BTU
, A
S D
240
FLA
SH
PO
INT
D93
DIS
TILL
ATI
ON
D86
CA
RB
ON
, H
YD
RO
GE
N d
5291
CH
LOR
INE
D80
8
PIA
NO
GP
A21
86
PC
D'S
EP
A 8
082
SPL
Paqe 1 of 1
Requested TAT
•un••
24hr*
48hr*
72hr*
Standard
Otherndicate Below
* Surchargess May Apply
Comments
Company Name:
Received By-Print Name:
Signature:
Received By-Print Name:
Signature:
Received By-Print Name:
Signature:9221 Highway 23 Belle Chasse, LA 70037
(504)391-1337
1595 US 79 South Carthage, TX 75633
(903) 693-6242
Date:
Date:
Date:
Time:
Time:
Time:
P.O. Box 3079 Laurel, MS 39442
(601)428-0842
459 Hughes Dr. Traverse City, Ml 49686
(616)947-5777
Note - As a convenience to our clients, this form is available in an electronic format. Please contact one of our offices above for the form to be e-mailed to you.
SPL, Inc.8820 Interchange Drive
Houston, TX 77054P: 713-660-0901F: 713-660-6035
Client Code: TERRA02 ORDER CONFIRMATION - Delivery 24hour
Quote/Sold To:
Order DateTerra Therm, Inc.
Order # RRRO3865Robin Swift
Ref. Doc. #10 Stevens RoadFitchburg, Maine 01420
Project/Station:Project/Station #:
Location:Purchase Order #:Phone: 978-343-0300 Ext:
Need Date: 7/17/2009Fax:SPL Work Order#:Email: [email protected] 2009060590
Amex/Visa/MC:Name on Card:
CC # Ending:
Report/Ship To: Bill To:Terra Therm, Inc. Terra Therm, Inc.
Robin Swift Robin Swift10 Stevens RoadFitchburg, Maine 01420 10 Stevens Road
From: Larry Conant, John LaChance, TerraTherm, Inc.
Date: December 4, 2009
Re: SRSNE Superfund Site Treatment Process Options
This memorandum presents a review of vapor treatment system options for the planned thermal remediation of the Observed NAPL in the Overburden Groundwater Unit (ONOGU) area at the Solvents Recovery Systems of New England Superfund Site (SRSNE) in light of new data and analyses, and provides our revised recommended approach for vapor treatment. We begin with an evaluation of the design basis and the approach put forth in our proposal that was the basis for our Best and Final Offer (BAFO) and the contract award. Next, we present recently acquired information that was used to revise the design basis; then, we summarize our review by presenting three treatment scenarios and treatment approaches that frame the issues and options for designing a treatment system for the site. Finally, we present our revised recommended approach for the SRSNE site. Attached to this memorandum is a table of system components for each option, with estimated equipment, operation, waste disposal, fuel, and energy costs. Please note that fuel and energy costs were estimated using today’s market rate and may change at the time of project startup.
Original Design Basis Used for Proposal/Bid
The design basis for the vapor treatment system presented in our proposal and assumed for the contract award is as follows:
NAPL characteristics: fuel load of 8,000 BTU/lb with 80% chlorides
Design for 1,000,000 lbs present within treatment volume (however, actual mass unknown and thought to likely be in the range of 500,000 to 2,000,000 lbs)
Minimize duration of operational phase in order to reduce potential for EPA requested add-on days of operation
de maximis, Inc. Attn: John Hunt and Bruce Thompson December 4, 2009 Page 2 TerraTherm®
Original Treatment System Design as Awarded
The original treatment system design, as presented in our BAFO and shown below (Figure 1), used two Regenerative Thermal Oxidizers (RTO) to destroy constituents of concern (COCs) in the vapors extracted from the wellfield. For this system, vapors from the wellfield would be processed through a heat exchanger to condense out the moisture/steam from the wellfield prior to the RTOs. This reduces the flow rate and size requirements and operating costs of the RTOs. Additional process steps included an oil/water separator to recover organic material that also condensed out and two scrubbers to neutralize any acids created in the oxidizers (e.g., HCL). The operational period over which the mass present in the treatment volume (assumed to be 1,000,000 lbs) would be removed and sent to the treatment system was 135 days. As indicated above, this design was based on laboratory data which indicated that the contaminant mass (i.e., NAPL) had a fuel load of 8,000 BTU/lb and was comprised of 80% chlorides.
Figure 1. Treatment System Presented in Proposal
Revised Treatment System Considerations
Recent laboratory data from the NAPL sample collected from the SRSNE site for the materials compatibility testing indicated a higher BTU value and a lower chlorine content than the data used for the original design. These new values are 13,000 BTU/lb and 30% chlorine. A vapor stream rich with NAPL with these characteristics would not be handled efficiently in the original design. The primary concern is thermal overload of the RTOs due to the high BTU or fuel value of the vapor stream. The regenerative concept of the RTO relies on recycling energy from the exhaust into the inlet to pre-heat the incoming vapors. This recycling concept reduces the supplemental fuel load, and also cools the exiting gas. This is the most efficient approach for a vapor stream with a moderate to low BTU fuel load. However, a vapor stream with a high BTU fuel value will create temperatures within the RTOs above the operating limits of the units and very hot exhaust. This can be addressed by adding dilution air to the inlet vapor stream, but this would require significant increases in the size and/or number of RTOs and the size and capacities of all of the down stream piping and equipment (e.g., blowers and scrubbers). Given the potential for relatively high BTU loads
de maximis, Inc. Attn: John Hunt and Bruce Thompson December 4, 2009 Page 3 TerraTherm®
and the uncertainty in the actual mass present in the treatment volume and thus the peak loading rate, this approach was determined to not be satisfactory.
In addition, based on the chemical composition of the NAPL, it was determined that several low-boiling point azeotropes would be formed and that the NAPL would boil in the presence of water at a temperature around 75ºC (this has been confirmed in the laboratory during the initial condensate production phase of the materials compatibility testing). What this means is that a significant portion of the mass present in the treatment volume (e.g., 80-90%) will be produced over a period of 4-6 weeks as the average temperature approaches 75ºC, well before the target temperature of 100ºC is reached. Furthermore, due to thermal coasting (i.e., the treatment volume will continue to heat-up even if the heater wells are shut down due to heat dissipation), it will not be possible to effectively control the arrival or duration of the peak loadings. If the mass present in the treatment volume is closer to 2M lbs than 1M lbs, then the peak loadings could easily be more than the treatment system can handle.
For example, if the entire treatment volume was heated all at once, and the total mass of COCs present was closer to 2M lbs than 1M lbs, and 80% of this mass was produced over a 4 week period corresponding to achieving temperatures around 75ºC, the average loading to the treatment system would be ~2,400 lbs/hr or 31M BTU/hr. Peak loading rates could be 2-3 times higher.
Installation and operation of a system large enough to handle these potential maximum peak loadings would be very expensive and may not be necessary if the actual mass present in the treatment zone is significantly lower than what is assumed. Therefore, as described below, we evaluated: 1) different equipment designs that could handle higher mass/fuel loadings and 2) different operational strategies to control and reduce the potential peak loadings to ranges that would be economically more feasible to design for. For instance, the treatment systems proposed for the three design scenarios evaluated below all use Thermal Accelerators (TA) instead of the original RTO’s. A TA does not have as much thermal recycling capability as the RTO, and therefore is designed for a higher BTU vapor load. In addition, we evaluated extending the operation phased from 135 to 195 days and dividing the treatment area up into quarters and phasing the start of heating of each quarter by 2-3 weeks. This has the distinct advantage of providing a means to regulate the loading rates and attenuating and spreading out the peak loadings.
Each scenario and treatment approach will be explained in detail below, including which of the three is our recommended approach.
Scenario 1
Summary of Assumptions and Objectives:
Design and size treatment system for 1,000,000 lbs of mass, but be prepared to treat unknown mass (up to 2,000,000 lbs) in most economical way.
Summary of Approach:
Replace RTOs with TAs.
Extend treatment period from 135 to 195 days to allow phased startup and treatment and control/regulation of peak loadings to treatment system. This provides flexibility and will allow
de maximis, Inc. Attn: John Hunt and Bruce Thompson December 4, 2009 Page 4 TerraTherm®
treatment of more than 1,000,000 lbs without sizing and building an overly large and expensive treatment system.
System will be designed and run primarily to minimize condensation and removal of NAPL from vapor stream (condense out water only). However, the system can be easily adjusted to facilitate the removal of NAPL from the vapor stream by simply lowering the cooling temperature of the heat exchanger in front of the knock out pot. This would only be done if the mass loadings were too high and could not be controlled by phasing the operation of the heaters. The condensed NAPL would have to be sent off for disposal at a regulated disposal facility.
The treatment system for Scenario 1 consists of replacing the original RTO’s with two TAs and removing one scrubber while still using a single incoming heat exchanger/moisture knockout and an oil/water separator similar to the original design (see Figure 2). In addition to replacing the original RTO’s with TAs, this option extends the processing time from 135 days to 195 days which would allow for a phased startup of the heaters and treatment of additional mass over 1,000,000 pounds. This extension of time also allows for a gradual ramp-up of the wellfield temperature and therefore a control of the removal rate from the wellfield.
Figure 2. Treatment System for Scenario 1
de maximis, Inc. Attn: John Hunt and Bruce Thompson December 4, 2009 Page 5 TerraTherm®
Scenario 2
Summary of Objectives:
Design and size system for 2,000,000 lbs of mass in 135 days.
Summary of Approach:
Replace RTOs with TAs.
Treatment period from remains at 135 (no phased startup).
System will be designed and run primarily to minimize condensation and removal of NAPL from vapor stream (condense out water only). However, the system can be easily adjusted to facilitate the removal of NAPL from the vapor stream by simply lowering the cooling temperature of the heat exchanger in front of the knock out pot. This would only be done if the mass loadings were too high and could not be controlled by phasing the operation of the heaters. The condensed NAPL would have to be sent off for disposal at a regulated disposal facility.
The treatment system for Scenario 2 consists of replacing the original RTO’s with four TAs (see Figure 3). Everything else would remain the same as the original design. The increase in oxidizer capacity will handle up to 2,000,000 pounds in the same operational period as the original proposal (i.e., 135 days).
The major disadvantage of this option is the higher capital cost for the extra TAs and scrubber and the significantly higher operations costs, including natural gas for the TAs.
Figure 3. Treatment System for Scenario 2
de maximis, Inc. Attn: John Hunt and Bruce Thompson December 4, 2009 Page 6 TerraTherm®
Scenario 3
Summary of Objectives:
Design and size system for 2,000,000 lbs in 135 days.
Summary of Approach:
Replace RTOs with TAs;
Treatment period remains at 135 (no phased startup).
An additional heat exchanger and knockout will be added to allow two-stage condensing of water and petroleum hydrocarbon NAPL. The system will be designed and run to maximize removal of petroleum hydrocarbon NAPL while keeping chlorinated volatile organic compounds (CVOCs) in vapor phase for destruction in the TAs.
NAPL condensate will require disposal at an approved regulated facility.
The treatment system for Scenario 3 consists of replacing the original RTO’s with two heat exchangers and two TAs with a single scrubber (see Figure 4). The assumed operational time period is the same as the original at 135 days, but the mass to be removed is assumed to be 2,000,000 pounds. The mass and fuel load would be attenuated by the two-stage condensing of water and petroleum hydrocarbons. The first heat exchanger and knock out would remove water moisture from the vapor stream. The second heat exchanger and knock out would be configured and operated to primarily remove the petroleum hydrocarbons while leaving the CVOCs in vapor stream for treatment by the TAs. By removing the petroleum hydrocarbons the fuel load can be reduced to levels that two TAs can handle. Leaving the CVOCs in the vapor stream ensures that the petroleum hydrocarbon NAPL can be disposed of as non-hazardous and therefore reduces the cost of disposal.
This option has a higher capital cost than the treatment approach for Scenario 1 due to the added heat exchanger and cooling tower and generates a NAPL waste stream that has to be sent for off-site disposal.
de maximis, Inc. Attn: John Hunt and Bruce Thompson December 4, 2009 Page 7 TerraTherm®
Figure 4. Treatment System for Scenario 3
Conclusion and Recommendation
The original process design was based on the NAPL having an 8,000 BTU/lb fuel loading rate and consisting of 80% chlorine. The most recent laboratory data indicates a 13,000 BTU/lb vapor fuel loading rate with only 30% chlorine. The change in chlorine isn’t a concern, but the higher BTU value cannot be processed in the original design without severely limiting the process rate. Therefore, three revised scenarios/treatment options have been proposed.
All of the treatment approaches replace the RTOs with TAs which are designed to handle the higher BTU fuel.
The treatment approach for Scenario 1 increases the operating time but has the lowest capital cost and greatest flexibility to handle the unknown amount of mass present in the treatment volume.
The treatment approach for Scenario 2 doubles the number of oxidizers and scrubbers increasing the capital cost over the system for Scenario 1, but brings the process time back to the original 135 days without creating a condensate stream requiring offsite disposal.
The treatment approach for Scenario 3 doubles the heat exchange capacity increasing the capital cost over the system for Scenario 1, but still uses two oxidizers. The process time is the original 135 days; however, there is an additional NAPL waste stream produced that requires off-site disposal.
Our recommended approach for the SRSNE site is to use the treatment approach outlined for Scenario 1 for the following reasons:
Its total cost is similar to the original proposal,
It allows for flexibility and control of the removal rate of contaminants, specifically if the estimated mass exceeds 1,000,000 pounds, and
The NAPL waste stream requiring off-site disposal is estimated to be minimal.
SRSNE Superfund SiteMatrix of Major System Components and Estimated Costs
TerraTherm, Inc.10 Stevens Road
Fitchburg, MA 01420
Scenario/Option Feed
Assumed Total Treatment Quantity
PoundsOperating
Days Major Equipment Quantity Size/DescriptionEstimated
Total $1,100,000 $500,000 $225,000 $57,000 $17,000 $1,899,000
Note: Actual costs to be finalized upon completion of the treatment design.
Memo TerraTherm, Inc.
10 Stevens Rd. Fitchburg, MA 01420
Phone: (978) 343-0300 Fax: (978) 343-2727
To: John Hunt, Bruce Thompson, de maximis, inc.
From: Robin Swift, Larry Conant, John LaChance, TerraTherm, Inc.
Date: December 21, 2009
Re: SRSNE Superfund Site Treatment Process Options - Scrubber Clarification
This memorandum clarifies the use of a single 1,600 SCFM scrubber as proposed for Scenario 1 in the SRSNE Superfund Site Treatment Process Options Memorandum rather than the original two 2,000 SCFM scrubbers proposed in the proposal. Scenario 1 proposes to extend the treatment period from 135 days to 195 days to allow for a phased treatment approach. This extended period allows for a gradual ramp up of the wellfield heaters which will provide more control of the mass removal rate. Given the ability to control and reduce the peak mass removal rates, less peak dilution air and neutralization will be required. Thus, with Scenario 1, one 1,600 SCFM scrubber will be sufficient. A second scrubber could be added for redundancy for approximately $50K, however, based on our experience, scrubbers are very reliable pieces of equipment. Other than occasional quench nozzles plugging, there is very little maintenance required. Therefore we believe that adding a second scrubber would not be cost effective.
January 26, 2010 Transmitted Via Email Email Address: [email protected] Mr. Larry Conant TerraTherm, Inc. 10 Stevens Road Fitchburg, MA 01420 Subject: Laboratory Evaluation of 12 Corrosion Tested Coupons (Intertek-APTECH Report AES 09087234-3-1) (Final Report) Dear Mr. Conant: Intertek-APTECH is pleased to submit this report to TerraTherm, Inc. regarding the results of the laboratory evaluation of 12 corrosion-tested coupons. INTRODUCTION
Intertek-APTECH performed laboratory evaluation for corrosion mechanisms on 12 coupons. Two coupons from 6 different materials, as listed in Table 1, were selected by TerraTherm for corrosion testing at Kemron Industrial Services. The coupons were initially sent to Intertek-APTECH for weight and dimensional measurements prior to the corrosion testing. The first set of coupons referred as “Well samples” were then (reportedly) tested at 650°C hydrochloric acid vapor environment for 10 days (240 hours). The second set of coupons referred as” Piping samples” was tested in condensing hydrochloric acid environment at 100oC for 5 days ( 120 hours). At the end of the testing, Well samples and Piping samples were returned to Intertek-APTECH for evaluation. The objective of the laboratory evaluation was to:
1. Evaluate the coupons for corrosion mechanisms. 2. Calculate corrosion rate based on weight loss.
APPROACH
TerraTherm provided 12 coupons for initial weight and dimensional measurements. The coupons were documented in the as-received condition (Figures 1 and 2). The as-received dimensions of the coupons are summarized in Table 2.
Photographs were taken to document the post-test appearance of the coupons. The coupons were weighed before cleaning. The coupons were ultrasonically cleaned using citronox and rust remover to remove the corrosion products. The coupons were weighed after cleaning and documented in the as-cleaned condition (Figures 3 through 14). The general corrosion rates of the coupons were calculated (using Equation 1) by measuring the weight loss of test coupons. All the coupons were visually and microscopically examined for evidence of pitting/crevice corrosion. The corrosion rate1 of the coupons is calculated using: Corrosion Rate = )()( dTAWK ××÷× Equation 1
Where K – Corrosion constant (534) W – Weight loss, mg A – Surface area, in2 T – Time of exposure, hrs D – Density of material, gm/cm3 Corrosion rate – mils per year (mpy)
Table 1
ROSTER OF COUPON DESIGNATIONS AND THEIR RESPECTIVE MATERIAL GRADES
Material Class
Coupon ID
[650°C (1202°F)]
Coupon ID
[100°C (212°F)]
Stabilized Austenitic Stainless Steel (Alloy 20)
20CB3-13 20CB3-12
Austenitic Stainless Steel 304-03 304-01
Super Austenitic Stainless Steel AL6XN-2 AL6XN-1
Hastelloy B3-01 B3-02
Carbon Steel C1023-1 C1023-2
Nickel-Chromium-Molybdenum Alloy
C276-2 C276-1
Intertek-APTECH TerraTherm, Inc AES 09087234-3-1 January 2010
2
Intertek-APTECH TerraTherm, Inc AES 09087234-3-1 January 2010
Visual and Microscopic Examination of the Well samples exhibited uniform corrosion on Coupons 304-03, AL6XN-2, and C1023-1. The other coupons in this batch did not exhibit pitting/crevice corrosion, but the surface appears to be tarnished. Representative photographs of the coupons are provided in Figures 3 through 8. Examination of the Piping samples did not exhibit corrosion or pitting. The coupons 304-01 and C1023-2 exhibited discoloration even after cleaning. Representative photographs of the coupons are provided in Figures 9 through 14. The weight loss and corrosion rate results of the tested coupons are presented in Tables 3 and 4.
Intertek-APTECH TerraTherm, Inc AES 09087234-3-1 January 2010
4
Table 3
WEIGHT LOSS AND GENERAL CORROSION RATE OF WELL SAMPLES AT 650°C (Vapor Phase)
Coupon ID number
Density (g/cm3)
Time (hr)
Surface Area
(sq. in) Initial
Weight (g)
Weight Before
Cleaning (g) Weight After Cleaning (g)
Weight Change
(mg)* Corrosion
Rate (mpy)
20CB3-13 8.08
240
3.51 14.485 14.50 14.49 -8.0 N/R
304-03 7.9 3.36 10.656 10.49 10.43 223.0 18.7
AL6XN-2 8.06 3.43 11.552 11.56 11.55 3.0 0.2
B3-01 9.22 3.57 17.009 17.02 17.01 0.0 N/R
C1023-1 7.86 3.47 11.020 11.98 9.06 1961.2 160.2
C276-2 8.94 3.46 13.415 13.42 13.42 -3.0 N/R *Negative values indicates weight gain N/R - Not reported due to weight gain
Table 4
WEIGHT LOSS AND GENERAL CORROSION RATE OF PIPING SAMPLES AT 100°C (Condensing Environment)
The corrosion rate calculation for the Well samples determined that carbon steel (C1023-1) and stainless steel (304-03) experienced the highest corrosion rates of 160.2 and 18.7 mpy, respectively. The other coupons in this batch showed no corrosion during the testing. Coupons 20CB3-13 and C-276 exhibited weight gain suggesting oxidation may have occurred during testing. High temperature oxidation typically results in oxide film on the surface resulting in weight gain. The thickness of the film formed depends on the exposure time and temperature. The corrosion rate of the carbon steel and 304 stainless steel is not unusual, as they are expected to corrode in the hydrochloric acid at elevated temperatures. The corroded coupons exhibited uniform
Intertek-APTECH TerraTherm, Inc AES 09087234-3-1 January 2010
5
corrosion, with no localized corrosion (i.e., pitting, crevice) observed on these coupons. The other coupons (C 276-2, B3-01, AL6XN-2, and 20 CB3-13) exhibited a tarnished appearance, which is likely due to the oxidation of the coupons and possible solution contamination at elevated temperatures. Based on the corrosion rate and examination, the Piping samples were unaffected by the testing conditions. Carbon steel exhibited the maximum corrosion rate (2.3 mpy), while the other coupon materials exhibited a corrosion rate between 0.1 and 0.4 mpy. The random discoloration observed on 304-01 and C1023-2 may be due to the contamination or initiation of random oxidation from the testing solution. CONCLUSION
Based on the characterization of the corrosion-tested coupons, the following conclusions were made:
1. Among the group of Well samples, carbon steel coupon (C1023-1) and stainless steel coupon (304-03) showed the highest corrosion rates. The super austenitic stainless steel, stabilized austenitic stainless steel, and nickel alloys showed good corrosion resistance. None of the Well samples exhibited any evidence of pitting or crevice corrosion.
2. The Piping samples showed a negligible corrosion rate (except carbon steel). The samples in
this group did not exhibit pitting or crevice corrosion. RECOMMENDATIONS
1. Should TerraTherm select one of the materials for application, Intertek-APTECH could perform a cost analysis on the selected materials. This cost analysis would involve a comparison of the purchase price of the material (cost of production, fixed costs) and cost of ownership (service life, inspection frequencies, etc).
2. If TerraTherm does not have a Risk Based Inspection (RBI) program for piping, Intertek-APTECH recommends implementation of a RBI program on the new piping material and existing piping to monitor corrosion, minimize inspection intervals, and plan for turnaround activities in the future.
Should you have any questions regarding this report, please contact me at Intertek-APTECH’s Houston office (832-593-0550) or by email at [email protected]. Sincerely, Velu Palaniyandi Supervisor, Metallurgical Services VP/rje cc: HOU File SV File REFERENCES
1. Denny .A .Jones, Principles and Prevention of Corrosion, 2nd Edition, P-31. NOTICE: This report was prepared by Intertek-APTECH as an account of work sponsored by the organization named herein. Neither Intertek-APTECH nor any person acting on behalf of Intertek-APTECH: (a) makes any warranty, express or implied, with respect to the use of any information, apparatus, method or process disclosed in this report or that such use may not infringe privately owned rights; or (b) assumes any liabilities with respect to the use of, or for damages resulting from the use of, any information, apparatus, method, or process disclosed in this report.
Intertek-APTECH TerraTherm, Inc AES 09087234-3-1 January 2010
Intertek-APTECH TerraTherm, Inc AES 09087234-3-1 January 2010
8
Figure 3 — B3-01 Coupons before (Top) and after Cleaning (Bottom).
Intertek-APTECH TerraTherm, Inc AES 09087234-3-1 January 2010
9
Figure 4 — C-276 Coupons before (Top) and after Cleaning (Bottom).
Intertek-APTECH TerraTherm, Inc AES 09087234-3-1 January 2010
10
Figure 5 — AL6XN-2 Coupons before (Top) and after Cleaning (Bottom).
Intertek-APTECH TerraTherm, Inc AES 09087234-3-1 January 2010
11
Figure 6 — 20 CB3-13 Coupons before (Top) and after Cleaning (Bottom).
Intertek-APTECH TerraTherm, Inc AES 09087234-3-1 January 2010
12
Figure 7 — 20 C1023-1 Coupons before (Top) and after Cleaning (Bottom).
Intertek-APTECH TerraTherm, Inc AES 09087234-3-1 January 2010
13
Figure 8 — 304-03 Coupons before (Top) and after Cleaning (Bottom).
Intertek-APTECH TerraTherm, Inc AES 09087234-3-1 January 2010
14
Figure 9 — C1023-2 Coupons before (Top) and after Cleaning (Bottom).
Intertek-APTECH TerraTherm, Inc AES 09087234-3-1 January 2010
15
Figure 10 — B3-02 Coupons before (Top) and after Cleaning (Bottom).
Intertek-APTECH TerraTherm, Inc AES 09087234-3-1 January 2010
16
Figure 11 — 304-01 Coupons before (Top) and after Cleaning (Bottom).
Intertek-APTECH TerraTherm, Inc AES 09087234-3-1 January 2010
17
Figure 12 — 20CB3-12 Coupons before (Top) and after Cleaning (Bottom).
Intertek-APTECH TerraTherm, Inc AES 09087234-3-1 January 2010
18
Figure 13 — AL6XN-1 Coupons before (Top) and after Cleaning (Bottom).
Intertek-APTECH TerraTherm, Inc AES 09087234-3-1 January 2010
19
Figure 14 — C276-1 Coupons before (Top) and after Cleaning (Bottom).
Intertek-APTECH TerraTherm, Inc AES 09087234-3-1 January 2010
20
CONFIDENTIAL
TerraTherm, Inc., 2010, All Rights Reserved.
Heat Dissipation Model
Solvents Recovery Service of New England (SRSNE)
Southington, Connecticut
Prepared for:
SRSNE Site Group
March 2010
Prepared by:
TerraTherm, Inc. 28900 Indian Point Keene, CA 93531
661-823-1620 TerraTherm is an exclusive licensee/owner of (a) U.S. Patent Nos. 4,984,594; 5,076,727; 5,114,497; 5,190,405; 5,221,827; 5,229,583; 5,244,310; 5,271,693; 5,318,116; 5,553,189; 5,656,239; 5,660,500; 5,997,214; 6,102,622; 6,419,423; 6,485,232; 6,543,539; 6,632,047; 6,824,328; 6,854,929; 6,881,009; 6,951,436; 6,962,466; and 7,004,678, (b) U.S. Patent Publication 2004-0228690, and (c) certain non-U.S. counterpart applications/patents of the above-referenced patents and application. Copyright 2010. The information and technology set forth herein are proprietary to The University of Texas at Austin and/or TerraTherm, Inc. All rights reserved.
Heat Dissipation Model Solvents Recovery Service of New England March 2010 Page i TerraTherm®
CONFIDENTIAL
TerraTherm, Inc., 2010, All Rights Reserved.
TABLE OF CONTENTS
1.0 INTRODUCTION ................................................................................................................... 1 2.0 MODEL SETUP ..................................................................................................................... 2
2.1 Model Domain .............................................................................................................. 2 2.2 Model Scenarios ........................................................................................................... 4 2.3 Energy Balance Estimation Methods ........................................................................... 6 2.4 Starting Conditions ....................................................................................................... 8 2.5 Simulation Output ....................................................................................................... 10
3.0 RESULTS ............................................................................................................................ 13 3.1 Estimated Time for Return to Equilibrium ................................................................... 13 3.2 Predicted Downgradient Temperatures ...................................................................... 15 3.3 Temperature Variation at the NTCRA Extraction Wells ............................................. 15
APPENDIX
Appendix A: Simulation Results for Scenarios 1 through 5
Heat Dissipation Model Solvents Recovery Service of New England March 2010 Page 1 TerraTherm®
CONFIDENTIAL
TerraTherm, Inc., 2010, All Rights Reserved.
1.0 INTRODUCTION The SRSNE Site Group has elected to undertake an evaluation to determine the dissipation of heat outside of the treatment area during and after heating of the treatment zone. TerraTherm has set up a two dimensional heat dissipation numerical model to simulate the down gradient transport of heat during the thermal remedy and subsequent cooling. The purpose of the evaluation has more specifically been to answer the following questions:
How long will it take before the site returns to an equilibrium state, near ambient temperatures?
What temperatures will be observed down gradient of the treated zone, particularly at locations of existing monitoring wells in the NTCRA containment area?
How will the temperature of the water extracted by the NTCRA wells vary over time?
The following sections describe the basis of the heat dissipation model and present the results of the modeling.
Heat Dissipation Model Solvents Recovery Service of New England March 2010 Page 2 TerraTherm®
CONFIDENTIAL
TerraTherm, Inc., 2010, All Rights Reserved.
2.0 MODEL SETUP 2.1 Model Domain A finite-element, numerical model has been developed to simulate the heat transport by advection and conduction. Figure 1 shows a map of the site with the selected orientation of the two dimensional, vertical simulation domain.
75 m (246 ft) through TTZ
67.5 m (221 ft) unheated zone
1.8 m (6 ft)
NTCRA1 Sheetpile wall
1.8 m (6 ft)
11 m (36 ft)
Groundwater flowdirection
Figure 1. Location of Simulated Vertical Transect from West to East. Note the varying thickness of the saturated overburden (red numbers).
The model is set up to calculate the temperatures in a 142.5 meter (m) (468 ft) cross section through and downgradient of the Target Treatment Zone (TTZ). Seventy-five m (246 ft) of the model cross section are located in the TTZ and 67.5 m (221 ft) are located in the unheated area downgradient of the TTZ.
The model is divided into five simplified layers based on the geology at the site, as presented in Figure 2.
Heat Dissipation Model Solvents Recovery Service of New England March 2010 Page 3 TerraTherm®
CONFIDENTIAL
TerraTherm, Inc., 2010, All Rights Reserved.
Layer 1 – Vapor Cap
Layer 2 – Vadose Zone (TTZ)
Layer 3 – Saturated Overburden (TTZ)
Layer 4 – Bedrock (Upper)
Layer 5 – Bedrock (lower)
0.3 m (1 ft)
1.5 m (5 ft)
Varies – 1.8- 11 m (6-36 ft)
1.5 m (5 ft)
1.5 m (5 ft)
Figure 2. Model Layers in Heat Dissipation Model
Layer 1 is the insulated cover on top of the treatment zone while Layer 2 is the vadose zone. Both Layer 1 and 2 are modeled assuming a constant thickness, but only Layer 2 is located in the TTZ.
Layer 3 represents the saturated overburden and is within the TTZ. It is 1.8 m (6 ft) thick throughout the majority of the TTZ, but the thickness increases from the eastern edge of the TTZ and toward the NCTRA 1 sheet pile wall (Figure 1) to reflect the actual geological settings at the site. At the sheet pile wall, Layer 3 is 11 m (36 ft). The depth of Layer 3 is increased by linear interpolation.
Layers 4 and 5 are the upper and the lower bedrock below the site. Layers 4 and 5 have a constant thickness for the purpose of the model.
Figure 3 shows the vertical transect/slice and a simplified model domain.
Heat Dissipation Model Solvents Recovery Service of New England March 2010 Page 4 TerraTherm®
CONFIDENTIAL
TerraTherm, Inc., 2010, All Rights Reserved.
Vadose zone
Alluvium
Bedrock
Cap
Upgradientend of TTZ
Downgradientend of TTZ
NTCRA wells
GW flow GW flow
Thermal conduction of heat: q = A x K x dT/dl, with K representing the calculation cell
Heat carried in flowing water q = v x A x Cp x (T-To), with T representing the cell the water is leaving
Model grid (fewer than actual blocks shown in the flow direction):
Length of cells in groundwater flow direction = 1.5 m; 95 cells
5 layers
Total model grid blocks = 475
0.3 m (1 ft)
1.5 m (5 ft)
1.8-11 m (6-36 ft)
1.5 m (5 ft)
1.5 m (5 ft)
142.5 m (468 ft)
Varying thickness
Varying thickness
and Figure 3. Conceptual Cross-Section of the Model, and Model Grid. Note that not all blocks are shown in the figure
The grid-blocks are 1.5 m (5 ft) long (95 cells) in the flow direction, 50 of the cells are within the TTZ. The simulation slice is 142.5 m long and contains 475 grid-blocks.
Aquifer properties and pumping data provided by ARCADIS have been used for the simulations. These include a porosity of 0.275 for the saturated overburden. Heat capacities and thermal conductivity have been derived by assuming that the solid matrix is quartz, and that the pores are water saturated. The thickness of the overburden will be varied along the model to represent the deepening of the saturated overburden, as indicated in Figure 3.
2.2 Model Scenarios To test the importance of horizontal and vertical groundwater flow on the thermal analysis, the following scenarios have been modeled:
1) No vertical flow – model starts from day 125 of operation (assumes TTZ has reached 100 °C and heaters are turned off)
Scenario 1: No water flow (shows only diffusive heat transport). Model starts from the day the heat is terminated in TTZ.
Heat Dissipation Model Solvents Recovery Service of New England March 2010 Page 5 TerraTherm®
CONFIDENTIAL
TerraTherm, Inc., 2010, All Rights Reserved.
Scenario 2: 5 gallons per minute (gpm) water flow through TTZ. All 5 gpm assumed to flow through model horizontally (no inflow of water from bedrock). Model starts from the day the heat is terminated in TTZ.
Scenario 3 (Base case): 10 gpm water flow through TTZ. All 10 gpm assumed to flow through model horizontally (no inflow of water from bedrock). Model starts from the day the heat is terminated in TTZ.
Scenario 4: 15 gpm water flow through TTZ. All 15 gpm assumed to flow through model horizontally (no inflow of water from bedrock). Model starts from the day the heat is terminated in TTZ.
2) Vertical flow – model from day 125 of operation (assumes TTZ has reached 100 °C and heaters are turned off)
Scenario 3A: 13 gpm water flow through TTZ. 10 gpm assumed to flow through model horizontally. 3 gpm is inflow of water from bedrock. Model starts from the day the heat is terminated in TTZ.
Scenario 3B: 16 gpm water flow through TTZ. 10 gpm assumed to flow through model horizontally. 6 gpm is inflow of water from bedrock. Model starts from the day the heat is terminated in TTZ.
3) No vertical flow – model from day 1 of operation
Scenario 5: 10 gpm water flow through TTZ. All 10 gpm assumed to flow through model horizontally. Model starts from day 1 of operation (heat-up period is included).
The model scenarios are summarized in Table 1 below.
Table 1. Table Summarizing the Seven Model Runs Horizontal flow Vertical flow Start of model
Scenario [gpm] [gpm] [day of operation]
Scenario 1 0 0 125
Scenario 2 5 0 125
Scenario 3 (base case) 10 0 125
Scenario 4 15 0 125
Scenario 3A 10 3 125
Scenario 3B 10 6 125
Scenario 5 10 0 1
Scenario 3 is considered the most representative scenario and is set up as the base scenario for the modelling. This scenario assumes that hydraulic control is maintained during the thermal remedy and no hot water is leaving the TTZ.
Heat Dissipation Model Solvents Recovery Service of New England March 2010 Page 6 TerraTherm®
CONFIDENTIAL
TerraTherm, Inc., 2010, All Rights Reserved.
The simulation period was 550 days. Scenario 1 through 4 start at day 125 of operation and extend through day 675 after startup of operation. Scenario 5 ran from day 1 of operation. After 125 days of operation the heat was turned off in the model, and the model ran for another 425 days assuming no additional heat added to the model domain.
2.3 Energy Balance Estimation Methods For each time-step, an energy balance is kept for each grid-block. The equations used are described below.
Cumulative energy (E) for a block is calculated as a summation of enthalpy fluxes (Q), for the time-step Δt:
E = Σ (Q x Δt)
An estimated energy balance will be maintained for each block in the model.
Ein = Eout + Estorage + Eloss
The energy fluxes are related for each time step as follows:
Qin = Qout + Qstorage + Qloss
where Q denotes enthalpy flux (in BTU/hr). Figure 3 shows the schematic energy balance for one layer.
All the water transport in the model occurs in the saturated overburden and the bedrock. For the vadose zone grid-blocks, heat only migrates by thermal conduction. In scenarios without any vertical groundwater flow, heat in the bedrock only migrates by thermal conduction. This is not a precise representation of field conditions, but will make the simulations conservative – the heat dissipation will not be overestimated.
The energy flux in the flowing groundwater is given by:
Qliq = mliquid x cp, water x (T – T0)
where cp is heat capacity, T is the temperature of the grid-block, and T0 is the ambient temperature.
An estimate of the diffusive (conductive) heat loss can be made based on thermal profiles at the bottom and top of each layer, and along the perimeter, using the following calculations:
Qheat loss = A x KT x dT/dz
Heat Dissipation Model Solvents Recovery Service of New England March 2010 Page 7 TerraTherm®
CONFIDENTIAL
TerraTherm, Inc., 2010, All Rights Reserved.
where A is the surface area through which energy is conducted, KT is the thermal conductivity of the subsurface material, and dT/dz is the temperature gradient across the surface also expressed as (T1-T2)/(z1-z2).
For the loss through the vapor cap, the temperature difference between the top and bottom of the layer can be used to calculate the gradient. For the calculations, it is assumed that the top of the vapor cap remains near ambient temperatures due to a combination of wind cooling and simple heat radiation.
Heat loss calculations through the bottom are accounted for in a similar manner. The layers exchange energy by thermal conduction such that energy leaves the warmer layer and enters the cooler layer.
The model calculates average layer temperatures based on the energy balance and the estimated heat capacity of each layer. The stored energy is related to the heated zone, heat capacity, and the average temperature as follows:
Estorage = Cp x (T - T0)
where Cp is the heat capacity of the grid-block, estimated from the volume, saturation, and specific heat capacity of the soil and water:
Cp = Vsoil x Cp x Vwater x cp, water
In each time-step, the energy balance can be used to estimate the temperature of each grid-block (Tenergybal):
The model uses 550 time steps of 24 hours each, with 160,000 energy balance calculation steps.
Heat Dissipation Model Solvents Recovery Service of New England March 2010 Page 8 TerraTherm®
CONFIDENTIAL
TerraTherm, Inc., 2010, All Rights Reserved.
2.4 Starting Conditions The starting temperature condition for Scenario 1 to 4 in the model is shown in Figure 4.
Vadose zone
Alluvium
Bedrock
Cap
Upgradientend of TTZ
Downgradientend of TTZ
NTCRA wells
GW flow GW flow
Starting temperatures (Scenario 1-4):
Gradient
100oC
50oC
10oC
Gradient
Varying thickness
Varying thickness
Figure 4. Starting Temperatures for Scenario 1 through 4 in the Model
The temperature distribution represents the condition within the footprint of the TTZ at the end of thermal treatment, where the target treatment volume has been heated to 100oC. The upper 1.5 m of the bedrock is expected to have an average temperature of 50oC. Both the vapor cap and the bedrock deeper than 1.5 m below the overburden will have varying temperatures due to the heat transport through those zones during thermal treatment. The starting temperature conditions within the TTZ for Scenario 5 are shown in Figure 5. Note that the heat transferred downgradient from the TTZ from day 1 to day 100 is not shown in Figure 5, but is included in the model calculations.
Heat Dissipation Model Solvents Recovery Service of New England March 2010 Page 9 TerraTherm®
CONFIDENTIAL
TerraTherm, Inc., 2010, All Rights Reserved.
Gradient
100oC
50oC
10oC
Gradient
Temperatures (Scenario 5): Day 100
Varying thickness
Starting Conditions (Scenario 5): Day 1
Figure 5. Starting Temperatures in the Model for Scenario 5.
The temperature distribution at day 1 represents the condition at startup of operation. After 100 days of heating the average temperature in the heated zone is expected to be 100 °C and kept there until day 125 of operation where the heating is terminated and the target treatment volume has been heated to 100oC.
From day 1 and until day 100 of operation the temperature in the heated zone (Layer 2 and 3 in the model) is increased from ambient temperatures (10 °C) to the boiling point (100 °C) according to the graphs shown in Figure 6. The graphs present the expected heat up of the heated zone. From day 100 to day 125 of operation, the average temperature in Layer 2 and 3 is kept at 100 °C to represent expected field conditions.
In Scenario 5, the upper 1.5 m of the bedrock (layer 4) is expected to have an average temperature of 50 oC after 100 days of operation. Figure 6 shows the assumed heat up of the upper bedrock layer (Layer 4 in the model).
Heat Dissipation Model Solvents Recovery Service of New England March 2010 Page 10 TerraTherm®
CONFIDENTIAL
TerraTherm, Inc., 2010, All Rights Reserved.
Temperature
-
20
40
60
80
100
120
0 20 40 60 80 100 120 140
Days
Te
mp
era
ture
[C
]
Assumed heat-up in layer 2 and layer 3 (TTZ) Temperature
-
10
20
30
40
50
60
0 20 40 60 80 100 120 140
Days
Tem
per
atu
re [
C]
Assumed heat-up in layer 4 (bedrock)
Figure 6. Assumed Heat-up of Layer 2 to 4 in Scenario 5
Both the vapor cap and the bedrock deeper than 1.5 m below the overburden will have varying temperatures due to the heat transport through those zones during thermal treatment.
2.5 Simulation Output The model calculates temperature data for the saturated overburden, the vadose zone, and the upper 1.5 m of the bedrock. Example output data are provided for the saturated overburden for the base case (Scenario 3) in Figure 7 and 8.
Heat Dissipation Model Solvents Recovery Service of New England March 2010 Page 11 TerraTherm®
Figure 7. Saturated Overburden Temperatures along the Flow Path for Scenario 3 (Base Case). Horizontal flow is 10 gpm and vertical flow is zero.
Figure 7 shows the temperature along the flow path from the time when heating is terminated in the TTZ (day 0) until 550 days after shutdown. The existing NTCRA wells are located between 15 m (50 ft) and 55 m (180 ft) from the TTZ, corresponding to 90 – 130 m (295 - 427 ft) along the flowpath.
The base case results indicate that the temperature impact at the pumping wells will be between 5 and 20 °C above the ambient temperature of 10 °C (i.e., between 15 and 30 °C predicted temperature), depending on specific well locations.
Heat Dissipation Model Solvents Recovery Service of New England March 2010 Page 12 TerraTherm®
CONFIDENTIAL
TerraTherm, Inc., 2010, All Rights Reserved.
Figure 8. Saturated Overburden Temperatures with Time for Scenario 3 (base case). Horizontal flow is 10 gpm and vertical flow is zero.
Figure 8 shows the temperature with time for modeling points located at different distances from the upgradient edge of the TTZ (distances indicated in the legend). In addition, labeled data sets shown in the graph indicate distances from the downgradient edge of the TTZ. Different locations within and downgradient of the TTZ will experience different temperature increases, as illustrated in the figure. The soil and water temperature, for example, 15 m (49 ft) from the TTZ is predicted to reach a temperature of 30 °C and the temperature is predicted to peak approximately 130 days after the heat is turned off.
Appendix A contains the simulation results for Scenarios 1 to 5.
Heat Dissipation Model Solvents Recovery Service of New England March 2010 Page 13 TerraTherm®
CONFIDENTIAL
TerraTherm, Inc., 2010, All Rights Reserved.
3.0 RESULTS The following sections address the questions of concern listed in the opening of this document. All results are focused on the temperatures in the saturated overburden (Layer 3 in the model), where water flows towards the NCTRA wells located downgradient of the treatment area.
3.1 Estimated Time for Return to Equilibrium Based on the calculations, the cooling of the site can be predicted. The ambient soil temperature at the site has been assumed to be 10 °C. Furthermore, due to natural variability and fluctuation in groundwater temperatures, it is assumed that a temperature within 10 °C of ambient temperature, e.g. below 20 °C, will be considered close to the equilibrium state. This is consistent with natural variations in groundwater temperature, which have shown to fluctuate seasonally by up to 12 °C.
Table 2 summarizes the time for the TTZ to return to temperatures below 20 °C. For comparison, the corresponding times to cool down the areas below 15 °C are shown. The table shows both the time to reach an average temperature of 15 and 20 °C, and the time before the maximum temperature within the TTZ is below 15 and 20 °C.
Table 2. Time for TTZ to Return to Ambient Temperature
Horizontal
flow Vertical flow
Max
20 °C
Max
15 °C
Average
20 °C
Average
15 °C
[gpm] [gpm] [days] [days] [days] [days]
Scenario 1 0 0 241 316 234 309
Scenario 2 5 0 240 317 210 275
Scenario 3
(base case) 10 0 239 307 182 235
Scenario 4 15 0 220 270 156 199
Scenario 3A 10 3 231 296 176 227
Scenario 3B 10 6 224 285 171 220
Scenario 5 10 0 364 432 307 360
Excluding Scenario 5, the model predicts the average temperature in the TTZ to be below 20 °C after 156 to 234 days after the energy input to the TTZ is terminated. The time to reach a maximum temperature in the TTZ below 20 °C is between 220 and 241 days.
Heat Dissipation Model Solvents Recovery Service of New England March 2010 Page 14 TerraTherm®
CONFIDENTIAL
TerraTherm, Inc., 2010, All Rights Reserved.
In Scenario 5 where the heat-up period is included in the calculations, the corresponding time to reach an average and maximum temperature in the TTZ is 307 and 364 days. Subtracting 125 days to account for the different starting time for this scenario, the resulting times to average and maximum temperatures in the TTZ (182 and 239 days) are within the ranges predicted by the other scenarios.
Table 3 summarizes the time for the treatment area and the area downgradient of the treatment area to return to temperatures below 15 and 20 °C.
Table 3. Time for TTZ and Downstream Area to Return to Ambient Temperature
Horizontal
flow
Vertical
flow
Max
20 °C
Max
15 °C
Average
20 °C
Average
15 °C
[gpm] [gpm] [days] [days] [days] [days]
Scenario 1 0 0 241 316 164 239
Scenario 2 5 0 244 335 165 241
Scenario 3 (base
case) 10 0 267 387 160 235
Scenario 4 15 0 292 437 153 228
Scenario 3A 10 3 266 392 160 235
Scenario 3B 10 6 264 396 159 235
Scenario 5 10 0 428 <550 300 381
If the downgradient area is included in the model, it predicts the average temperature in the TTZ and the downgradient area to be below 20 °C after 153 to 165 days after the energy input to the TTZ is terminated. The time to reach a maximum temperature in the TTZ and the downgradient area below 20 °C is between 241 and 292 days.
In Scenario 5, where the heat-up period is included in the calculations, the corresponding time to reach an average and maximum temperature below 20 °C in the TTZ is 300 and 428 days.
Please note that the stated times in Table 2 and 3 are from the time the heaters are shut down for Scenario 1 to 4 (corresponding to day 125 of operation), while the time stated for Scenario 5 is from startup of operation.
Heat Dissipation Model Solvents Recovery Service of New England March 2010 Page 15 TerraTherm®
CONFIDENTIAL
TerraTherm, Inc., 2010, All Rights Reserved.
3.2 Predicted Downgradient Temperatures The model was used to calculate groundwater temperatures expected to occur in downgradient NTCRA area wells as a result of heating within the TTZ.
The model calculates the downgradient temperature up to 67.5 m (221 ft) from the edge of the treatment area. Since the NTCRA monitoring wells are located in different distances from the edge of the treatment zone, the maximum expected temperature to be observed at a distance of 10 m (33 ft), 20 m (66 ft), 40 m (131 ft) and 67.5 m (221 ft) from the downgradient edge of the treatment zone are summarized in Table 4.
Table 4. Predicted Maximum Temperatures along the Flowpath in the Model Domain. All distances are measured from the downgradient edge of the heated zone, which corresponds to 75 m along the flowpath in the model.
Horizontal
flow Vertical flow
Maximum temperature 10 m from
edge of TTZ
Maximum temperature 20 m from
edge of TTZ
Maximum temperature 40 m from
edge of TTZ
Maximum temperature 67.5 m from edge of TTZ
[gpm] [gpm] [°C] [°C] [°C] [°C]
Scenario 1 0 0 10 10 10 10
Scenario 2 5 0 22 14 10 10
Scenario 3 (base case)
10 0 35 24 14 10
Scenario 4 15 0 44 32 18 12
Scenario 3A 10 3 38 26 15 11
Scenario 3B 10 6 40 28 17 12
Scenario 5 10 0 52 33 16 10
The predicted maximum temperature 10 m (33 ft) from the edge of the TTZ is up to 52 °C. The temperature decreases dramatically with distance from the TTZ. 67.5 m (220 ft) downgradient of the TTZ, the expected increase in temperature is in the order of a few degrees Centigrade.
Graphs showing the maximum temperatures as a function of the distance along the flowpath are attached in Appendix A.
3.3 Temperature Variation at the NTCRA Extraction Wells The average NTCRA extraction well is located approximately 34 m (110 ft) from the TTZ corresponding to 109 m (358 ft) along the flowpath in the model. In Appendix A, the temperature variation over time is shown for the different model scenarios.
Heat Dissipation Model Solvents Recovery Service of New England March 2010 Page 16 TerraTherm®
CONFIDENTIAL
TerraTherm, Inc., 2010, All Rights Reserved.
The average temperature increase in the water extracted by the NTCRA wells over time is predicted to be in the order of 5-10 °C assuming an average distance and equal flow rate through the TTZ and the downgradient area.
Heat Dissipation Model Solvents Recovery Service of New England March 2010 TerraTherm®
CONFIDENTIAL
TerraTherm, Inc., 2010, All Rights Reserved.
Appendix A
Simulation Results for Scenarios 1 through 5
Scenario 1
No pumping. Model starts at shut down of thermal system (Day 125 of thermal operation)
Scenario 1 - No pumping. Model starts at shut down of thermal system.