Nic Gay conducted a series of tests on rockblocks subjected to uniaxial and biaxialloading (Gay, 1976). Each block contained aslot, which in some tests was extended whileunder load to simulate mining. The resultingfracture patterns around these slots wereexamined in detail and trends were suggestedfor the influence of stress ratio, material type,and pre-existing planes of weakness.
The aim of this exercise is to replicate theresults obtained by Gay using numericalmodelling. Gay reported the appearance ofshear fractures that are analogous to thosethat occur at the edges of deep-level goldmining excavations. The formation of these
fractures is often associated with damagingseismicity (Lenhardt and Hagan, 1990)Ultimately, we wish to predict the occurrenceand severity of such events using non-linearnumerical modelling. This work aims todemonstrate that such modelling is capable ofreplicating the fracturing obtained in thecontrolled setting provided by Gay’sexperiments.
Results are compared in terms of thefeatures and trends observed by Gay. Straingauges placed around the slots also providedata for comparison.
Gay’s experiments
Experimental setup
A series of tests were conducted on specimensof sandstone and quartzite. These specimenswere machined to dimensions of 100 mm ×100 mm × 75 mm. Each contained a slotmachined all the way through the sample(parallel to the short axis). These slots were 2–5 mm wide and of various lengths, with areported average length of 25 mm.
In some of the samples, designated‘mining tests’, the size of the slot wasextended by filing away the facesincrementally. In these tests, the initialopening was either a 5 mm diameter hole or a5 mm × 10 mm slot. These samples weretested under constant load.
The ‘static tests’ were performed onsamples with slots of approximately the samesize. The samples were loaded in a steel frame.An initial confinement was supplied bytightening a series of cap screws against steelplates adjacent to the sample. The full lateralload was applied by pressurizing flat-jacks
Numerical simulation of shear fractureevolution in laboratory-scale samplesby D.P. Roberts*
SynopsisThis investigation aimed to simulate the experiments performed byNic Gay (Gay, N.C. 1976. Fracture growth around openings in largeblocks of rock subjected to uniaxial and biaxial compression.International Journal of Rock Mechanics and Minining Sciences andGeomechical Abstracts, vol. 13. pp. 231-243) on fracture growtharound openings in blocks of rock subjected to uniaxial and biaxialcompression, using the Elfen discrete element code. The results ofthe physical experiments indicated a number of trends that weresuccessfully replicated in the numerical simulations, includingcrushing ahead of the face, the formation of a sub-vertical tensilefracture at centre-span, the formation of groups of fracturesoriginating from the crushed face zone, the formation of largecorner-to-corner fractures which precede sample failure, and linkingof slot corner and sample corner fractures leading to sample failure.
In addition, other features were apparent that were not reportedby Gay. It is believed that these took the form of conjugate shearfractures (as reported by Gay in a previous paper) and otherfeatures that may have been altered or inhibited by the presence ofpre-existing structure in the physical samples. It was found that thesamples, though nominally made up of the same rock type, musthave had significantly differing properties. The presence of pre-existing structures may have contributed to this discrepancy. Strainmeasurements from the physical experiments were reasonably wellmatched, except where the gauge lay directly in the path ofadvancing fractures.
Metallurgy, 2012. ISSN 2225-6253. This paperwas first presented at the, Southern HemisphereInternational Rock Mechanics Symposium(SHIRMS) 2012, 15–17 May 2012, Sun City,South Africa.
685The Journal of The Southern African Institute of Mining and Metallurgy VOLUME 112 AUGUST 2012 �
Numerical simulation of shear fracture evolution in laboratory-scale samples
placed between the frame and the plates. Vertical loads wereapplied by the piston of a compressive testing machine.
Most of the tests were performed on sandstone samples.Three samples of quartzite were tested at different confiningstresses:
Gay’s paper mentions the presence of bedding planes andpyrite bands within the quartzite samples, but he describesthem only in terms of their influence on results.
Experimental results
A typical cross-section through a static-tested unconfinedquartzite sample (C13) is presented in Figure 1. Crushing isobserved adjacent to both ‘faces’ of the slot. A roughlyvertical fracture extends downwards from the centre of theslot. Families of fractures extend from the slot corners sub-vertically over the solid, some of which curve back over theslot. The bedding plane above the slot clearly affects thefracture pattern, providing a channel for the formation of asub-horizontal fracture, and initiating another crack whichcurves over the slot, possibly terminating on another beddingplane above.
Similar features were observed in the result from sampleC17 (Figure 2). In this test the bedding planes had an evenmore profound influence on the fracturing pattern. A majorfracture extending from the right corner over the slot runsadjacent to a bedding plane, interrupting and altering thefracture ‘family’ originating in the left corner.
Face crushing and the central tensile fracture areobserved. Curving of the fractures over the slot is evident, butmay also be associated with unidentified bedding planes inthe bottom portion of the sample.
Fracture maps for the biaxial mining test (C18) arepresented in Figure 3. Gay states that the orientation offracturing in the quartzite samples is ‘controlled mainly bythe bedding planes’. Comparison of the results was thereforedifficult. The sandstone samples were not as strongly affectedby pre-existing features and could therefore be interpretedmore readily. Figure 4 shows the influence of horizontalstress on the fracture pattern for various mining models,curving over the slot at high confinement (a) and, at lowconfinement, forming fractures which ultimately extend allthe way to the model corners (c).
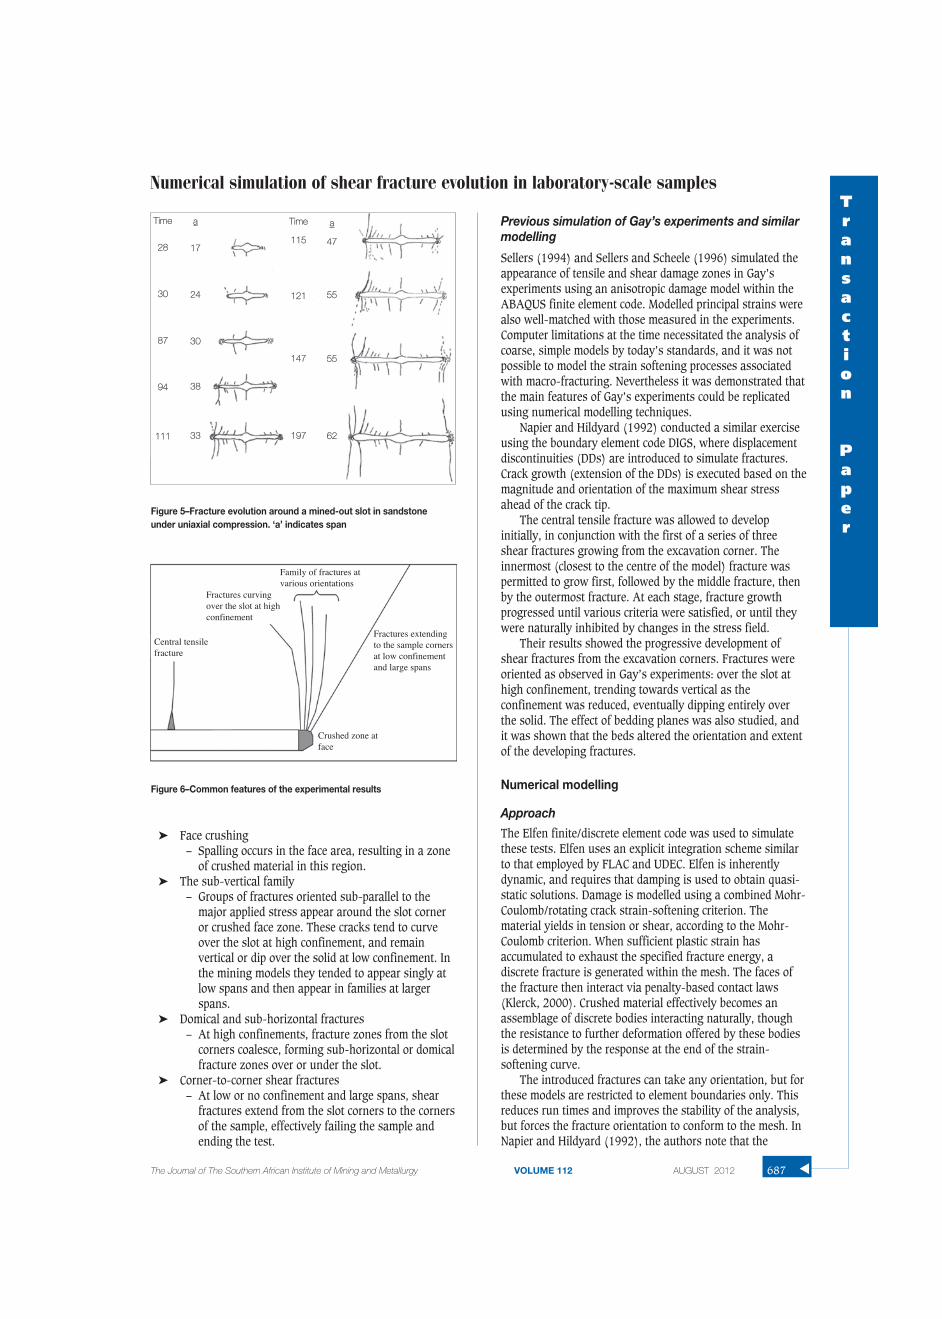
The fracture evolution for a sandstone sample mined outfrom a central drill hole is shown in Figure 5. This samplewas slightly smaller than mentioned above (75 mm × 75 mm× 75 mm) and was loaded in uniaxial compression. Thevertical load was 400 kN (71.1 MPa). The major featuresobserved were spalling of the faces and sub-verticalfracturing, which appears to dip over the slot at first, andthen over the solid at much larger spans.
Common features of the fracture patterns
Figure 6 shows the locations and orientations of the fracturesexpected in the numerical results. These features can besummarized as follows:
� Central sub-vertical crack– This feature is a tensile fracture which tends to
occur either above or below the slot. In the miningmodels, the crack appears above and below the slot.
�
686 AUGUST 2012 VOLUME 112 The Journal of The Southern African Institute of Mining and Metallurgy
Figure 1—Photographic and interpreted cross-sections through sampleC13. Fractures, crush zones, and bedding planes (dashed lines) areindicated
Figure 4—Fracture patterns in sandstone for different confiningstresses: σv/σh of (a) 1.95, (b) 2.5, and (c) 2.6
(a) (b) (c)
Figure 3—Fracture maps of the front (a) and back (b) ends of sampleC18 (biaxial mining test)
(b)(a)
Figure 2—Photographic and interpreted cross-sections through sampleC17. Gross fracturing on the left side is associated with the finalcollapse of the sample and are therefore not included in the interpre-tation
� Face crushing– Spalling occurs in the face area, resulting in a zone
of crushed material in this region.� The sub-vertical family
– Groups of fractures oriented sub-parallel to themajor applied stress appear around the slot corneror crushed face zone. These cracks tend to curveover the slot at high confinement, and remainvertical or dip over the solid at low confinement. Inthe mining models they tended to appear singly atlow spans and then appear in families at largerspans.
� Domical and sub-horizontal fractures– At high confinements, fracture zones from the slot
corners coalesce, forming sub-horizontal or domicalfracture zones over or under the slot.
� Corner-to-corner shear fractures– At low or no confinement and large spans, shear
fractures extend from the slot corners to the cornersof the sample, effectively failing the sample andending the test.
Previous simulation of Gay’s experiments and similarmodelling
Sellers (1994) and Sellers and Scheele (1996) simulated theappearance of tensile and shear damage zones in Gay’sexperiments using an anisotropic damage model within theABAQUS finite element code. Modelled principal strains werealso well-matched with those measured in the experiments.Computer limitations at the time necessitated the analysis ofcoarse, simple models by today’s standards, and it was notpossible to model the strain softening processes associatedwith macro-fracturing. Nevertheless it was demonstrated thatthe main features of Gay’s experiments could be replicatedusing numerical modelling techniques.
Napier and Hildyard (1992) conducted a similar exerciseusing the boundary element code DIGS, where displacementdiscontinuities (DDs) are introduced to simulate fractures.Crack growth (extension of the DDs) is executed based on themagnitude and orientation of the maximum shear stressahead of the crack tip.
The central tensile fracture was allowed to developinitially, in conjunction with the first of a series of threeshear fractures growing from the excavation corner. Theinnermost (closest to the centre of the model) fracture waspermitted to grow first, followed by the middle fracture, thenby the outermost fracture. At each stage, fracture growthprogressed until various criteria were satisfied, or until theywere naturally inhibited by changes in the stress field.
Their results showed the progressive development ofshear fractures from the excavation corners. Fractures wereoriented as observed in Gay’s experiments: over the slot athigh confinement, trending towards vertical as theconfinement was reduced, eventually dipping entirely overthe solid. The effect of bedding planes was also studied, andit was shown that the beds altered the orientation and extentof the developing fractures.
Numerical modelling
Approach
The Elfen finite/discrete element code was used to simulatethese tests. Elfen uses an explicit integration scheme similarto that employed by FLAC and UDEC. Elfen is inherentlydynamic, and requires that damping is used to obtain quasi-static solutions. Damage is modelled using a combined Mohr-Coulomb/rotating crack strain-softening criterion. Thematerial yields in tension or shear, according to the Mohr-Coulomb criterion. When sufficient plastic strain hasaccumulated to exhaust the specified fracture energy, adiscrete fracture is generated within the mesh. The faces ofthe fracture then interact via penalty-based contact laws(Klerck, 2000). Crushed material effectively becomes anassemblage of discrete bodies interacting naturally, thoughthe resistance to further deformation offered by these bodiesis determined by the response at the end of the strain-softening curve.
The introduced fractures can take any orientation, but forthese models are restricted to element boundaries only. Thisreduces run times and improves the stability of the analysis,but forces the fracture orientation to conform to the mesh. InNapier and Hildyard (1992), the authors note that the
Numerical simulation of shear fracture evolution in laboratory-scale samplesTransaction
Paper
687The Journal of The Southern African Institute of Mining and Metallurgy VOLUME 112 AUGUST 2012 �
Figure 5–Fracture evolution around a mined-out slot in sandstoneunder uniaxial compression. ‘a’ indicates span
Figure 6–Common features of the experimental results
Time
28
30
87
94
111
a
17
24
30
38
33
Time
115
121
147
197
a
47
55
55
62
Central tensilefracture
Crushed zone atface
Fractures extending to the sample corners at low confinement and large spans
Fractures curvingover the slot at highconfinement
Family of fractures atvarious orientations
Numerical simulation of shear fracture evolution in laboratory-scale samples
‘process of shear growth comprises a complex sub-structureof linked fractures to form a shear zone of finite thickness’and noted that they assumed that the ‘macro-zone can bemodelled as a displacement discontinuity “cut” in themedium’. In this paper the shear zone is represented by aseries of arbitrarily oriented inter-element fractures, thoughthese fractures occur at a very different scale to the real ‘sub-structure of linked fractures’. The question here, then, iswhether the shear fracturing process is adequately simulatedgiven the forcing of individual fracture orientations and theresulting scale discrepancy.
Parameters for the strain-softening model were obtainedby simulating laboratory tests performed on representativematerials. The ‘static’ and ‘mining’ experiments were thensimulated in detail and the numerical results compared withthe experimental.
Material calibration
It is important when using strain-softening material modelsto ensure that the element size is appropriately selected, is ofconstant size in the softening region, and remains constant inall models (Vermeer and de Borst, 1984; and Cundall, 1989).The controlling dimension in these models is the face length(2 mm). Previous experience with Elfen has shown that 5 to10 elements along the controlling dimension is sufficient tocapture failure processes. The mesh edge length was chosenas 0.2 mm, which gives 10 elements along the length of theface. Models contained around half a million elements andrun times were of the order of 20 to 35 hours for the largestmodels.
A material representative of typical quartzite was createdbased on a series of compressive and Brazilian tests (Chen,2008). Maraisburg quartzite was chosen as representative ofquartzite as it showed the most typical and consistentbehaviour. The average linear elastic properties and densityare:
The results from the UCS and triaxial tests performed onthe material are presented in Table I.
The UCS determined from a best fit to a Mohr-Coulombapproximation is 224 MPa (average: 227.5 MPa, standarddeviation: 38.35 MPa) and the slope of the σ1-σ3 relationship(β0) is 6.05. The values from the best fit indicate a maximumcohesion of 45.5 MPa and a friction angle of 45.75°.
UCS, triaxialand Brazilian tests were simulatednumerically. The material parameters were fine-tuned until agood match was obtained between numerical and laboratory
results. The strain-softening material curves were generatedusing the guidance of Ryder and Jager (2002). Stress-straincurves for the uniaxial tests and simulation are compared inFigure 7.
The σ1-σ3 relationships, obtained from triaxial tests andnumerical simulations, are shown in Figure 8. The strain-softening material model used to obtain these results isshown in Figure 9. From the Brazilian test results, the tensilestrength was determined as 14 MPa, with a fracture energy(Gf ) of 500 J/m2.
Limited information was supplied on the sandstone usedin Gay’s experiments. A ‘speculative’ sandstone material wasgenerated with properties obtained from Klerck et al. (2004).
�
688 AUGUST 2012 VOLUME 112 The Journal of The Southern African Institute of Mining and Metallurgy
Table I
Peak stresses and strains from UCS and triaxial tests on Maraisburg quartzite
Confining stress [MPa] Peak strength [MPa] Axial strain at failure Lateral strain at failure Equivalent lateral strain at failure for plane strain
Figure 7—Comparison of modelled unixial stress-strain response andthe laboratory test results
Figure 8—Comparison between the test data and the model results
300
250
200
150
100
50
0-1500 -500 500 1500 2500 3500 4500
Strain (microstrain)
3B Lateral strain3C Axial strain
3B Axial strain3C Lateral strain
3A Axial strainModelled axial
3A Lateral strainModelled lateral
Lateral strain Axial strain
Str
ess
(MP
a)
500
450400
350
300
250200
150
10050
0
Axi
al s
tres
s
500
0.015
0.01
0.005
0
-0.005
Peak stressAxial strain at failureTarget axial strain at failureLinear (Axial strain at failure)
0 10 20 30 40Confining stress
y = 5.8902x + 218.2
y = 8E-05x + 0.0036
Target peak stressLateral strain at failureTarget lateral strain at failureLinear (Peak stress)
Str
ain
The sandstone modelled in that paper had similar propertiesto those quoted by Gay (E = 35 GPa, υ = 0.19 and UCS ≈100 MPa). Klerck’s properties gave a slightly lower UCS, sothe cohesion was increased accordingly. Modelled sandstoneproperties are provided in Table II. Strain-softening curves asa function of plastic strain are presented in Figure 10.
Model description
The model geometry, loading, and boundary conditions forthe static tests are illustrated in Figure 11. Lateral loads wereapplied as pressure loads to stiff platens along the sides ofthe model (white arrows). Velocities were applied to theplatens at the top of the model (black arrows) with theopposite side constrained in the vertical direction (circles).
Constant velocities were applied to the platen boundaries.Analyses were run at decreasing loading rates untilconsistent results (in terms of displacement, reaction, andenergy histories; and in terms of the resulting fracturepattern and simulated strain measurements) were obtained.Staged analyses (applying load, keeping the load constant,and allowing the model to achieve steady state) were also runand it was found that the results were very similar to themodels analysed with constant velocity.
Where mining steps were modelled, blocks were removedfrom the model over a single timestep and the model then runto steady state (determined by maximum permissible valuesof velocity and energy histories), as is common practice.
Gay tested quartzite samples uniaxially (C13) and with alateral stress of 33 MPa (C17). To better investigate theeffects of confinement, models with lateral loads of 10 MPaand 100 MPa were also analysed.
Gay conducted ‘mining’ experiments on one quartzitespecimen (C18), and on a number of sandstone models. Inaddition to C18, one of the better-documented sandstoneresults is also simulated in this work (C9 - Figure 5).
Experiment C18 was performed on a quartzite samplewith a pre-cut slot of 25 mm × 10 mm. The slot was extendedsimultaneously at both faces, parallel to its long axis. Thelateral stress (parallel to the direction of mining) was 27 MPaand the axial stress was 5 times greater (135 MPa). The rateof mining imposed by Gay was variable, and self-mining wasreported.
Sample C9 was slightly smaller than the others (75 mm ×75 mm). The original excavation was a drill-hole of 5 mm
diameter. The width of the slot was measured from Gay’sFigure 7, and is estimated at 2 mm. Mining was simulated in1 mm increments. The sample was tested uniaxially with animposed axial load of 400 kN (71.1 MPa).
Numerical simulation of shear fracture evolution in laboratory-scale samplesTransaction
Paper
The Journal of The Southern African Institute of Mining and Metallurgy VOLUME 112 AUGUST 2012 689 �
Figure 9—Strain-softening parameters for the Maraisburg quartzitemodel
5045
40
35
30
25
20
15
10
5
0
Co
hes
ion
(M
Pa)
50
45
40
35
30
25
20
15
10
5
00 0.002 0.004 0.006 0.008 0.01
Plastic strain
Cohesion Friction angle Dilation angle
Fri
ctio
n a
nd
dila
tio
n a
ng
le (
°)
Table II
Sandstone properties according to Gay, Klerck et al., and the values used in the simulation
Property Gay Klerck et al. Modelled
Young’s modulus 35 GPa 28 GPa 35 MPaPoisson’s ratio 0.19 0.25 0.19 Density 2700 kg/m3 2800 kg/m3 2700 kg/m3
Figure 10—Strain-softening parameters for the sandtone model
Figure 11—Model geometry, constraints, and loading for simulation ofthe static tests, including platens on all boundaries
25
20
15
10
5
0
Co
hes
ion
(M
Pa)
60
50
40
30
20
10
00 0.005 0.01 0.015 0.02 0.025 0.03
Plastic strain
Cohesion Friction angle Dilation angle
Fri
ctio
n a
nd
dila
tio
n a
ng
le (
°)
20 mm
20 mm
2 mm
25 mm100 mm
100 mm
Numerical simulation of shear fracture evolution in laboratory-scale samples
Simulation results
Confinement tests
Simple slot models were analysed with varying levels oflateral confinement. The axial load was linearly increased ineach case. Models were also analysed with no lateralconfinement and with lateral displacement constraints alongthe boundaries (confined). The resulting fracture patterns areshown in Figure 12. These pictures were taken at differentstages of loading.
These results show a trend towards an increased numberof distinct fractures at higher confinement, and a tendencyfor the cracks to curve over the slot. In the ‘confined’ casethis even leads to the formation of sub-horizontal (sub-parallel to the slot) features. The length of the central tensilefracture is reduced with increased confinement, except for theconfined case where the central fracture appears to beassociated with the sub-horizontal features.
Test C13—Slot in quartzite subjected to increasing axialload
Test C13 was simulated uniaxially with platens as describedabove. Results for the analysis with platens are presented inFigure 13.
Certain features of the laboratory test are captured in thisresult:
� Appearance of a central tensile fracture� Face crushing� Fractures at various orientations at the slot corners� Large shear fractures extending from the sample
corners at high load.Other notable features:
� Sub-horizontal fractures extending from the centraltensile crack
� Formation of conjugate shears where the sample cornershear fractures intersect
� Extension and bifurcation of the slot-corner associatedextension fractures.
The sub-horizontal fractures were observed in thelaboratory results only when bedding planes were present. Itis not known whether these features would appear if thebedding planes were absent, though this model resultcertainly suggests that failure would occur preferentiallyalong any horizontally oriented features intersected by thecentral fracture.
The appearance of the fracturing at the end of theanalysis shows features that were not observed in test C13.However, the absence of corner-to-corner shear fractures in
Figure 1 suggests that the sample was not loaded to the samelevel as the Elfen model. The final fracture pattern issurprisingly similar to the result for sample C17 (Figure 2),where the fracturing to the left of the slot resulted in finalfailure of the sample. The laboratory result for C17 and themodelled C13 result are compared in Figure 14. The intact
�
690 AUGUST 2012 VOLUME 112 The Journal of The Southern African Institute of Mining and Metallurgy
Figure 12—Fracture patterns for simple slot models with varying levelsof confinement (‘Confined’ refers to lateral displacement constraints)
Unconfined 10 MPa 33 MPa 100 MPa Confined
Figure 13–Fracture patterns for simulation of test C13 (uniaxially-loadedquartzite)
Figure 14–Interpreted final fracture pattern from lab test C17 comparedto the model result for simulation of C13
95.5 MPa 109.3 MPa
116.4 MPa116.2 MPa
122.9 MPa 135.2 MPa
diamond shape formed between the slot corner fractures andthe intersection of the sample corner fractures is captured inthe model result, though in the C17 result the slot corner iseffectively shifted upwards by the presence of the bedding-plane-associated sub-horizontal fracturing. Fractures ‘inside’(boundary-side) the corner shears are also replicated.
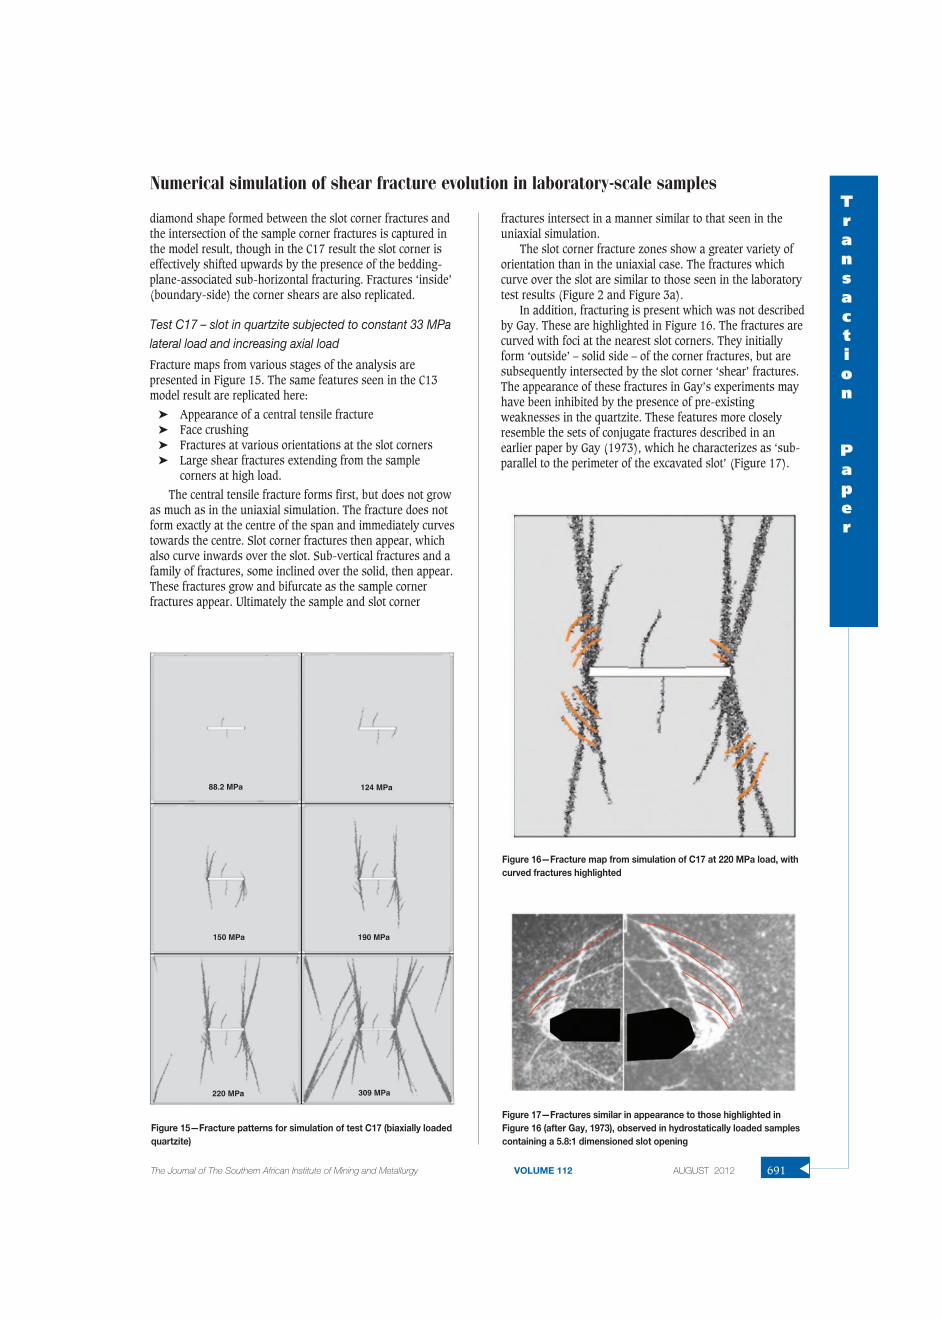
Test C17 – slot in quartzite subjected to constant 33 MPalateral load and increasing axial load
Fracture maps from various stages of the analysis arepresented in Figure 15. The same features seen in the C13model result are replicated here:
� Appearance of a central tensile fracture� Face crushing� Fractures at various orientations at the slot corners� Large shear fractures extending from the sample
corners at high load.
The central tensile fracture forms first, but does not growas much as in the uniaxial simulation. The fracture does notform exactly at the centre of the span and immediately curvestowards the centre. Slot corner fractures then appear, whichalso curve inwards over the slot. Sub-vertical fractures and afamily of fractures, some inclined over the solid, then appear.These fractures grow and bifurcate as the sample cornerfractures appear. Ultimately the sample and slot corner
fractures intersect in a manner similar to that seen in theuniaxial simulation.
The slot corner fracture zones show a greater variety oforientation than in the uniaxial case. The fractures whichcurve over the slot are similar to those seen in the laboratorytest results (Figure 2 and Figure 3a).
In addition, fracturing is present which was not describedby Gay. These are highlighted in Figure 16. The fractures arecurved with foci at the nearest slot corners. They initiallyform ‘outside’ – solid side – of the corner fractures, but aresubsequently intersected by the slot corner ‘shear’ fractures.The appearance of these fractures in Gay’s experiments mayhave been inhibited by the presence of pre-existingweaknesses in the quartzite. These features more closelyresemble the sets of conjugate fractures described in anearlier paper by Gay (1973), which he characterizes as ‘sub-parallel to the perimeter of the excavated slot’ (Figure 17).
Numerical simulation of shear fracture evolution in laboratory-scale samplesTransaction
Paper
The Journal of The Southern African Institute of Mining and Metallurgy VOLUME 112 AUGUST 2012 691 �
Figure 15—Fracture patterns for simulation of test C17 (biaxially loadedquartzite)
Figure 16—Fracture map from simulation of C17 at 220 MPa load, withcurved fractures highlighted
Figure 17—Fractures similar in appearance to those highlighted inFigure 16 (after Gay, 1973), observed in hydrostatically loaded samplescontaining a 5.8:1 dimensioned slot opening
88.2 MPa
150 MPa
220 MPa
124 MPa
190 MPa
309 MPa
Numerical simulation of shear fracture evolution in laboratory-scale samples
Modelling was undertaken to replicate this result. Acylindrical sample containing a slot was subjected to thesame loading conditions as in the experiment. The resultingmodelled fracture pattern is shown in Figure 18. Both‘perimeter-parallel’ and shear fractures are evident in theresult, indicating that the curved fractures observed in thesimulation of test C17 are part of the conjugate system ofshears that naturally occur around biaxially stressedopenings. These features are obviously inhibited in Gay’suniaxial and biaxial experiments, possibly by preferentialshear cracking sub-parallel to the major stress, or by thepresence of bedding planes in the samples. In the models,these features occur only in the confined samples, which arecloser to the hydrostatic loading in Gay’s former experiments.
A separate simulation of test C17 was run with loadapplied in discrete stages, just as reported by Gay. Duringeach stage, load is increased and the model allowed to returnto steady state. The strain measurements by Gay arecompared with strain measurements at the same positions inthe simulation. The measured and modelled strains arecompared in Figure 19.
With the exception of gauge A, all the modelled gaugesreflect the trends observed in the experiment – a decrease inε2 (i.e. increasingly compressive) and an increase in ε1 (i.e.increasingly tensile). In most cases, the rate of increase issimilar, but the initial values are quite different. Since themonitored regions are undamaged at this loading stage, itseems that either the modelled Young’s modulus is higherthan that of the sample, or that some non-linear materialbehaviour was evident in the sample at low strain.
The readings from gauge A did not agree well with themodel results. Crucial to interpreting this particular reading isknowledge of the degree of damage present during loadingstages I-VI (see Gay’s Figure 3). This measurement point isdirectly in the path of the central tensile fracture. Themeasured strains attain a maximum at an applied stress of 65 MPa, suggesting that the tensile crack reaches themeasurement point at this stress level. In the model, thecrack appears only at 75 MPa, and does not reach themeasurement position for the 98 MPa applied load. Thisimplies that the tensile strength or fracture energy capacity ofthe material are lower than that modelled. This is of courseinferred from the readings only – it was not possible to trackthe development of the crack in the physical test. It is alsopossible that the measurements reflect the initial portion ofthe response, prior to the appearance of the central tensilefracture; however, the high initial tensile strains in bothprincipal directions argue against this.
All indications are that the C17 sample was weaker andpossibly less stiff than quoted. It may be possible to matchthe inferred sequence of failure in the experiment byadjusting the material parameters; however, the beddingplanes should also be included in the model. Since the
�
692 AUGUST 2012 VOLUME 112 The Journal of The Southern African Institute of Mining and Metallurgy
Figure 18—Interpreted and modelled fracture pattern for a hydrostat-ically loaded cylindrical sample containing a slot
Figure 19—Measured and modelled principal strains for simulation of test C17
Str
ain
(mic
rost
rain
)
600
400
200
0
-200
-400
-600Applied stress (MPa)
50 55 60 65 70 75 80 85 90 95 100
Gage A
Modelled ε1 Modelled ε2 Measured ε1 Measured ε2
Str
ain
(mic
rost
rain
)
1500
1000
500
0
-500
-1000
-1500
-2000
-2500
Applied stress (MPa)
50 55 60 65 70 75 80 85 90 95 100
Gage B
Modelled ε1 Modelled ε2 Measured ε1 Measured ε2
Str
ain
(mic
rost
rain
)
3000
2000
1000
0
-1000
-2000
-3000
-4000Applied stress (MPa)
Gage C
Modelled ε1 Modelled ε2 Measured ε2 Measured ε1
Str
ain
(mic
rost
rain
)
1000
500
0
-500
-1000
-1500
-2000Applied stress (MPa)
50 55 60 65 70 75 80 85 90 95 100
Gage D
Modelled ε1 Modelled ε2 Measured ε1 Measured ε2
50 55 60 65 70 75 80 85 90 95 100
locations and properties of these planes are not certain, thereare simply too many unknowns to allow such a match to beobtained in a reasonable time frame.
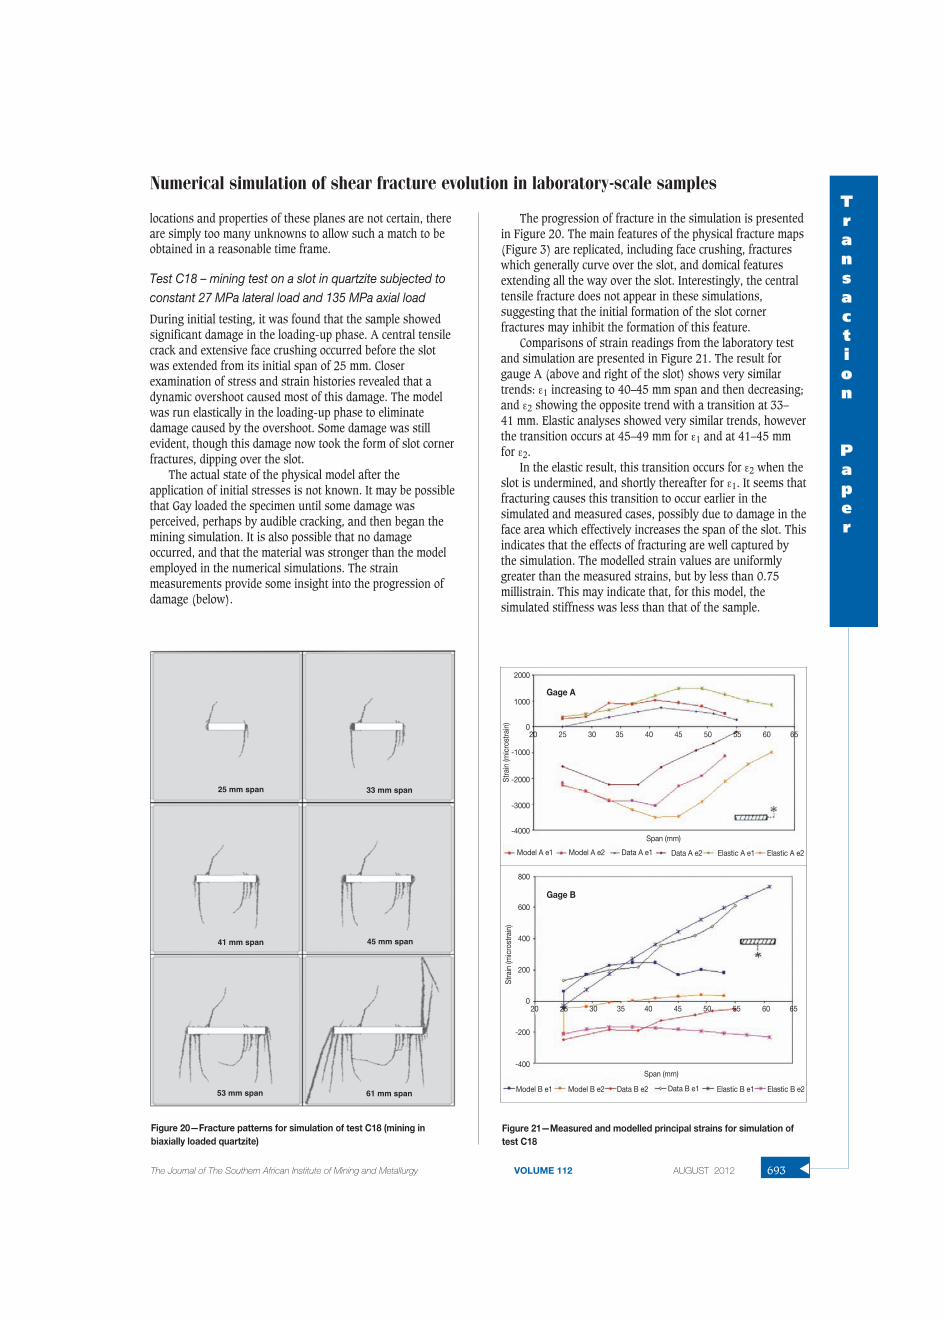
Test C18 – mining test on a slot in quartzite subjected toconstant 27 MPa lateral load and 135 MPa axial load
During initial testing, it was found that the sample showedsignificant damage in the loading-up phase. A central tensilecrack and extensive face crushing occurred before the slotwas extended from its initial span of 25 mm. Closerexamination of stress and strain histories revealed that adynamic overshoot caused most of this damage. The modelwas run elastically in the loading-up phase to eliminatedamage caused by the overshoot. Some damage was stillevident, though this damage now took the form of slot cornerfractures, dipping over the slot.
The actual state of the physical model after theapplication of initial stresses is not known. It may be possiblethat Gay loaded the specimen until some damage wasperceived, perhaps by audible cracking, and then began themining simulation. It is also possible that no damageoccurred, and that the material was stronger than the modelemployed in the numerical simulations. The strainmeasurements provide some insight into the progression ofdamage (below).
The progression of fracture in the simulation is presentedin Figure 20. The main features of the physical fracture maps(Figure 3) are replicated, including face crushing, fractureswhich generally curve over the slot, and domical featuresextending all the way over the slot. Interestingly, the centraltensile fracture does not appear in these simulations,suggesting that the initial formation of the slot cornerfractures may inhibit the formation of this feature.
Comparisons of strain readings from the laboratory testand simulation are presented in Figure 21. The result forgauge A (above and right of the slot) shows very similartrends: ε1 increasing to 40–45 mm span and then decreasing;and ε2 showing the opposite trend with a transition at 33–41 mm. Elastic analyses showed very similar trends, howeverthe transition occurs at 45–49 mm for ε1 and at 41–45 mmfor ε2.
In the elastic result, this transition occurs for ε2 when theslot is undermined, and shortly thereafter for ε1. It seems thatfracturing causes this transition to occur earlier in thesimulated and measured cases, possibly due to damage in theface area which effectively increases the span of the slot. Thisindicates that the effects of fracturing are well captured bythe simulation. The modelled strain values are uniformlygreater than the measured strains, but by less than 0.75millistrain. This may indicate that, for this model, thesimulated stiffness was less than that of the sample.
Numerical simulation of shear fracture evolution in laboratory-scale samplesTransaction
Paper
The Journal of The Southern African Institute of Mining and Metallurgy VOLUME 112 AUGUST 2012 693 �
Figure 20—Fracture patterns for simulation of test C18 (mining inbiaxially loaded quartzite)
25 mm span
41 mm span
53 mm span
33 mm span
45 mm span
61 mm span
Figure 21—Measured and modelled principal strains for simulation oftest C18
Gage A
Span (mm)
20 25 30 35 40 45 50 55 60 65
Model A e1 Model A e2 Data A e1 Data A e2 Elastic A e1 Elastic A e2
Stra
in (m
icro
stra
in)
2000
1000
0
-1000
-2000
-3000
-4000
Gage B
Span (mm)
20 25 30 35 40 45 50 55 60 65
Model B e1 Model B e2 Data B e2 Data B e1 Elastic B e1 Elastic B e2
Stra
in (m
icro
stra
in)
800
600
400
200
0
-200
-400
Numerical simulation of shear fracture evolution in laboratory-scale samples
The simulation of gauge B also shows similar trends tothe experiment, but there are some notable differences. Thefirst two points of the response (at 25 mm span) reflect thechange in strain due to the appearance of a slot cornerfracture. Both ε1 and ε2 are significantly increased (i.e.become less compressive) when this occurs: simulated ε1approaches the measured strain, while simulated ε2 becomesless compressive than measured. The strain changes at theinitial span show that the onset of fracturing at the slotcorners decreases the deviatoric strain at centre-span, butincreases the magnitude of the tensile strain.
Subsequent trends are similar, but ε2 shows a measuredincrease and a modelled decrease from 37–42 mm span. Themeasurements correlate well with the elastic model result. Inthe fracture simulation, a central tensile crack did not appear;however, a growing zone of plastic damage was present,which may account for the decrease in the strain history.According to the interpretation of strains above, the centraltensile fracture did not occur in the sample test for themonitored span range. A central sub-vertical fracture can beseen in the fracture map (Figure 3); however, this fracturewas slightly off-centre and hence out-of-line with themeasurement point.
It seems likely that the C18 material was stronger thanestimated by Gay.
Test C9 – mining test on a slot in sandstone subjected toconstant 71.1 MPa axial load
A significant amount of microfracture-associated damageoccurred in the first stage of the analysis, where the samplewas in fact a solid block without the drill-hole. Fracturingoccurred immediately when the drill hole was excavated. Asthis was not observed in the laboratory results, it is possiblethat the material was stronger than indicated in Gay’s paper.
It may also be that some lateral confinement was applied.A number of analyses were therefore performed with
various material strengths and loading conditions. Analyseswere conducted with applied lateral stresses of zero(uniaxial), 10 MPa (7.1:1) and 20 MPa (3.6:1). Due tofracturing in the first excavation stage (creating the drillhole) the material UCS was increased to 135 MPa and thetensile strength increased to 13.5 MPa (10 per cent of UCS).
The main features of the laboratory experiment (Figure 5)were:
� A sub-vertical central fracture of limited length (<9 mmlong)
� Multiple short (< 7 mm) fractures dipping over the slot� Longer sub-vertical fractures dipping in both directions
at spans greater than 40–50 mm.
The latter stages of the analysis, where presumably thesample failed, are not reported on.
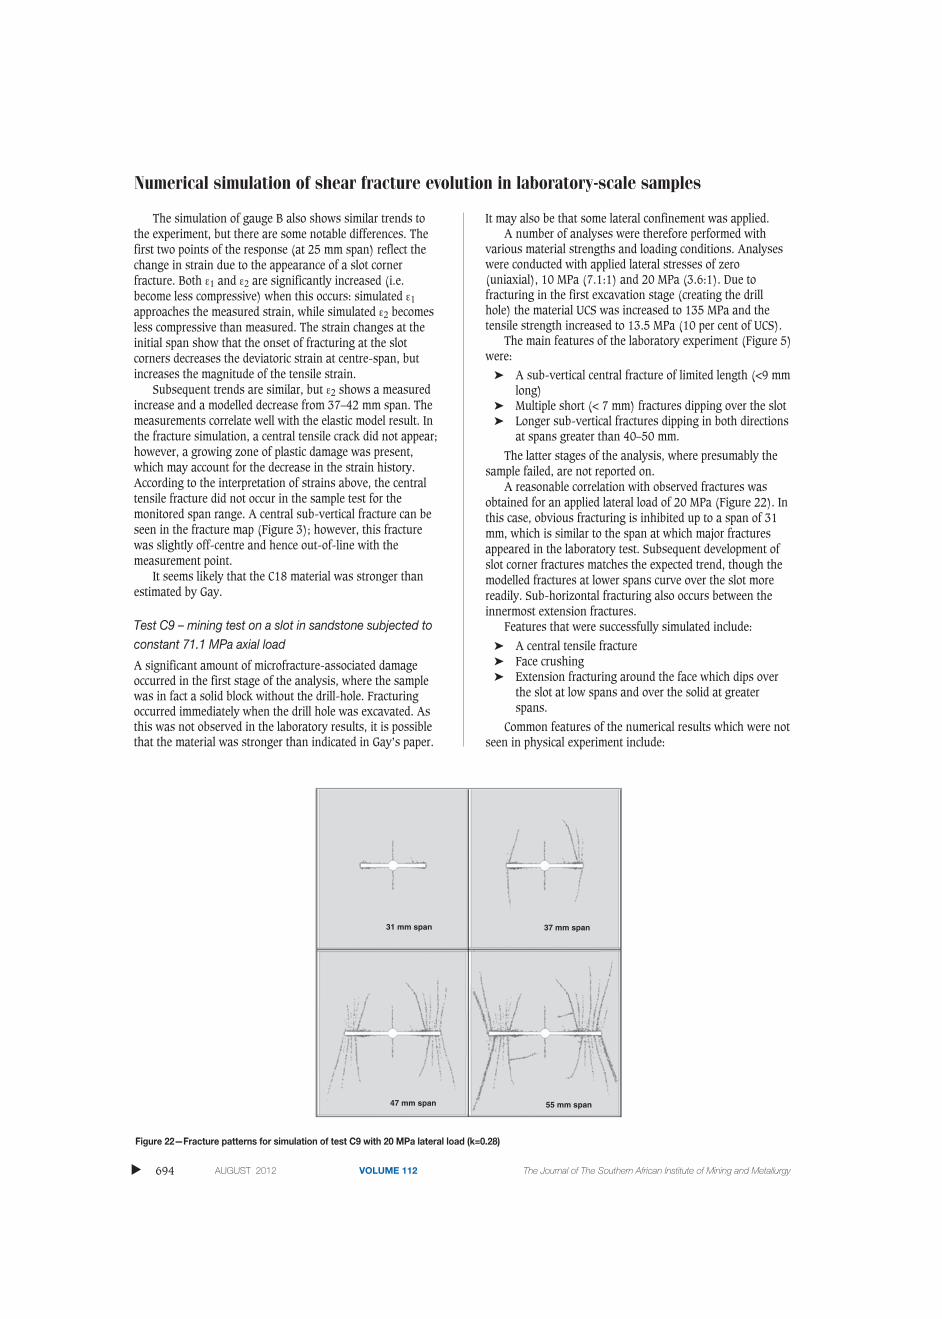
A reasonable correlation with observed fractures wasobtained for an applied lateral load of 20 MPa (Figure 22). Inthis case, obvious fracturing is inhibited up to a span of 31mm, which is similar to the span at which major fracturesappeared in the laboratory test. Subsequent development ofslot corner fractures matches the expected trend, though themodelled fractures at lower spans curve over the slot morereadily. Sub-horizontal fracturing also occurs between theinnermost extension fractures.
Features that were successfully simulated include:
� A central tensile fracture� Face crushing� Extension fracturing around the face which dips over
the slot at low spans and over the solid at greaterspans.
Common features of the numerical results which were notseen in physical experiment include:
�
694 AUGUST 2012 VOLUME 112 The Journal of The Southern African Institute of Mining and Metallurgy
Figure 22—Fracture patterns for simulation of test C9 with 20 MPa lateral load (k=0.28)
31 mm span 37 mm span
47 mm span 55 mm span
� Sub-horizontal fracturing generally occurring over thecentre of the span
� Sample corner fractures linking with slot cornerfractures.
These features were not observed in the laboratory up toa span of 62 mm. Either the material was significantlystronger than quoted in Gay’s report, or the loadingconditions were altered in such a way that significant lateralconfinement was applied to the sample.
Conclusions and recommendations
Many of the characteristic features of the experimentalresults were replicated in the numerical models. Thefollowing trends were observed, which were consistent withtheoretical models and with the experimental results.
� Crushing ahead of the face� The formation of a sub-vertical tensile fracture at
centre-span� The formation of groups or families of fractures
originating from the crushed face zone and orientedsub-parallel to the major principal stress direction.These fractures:– Curve over the slot at high lateral loads, and at low
extraction ratios– Dip over the solid at low lateral loads, and at high
extraction ratios.� The formation of large corner-to-corner fractures which
precede sample failure� Linking of slot corner and sample corner fractures
leading to sample failure.Other features were also observed that were not reported
by Gay, including:
� The appearance of curved fractures, concentricallyoriented around the crushed zone (Figure 16)
� Fracturing oriented perpendicular (i.e. sub-horizontal)to the major applied stress direction.
In the case of the ‘sub-horizontal’ fracturing, Gay didobserve such fractures, but they were associated with thepresence of bedding or pyrite bands within the material. Thepresence of similarly oriented fracturing in the simulationsimplies that fracturing will be directed along such featureswhere they are present. Domical features were reported byGay, and replicated in these results, though in the modelsthese features appeared at lower confinements than expected.
The curved fractures were not reported in theexperiments. These cracks appear to be conjugates to theexpected shear fractures that occur sub-parallel to the majorstress. It was found that these features were present in earlierexperiments by Gay (1973) and that they naturally occuraround hydrostatically (and possibly biaxially) stressedopenings. The experiments where these fractures wereobserved were simulated and replicated.
Gay noted that his quartzite samples contained pre-existing planes of weakness which influenced the fracturepatterns and may have altered the material properties andfailure mode. It was apparent that the physical samples werequite different from each other and that the tests could not besimulated using a single material for all the models. Forexample, C17 appeared to be weaker than the modelledMaraisburg quartzite, while C18 was probably stronger than
the simulated material. C9 (the sandstone sample) was alsoprobably much stronger than quoted by Gay, though it ispossible that this strengthening may have been due to theapplication of some confinement to the sample.
The presence of these pre-existing features may also havecontributed to the differences between the experimental andsimulated strain measurements. Trends observed in thestrain measurements were, nevertheless, reasonably wellmatched, with the exception being gauges that were locatedvery close to the path of the central tensile fracture, asexplained above. It was evident that the evolution of thecentral tensile fracture was not captured precisely in thesimulation; however, this could have been better matched byadjusting the material properties, particularly the relativevalues of the tensile and shear strength.
The question remains as to whether the simulatedfractures, made up of many single-element discontinuities atvarious orientations, adequately represent the real macrofractures, which are built up of these features at a muchsmaller scale than in the models. Investigations are currentlyunder way to compare the characteristics of fracture planesthat occur in the models (as above), to ‘natural’, cracks thatare predefined during model construction.
References
CHEN, J.F. 2008. Results of rock properties tests. Report 2008. AngloGoldAshanti -01. 10 December 2008. Rocklab.
CUNDALL, P.A. 1989. Numerical experiments on localization in frictionalmaterials. Archive of Applied Mechanics (IngenieurArchiv).
GAY, N.C. 1973. Fracture growth around openings in thick-walled cylinders ofrock subjected to hydrostatic compression. International Journal of RockMechanics and Mining Sciences and Geomechanical Abstracts, vol. 10. pp. 209–233.
GAY, N.C. 1976. Fracture growth around openings in large blocks of rocksubjected to uniaxial and biaxial compression. International Journal ofRock Mechanics and Mining Sciences and Geomechical Abstracts, vol. 13.pp. 231–243.
KLERCK, P.A. 2000. The finite element modelling of discrete fracture in quasi-brittle materials. PhD thesis, University of Wales, Swansea.
KLERCK, P.A., SELLERS, E.J., and OWEN, D.R.J. 2004. Discrete fracture in quasi-brittle materials under compressive and tensile stress states. ComputerMethods in Applied. Mechanics and. Engineering, vol. 193. pp. 3035–3056.
LENHARDT, W.A. and HAGAN, T.O. 1990. Observations and possible mechanismsof pillar-associated seismicity at great depth. International Deep MiningConference, vol. 2: Technical Challenges in Deep Level Mining.Ross-Watt,D.A.J. and Robinson, P.D.K. (eds). The South African Institute of Miningand Metallurgy. Johannesburg, 1990. pp. 1193–1194.
NAPIER, J.A.L and HILDYARD, M.W. 1992. Simulation of fracture growth aroundopenings in highly stressed, brittle rock. Journal of the South AfricanInstitute of Mining and Metallurgy, vol. 92, no. 6. pp. 159–168.
RYDER, J.A. and JAGER, A.J. 2002. A Textbook On Rock Mechanics For TabularHard Rock Mines. Safety in Mines Research Advisory Committee. TheSouth African Institute of Mining and Metallurgy, Johannesburg.
SELLERS, E.J. 1994. An anisotropic damage model for rock. PhD thesis,University of Cape Town.
SELLERS, E.J. AND SCHEELE, F. 1996. Prediction of anisotropic damage inexperiments simulating mining in Witwatersrand Quartz blocks.International Journal of Rock Mechanics and Mining Sciences andGeomechical Abstracts, vol. 33, no. 7.
VERMEER, P.A. AND DE BORST, R. 1984. Non-associative Plasticity for Soils,Concrete and Rock. Heron, Rotterdam. �
Numerical simulation of shear fracture evolution in laboratory-scale samplesTransaction
Paper
The Journal of The Southern African Institute of Mining and Metallurgy VOLUME 112 AUGUST 2012 695 �


![SHEAR FRACTURE ON THE BASIS OF FRACTURE MECHANICS ... · PDF fileShear fracture on the basis of fracture mechanics 23 Otto-Graf-Journal Vol. 16, 2005 [11]. The axisymmetric punch-through](https://static.documents.pub/doc/80x56/5a789df77f8b9a1f128da7e4/shear-fracture-on-the-basis-of-fracture-mechanics-fracture-on-the-basis-of-fracture.jpg)


