Page 1
1
NUTRITIONAL STATUS OF
CHILDREN IN INDIA
Dr. B. Sesikeran, MD, FAMS
Director
National Institute of Nutrition (Indian Council of Medical Research)
Hyderabad – 500 604E-mail: [email protected]
Page 2
Perinatal
18%
Others
32%
Ac. Res. Inf.
19%
Malaria
5% Measles
7%
Diarrhoea
19%
Impact of undernutrition among preschool children:
Source: Murray & Lopez, 1996: Pelletier et al, 1993
Malnutrition54%
The direct or indirect cause of child death is undernutrition in
about 54% total deaths
Page 3
3
INFECTION AND UNDERNUTRITION
….. a Vicious Cycle
UNDERNUTRITION
INFECTION
Reduced
Food
intake/
absorption
Lowered
resistance/
Frequent
infections
Death
Page 4
4
Infant Mortality Rate (Per 1000 Live Births) in India
and South-east Asian Countries
Source : WHO/SEARO 2000
8577
72 69
5954
1712
0
20
40
60
80
100
IMR
Pakis
tan
Bhuta
n
Nep
al
India
Mal
dives
Ban
gladesh
SriLanka
Ker
ala
58 *
* SRS, Registrar General of India, 2004
*
Page 5
5
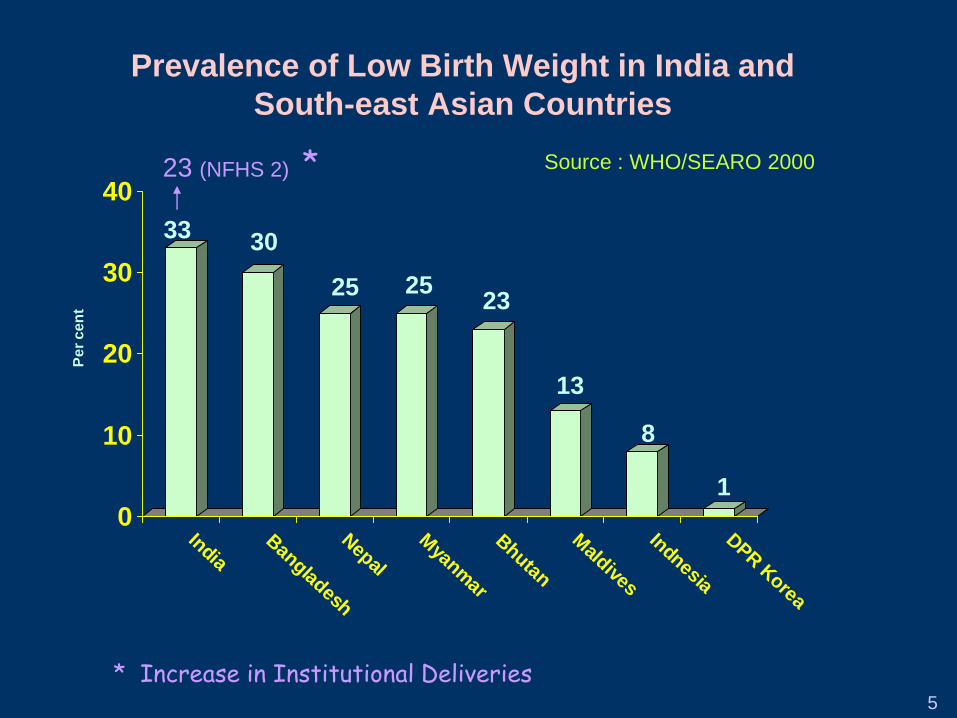
Prevalence of Low Birth Weight in India and
South-east Asian Countries
Source : WHO/SEARO 2000
3330
25 2523
13
8
1
0
10
20
30
40
Pe
r c
en
t
IndiaBangladesh
Nepal
Myanm
ar
Bhutan
Maldives
Indnesia
DPR
Korea
23 (NFHS 2) *
* Increase in Institutional Deliveries
Page 6
6
Andhra
Pradesh
Madhya
Pradesh
Maharashtra
Karnataka
Kerala Tamilnadu
Orissa
West
Bengal
Uttar
Pradesh
Gujarat
NATIONAL NUTRITION MONITORING BUREAU
(Estd: 1972)
Objectives of NNMB
1.Assessment of Nutritional
status of various
communities by adopting
standardized procedures
and techniques
2.Periodical evaluation of
National Nutrition programs
operation in India
Page 7
7
Average Daily Food Intake (% RDA) among
1-3 Year Children : By Gender
31
32
19
18
26
31232
21987
6917
1435
3680
74
0 50 100 150 200
Sugar & Jaggery
Fats & Oils
Milk & Milk Prod.
Roots & Tubers
Other Veg.
Green Leafy Veg.
Pulses
Cereals BoysGirls
Percent RDA
Page 8
8
Median Intake of Nutrients (as % RDA) Among
1-3 year children : By gender
6058
3230
6156
4343
67
671414
3835
4040
5754 87
83
0 25 50 75 100 125
F.Folic Acid
Vitamin C
Niacin
Riboflavin
Thiamin
Vitamin A
Iron
Calcium
Energy
Protein BoysGirls
Percent of RDA
Page 9
9
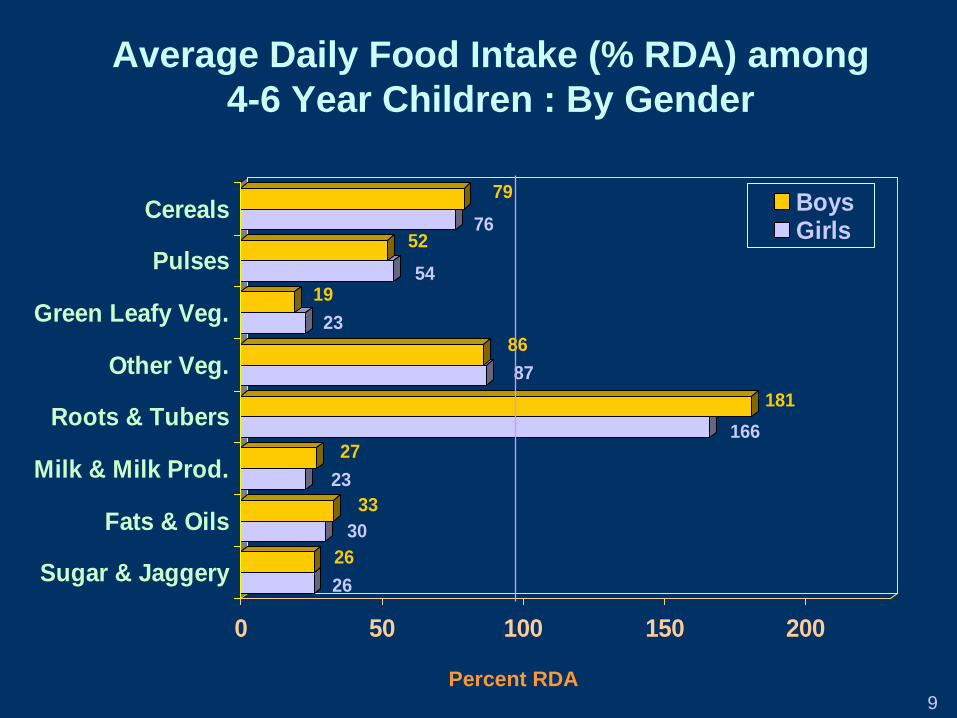
Average Daily Food Intake (% RDA) among
4-6 Year Children : By Gender
26
26
30
33
23
27166
181
87
8623
1954
5276
79
0 50 100 150 200
Sugar & Jaggery
Fats & Oils
Milk & Milk Prod.
Roots & Tubers
Other Veg.
Green Leafy Veg.
Pulses
Cereals BoysGirls
Percent RDA
Page 10
10
Median Intake of Nutrients (as % RDA)
Among 4-6 year children : By gender
64
6636
3765
683030
67
6716
173738
4952
5759 87
90
0 25 50 75 100 125
F.F.Acid
Vitamin C
Niacin
Riboflavin
Thiamin
Vitamin A
Iron
Calcium
Energy
Protein BoysGirls
Percent of RDA
Page 11
11
0
20
40
60
80
100
% R
DI
DISTRIBUTION OF MICRONUTRIENT INTAKES
IN CHILDREN - % RDI
Riboflavin 76.1 11.4 2.6
Vitamin A 87.4 3.8 8.8
Iron 71.4 13.4 15.2
F.F.Acid 31.5 24.2 44.3
<50% RDA 50-70% RDA >=70% RDA
Page 12
12
Distribution (%) of Households According to Dietary
Energy Adequacy Status of Adults Vs ChildrenDIETARY ENERGY
INTAKEAGE GROUP
ADULTMALE
ADULTFEMALE
CHILD
PRE-SCHOOL
SCHOOLAGE
ADOLESCENT
75-79 2001 2006 2001 2006 2001 2006
+ + + 31.1 31.1 22.1 47.3 27.9 61.6 43.2
+ + - 21.4 42.9 51.8 27.4 45.4 13.2 27.0
+ - + 2.3 1.4 0.5 1.4 00.6 2.1 1.4
+ - - 6.5 4.2 3.8 2.2 3.6 1.4 2.8
- + + 3.8 2.9 2.0 4.7 3.0 7.3 5.7
- + - 8.4 9.3 10.6 8.8 10.3 6.2 8.6
- - + 3.4 1.0 1.3 1.2 0.6 2.2 1.3
- - - 19.1 7.2 7.5 7.0 8.6 6.0 10.0
+ : Adequate - : Inadequate ; 2 : 308.6 , p<0.001
ENERGY INADEQUACY 55.4 63.6 73.7 45.4 67.9 26.8 48.4
Source: NNMB
Page 13
13
Prevalence (%) of Undernutrition Among 1-5 yr children
According to SD Classification (<Median - 2SD): By Gender
55 55
5052
16 15
0
20
40
60
Underweight Stunting Wasting
Boys
Girls
Perc
en
t
Page 14
14
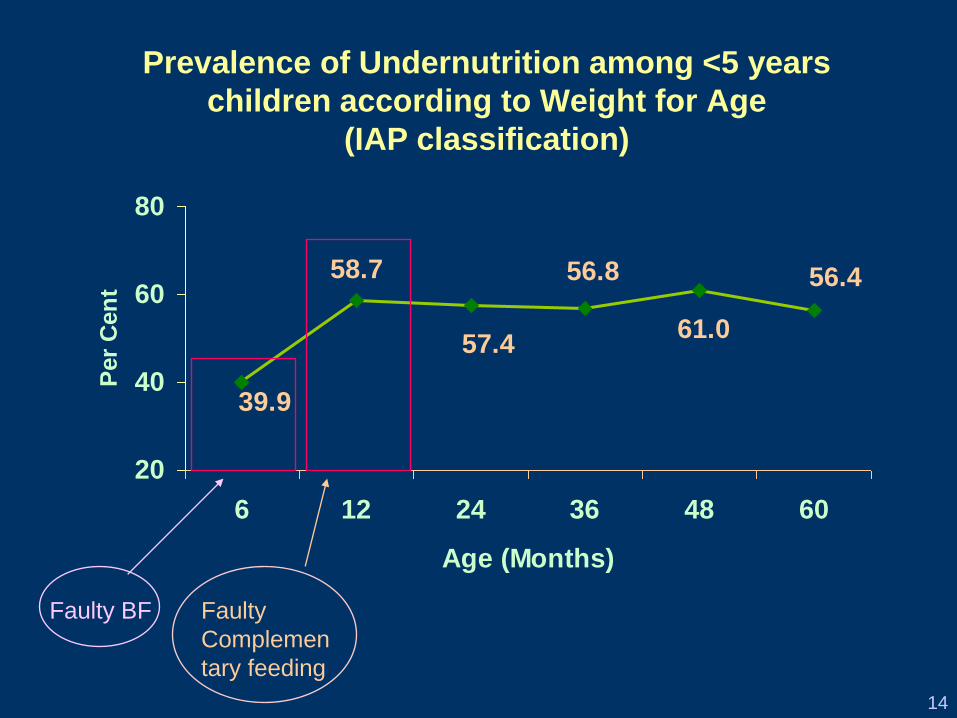
Prevalence of Undernutrition among <5 years
children according to Weight for Age
(IAP classification)
39.9
56.458.7
57.4
56.8
61.0
20
40
60
80
6 12 24 36 48 60
Age (Months)
Per
Cen
t
Faulty BF Faulty
Complemen
tary feeding
Page 15
15
INFANT AND YOUNG CHILD FEEDING PRACTICES
(NFHS 3)
22
29
23
48
4046
54
62
56
0
20
40
60
80
100
Early Initiation
of BF
Exclusive BF
Upto 6 months
Compl. Feeding
among 6- 9
months Children
Rural Urban Pooled
Page 16
16
MICRO-NUTRIENT DEFICIENCIES
Page 17
17
Pooled: 0.7%
< 0.5 %
0.5 %
Kerala
0
Tamil Nadu
0.5
Karnataka
0.7
Andhra Pradesh
1.2
Maharashtra
1.3
Madhya Pradesh
1.4
Orissa
0.3 West Bengal
0.6
Prevalence (%) of Bitot spots among1 - <5 year children
Boys: 0.9% Girls 0.6%
Page 18
18
0.7 0.7
0.6
0
0.2
0.4
0.6
0.8
1
1.2
MND-NNMB-
2003
MND-ICMR-
2001
NNMB-2006
Prevalence (%) of Bitot Spots among 1 - <5 yrs. Children
* WHO cut-off level (0.5%) of Public Health significance
Page 19
19
Distribution (%) of 1- 5 Yr. Children with Blood Vit. A Levels of
< 20 G/dL, Median Dietary Intake of Vit. A (as % RDA) and
Extent of Coverage for Suppl. of Massive Dose Vit. A – By State
STATES
Blood
Vitamin A
< 20 g/dL
Dietary
Intake of
Vitamin
A < 50%
of RDA
Receipt of Massive Dose Vitamin A
1 or 2
Doses
No. of Doses
One Two
Kerala 79.4 91.8 38.5 28.4 10.1
Tamil Nadu 48.8 81.9 50.6 20.2 30.4
Karnataka 52.1 90.4 56.6 42.1 14.5
AP 61.5 92.9 49.3 14.2 35.1
Maharashtra 54.7 88.8 52.1 29.4 22.7
MP 88.0 87.4 52.3 19.1 33.2
Orissa 57.7 77.5 80.0 38.8 41.2
West Bengal 61.2 80.6 50.6 46.8 3.8
Pooled 61.8 86.3 55.4 30.3 25.1
Source: NNMB-MND Survey : 8 States, 2003
Page 20
20
AGE / PHYSIOLOGICAL
GROUPGender
Hb
(g/dl)
6 months – 6 Years Boys & Girls <11
6 – 14 Years Boys & Girls <12
14 YearsMen <13
Women <12
Pregnant Women <11
WHO, Nutritional Anemia - TRS No. 405, Geneva 1968.
Definition of Anemia
Page 21
21
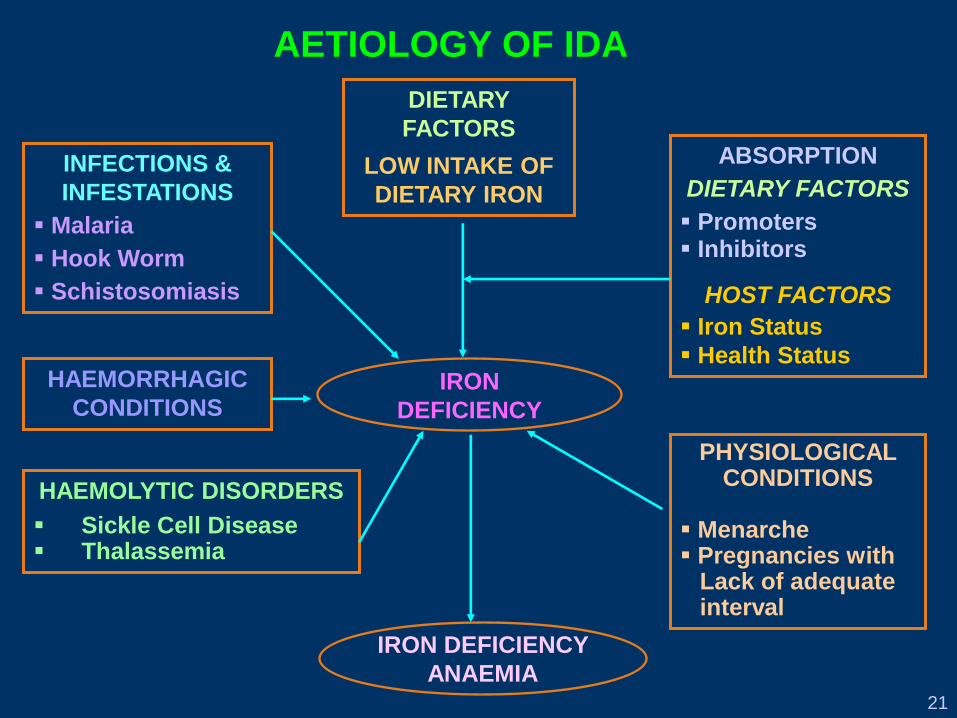
IRON
DEFICIENCY
DIETARY
FACTORS
LOW INTAKE OF
DIETARY IRON
INFECTIONS &
INFESTATIONS
Malaria
Hook Worm
Schistosomiasis
HAEMORRHAGIC
CONDITIONS
ABSORPTION
DIETARY FACTORS
Promoters Inhibitors
HOST FACTORS
Iron Status
Health Status
HAEMOLYTIC DISORDERS
Sickle Cell Disease Thalassemia
AETIOLOGY OF IDA
IRON DEFICIENCY
ANAEMIA
PHYSIOLOGICAL CONDITIONS
Menarche Pregnancies with
Lack of adequate interval
Page 22
22
32.5 31.4 30.325.7 22.3 24.8
45.2
23.7
47 47.2
24.7
43.3 41.9
45.8
41.7
20.5 20.7
45.5
31.4 30.5
8.42.8 0.6
3.04.11.81.12.1
1-5 yr B+G 12-14 YrGirls.
15-17 Yr.Girls
Preg. W Lact. W NPNL. W Men
Normal Mild Moderate Severe
10.2
0.03
11.2
0.03
11.0
0.03
9.9
0.03
10.6
0.03
Mean
±SE
Prevalence (%) of Anaemia by Age, Gender &
Physiological Groups
> 6 months < 6 months
10.7
1.99
12.6
2.09
Page 23
23
Computed from NNMB data, rural survey, 2001
IRON DENSITY TO MEET RDA
9.712.4
17.5
7.37.27.2
0 . 0
5 . 0
10 . 0
15 . 0
2 0 . 0
P r e gna nt se de nt a r y La c t a t i ng wome n Chi l dr e n: 1 - 3 y r s
Physiological groups
Iro
n (
mg
/1000 K
cals
)
required iron density available iron density
Page 24
24
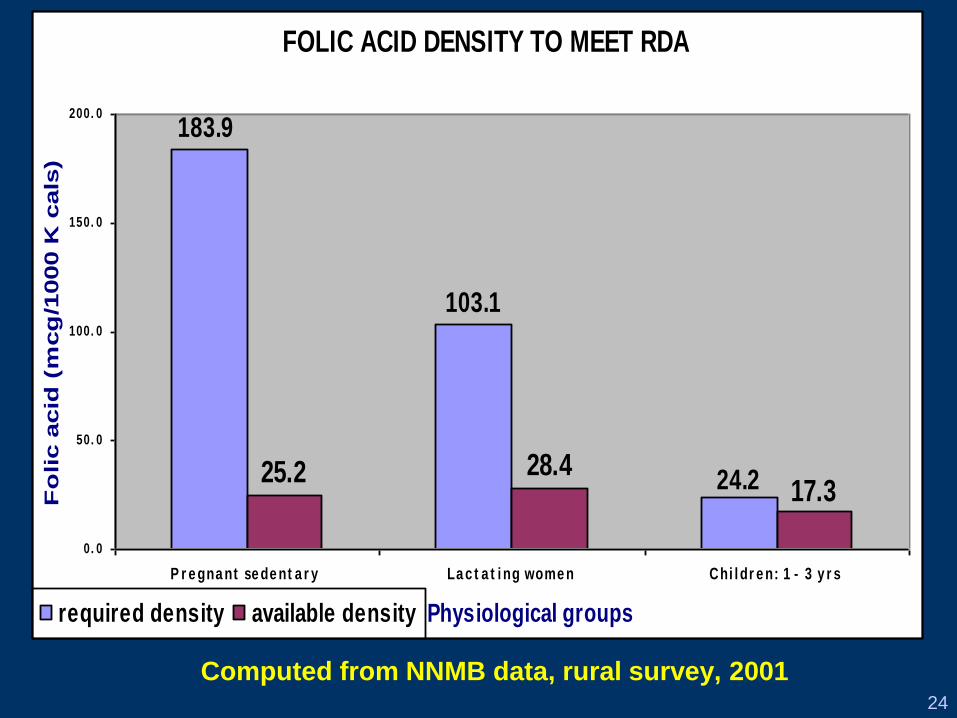
Computed from NNMB data, rural survey, 2001
FOLIC ACID DENSITY TO MEET RDA
24.2
103.1
183.9
17.328.425.2
0. 0
50. 0
100. 0
150. 0
200. 0
P r e gna nt se de nt a r y La c t a t i ng wome n Chi l dr e n: 1 - 3 y r s
Physiological groups
Fo
lic a
cid
(m
cg
/1000 K
cals
)
required density available density
Page 25
25
Total iron and body-weight of fetus
Ref: Apte and Iyengar, Br. J.Nutr. 1972, 27: 305 - 12
Page 26
26
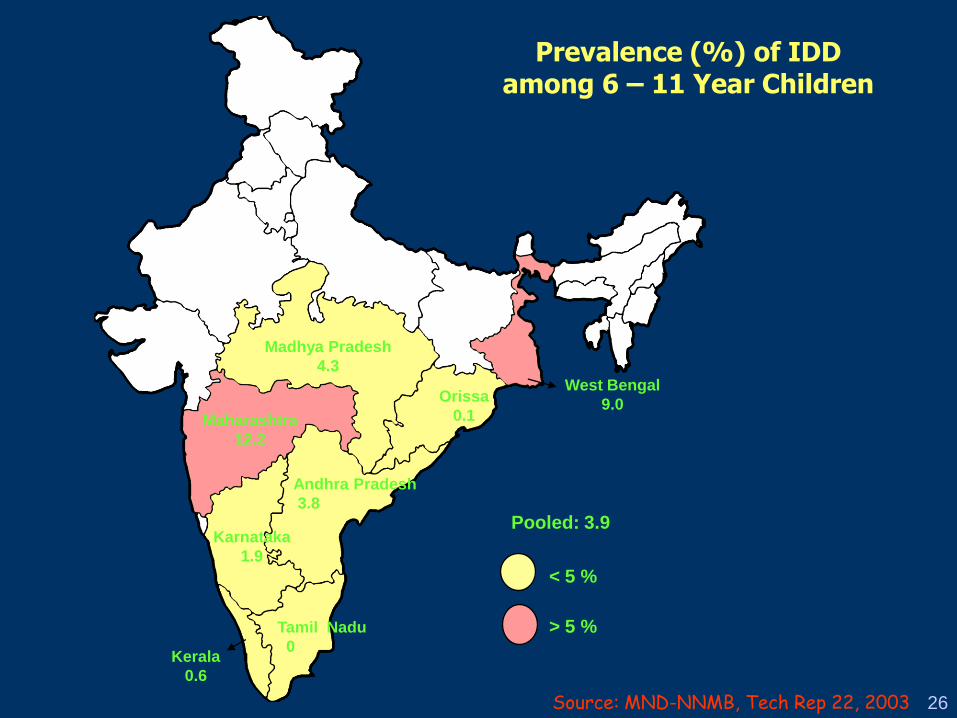
Pooled: 3.9
< 5 %
> 5 %
Kerala
0.6
Tamil Nadu
0
Karnataka
1.9
Andhra Pradesh
3.8
Maharashtra
12.2
Madhya Pradesh
4.3
Orissa
0.1
West Bengal
9.0
Prevalence (%) of IDD among 6 – 11 Year Children
Source: MND-NNMB, Tech Rep 22, 2003
Page 27
27
PREVALENCE (%) OF IDD AMONG CHILDREN (≤12 years old)
3.9
4.8
0
2
4
6
8
10
NNMB-MND, 2003 ICMR-2001
Page 28
28
54.6
49.9
29.7 29.425.6 24.4
23.3
10.1
31.3
0
10
20
30
40
50
60
70
80
WB KER AP MR TN KAR ORI MP POOLED
Percent of Households consuming salt having adequateAmount (≥15 ppm) of Iodine
* By spot test
Page 29
29
Distribution (%) of Children by Undernutrition and
Period of Survey
64
49
55
67
60
52
2123
15
0
20
40
60
80
Underweight Stunting Wasting
1988-90
2000-01
2005-06
Perc
en
t
UNDERNUTRITION (< Median - 2SD)
Page 30
30
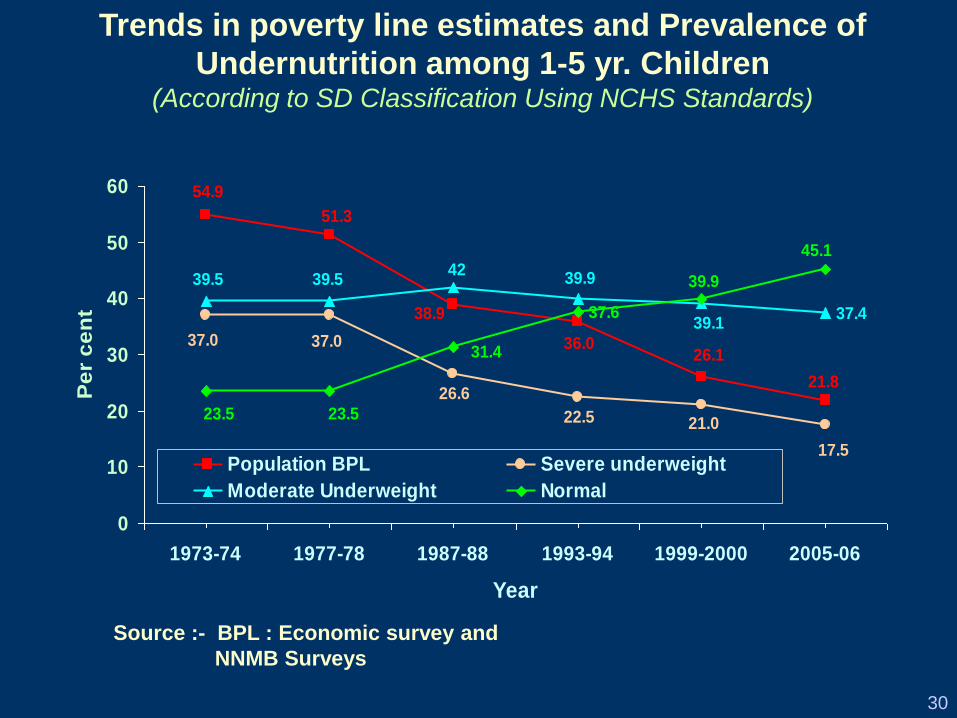
37.437.6
21.8
26.136.0
38.9
51.3
54.9
17.5
21.022.5
26.6
37.037.0
42
39.1
39.939.539.5
45.1
39.9
31.4
23.523.5
0
10
20
30
40
50
60
1973-74 1977-78 1987-88 1993-94 1999-2000 2005-06
Year
Pe
r c
en
t
Population BPL Severe underweight
Moderate Underweight Normal
Trends in poverty line estimates and Prevalence of
Undernutrition among 1-5 yr. Children (According to SD Classification Using NCHS Standards)
Source :- BPL : Economic survey and
NNMB Surveys
Page 31
31
0
5
10
15
20
25
30
35P
revale
nc
e (
%)
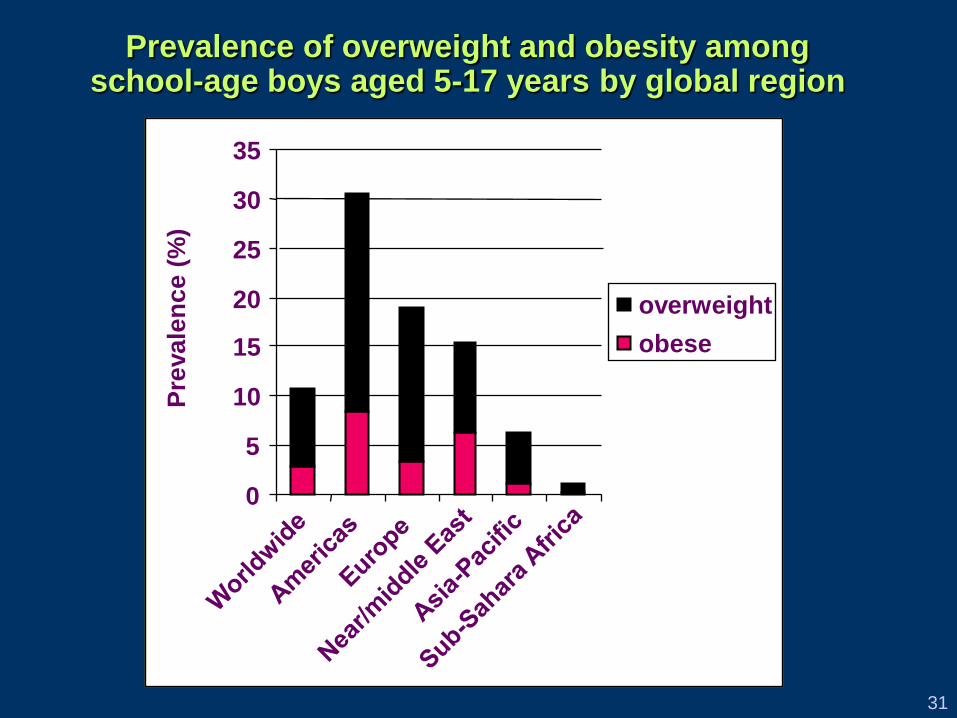
overweight
obese
Prevalence of overweight and obesity among school-age boys aged 5-17 years by global region
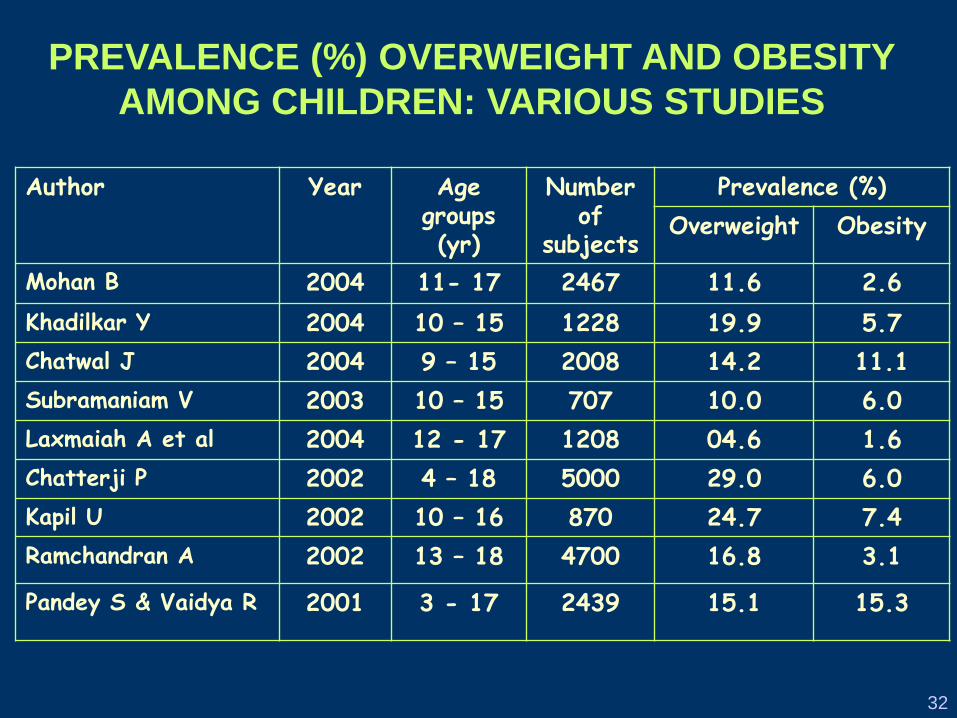
Page 32
32
Author Year Age groups (yr)
Number of
subjects
Prevalence (%)
Overweight Obesity
Mohan B 2004 11- 17 2467 11.6 2.6
Khadilkar Y 2004 10 – 15 1228 19.9 5.7
Chatwal J 2004 9 – 15 2008 14.2 11.1
Subramaniam V 2003 10 – 15 707 10.0 6.0
Laxmaiah A et al 2004 12 - 17 1208 04.6 1.6
Chatterji P 2002 4 – 18 5000 29.0 6.0
Kapil U 2002 10 – 16 870 24.7 7.4
Ramchandran A 2002 13 – 18 4700 16.8 3.1
Pandey S & Vaidya R 2001 3 - 17 2439 15.1 15.3
PREVALENCE (%) OVERWEIGHT AND OBESITY
AMONG CHILDREN: VARIOUS STUDIES
Page 33
33
Category NOverweight/
ObeseP value
TV viewing
(hrs/day)
None 143 5.6 a b
P < 0.05< 3 hrs/day 730 4.9 a b
3hrs/day 335 9.3 b
Participation in outdoor games (hrs/week)
None 526 8.4 a
P < 0.004< 6 hrs 228 6.6 a
6hrs 416 5.1 b
Participation in HH activities (hours/day)
None 221 18.6 a
P < 0.001< 3 hrs 233 4.7 b
3hrs 716 3.9 b
Prevalence of Overweight/Obesity and Physical Activity (NIN Study)
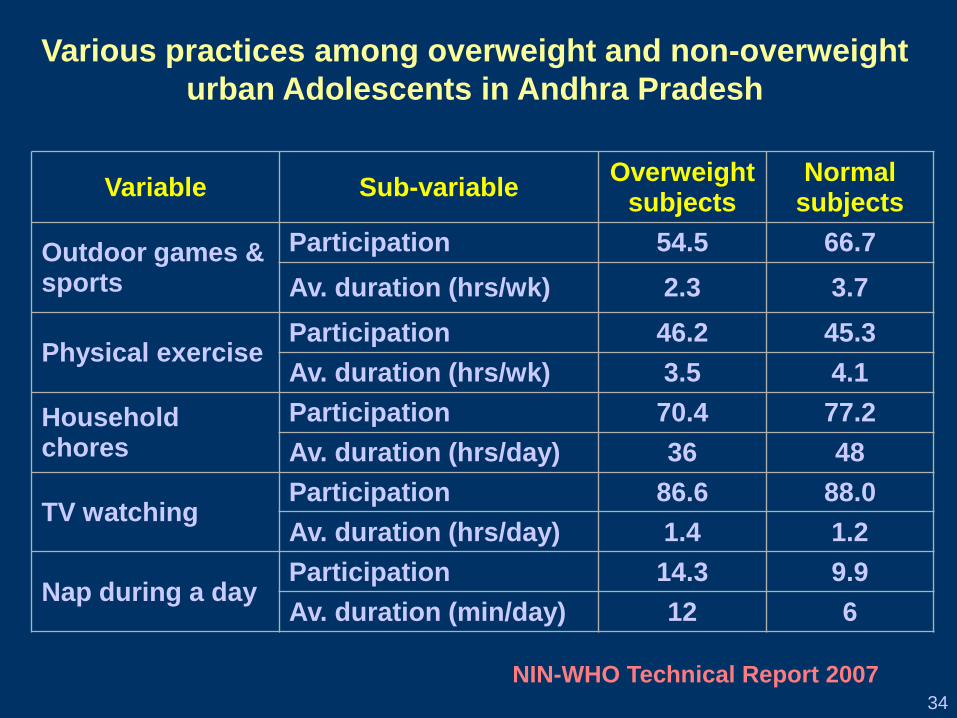
Page 34
34
Variable Sub-variableOverweight
subjectsNormal
subjects
Outdoor games & sports
Participation 54.5 66.7
Av. duration (hrs/wk) 2.3 3.7
Physical exerciseParticipation 46.2 45.3
Av. duration (hrs/wk) 3.5 4.1
Household chores
Participation 70.4 77.2
Av. duration (hrs/day) 36 48
TV watchingParticipation 86.6 88.0
Av. duration (hrs/day) 1.4 1.2
Nap during a dayParticipation 14.3 9.9
Av. duration (min/day) 12 6
Various practices among overweight and non-overweight
urban Adolescents in Andhra Pradesh
NIN-WHO Technical Report 2007
Page 35
35
VariableOverweight/
Obese Adolescents
Normal Adolescents
P value
Consumption
of Soft drinks 21.0 16.0 p < 0.05
Consumption
of soft drinks
300 ml/day
16.7 9.0 p < 0.05
Prevalence of
Hypertension
(JNC VII)
8.3 3.7 P < 0.05
Overweight/Obesity Vs Lifestyle practices (n:941)
Laxmaiah et al 2007
Page 36
36
Prevalence of Overweight in relation to
activity score.
19.7
13.1
10.5
0
5
10
15
20
25
1 2 3
Overweight %
Prevalence of Overweight
was higher in lower tertile
of physical activity. Trend
2 = 45.6, P <0.001.
Tertiles of activity score
% O
verw
eig
ht
Ramachandran et al 2002
Page 37
37
Health
financing
Prevention and control of NCD budgeted in health plan
Legislation and
Regulation
Food standards and food labelling legislation enacted
Marketing and advertising of food
Physical
Environment
Improved access to infrastructure for physical activity;
Increasing physical education hours in schools;
Improved processing and manufacturing of foods;
Creating awareness on the impact of environment;
Advocacy and
community
mobilization
Advocacy to promote healthy foods and physical activity;
NCD prevention networks established;
Community-based programmes on major NCD risk factors;
Health services Health workforce informed and provided skills;
Simple integrated prevention and treatment guidelines.
Proposed interventions feasible for implementation
within the existing or realistically increased
resources
Page 38
38
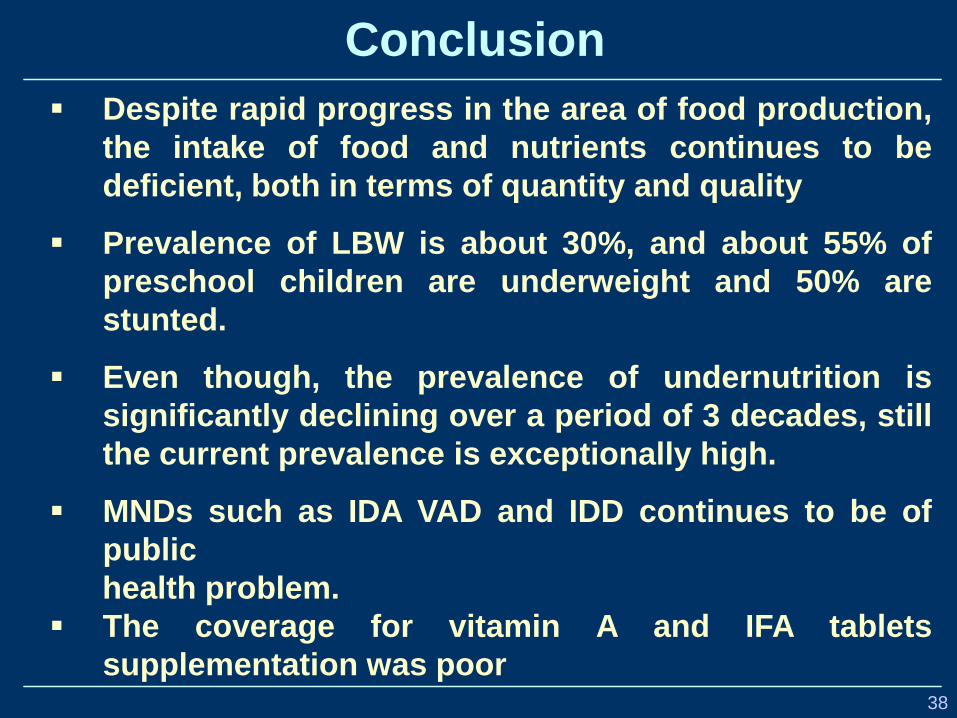
Conclusion
Despite rapid progress in the area of food production,
the intake of food and nutrients continues to be
deficient, both in terms of quantity and quality
Prevalence of LBW is about 30%, and about 55% of
preschool children are underweight and 50% are
stunted.
Even though, the prevalence of undernutrition is
significantly declining over a period of 3 decades, still
the current prevalence is exceptionally high.
MNDs such as IDA VAD and IDD continues to be of
public
health problem.
The coverage for vitamin A and IFA tablets
supplementation was poor
Page 39
39
The prevalence of overweight and obesity is
significantly increasing over a period of 3 decades
even among rural population, which is the major
independent risk factor for metabolic syndrome.
Prevalence of overweight and obesity is considerably
high, especially when Asian cut of levels were used
(≥23 BMI).
India is passing through a critical phase i.e. ‘double
burden
of disease’.
One fourth of our rural adults are suffering from
hypertension About 5-6% of the adults have IGT/DM.
Conclusion (Contd..)