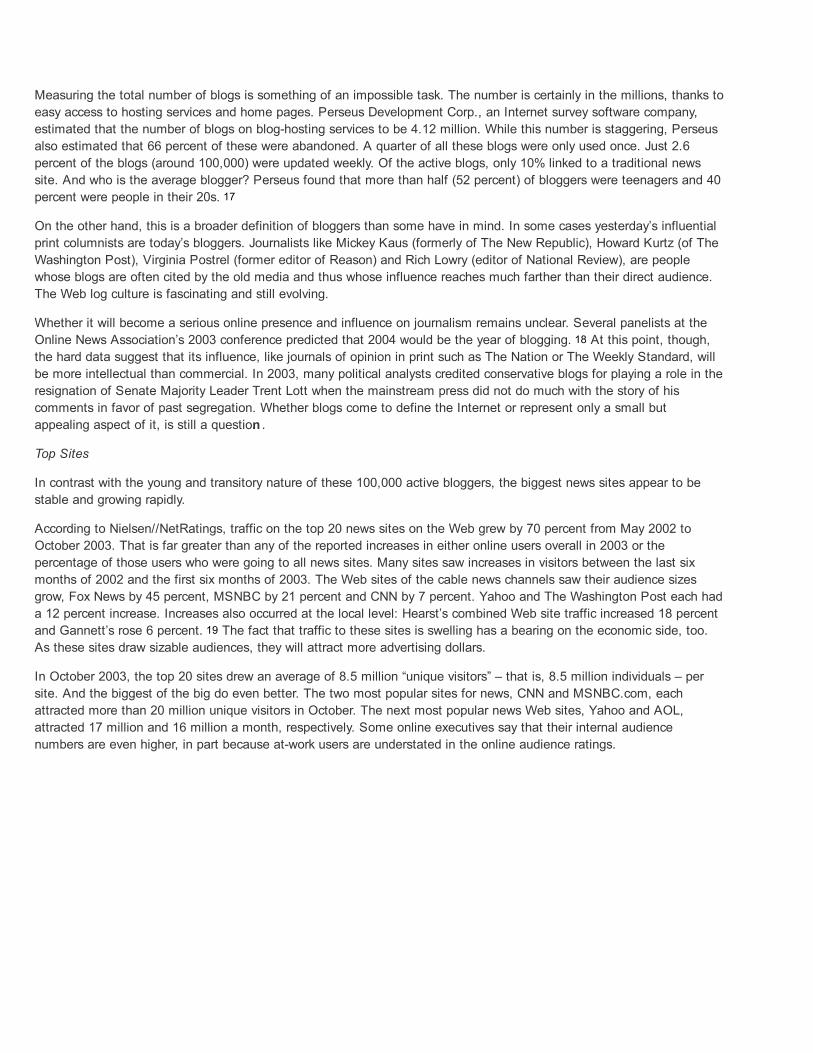
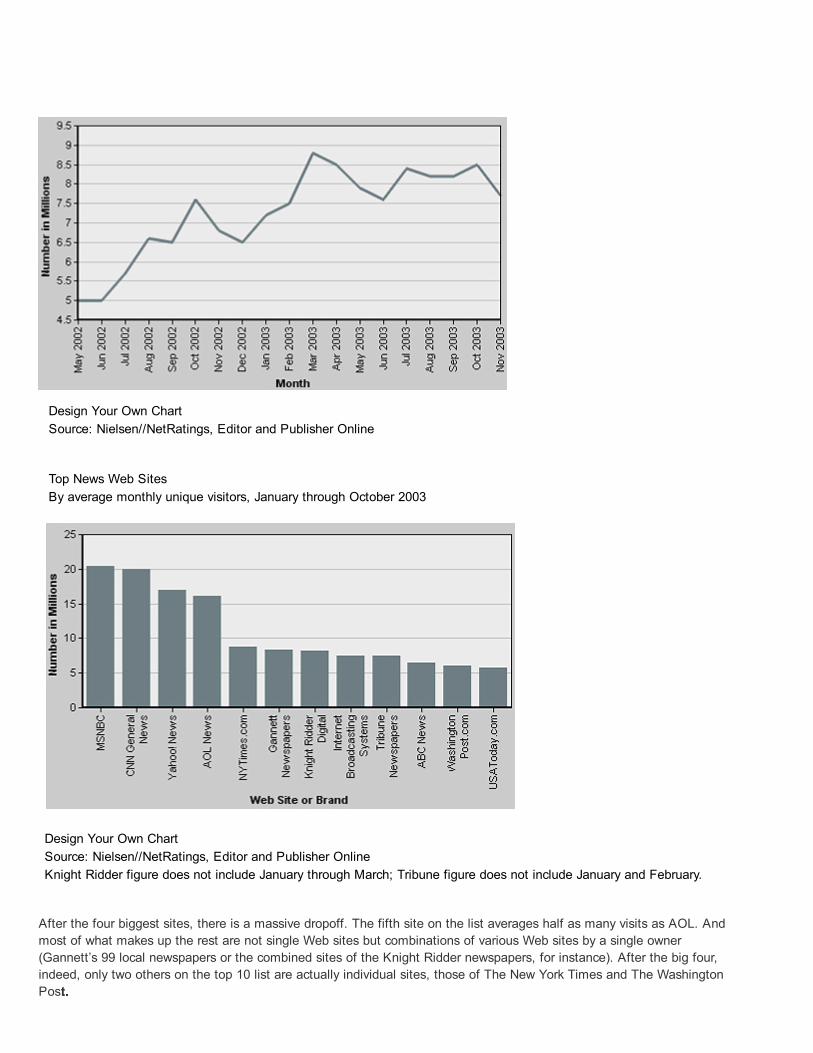
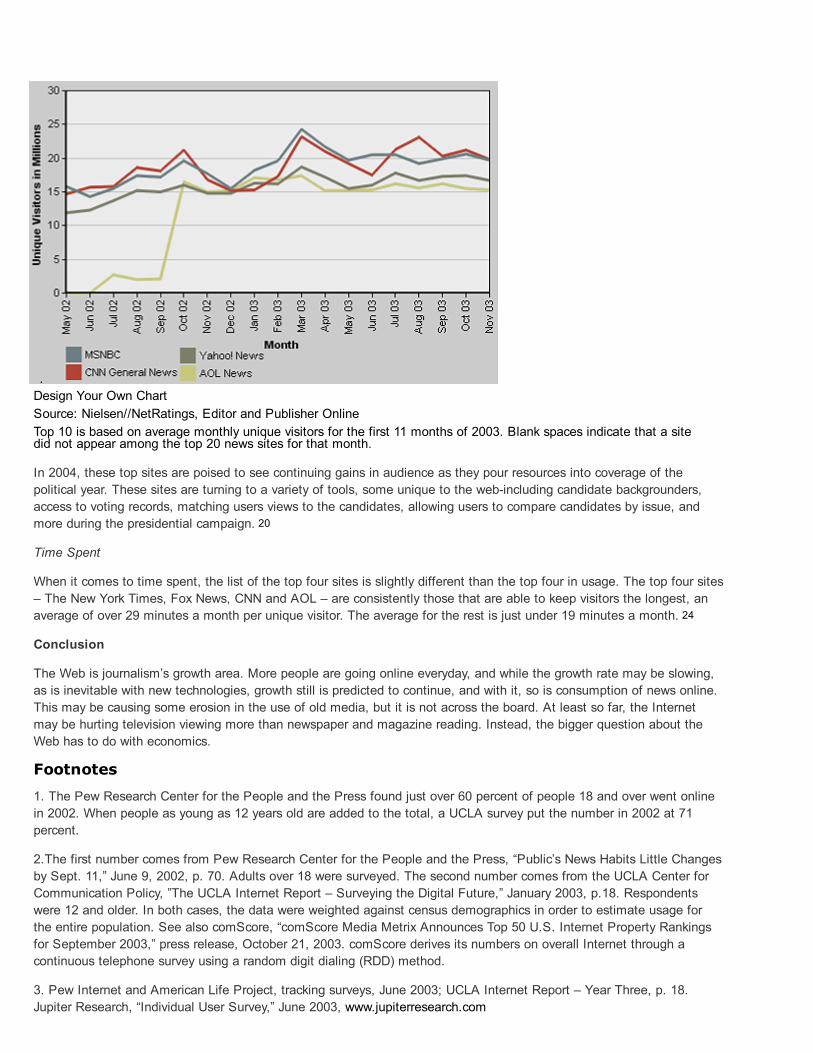
Overview – Intro Intro By the Project for Excellence in Journalism Glance at some items in the news of late and it seems that many longheld ideas about journalism are unraveling. President George Bush told ABC’s Diane Sawyer in December that he preferred to get his news not from journalists but from people he trusted, who “give me the actual news” and “don’t editorialize.” After spending time at the White House, the New Yorker writer Ken Auletta concluded that senior staff members there saw the news media as just another special interest group whose agenda was making money, not serving the public – and surveys suggest increasingly that the public agrees. Some argue that as people move online, the notion of news consumers is giving way to something called “prosumers,” in which citizens simultaneously function as consumers, editors and producers of a new kind of news in which journalistic accounts are but one element. With audiences now fragmented across hundreds of outlets with varying standards and agendas, others say the notions of a common public understanding, a common language and a common public square are disappearing. For some, these are all healthy signals of the end of oligarchical control over news. For others, these are harbingers of chaos, of unchecked spin and innuendo replacing the role of journalists as gatekeepers over what is fact, what is false and what is propaganda. Whichever view one prefers, it seems everything is changing. Or is it? This study, the first in what is to be an annual report on the state of the news media in America, is an attempt to answer this question, to take stock each year of the state and health of American journalism. The answer we arrive at in 2004 is that journalism is in the midst of an epochal transformation, as momentous probably as the invention of the telegraph or television. Journalism, however, is not becoming irrelevant. It is becoming more complex. We are witnessing conflicting trends of fragmentation and convergence simultaneously, and they sometimes lead in opposite directions. While audiences are fragmenting, we have greater capacity than ever to come together as a nation in an instant – for September 11, the Super Bowl or watching soldiers live on the battlefield in Iraq. While Americans are turning to more and varied sources for news, the media that they are relying on increasingly tend to be owned by a few giant conglomerates competing to cover what seem to be at any moment a handful of major stories. Quality news and information are more available than ever before, but in greater amounts so are the trivial, the one sided and the false. Some people will likely become better informed than they once could have been as they drill down to original sources. Other consumers may become steeped in the sensational and diverting. Still others may move toward an older form of media consumption – a journalism of affirmation – in which they seek news largely to confirm their preconceived view of the world. The journalists’ role as intermediary, editor, verifier and synthesizer is weakening, and citizens do have more power to be proactive with the news. But most people will likely do so only episodically. And the proliferation of the false and misleading makes the demand for the journalist as referee, watchdog and interpreter all the greater. These conflicting movements toward fragmentation and convergence are not new to the culture in general or media in particular, but they have different consequences when they come to news. Journalism is how people learn about the world beyond their direct experiences. As our journalism fragments, it has consequences for what we know, how we are connected and our ability to solve problems.
Transcript
Overview – IntroIntroBy the Project for Excellence in Journalism
Glance at some items in the news of late and it seems that many longheld ideas about journalism are unraveling.
President George Bush told ABC’s Diane Sawyer in December that he preferred to get his news not from journalists butfrom people he trusted, who “give me the actual news” and “don’t editorialize.” After spending time at the White House,the New Yorker writer Ken Auletta concluded that senior staff members there saw the news media as just anotherspecial interest group whose agenda was making money, not serving the public – and surveys suggest increasingly thatthe public agrees.
Some argue that as people move online, the notion of news consumers is giving way to something called “prosumers,”in which citizens simultaneously function as consumers, editors and producers of a new kind of news in whichjournalistic accounts are but one element.
With audiences now fragmented across hundreds of outlets with varying standards and agendas, others say the notionsof a common public understanding, a common language and a common public square are disappearing.
For some, these are all healthy signals of the end of oligarchical control over news. For others, these are harbingers ofchaos, of unchecked spin and innuendo replacing the role of journalists as gatekeepers over what is fact, what is falseand what is propaganda. Whichever view one prefers, it seems everything is changing.
Or is it?
This study, the first in what is to be an annual report on the state of the news media in America, is an attempt toanswer this question, to take stock each year of the state and health of American journalism.
The answer we arrive at in 2004 is that journalism is in the midst of an epochal transformation, as momentous probablyas the invention of the telegraph or television.
Journalism, however, is not becoming irrelevant. It is becoming more complex. We are witnessing conflicting trends offragmentation and convergence simultaneously, and they sometimes lead in opposite directions.
While audiences are fragmenting, we have greater capacity than ever to come together as a nation in an instant – forSeptember 11, the Super Bowl or watching soldiers live on the battlefield in Iraq. While Americans are turning to moreand varied sources for news, the media that they are relying on increasingly tend to be owned by a few giantconglomerates competing to cover what seem to be at any moment a handful of major stories.
Quality news and information are more available than ever before, but in greater amounts so are the trivial, the onesided and the false. Some people will likely become better informed than they once could have been as they drill downto original sources. Other consumers may become steeped in the sensational and diverting. Still others may movetoward an older form of media consumption – a journalism of affirmation – in which they seek news largely to confirmtheir preconceived view of the world.
The journalists’ role as intermediary, editor, verifier and synthesizer is weakening, and citizens do have more power tobe proactive with the news. But most people will likely do so only episodically. And the proliferation of the false andmisleading makes the demand for the journalist as referee, watchdog and interpreter all the greater.
These conflicting movements toward fragmentation and convergence are not new to the culture in general or media inparticular, but they have different consequences when they come to news. Journalism is how people learn about theworld beyond their direct experiences. As our journalism fragments, it has consequences for what we know, how we areconnected and our ability to solve problems.
Eight Major TrendsEight Major TrendsFor now, the year 2004, the transformation is shaped by eight overarching trends:
A growing number of news outlets are chasing relatively static or even shrinking audiences for news. Oneresult of this is that most sectors of the news media are losing audience. That audience decline, in turn, is puttingpressures on revenues and profits, which leads to a cascade of other implications. The only sectors seeing generalaudience growth today are online, ethnic and alternative media.
Much of the new investment in journalism today – much of the information revolution generally – is indisseminating the news, not in collecting it. Most sectors of the media are cutting back in the newsroom, both interms of staff and in the time they have to gather and report the news. While there are exceptions, in generaljournalists face real pressures trying to maintain quality.
In many parts of the news media, we are increasingly getting the raw elements of news as the end product.This is particularly true in the newer, 24hour media. In cable and online, there is a tendency toward a jumbled,chaotic, partial quality in some reports, without much synthesis or even the ordering of the information. There is alsoa great deal of effort, particularly on cable news, that is put into delivering essentially the same news repetitivelywithout any meaningful updating.
Journalistic standards now vary even inside a single news organization. Companies are trying to reassembleand deliver to advertisers a mass audience for news not in one place, but across different programs, products andplatforms. To do so, some are varying their news agenda, their rules on separating advertising from news and eventheir ethical standards. What will air on an MSNBC talk show on cable might not meet the standards of NBC Newson broadcast, and the way that advertising intermingles with news stories on many newspaper Web sites wouldnever be allowed in print. Even the way a television network treats news on a prime time magazine versus a morningshow or evening newscast can vary widely. This makes projecting a consistent sense of identity and brand moredifficult. It also may reinforce the public perception evident in various polls that the news media lack professionalismand are motivated by financial and selfaggrandizing motives rather than the public interest.
Without investing in building new audiences, the longterm outlook for many traditional news outletsseems problematic. Many traditional media are maintaining their profitability by focusing on costs, including cuttingback in their newsrooms. Our study shows general increases in journalist workload, declines in numbers of reporters,shrinking space in newscasts to make more room for ads and promotions, and in various ways that are measurable,thinning the product. This raises questions about the long term. How long can news organizations keep increasingwhat they charge advertisers to reach a smaller audience? If they maintain profits by cutting costs, social scienceresearch on media suggests they will accelerate their audience loss.
Convergence seems more inevitable and potentially less threatening to journalists than it may have seemeda few years ago. At least for now, online journalism appears to be leading more to convergence with older mediarather than replacement of it. When audience trends are examined closely, one cannot escape the sense that thenation is heading toward a situation, especially at the national level, in which institutions that were once in differentmedia, such as CBS and The Washington Post, will be direct competitors on a single primary field of battle – online.The idea that the medium is the message increasingly will be passé. This is an exciting possibility that offers thepotential of new audiences, new ways of storytelling, more immediacy and more citizen involvement.
The biggest question may not be technological but economic. While journalistically online appears to representopportunity for old media rather than simply cannibalization, the bigger issue may be financial. If online proves to bea less useful medium for subscription fees or advertising, will it provide as strong an economic foundation fornewsgathering as television and newspapers have? If not, the move to the Web may lead to a general decline in thescope and quality of American journalism, not because the medium isn’t suited for news, but because it isn’t suitedto the kind of profits that underwrite newsgathering.
Those who would manipulate the press and public appear to be gaining leverage over the journalists whocover them. Several factors point in this direction. One is simple supply and demand. As more outlets compete fortheir information, it becomes a seller’s market for information. Another is workload. The content analysis of the 24hournews outlets suggests that their stories contain fewer sources. The increased leverage enjoyed by news sources
has already encouraged a new kind of checkbook journalism, as seen in the television networks efforts to try to getinterviews with Michael Jackson and Jessica Lynch, the soldier whose treatment while in captivity in Iraq wasexaggerated in many accounts.
These are some of the conclusions from this new study of the state of American journalism, a study that we believe isunprecedented in its comprehensive scope. The report breaks American journalism into eight sectors – newspapers,magazines, network television, cable television, local television, the Internet, radio, and ethnic and alternative media(which are distinct from each other).
For each of the media sectors, we tried to answer basic questions in six areas: the trends in content, audience,economics, ownership, newsroom investment and public attitudes. We aggregated as much publicly available data as ispossible in one place and, for six of the sectors, also conducted an original content analysis. (For local television news,we relied on five years of content analysis the Project had previously conducted. For radio, ethnic and alternative media,no special content analysis was conducted.)
The study is the work of the Project for Excellence in Journalism, an institute affiliated with Columbia UniversityGraduate School of Journalism. The study is funded by the Pew Charitable Trusts, whose leadership challenged us totake on this assignment.. The chapters were written, with the exceptions of those on network television, cable, andnewspapers, which had coauthors, by the Project’s staff.
Our aim is for this to be a research report, not an argument. It is not our intention to try to persuade anyone to aparticular point of view. Where the facts are clear, we hope we have not shied from explaining what they reveal, makingclear what is proven versus what is only suggested. We hope, however, that we are not seen as simply taking sides inany journalistic debates.
We have tried to be as transparent as possible about sources and methods, and to make it clear when we are laying outdata versus when we have moved into analysis of that data.
We believe our approach of looking at a set of questions across various media differs from the conventional way inwhich American journalism is analyzed, one medium at a time. We have tried to identify crossmedia trends and togather in one place data that are usually scattered across different venues. We hope this will allow us and others tomake comparisons and develop insights that otherwise would be difficult to see. Across the six questions we examinedwe found some distinct patterns.
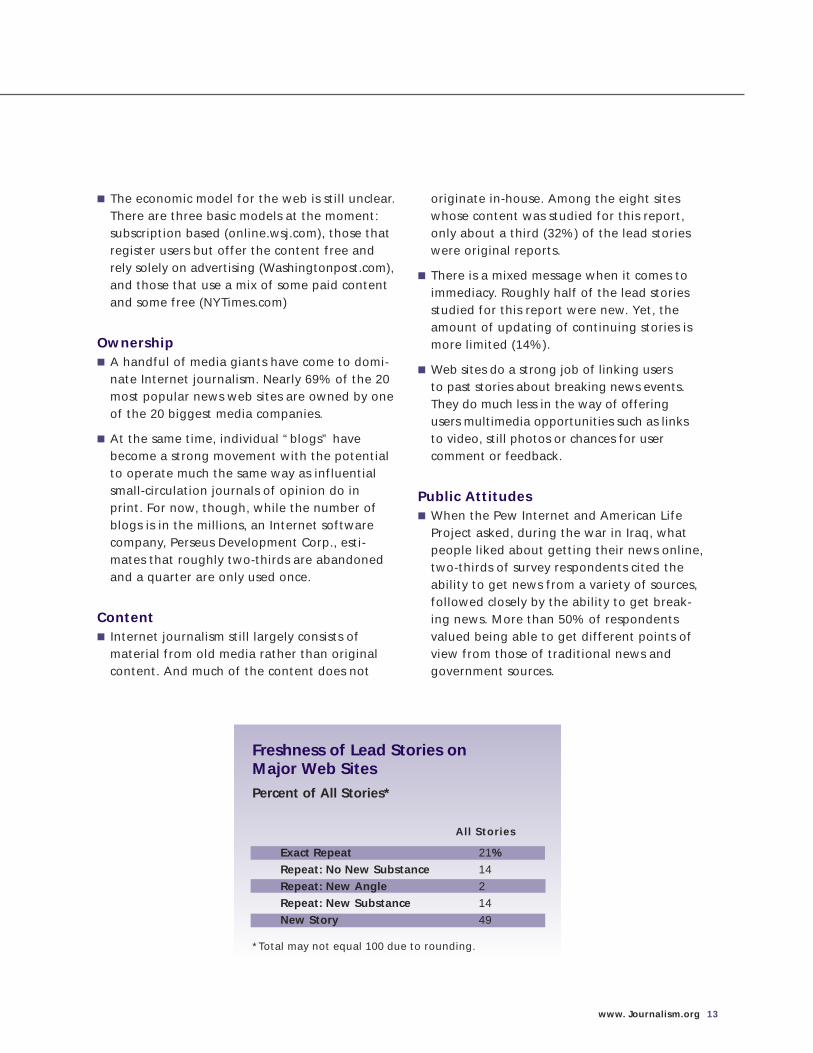
Content AnaylsisContentThe proliferation of new outlets and the increasingly instantaneous nature of newsgathering are creating three basictrends in the content of American journalism.
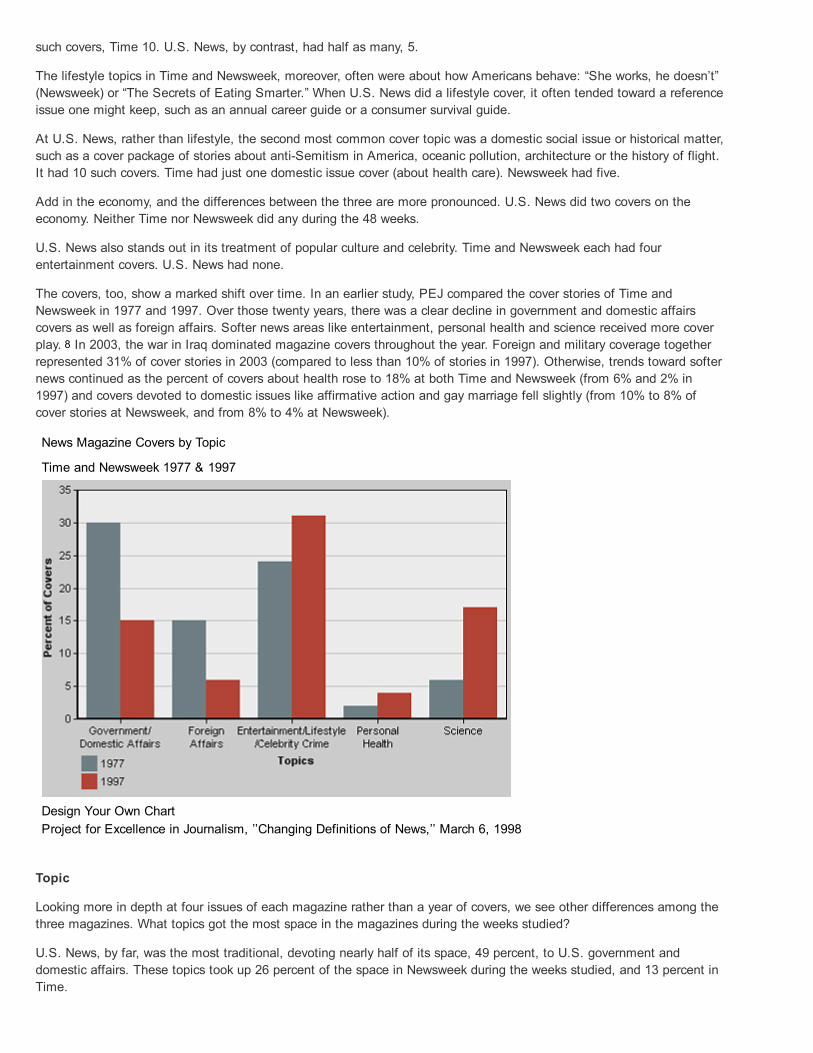
First, the content is more diverse. Network news, news magazines, and newspaper front pages carry a wider range oftopics. But a good deal of the new diversity is in lighter fare – lifestyle, entertainment, consumer news – rather thannews about diverse communities or populations. Some outlets are thriving as they reject the trend toward that lightercontent. The success of NPR in radio, The Economist among magazines and The New York Times among newspaperssuggest the possible rise of a growing elite niche across media sectors.
Second, as more outlets split up the audience and create more competition, financial pressures have led cable andbroadcast to devote more of their news holes to branding efforts such as promotions and teases, and morecommercials.
Third, to vie for audience in a more crowded 24hour news environment, there is more pressure to run with stories morequickly – to get, as mentioned above, newsgathering in the raw, and to cover ad nauseam a few big blockbuster storiessince it is cost efficient
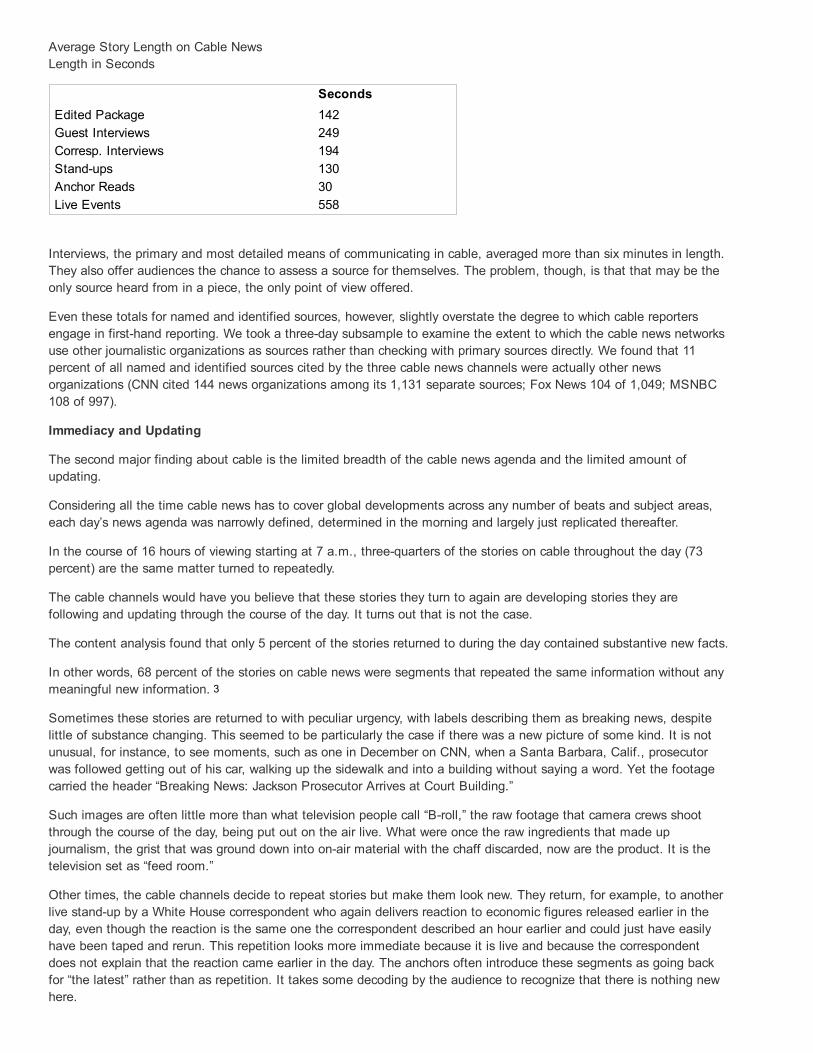
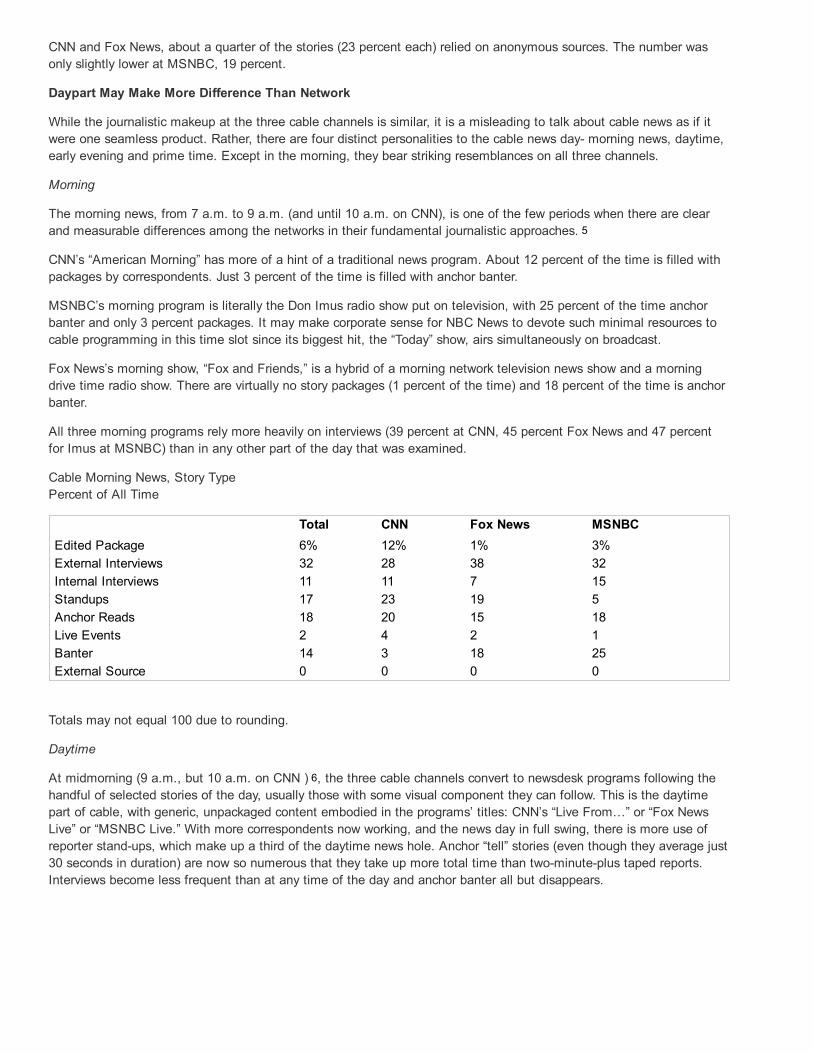
Cable news channels have largely abandoned the traditional storytelling of written and edited packages in favor of liveinterviews and reporter standups. This unscripted, extemporaneous approach to reporting does not lend itself toproducing content that will move to the Web or that will survive beyond the moment. What is more, if the purposebehind the emphasis on live reports is to offer the most uptodate information, the content often comes up short. Newson cable, and on the Internet as well, is heavily repetitive.
The cable channels in the main follow a handful of stories each day on a fairly narrow range of topics, leaving the largerpart of the news menu to anchor reads and the screen crawl.
At the risk of oversimplification, newspapers, the oldest medium, continue to have the strongest content, if for no otherreason than that they still tend to have the most reporters. This also gives them an advantage in the transition to theInternet, at least for now, because the Web for the moment remains largely a textbased medium.
News Web sites on the whole are more like newspapers in their content and in their news agenda.
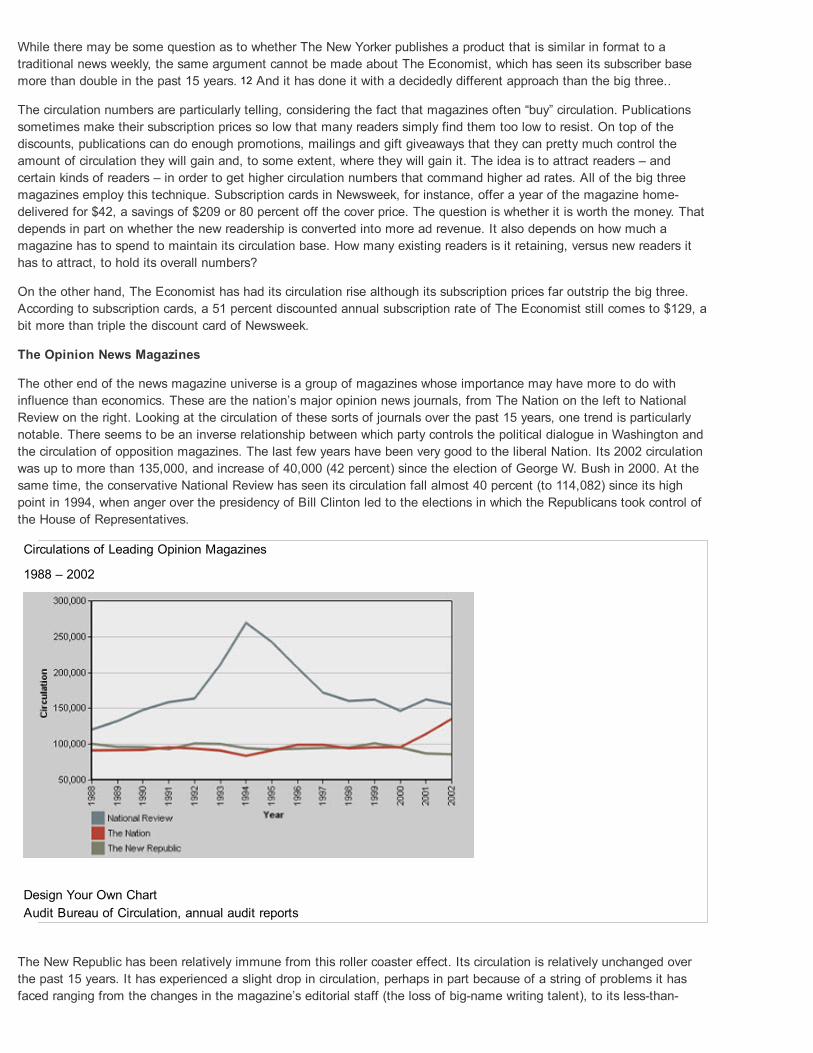
In news magazines hard news topics are losing space, while more is going to lifestyle matters like personal finance anddiet. These are not strictly news magazines anymore so much as weekly general interest publications. Meanwhile, thegrowth in magazine titles is occurring in niche specialty publications about such topics as mountain biking and dollcollecting.
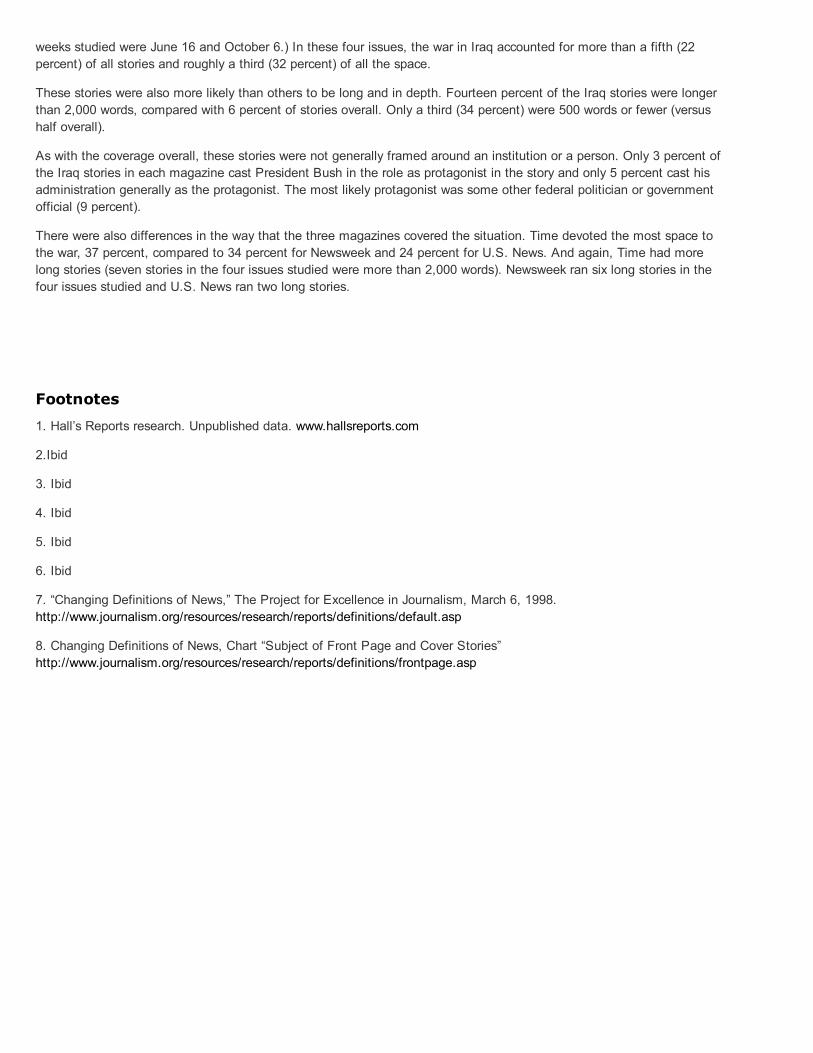
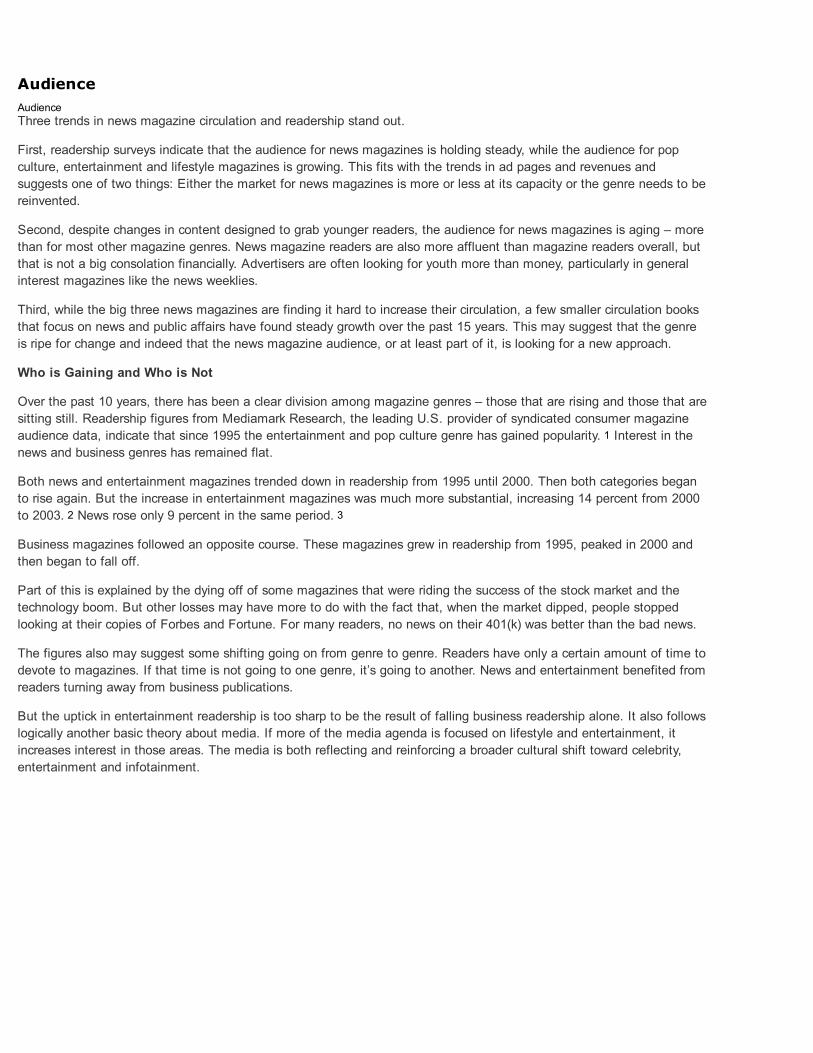
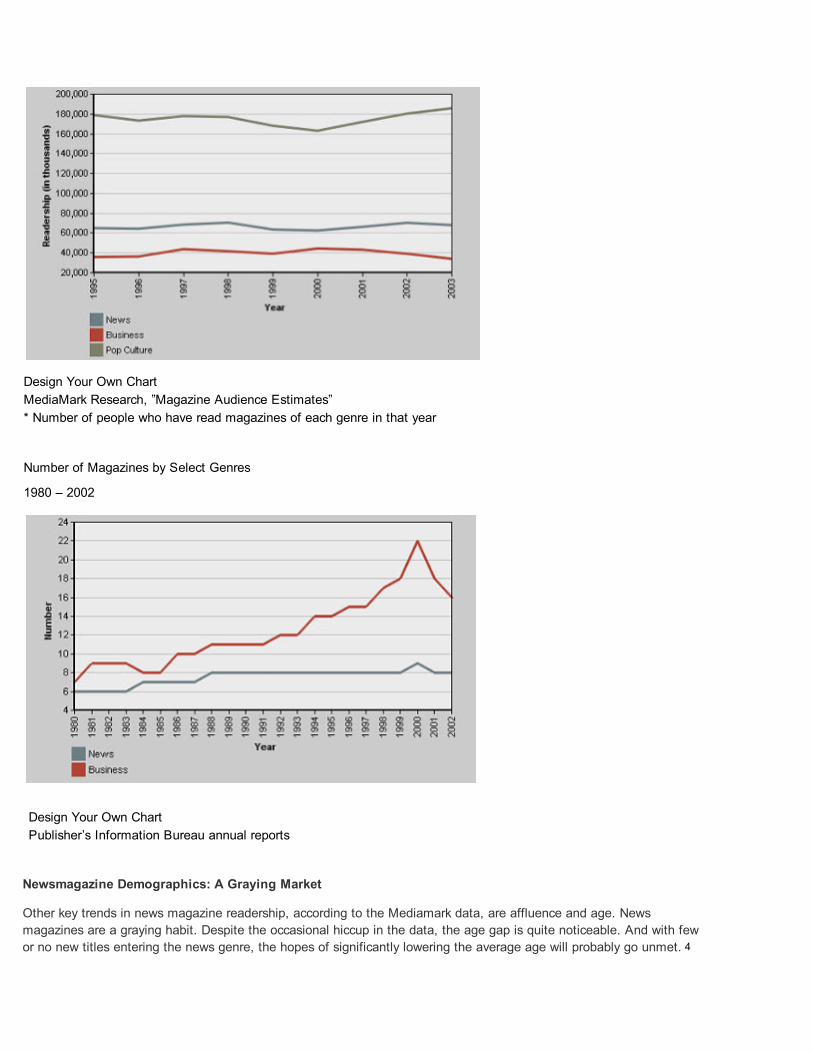
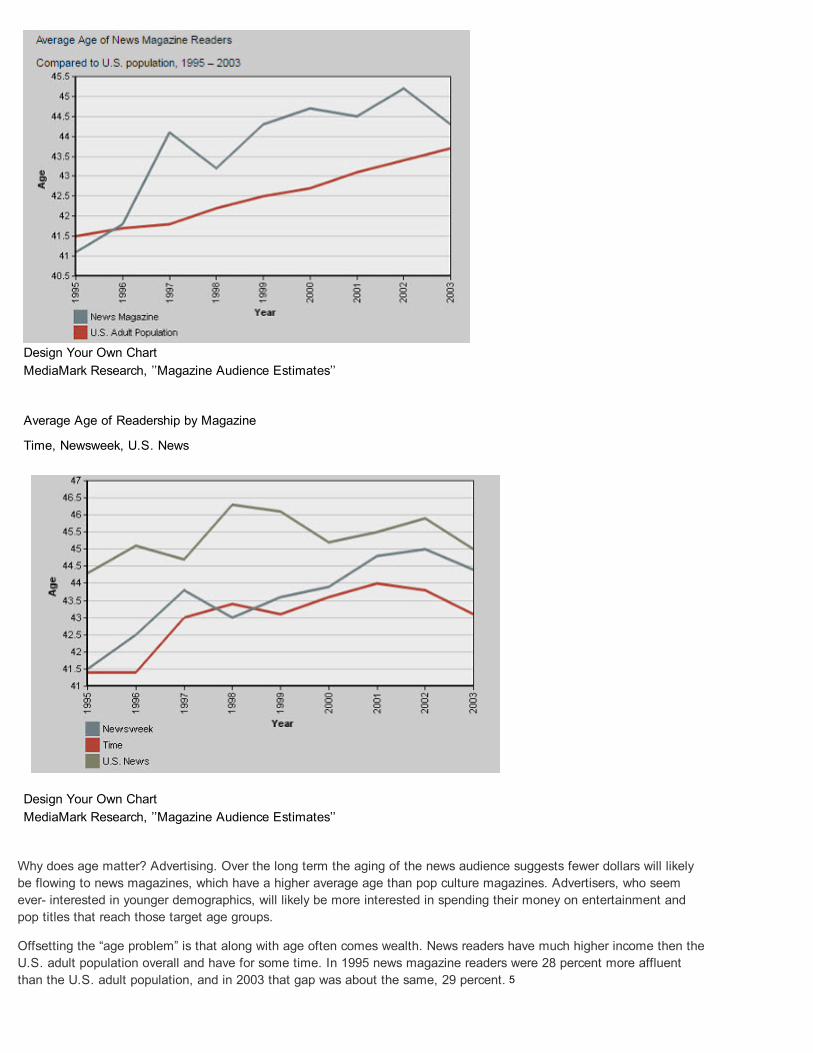
AudienceAudienceThe audience for journalism is now scattered across vastly more outlets (and more media sectors) than even a decadeago.
Still, tracking the question “Where have you been getting most of your news about national and international issues?”shows some clear trends over time. Television dominates, followed by newspapers, then radio and now, closely behind,by the Internet.
According to February 2003 numbers from the Pew Research Center for the People and the Press, 83 percent ofAmericans get most of their news from television, 42 percent from newspapers, 19 percent from radio, and 15 percentfrom the Internet. (The survey questions usually allow more than one answer.)
Reliance on television increases even more, according to the surveys, in times of crisis such as the war in Iraq orimmediately after September 11. Television use goes up and everything else seems to drop, particularly print, though theshifts are temporary.
Where People Go for National/International News
1991 to 2003
Source: Pew Research Center, “Strong Opposition to Media CrossOwnership Emerges: Public Wants Neutrality andProAmerican Point of View”* Survey qu.: How have you been getting most of your news about national and international issues? From television,from newspapers, from radio, from magazines, orfrom the Internet?
However, while the dominant media sectors of the 20th century – mainstream, general interest newspapers, networktelevision and local television news – still attract the largest number of people, all are losing audience.
Meanwhile, online, ethnic and alternative media are growing markedly. According to one survey, a record 150 millionAmericans went online in September 2003, and other surveys show half of Internet users get news online at least once aweek.
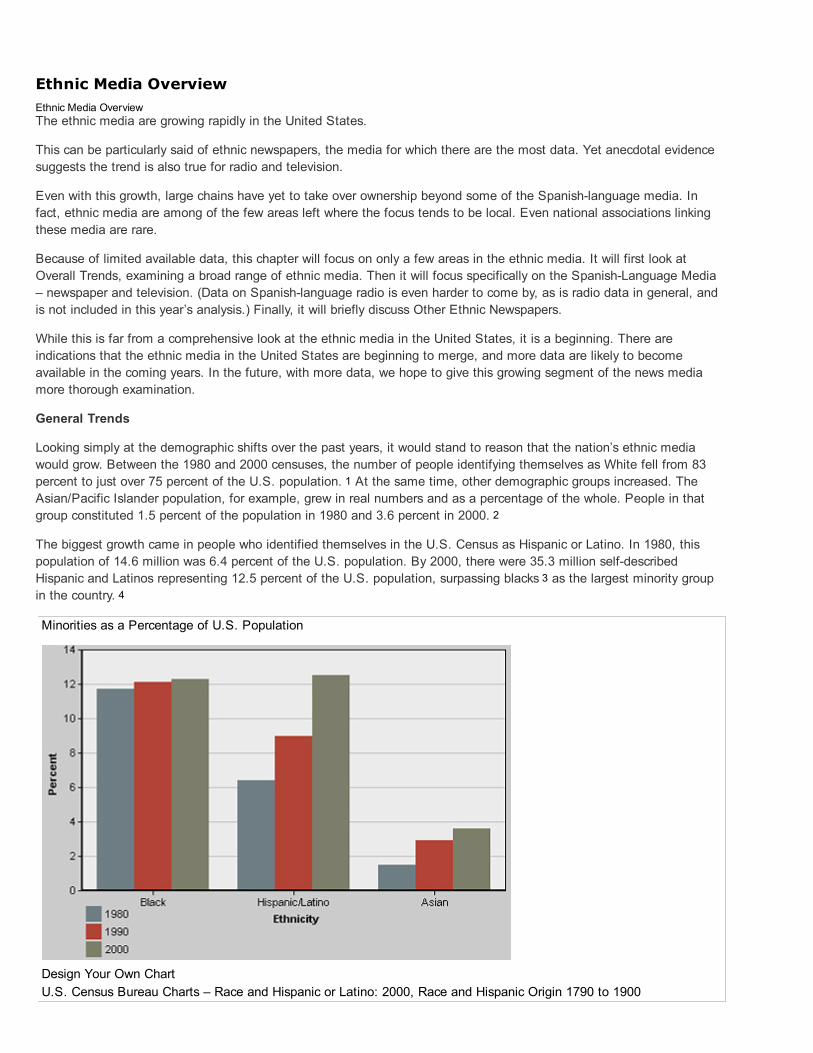
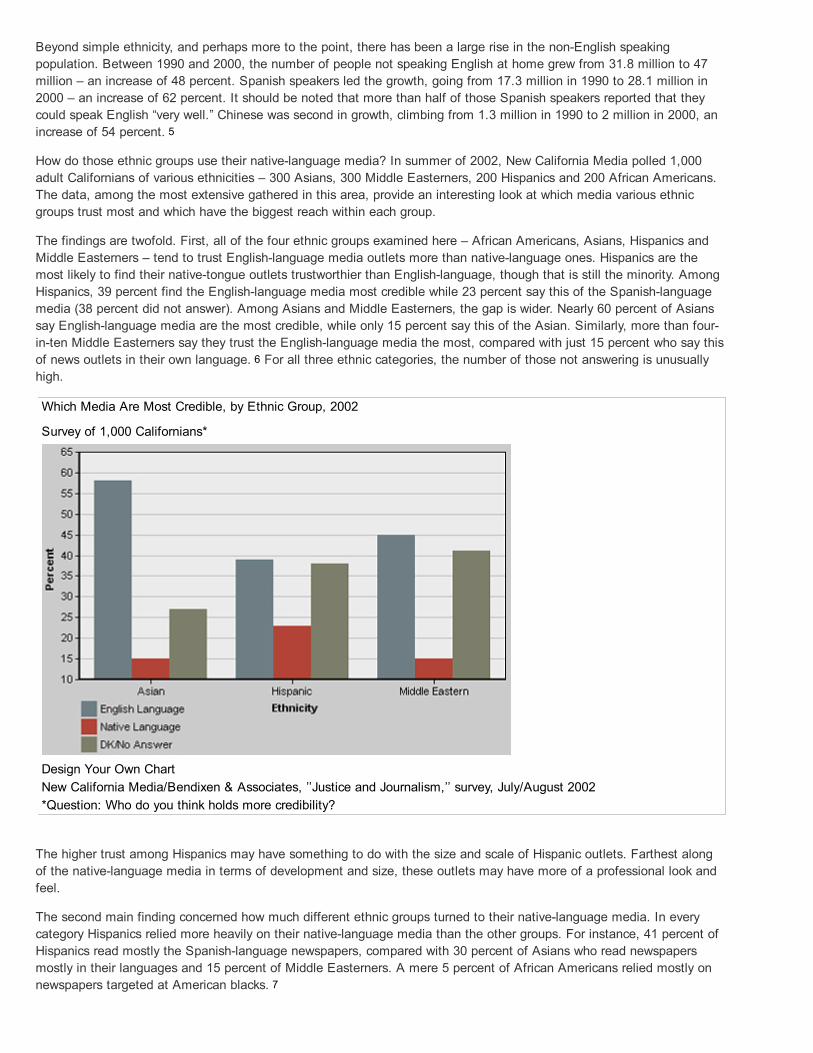
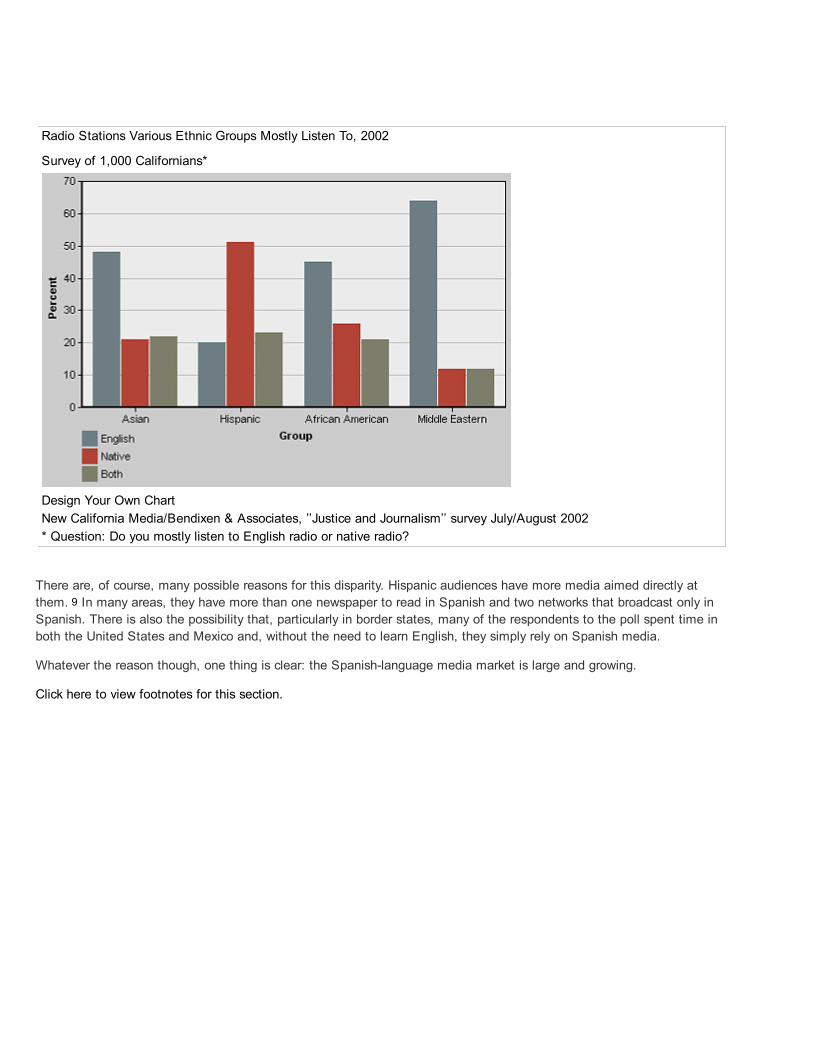
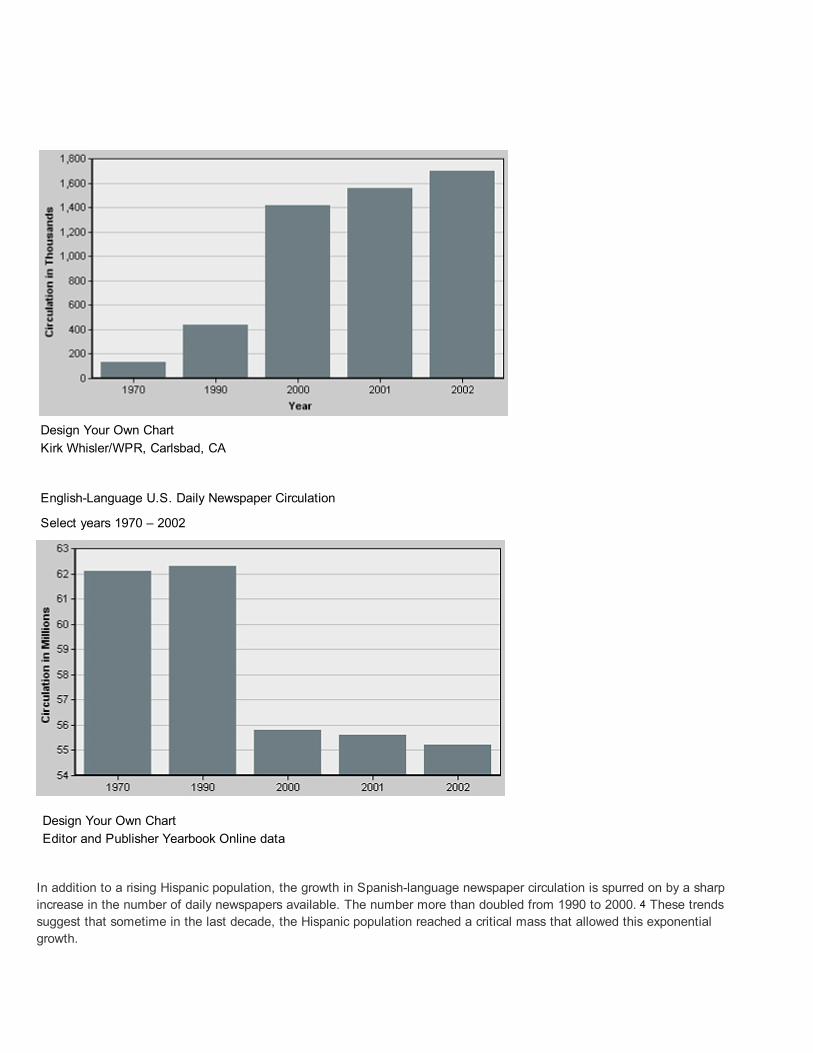
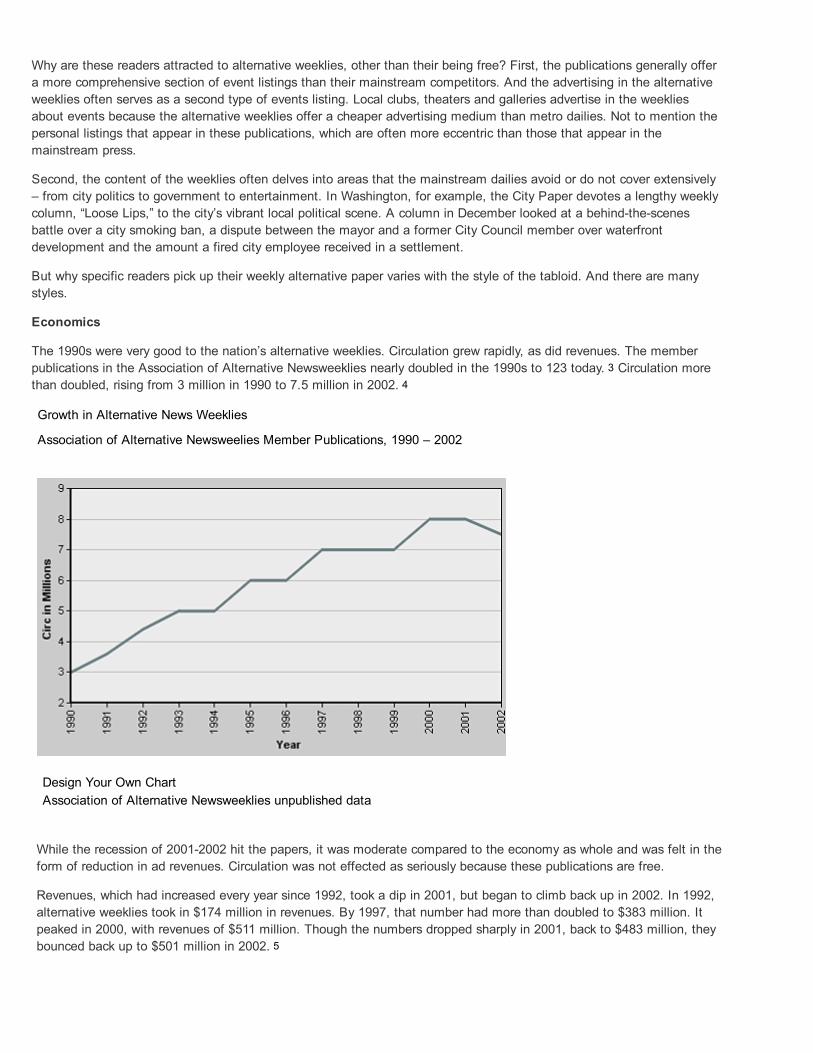
The growth in ethnic media is similarly impressive. Consider, for instance, that the circulation of Spanishlanguagenewspapers has more than tripled in the last decade to 1.7 million, at a time when Englishlanguage newspapercirculation has declined 11 percent.
The three growth areas in journalism share the same strength – the opportunity for audiences to select tailored contentand, in the case of the Internet, to do it on demand.
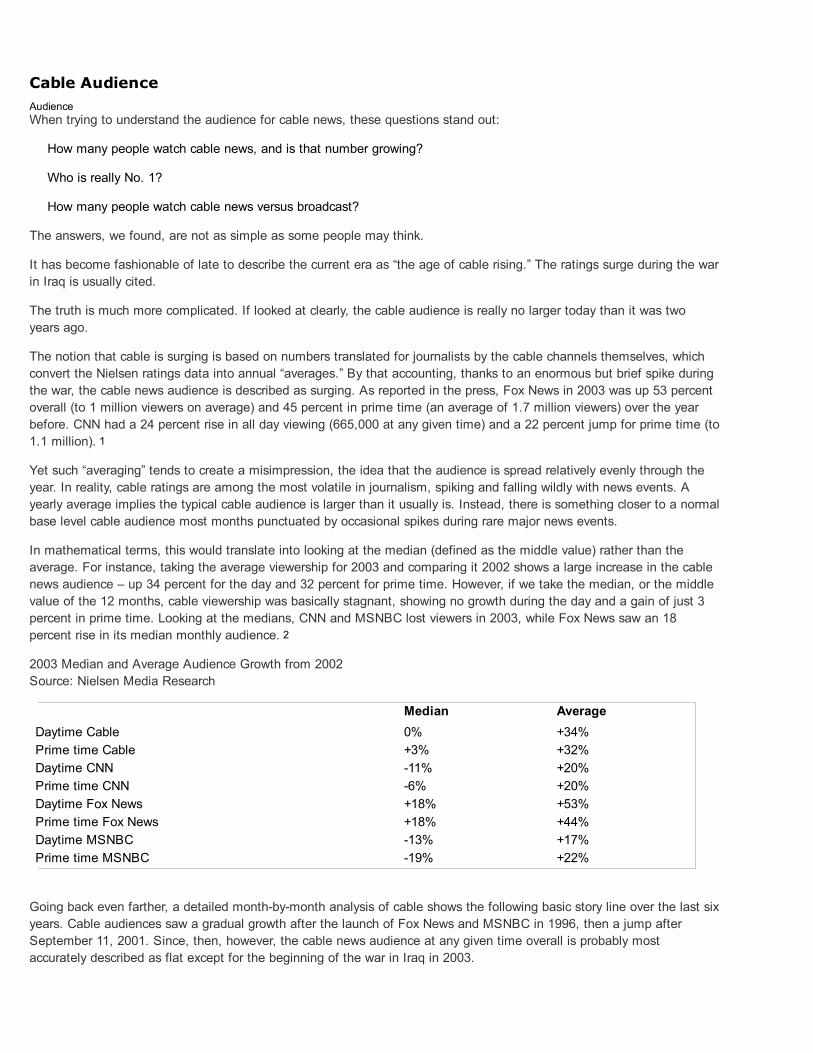
Cable news had been growing since the late 1990s but is no longer doing so, (though the press generally reportsaudience growth since the cable networks average the numbers in ways that make them appear larger than they reallyare). Perhaps one reason cable audiences have not grown in two years is that while cable is immediate, it does not offeraudiences the ability to search and customize the information that the Internet does. The only cable network that isgrowing, Fox News, may have an advantage in this regard: it is already tailoring itself for a niche consisting, according tosurvey data, of a more conservative audience.
Radio and news magazine audience numbers, like cable, are largely flat. The energy and the growth in these sectors arein those places targeting specialized audiences with high quality content – smaller circulation outlets like The Economistin magazines and NPR in radio.
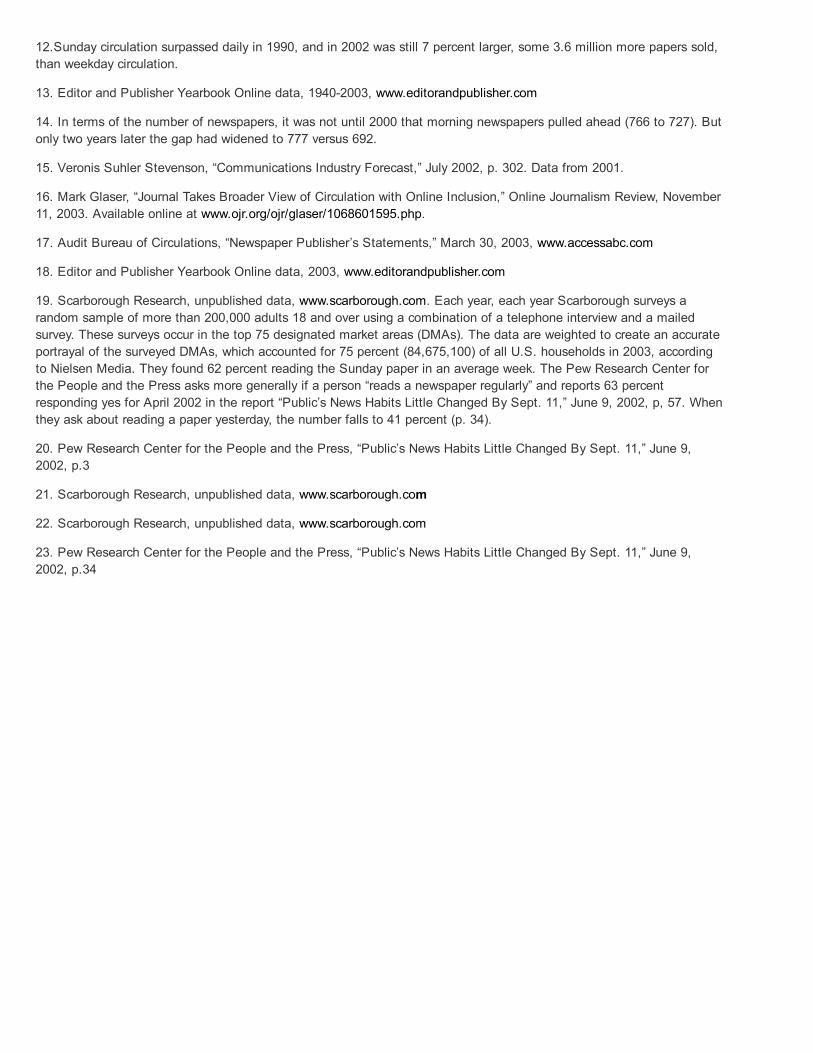
EconomicsEconomicsFor all the trouble with audiences, the economics of journalism in general are remarkably strong.
In the older media sectors, profitability remains robust. Newspapers made around a 20 percent profit in 2003. Localtelevision news stations make roughly double that. Radio news, too, is a significant contributor to the bottom line for itsowners, representing about 11 percent of the revenues of major radio companies.
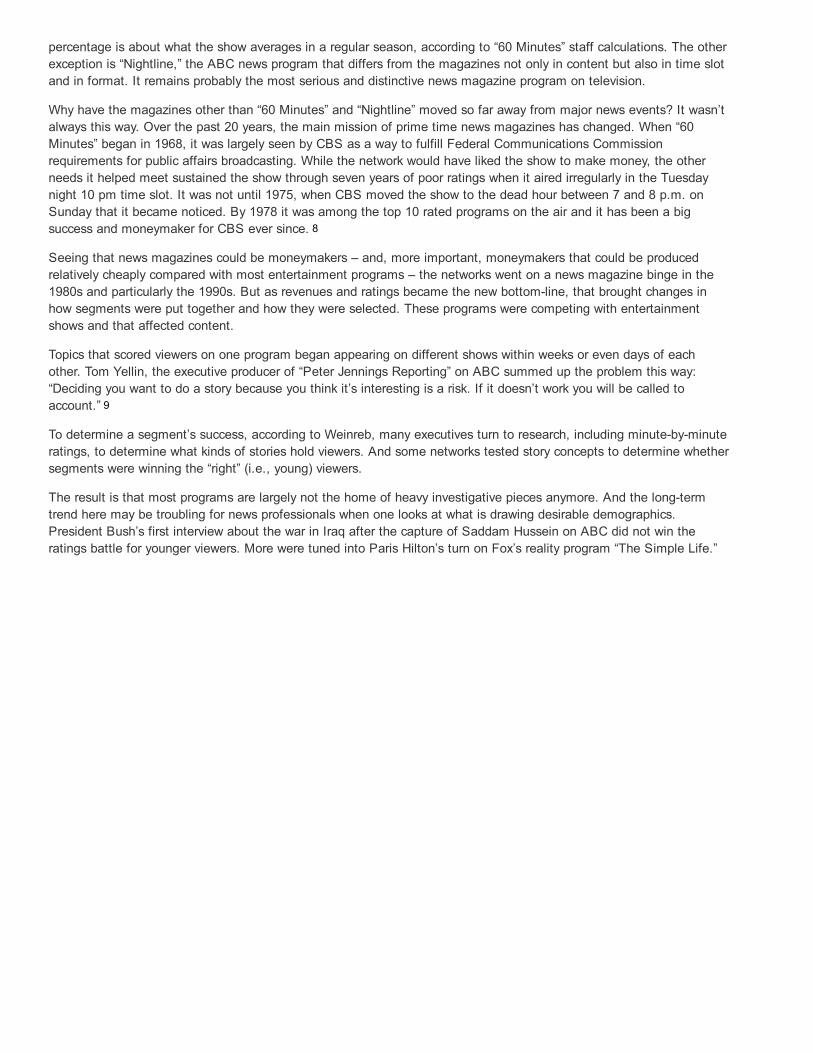
Network television news is still a big revenue engine and in the late 1990s was perhaps the most reliably profitable partof the network television business, ahead of entertainment. But major news events like the war in Iraq cost so much tocover, network insiders say privately, that they whittled down profitability in 2003.
How can revenues be up for these media where audiences are down? In an era of fragmentation, these media continueto stand out as among the few places where advertisers can still attract a crowd. It may not be as big a crowd as it oncewas, but attracting any crowd has become harder.
Yet as other sectors attract more of the audience, they are attracting more and more advertising. Ad revenues forSpanishlanguage newspapers, for instance, have increased sevenfold between 1990 and 2001, from $111 million to$786 million, according to figures from the Latino Print Network.
The Internet, in turn, began to turn the corner on profitability in 2003, though the medium still relies largely on oldmedia for its content and in many instances much of its costs. The overall profit numbers are small compared withtraditional media, and some major Web sites are still not breaking even. Nonetheless, profits are growing at huge rates.If that continues, in a few years they will be significant contributors to company coffers.
What is less clear, however, is what economic model will work online. Will it be advertising based (like television),subscription based or some combination, and will those profits ever be enough to subsidize the kind of news gatheringthat newspapers and television did in their heyday. If the Internet is profitable, but not as profitable as old media, theresult may be fewer resources for gathering news, spread over more outlets.
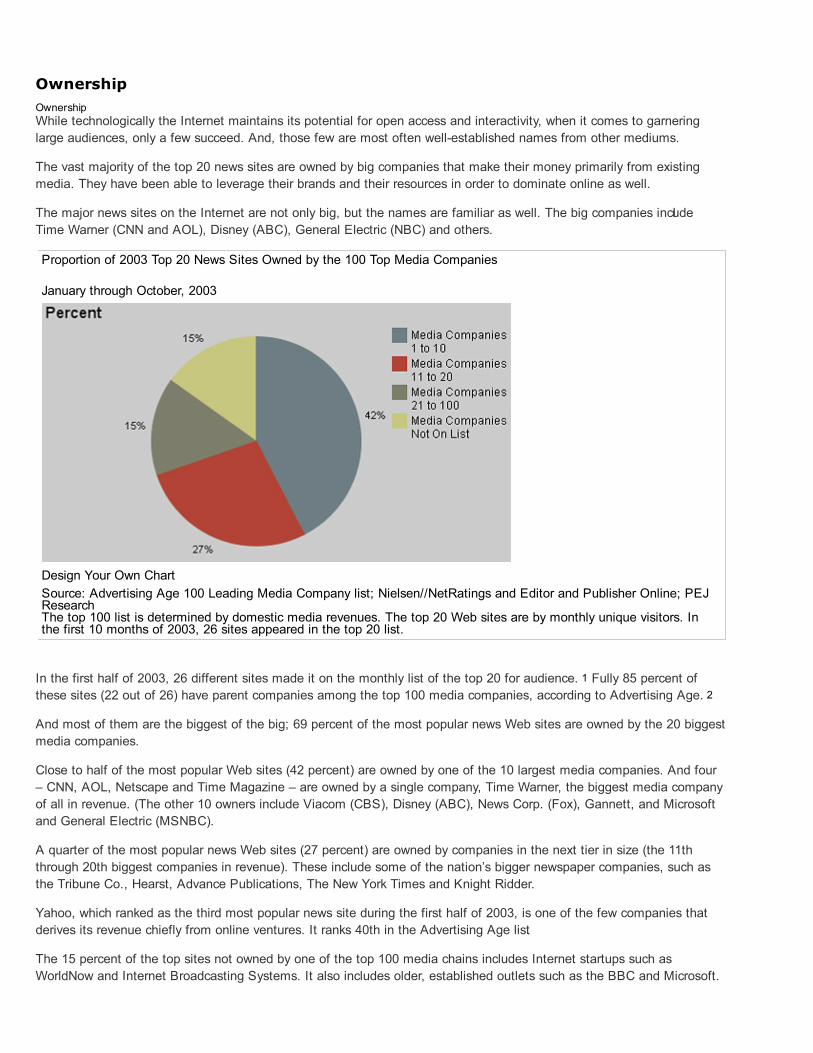
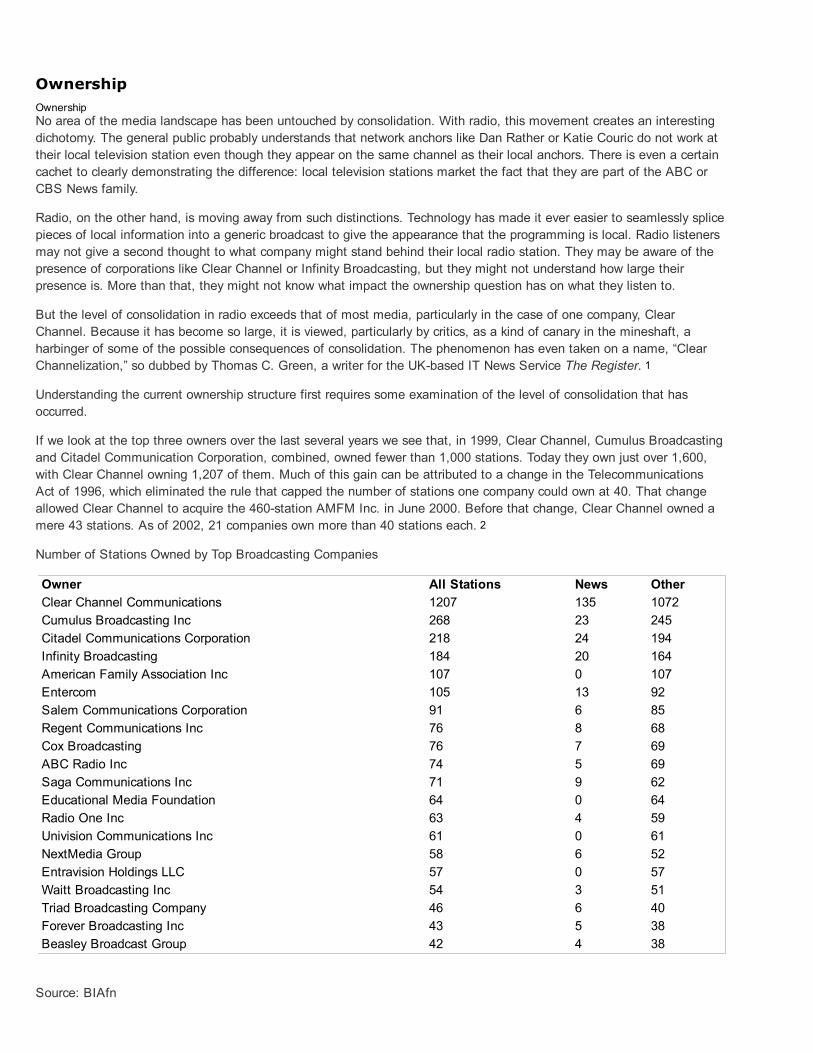
OwnershipOwnershipAs audiences fragment across more outlets, the corporate response has been to get bigger in order to deliver theaudience for advertisers not in one place but under one corporate roof.
The effect of this on journalism is not as simple as the traditional arguments about consolidation might suggest. Criticshave decried declining diversity of ownership and the rise of chains in media for 70 years. But the trend continuesanyway.
Over the years, the Supreme Court has repeatedly upheld a core principle: out of a diversity of viewpoints, we are morelikely to know the truth. Yet we are moving in conflicting directions where we have more outlets for news but fewerowners.
Bigness may give a company the means to provide high quality journalism, but it doesn’t guarantee it. Bigness mayalso simply make journalism a less and less important part of a company’s entertainment media portfolio and move itfarther away from being a public trust.
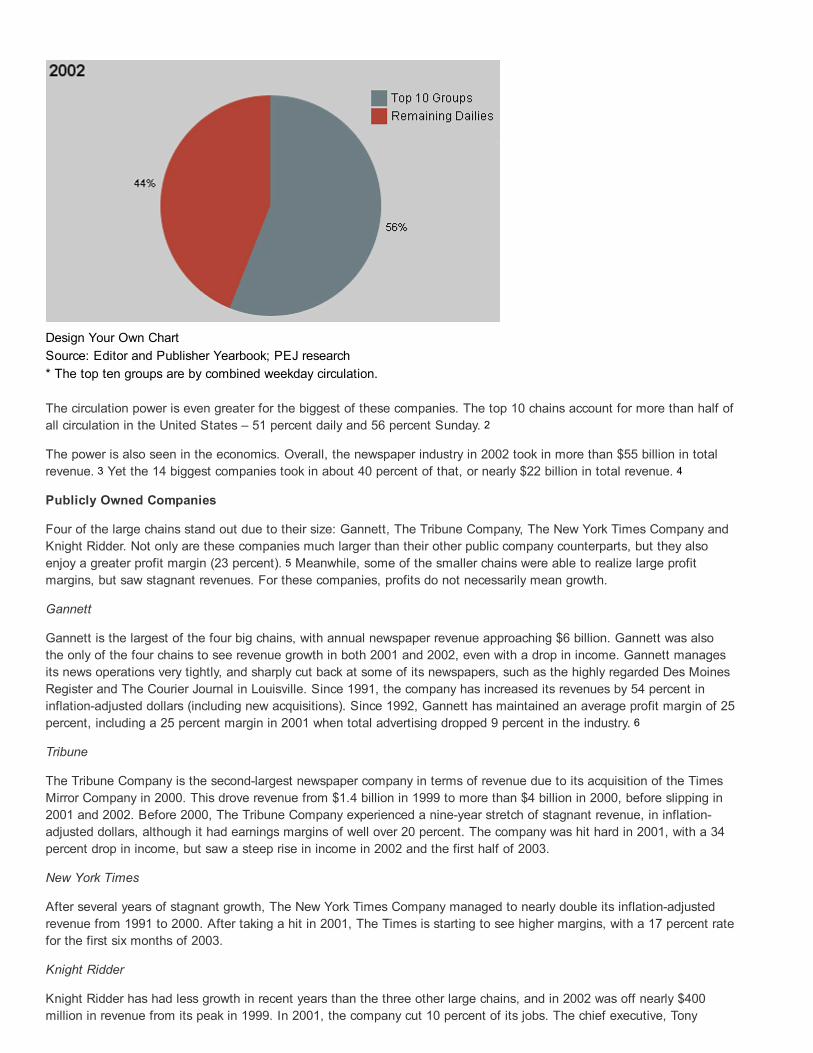
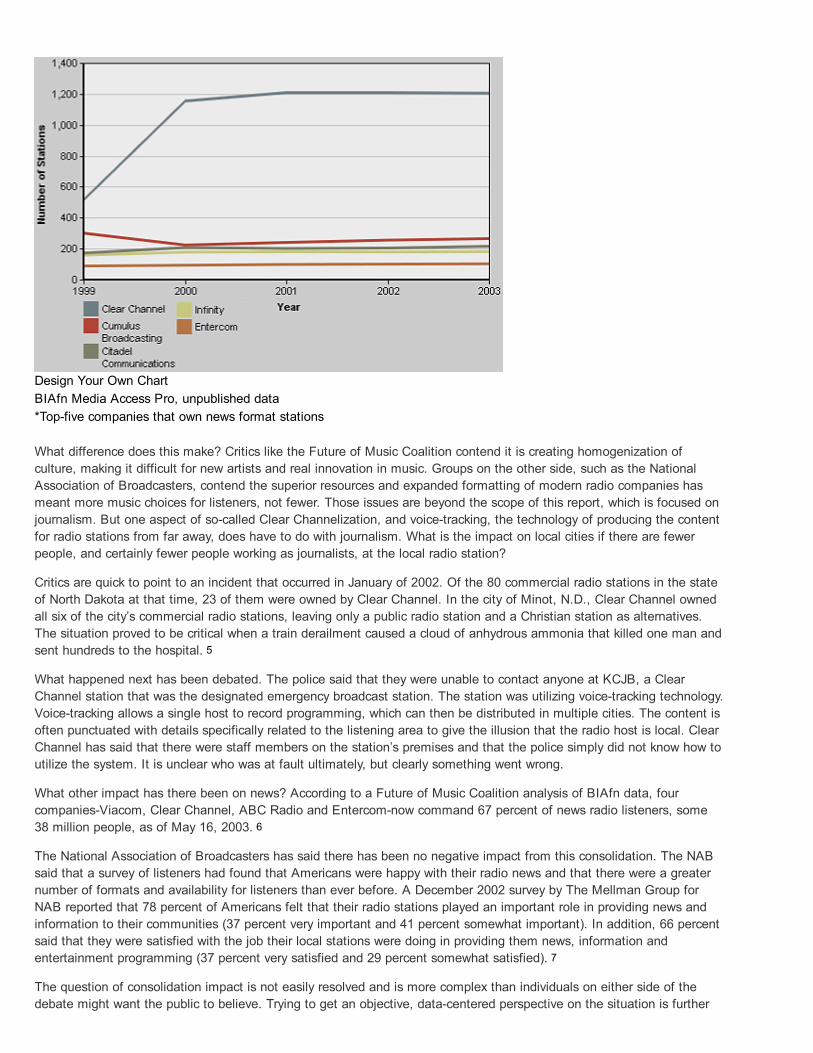
As of 2004 here are the facts: In newspapers, 22 companies now represent 70 percent of the daily circulation (73percent on Sunday), according to data from Editor and Publisher. In radio, the top 20 companies operate more than 20percent of all the radio stations in the country; one, Clear Channel, dominates, operating stations in 191 of the 289Arbitronrated markets. In local television, the 10 biggest companies own 30 percent of all television stations reaching85 percent of all television households in the United States. In network television, the owners are all giant corporationsfor whom television, let alone television journalism, represents only a small part of their revenues, less than 30 percent.
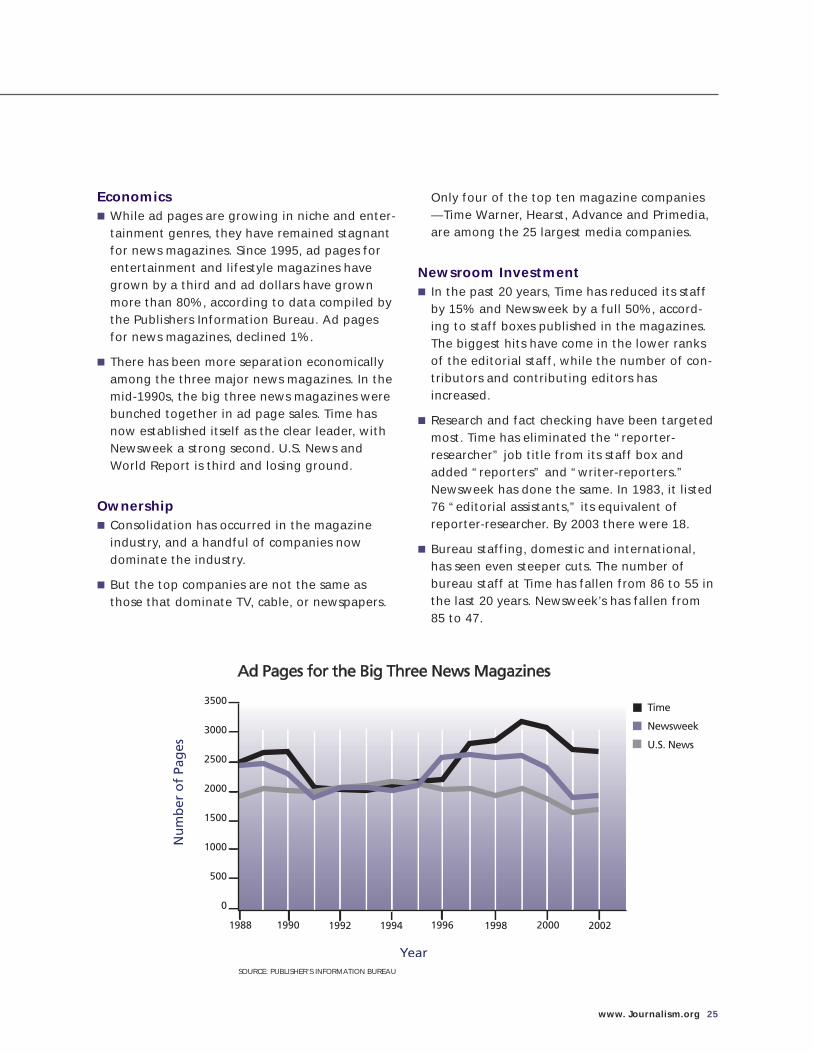
In magazines, while there has been consolidation, it is not on the same level as in other media. Many of the big playersmay be unfamiliar names to most readers of this report, and only four of the top ten magazine companies – TimeWarner, Hearst, Advance and Primedia – are among the 25 largest media companies overall.
Online, big companies also prevail, at least when it comes to traffic as measured in aggregate by Nielsen and otherratings monitors. Today, more than half of the 20 most popular news Web sites are owned by one of the 20 biggestmedia companies. Yet it might be more accurate to say that there will always be two Internet worlds, one controlled bygiant companies able to amass large audiences to a few Web sites, and the other populated by the world of citizenbloggers or niche web sites, where much of the innovation and energy may come from.
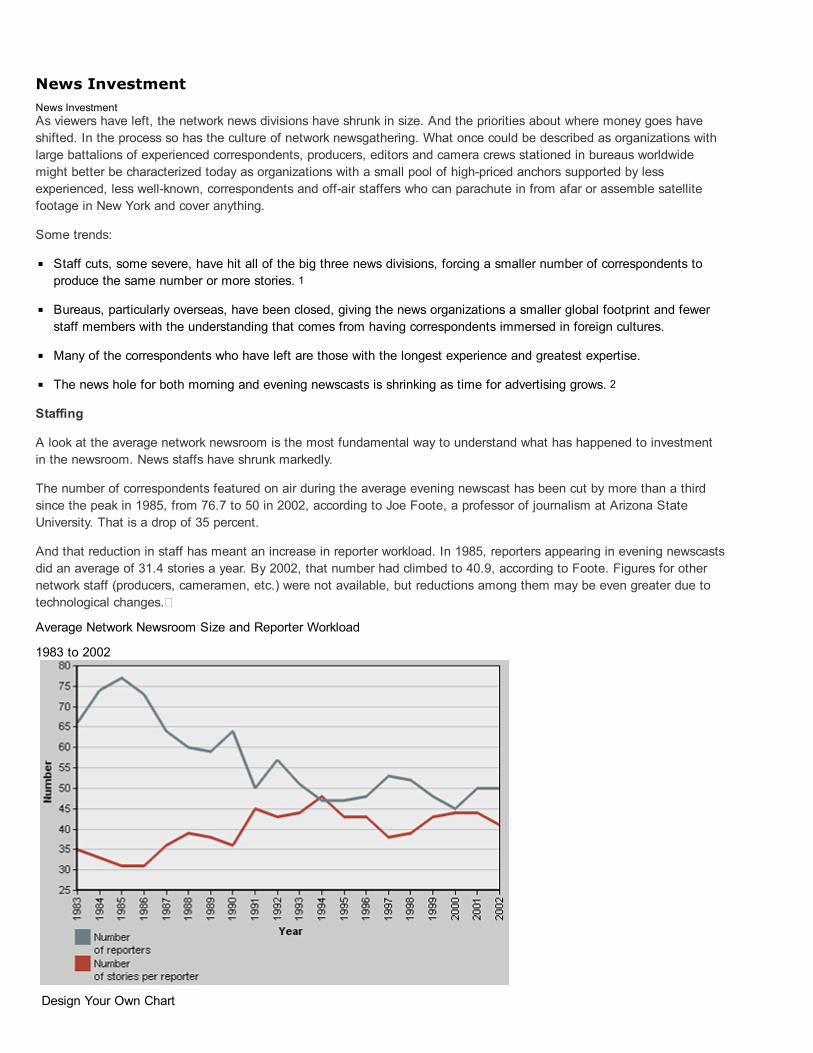
News InvestmentNews InvestmentOverall, the numbers reveal general declines in how much is invested in newsgathering in American journalism.
Newspapers today have about 2,200 fewer fulltime professional newsroom employees than they did in 1990, accordingto data form the American Society of Newspaper Editors. Interpreting that decline is complicated. First the number ofpapers has declined. On the other hand, work once done by printers and composing room workers has migrated to thenewsroom, adding more jobs in the newsroom related to production rather than newsgathering.
In network news, the number of correspondents since the 1980s has been cut by a third, according to data fromProfessor Joe Foote at Arizona State University. Correspondent workload has increased by 30 percent, according toFoote, and the number of foreign bureaus, our accounting finds, is down by half.
In local television, the Project’s surveys suggest that the average workload increased 20 percent from 1998 to 2002.Fully 59 percent of news directors reported either budget cuts or staff cuts in 2002.
In radio, from 1994 through 2001, the number of fulltime radio newsroom employees declined 44 percent and parttimeemployees declined 71 percent, according to survey data compiled by Professor Robert Papper of Ball State University.
In cable, only Fox appears to be building its news staff, but that is on a relatively small base.
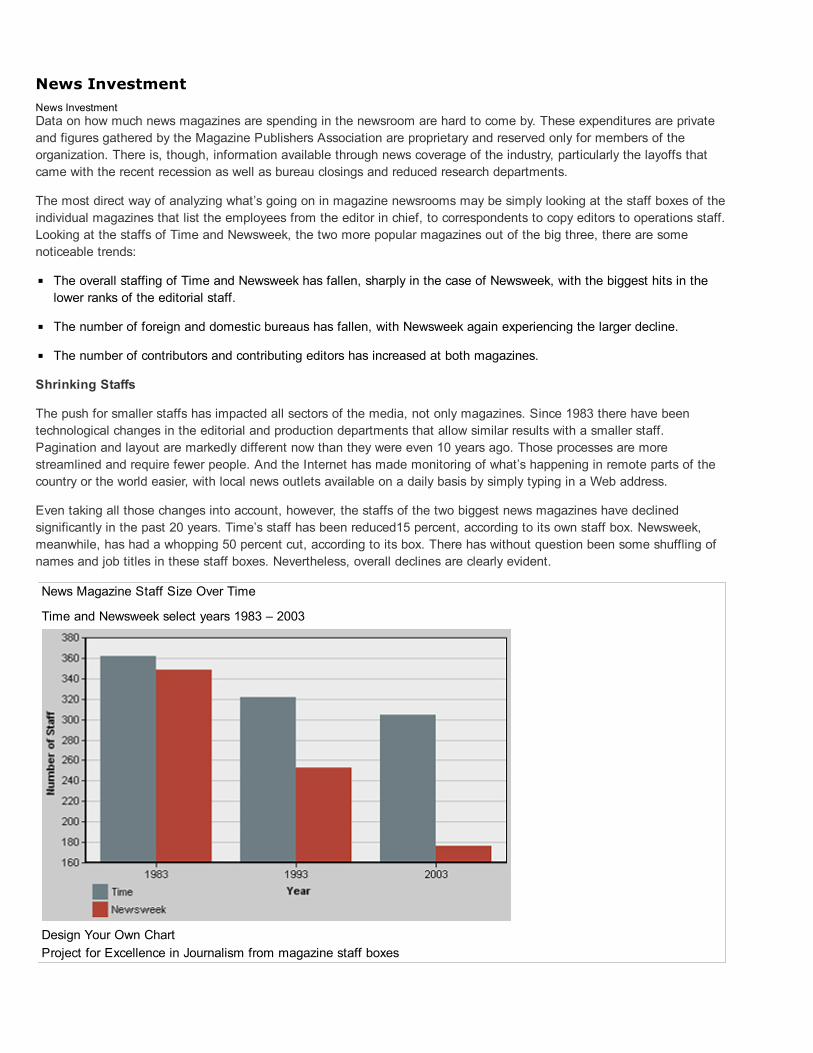
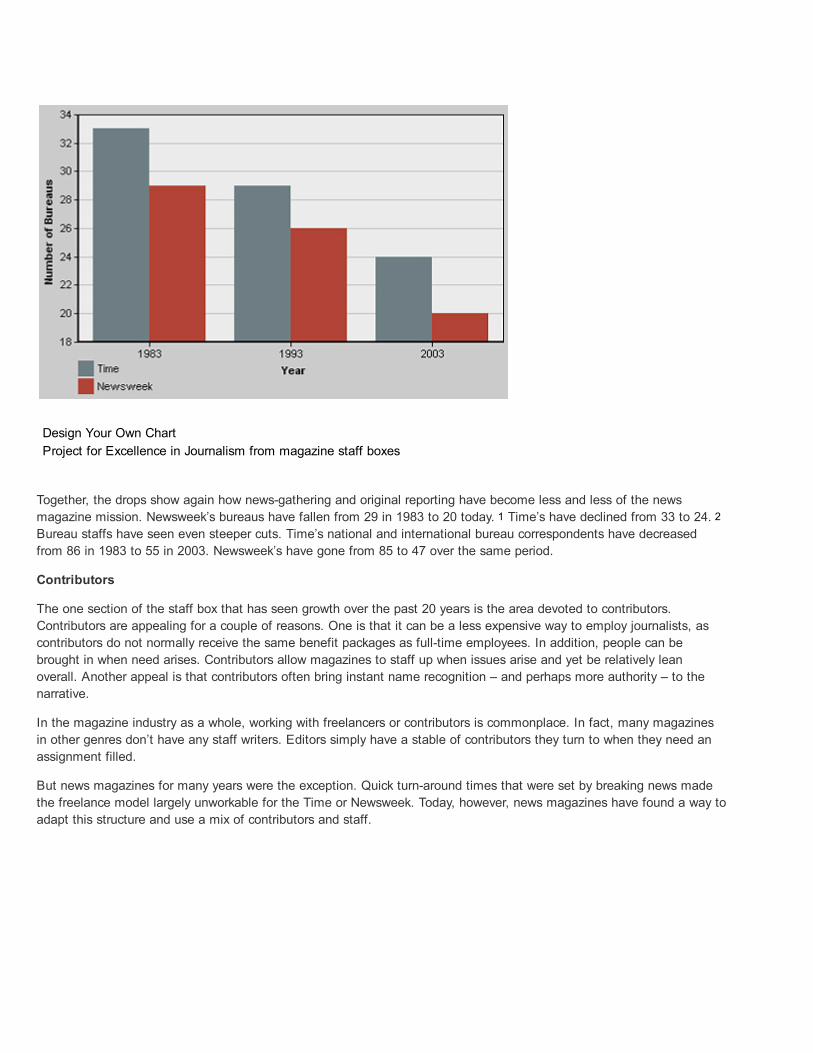
In news magazines in the past 20 years, Time has reduced its staff by 15 percent and Newsweek by a full 50 percent,according to staff boxes published in the magazines. There has without question been some shuffling of names and jobtitles in these staff boxes. Nevertheless, overall declines are clearly evident. The number of listed foreign bureaus at themajor news magazines also has fallen, by 27 percent at Time and 31 percent at Newsweek.
Online, the investment in newsgathering is growing, but for now much of the content is subsidized by the old media.
These facts suggest a difficult environment – more pressure on people, less time to report stories and more reliance ontechnology, syndicated material and synthesizing secondhand information.
Some of these changes reflect more efficiency created by new technology and companies eliminating waste. Some ofthe investment in technology, moreover, is inevitable and necessary for modernization. In local television, thegovernment has mandated the transition to fully digital technology within two years. But, technology can also be used toreplace the newsgathering skills, homogenize the content, rely more on feed material and wires, which is cheaper thanlocal or original reporting. It is difficult to see how news organizations can distinguish themselves and attract moreaudience in a more crowded environment if their content is more similar. There is a tendency for branding to be morefocused around the style than the substance of reporting.
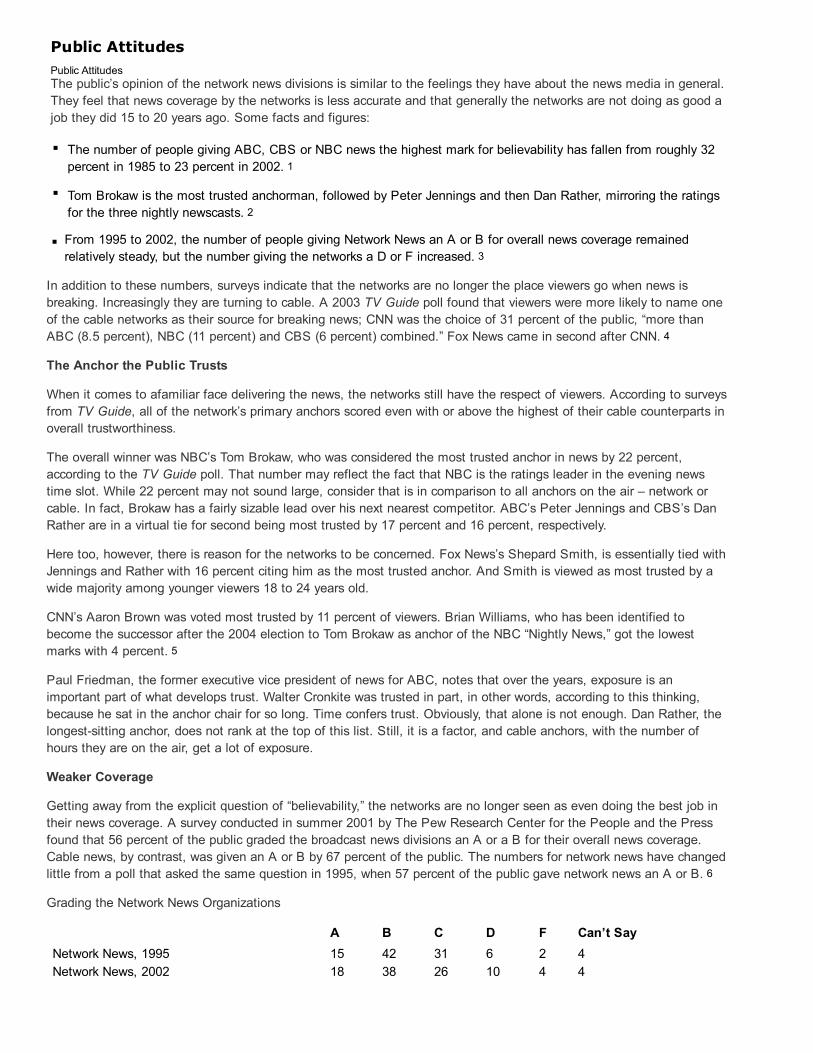
Public AttitudesPublic AttitudesPublic attitudes about the press have been declining for nearly 20 years.
Americans think journalists are sloppier, less professional, less moral, less caring, more biased, less honest about theirmistakes and generally more harmful to democracy than they did in the 1980s.
Consider a few changes in the numbers between 1985 and 2002 1:
The number of Americans who think news organizations are highly professional declined from 72 to 49 percent.
Those who think news organizations are moral declined from 54 to 39 percent, and those who think they are immoralrose from 13 to 36 percent.
Those who feel news organizations try to cover up their mistakes rose from 13 to 67 percent.
The number of Americans who think news organizations generally get the facts straight declined from 55 to 35percent.
Those who feel who feel news organizations care about the people they report on declined from 41 to 30 percent.
Those who think news organizations are politically biased rose from 45 to 59 percent.
The notion of a credibility crisis in the press first gained significant notice in 1985, when a survey report by KristinMcGrath of MORI Research conducted for the American Society of Newspaper Editors declared that “threefourths of alladults have some problem with the credibility of the media.” 2
A year later, the Times Mirror Center for the People and the Press (now the Pew Research Center for the People andthe Press) challenged those findings. That survey, produced for Times Mirror by Gallup, focused on “believability,” notcredibility, and considered this a better measure since journalists and their news organizations are supposed to bebelieved, not loved. “If credibility means believability, there is no credibility crisis,” wrote Andrew Kohut of the PewResearch Center and media analyst Michael Robinson. 3
Since then, however, even the believability of most news organizations has declined, the Center has found. By August2002, the percentage of Americans who rated their daily newspaper as highly believable fell from 80 to 59 percent. ABCNews fell from 83 to 65 percent, CBS from 84 to 64 percent, and NBC from 82 to 66 percent. Local news stations fellfrom 81 to 65 percent. Virtually every news organization has fallen. Only a few news organizations on the list studiedsince 1985 stand out for their relative stability – public broadcasting’s “NewsHour” (down just 3 percentage points) andThe Wall Street Journal (up slightly).
Various organizations have studied this trend, though often with different questions, and all have found the same basicpattern. Researchers have identified several root causes. A study by Chris Urban for the American Society ofNewspaper Editors thought it was inaccuracy and the sense that journalists sensationalize the news to sell newspapersand advance their careers.
Kohut has probably looked at the trend longer and harder than anyone. Fifteen years ago, Kohut says, the publicthought the press was “too sensational, too pushy, to rude, too uncaring about people and the public.” But most peoplesaw journalists as moral, professional and caring about the interests of the country. 4
Today, says Kohut, the public considers the news media even less professional, less accurate, less moral, less helpful todemocracy, more sensational, more likely to cover up mistakes and more biased.
After watching these numbers closely for years, we at the Project suggest that all of these matters – the questionsabout journalists’ morality, caring about people, professionalism, accuracy, honesty about errors – distill into somethinglarger. The problem is a disconnection between the public and the news media over motive. Journalists believe they areworking in the public interest and are trying to be fair and independent in that cause. This is their sense ofprofessionalism.
The public thinks these journalists are either lying or deluding themselves. The public believes that news organizationsare operating largely to make money and that the journalists who work for these organizations are primarily motivatedby professional ambition and selfinterest.
This disconnect over the motives of journalists may have been exacerbated by the growing critique by conservativesover the last few years that most mainstream news organizations are distorting their coverage with an ideologicallyliberal agenda. A growing legion of press critics also may have sensitized the public to weaknesses in the news media.
Another factor may be adding to this. People in these surveys are increasingly distrustful of giant corporations, the sortthat now own most of the news media.
Footnotes
1. “News Media’s Improved Image Proves ShortLived,” August 4, 2002, Pew Research Center for the People and thePress.
2. Newspaper Credibility: Building Reader Trust, a National Study Commissioned by the American Society ofNewspaper Editors. (Minneapolis: MORI Research Inc., April 1985)
3. The People & the Press: A Times Mirror Investigation of Public Attitudes Toward the News Media Conducted by theGallup Organization. (Washington, D.C.: Times Mirror, January 1986).
4. “The New Rules: 1999 Talking Points,” unpublished speech talking points, Andrew Kohut, 1999, used as the basis forvarious speeches.
ConclusionConclusionThe larger trends we see in the data on content, audience, economics, ownership, and newsroom investment all couldadd to public distrust of the news media. There is something, in other words, of a vicious cycle in the public attitudedata. As declining audience leads to newsroom cutbacks and other financial fixes, these reinforce the public’s suspicionsthat news organizations are motivated more by economics than public service.
There is little sense in 2004 of a quick or simple way out. Some news organizations have clearly tried to respond, withefforts like civic journalism, or credibility initiatives by editors groups, or ethics training by television news directorsgroups, or attempts by news organizations to be more responsive to the public by inviting them into the newsroom.
These steps seem to address the problem, at least in small ways, that newsrooms can control. Yet they have not shownup in the numbers. Indeed, there is only one uptick in the last 18 years in the general approval or attitudes toward thenews media, in the survey data. That came in November 2001, after the terrorist attacks. 1 The only measurabledifferences in press performance during that period were these: the press had suddenly become far more serious inwhat it covered, and more factual and less interpretative in the way it covered it; the media suddenly devoted enormousresources to covering a story of paramount importance even if it cost them money; as a nation we faced a crisis thatmade the need for journalism more urgent. 2
Those changes in news agenda, though, were not sustained. Within a few months, as the urgency of events subsided,studies found virtually no difference in the local news agenda and only a partial change in the agenda of nightly networknews than before September 11. 3 And by August 2002, Pew Center Surveys found the rise in trust to have fallenback. 4
It is possible that the public is simply of two minds. It wants a more entertainmentinfused, more sensationalized, moreinterpretative style of news, and the media have given it to them. The public then feels repulsed and derides themessenger for delivering it.
It is also possible that this declining trust has only a little to do with the press, that these attitudes toward the newsmedia are only a reflection of a declining trust in all institutions.
Brushing off these issues as a sign of public hypocrisy or general skepticism, however, seems too glib. The publicattitudes aside, something is changing in the news media. Faced with declining audiences, many major newsinstitutions have changed their product in a way that costs less to produce while still attracting an audience. The publicsenses this and says it doesn’t like it.
Blaming the news media for these changes is too easy. Journalism faces more difficult economic circumstances than itonce did. Yet the way the news industry responded has helped erode public trust. How long can the profession ofjournalism endure if people increasingly don’t believe it? To reverse the slide in audience and trust will probably take amajor change in press behavior, one that will make the news more relevant and customizable and at the same timesuggest to the public, as it did briefly after September 11, that the news industry is more concerned with the public goodthan Americans suspect.
Footnotes
1. “Terror Coverage Boosts News Media’s Images,” Pew Research Center for the People and the Press, November 28,2001, available at http://peoplepress.org/reports/display.php3?ReportID=143.
2. “Return to Normalcy: How the Media Have Covered the War on Terrorism,” Project for Excellence in Journalism,January 28, 2002, available at http://www.journalism.org/resources/research/reports/normalcy/default.asp. “Before andAfter: How the War on Terrorism Has Changed the News Agenda, Network Television, June to October, 2001,” Projectfor Excellence in Journalism, November 19, 2001, available athttp://www.journalism.org/resources/research/reports/agenda/default.asp.
3. Ibid.
4. “News Media’s Improved Image Proves Shortlived,” Pew Research Center for the People and the Press, August 4,2002, available at http://peoplepress.org/reports/display.php3?ReportID=159.
Author’s NoteAuthor’s NotePeople can approach the material in this report several ways. Users can go directly to the media about which they aremost concerned – local television news, for example – and drive vertically through it. Or they can focus on a particularissue, such as audience trends, and move horizontally across different media sectors to see where Americans are goingfor news. Or they can move across the overviews of each sector. They can flip back and forth between our narrative andthe interactive chart and tabular material. Or they can work through the statistics for themselves, making their owncharts, answering their own questions, in effect creating their own report.
The report is substantial. It runs more than 500 pages in print and includes extensive tabular appendices. There aremore than 400 detailed footnoted source citations to help guide users to original sources.
In addition to this overview, each sector of media is subject to a detailed narrative and synthesis of the data that wehope answer most of the major questions about underlying trends and outline what is unknown as well.
Our desire in this study is to answer questions we imagine any reader would find important, to help clarify the strengthsand weaknesses of the available data, and to identify what is not yet answerable.
We have attempted, to the best of our ability and the limits of time, to seek out multiple sources of information forcomparison where they exist. Each year we hope to gather more sources, improve our understanding and refine ourmethodology.
This study is the work of many collaborators, including more than 25 outside readers who are expert in different mediasectors, five research partners and dozens of research groups whose data we purchased or got permission to use. Thechapters on television and cable were jointly written with Andrew Tyndall of ADT Research, who executed the contentanalyses on those sectors. The report on newspapers was cowritten by Rick Edmonds of the Poynter Institute and PEJstaff. The content analysis was executed by Princeton Survey Research Associates and Tyndall under the direction ofthe Project. The methodology and statistical work were supervised by Esther Thorson, associate dean for graduatestudies and research at the University of Missouri School of Journalism. Irvin Molotsky, former reporter and editor at theNew York Times, was the copy editor. We owe a significant debt, as well, to our sister group, the Committee ofConcerned Journalists and its chairman, Bill Kovach. More details on their contributions are available here, along withthe methodology.
Our focus in this report is on journalism, not media as a whole. There are various important trends in media – such asthe implications of consolidation or cable technology on nonfiction entertainment, on music or on drama – that are notcovered here.
This annual report was designed with various audiences in mind: journalists, media executives, financial analysts,scholars, students and, most importantly, citizens. We hope it proves useful now and throughout the year for anyoneinterested in American journalism.
Newspapers – IntroIntroBy the Project for Excellence in Journalism with Rick Edmonds
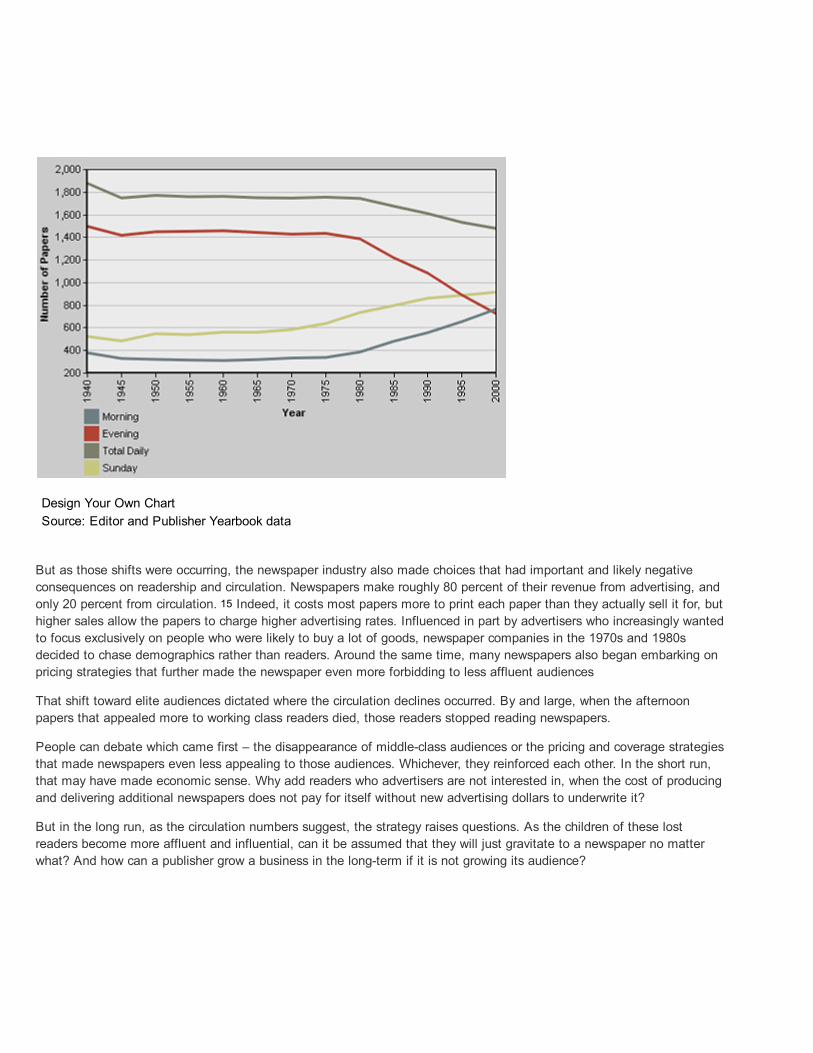
For more than two generations, the percentage of Americans reading newspapers has been shrinking. Until 1970 theproblem was partially masked by population growth. Overall circulation kept rising. Through the 1980s most of thecirculation losses were occurring in afternoon papers. The survivors were stable and financially robust.
In 1990, however, circulation began declining in absolute terms. It became clearer that the young, the next generationof likely readers, were failing to develop a newspaper reading habit. The lack of immigrant readers and the middle classalso became more pressing as those populations grew and now several mainstream newspaper companies are nowpursuing the Spanishlanguage market in particular. What’s more, some data now suggest that people who beganreading newspapers in recent yearsincluding young peoplehave stopped. Newspapers are now losing readers acrossage and demographic groups.
Financially, things have been stronger. The surviving newspapers in town have remained the one place whereadvertisers can reach the most people with a single ad buy. The demographics are also attractive. If you want to reachopinion and business leaders and the most affluent people in a town, newspapers are the way to go. Revenues andprofits in the 1990s have grown robustly, even as circulation has declined.
At the same time, newspapers in any given town usually remain the institution, at least as measured by number ofreporters and editors and in our content analysis, with the greatest newsgathering capacity, the widest range ofcoverage, and largest number of stories each day. Newspapers, in other words, are still the biggest watchdog in town.
The financial strategies of the last two decades brought gains, but in retrospect may also have deferred longtermproblems. Chasing demographics rather than readership was a lucrative strategy. But the industry investedcomparatively little in things like training, research and development or in longterm projects to attract lost or emergingaudience groups. If you were making a lot of money, what was the marginal advantage of investing heavily in morenewsgathering to chase less affluent readers?
Now the industry faces an important question. Given their history and their relative strengths, do newspapers believethat if they invest in creating new content and even new kinds of newspapers they can attract new readers? Or is this amature and declining industry where investing in those things would be throwing money away?
Content AnalysisContent AnalysisWhat do Americans get from their newspapers?
In general, they get more institutional coverage, a more traditional mix of topics, more news of domestic affairs andgovernment and also more anonymous sourcing than they do in other media. They also get a news agenda, on theirfront pages at least, that has changed less over the years than in other types of media.
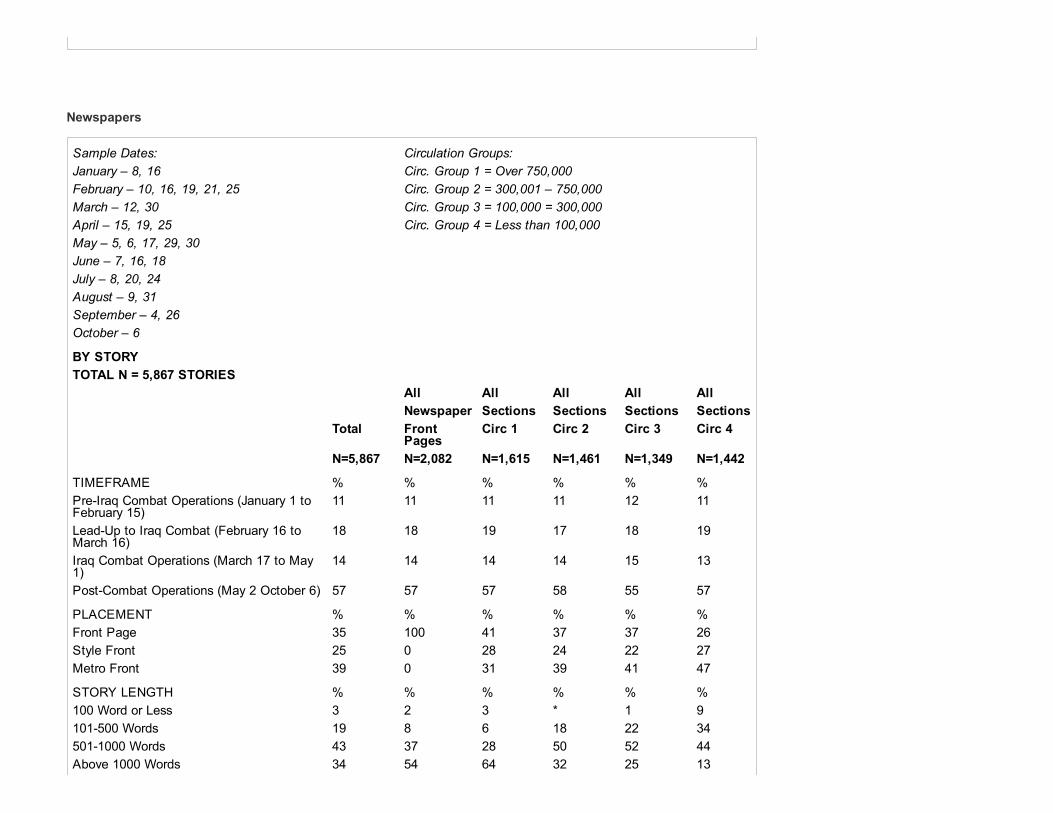
To get a sense of newspaper content, the Project studied 16 newspapers from a range of circulation sizes over thecourse of a month. First, four randomly selected dates for each day of the week were selected – 28 days in all, spreadout from January 8 to October 6 of 2003. Then U.S. daily newspapers were divided into four circulation categories andfour papers from each group were selected at random, looking, when possible, for geographic diversity. The Project thenexamined, in detail, every article from three section fronts: the front page, metro page and lifestyle page. In all, 5,867articles were studied. 1
How has the frontpage agenda of newspapers changed over the years? We do have some sense of this.
An earlier study by the Project examined the front pages of major newspapers in 1977, 1987 and 1997.
A look at comparable papers in 2003 finds that the frontpage agenda has continued a small but steady trend toward abroader definition of news. 2 Even in a year with war in Iraq and resulting American deaths, there was no sharp jump ininternational, military or government coverage.
Subjects of Front Page Newspaper Articles by Year Percent of All Stories
*Analogous percentages are based on the largest circulation category in the 2003 study. Totals may not equal 100 dueto rounding.
Government news makes up a somewhat smaller percentage of frontpage articles than 20 years ago, and even smallerthan in 1997. Foreign affairs, even with the war, made up a smaller number of the articles on the front page than in the1970s during the cold war, but about the same as six years ago. The number of articles about crime continues to fall onthe front page.
At the same time, the number of lifestyle articles keeps climbing, as do the number about other domestic mattersbesides government.
How does the overall newspaper treatment of topics compare to other media studied?
On television, the closest news agenda comparison is newspaper front pages to the network nightly news. Even here,though, there are differences. 3
Newspaper front pages devoted more attention to government news than did network nightly news (26 percent versus16). The front pages devoted a little less attention to foreign affairs than the network nightly news, something thatreflects the local nature of many smaller papers. It may also reflect the fact that much of the foreign coverage oftenfalls on the inside pages of newspapers.
The newspapers devoted more frontpage space to domestic issues, but less to economics and a good deal less toaccidents and disasters.
Newspapers differ even more from network morning newscasts.
If people were to watch network morning shows instead of reading the front page of a morning newspaper, they wouldget a very different news agenda – only a third as many stories about government as in newspapers, 11 times as manyabout entertainment, more than twice as many crime stories and nearly triple the number of accident/disaster stories.
A fairer comparison between newspapers and morning shows (of which we studied the first hour each day, the timemore oriented toward major news) might also include the metro and lifestyle sections of the newspaper.
Topics in the News: Newspapers versus Network Morning News Percent of All Stories, 2003
Even here, there are big differences. Morning shows still had almost a third the number of stories about government,half as many about business, triple the number of accident/disaster stories and twice as many crime stories. The crime
comparison is particularly notable, given that metro sections are often prime territory for crime and that crime isinherently local.
Morning shows also did twice as many foreign stories but half as many lifestyle stories as newspapers across thesethree section fronts.
When it comes to comparisons with cable, the Internet or news magazines, we must be cautious. While we studied amonth of newspapers and network television, an analogous time period for news magazines is only four issues, and forcable news and Internet we studied extended periods over five days.
In general, the news agendas of newspaper front pages and Internet lead articles seem fairly similar and quitetraditional. This may come as little surprise. The Internet at this point is largely a print medium, and the articlesthemselves are mostly wire copy or newspaper articles.
The agenda on cable television news seems different. It is extremely focused on foreign affairs and government, andnot so concerned with domestic affairs.
Other Points About Newspapers Overall
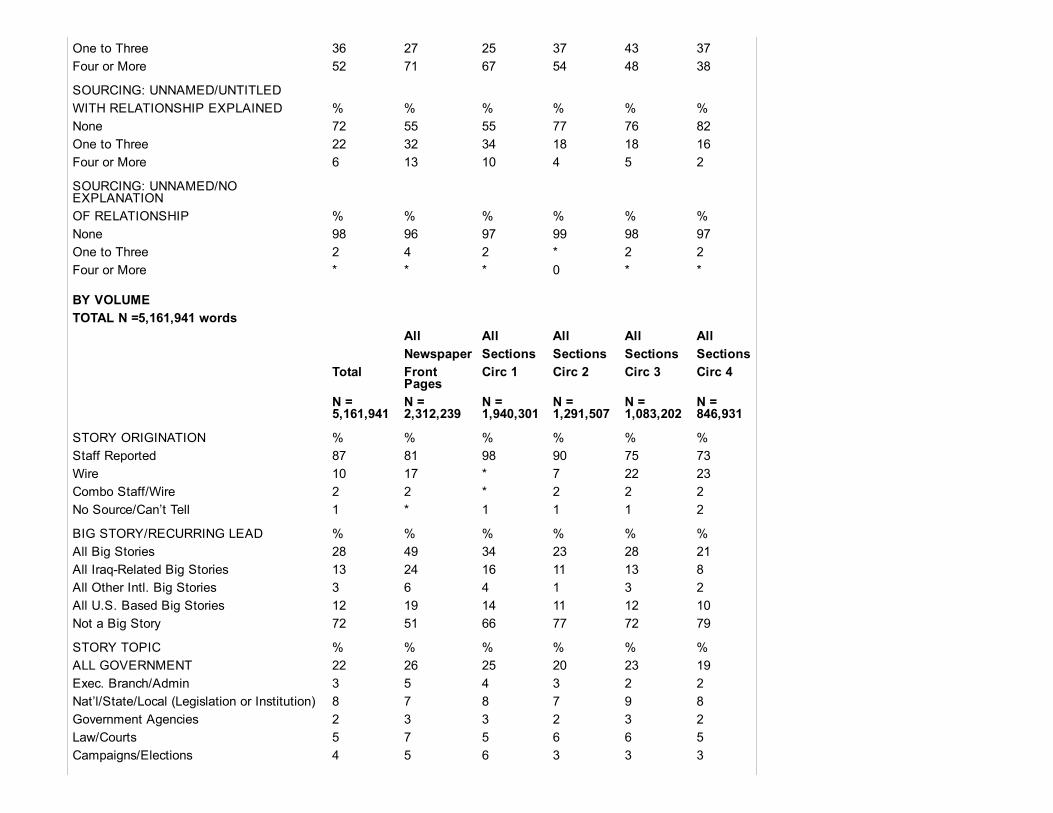
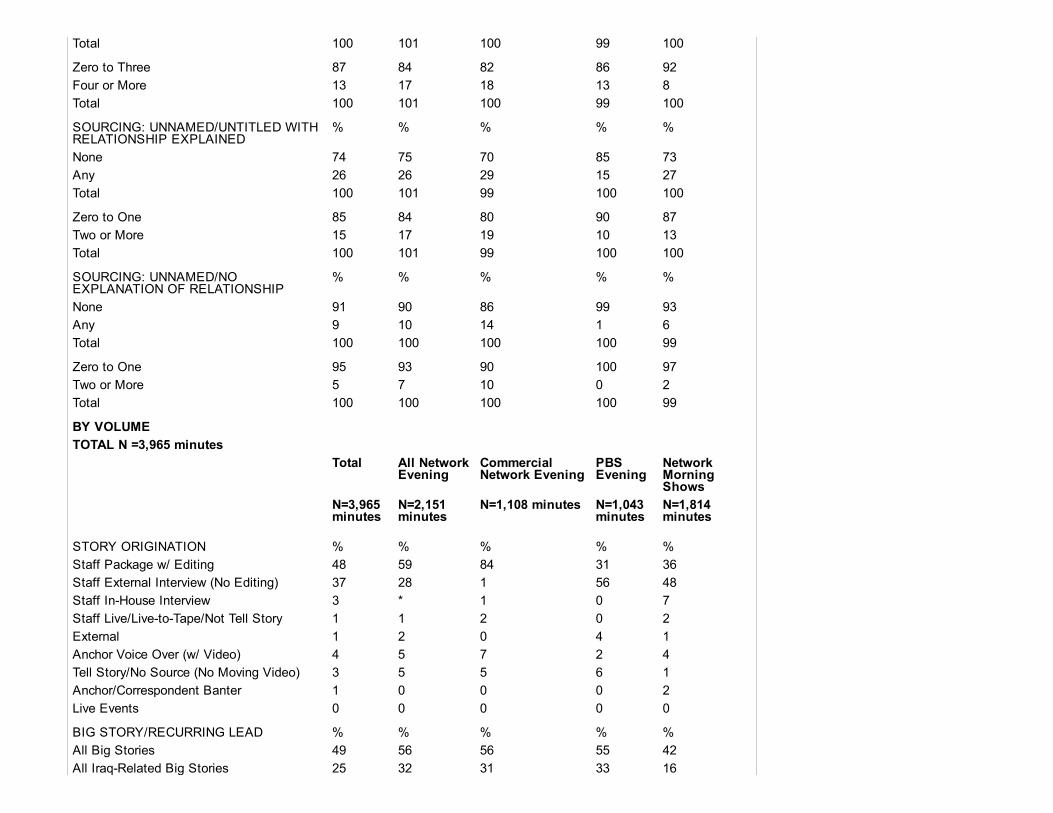
Newspapers also stand out from other media for their originality. In all, 85 percent of the articles on newspaper sectionfronts were staffgenerated. That compares to 32 percent of the lead stories on the Internet that were staffreported.(For Internet this meant a staff person connected to the central news organization, i.e. a New York Times staff personwho also reports in the print pages or a CNN correspondent who also appears on air.)
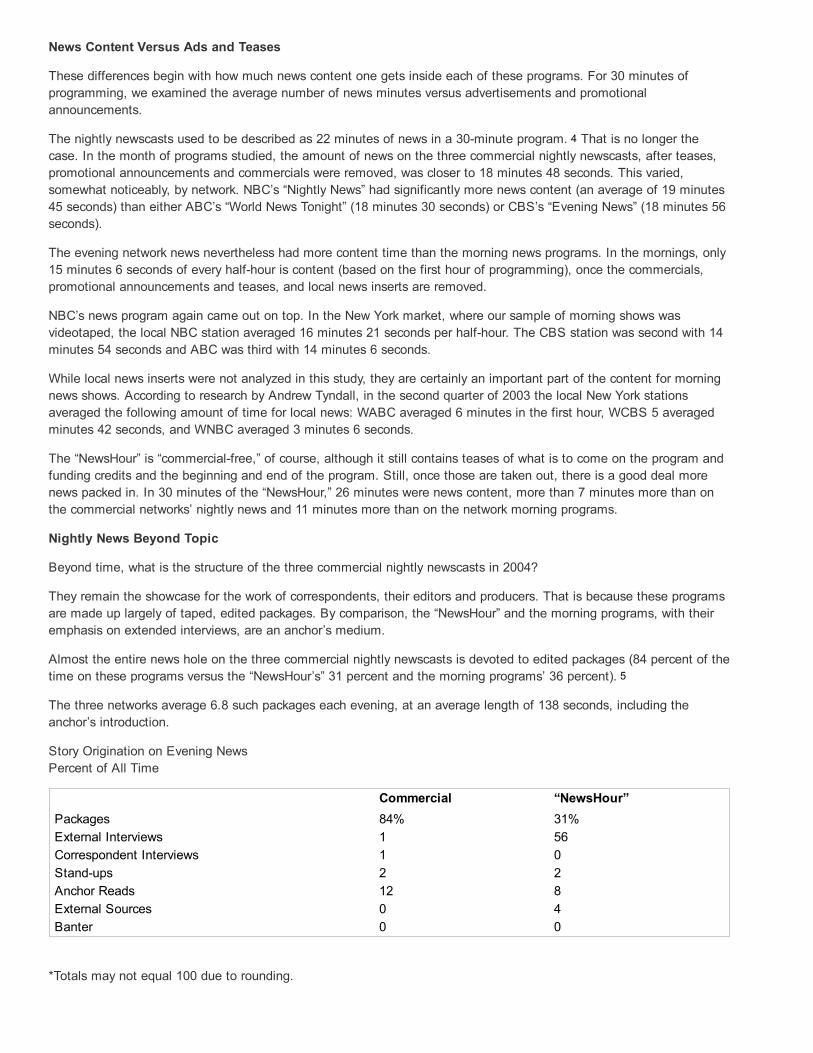
The comparison to television might be to stories with a correspondent involved or clearly some staff reporting, asopposed to brief stories or something explicitly identified as coming from an outside source. In the commercial eveningnews, 56 percent of stories were staffproduced. In mornings, 64 percent were staffproduced.
What about anonymous sourcing? Earlier studies have suggested the use of confidential sourcing in newspapersdepends, not surprisingly, on the article. The level found here is basically consistent with what we found in 2001 incoverage of the response to the terrorist attacks. There, roughly 25 percent of all articles contained anonymous sources.In the broader 2003 study, 28 percent of all articles contained at least one anonymous source.
When confidentiality was granted to sources, there was almost always some attempt by the paper to describe thesource’s level of knowledge or potential biases, such as a police officer working on a case or a Republican operative.Only 2 percent of articles contained an anonymous source without some description of their relationship to events, suchas “sources said.”
At the other end of the spectrum, more than half of the articles studied (52 percent) contained the highest level ofsource description, that is four or more sources who were not only named, but of whom some attempt was made todescribe their pertinent knowledge, expertise or potential biases.
How does newspaper sourcing compare to other media? Commercial network television news, evening and morning,was more likely to use blind anonymous sourcing (14 percent on commercial evening and 6 percent on morning versus 2percent in newspapers) without any description of who the source might be. The commercial networks were about aslikely to use at least one anonymous source that they tried to describe (29 percent on evening and 27 percent onmorning versus 28 percent for newspapers).
The networks were also less likely than newspapers to contain the highest level of sourcing, four or more named andfully described sources (18 percent for commercial evening news and 8 percent for morning shows versus 52 percent fornewspapers and 71% for A1 articles).
Protagonist
Who were newspapers making famous? What was driving the news?
For years critics have argued that television has personalized, or even “celebritized” news, causing journalists to buildtheir stories more around people. The White House, this critique went, became a backdrop for the president.Government stories became focused around a single personality – the mayor in town, taking on the special interests.Politics became more personal. Coverage focused more around scandal.
Does the content bear this out?
Not in 2003 at least, according to this study, and not in newspapers. The news in 2003, apparently, was driven byevents.
Overall, only 32 percent of newspaper articles focused at least half of their content around a single personality. If onelooks only at Page A1 articles, the number is even smaller, 28 percent. Metro pages were most likely to build articlesaround individual protagonists, 36 percent.
Newspaper Tendencies Toward a Central Protagonist Percent of All Stories
If newspapers were not building articles around personalities, were they doing so around institutions, such as the Bushadministration, city hall, Enron or Wall Street? Not really. Even fewer articles, 17 percent, were built around institutions.
Instead, articles tended to focus on several people talking about events and ideas – not pegging them aroundinstitutions or people.
Not even President Bush was the center of newspaper articles studied, something that was also found in other media.While a third of the articles were built around a primary protagonist, President Bush was this personality in less than 1percent, or 54 of the 5,867 studied. If one looks only at A1 front pages, the number rises to only 2 percent.
When it came to articles about the war in Iraq, the Bush administration, rather than the president, was more likely to bethe focus. In all, 12 percent of articles about Iraq focused on the administration or other federal entities, such as thePentagon, compared with just 2 percent that focused on President Bush.
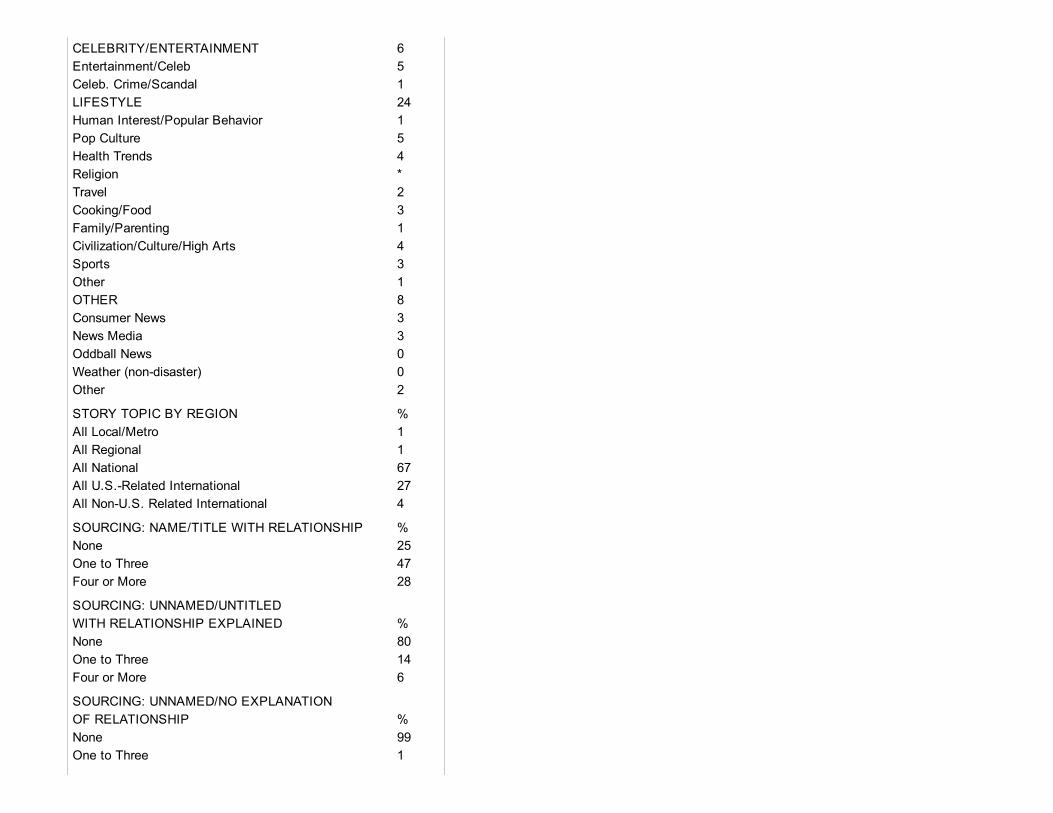
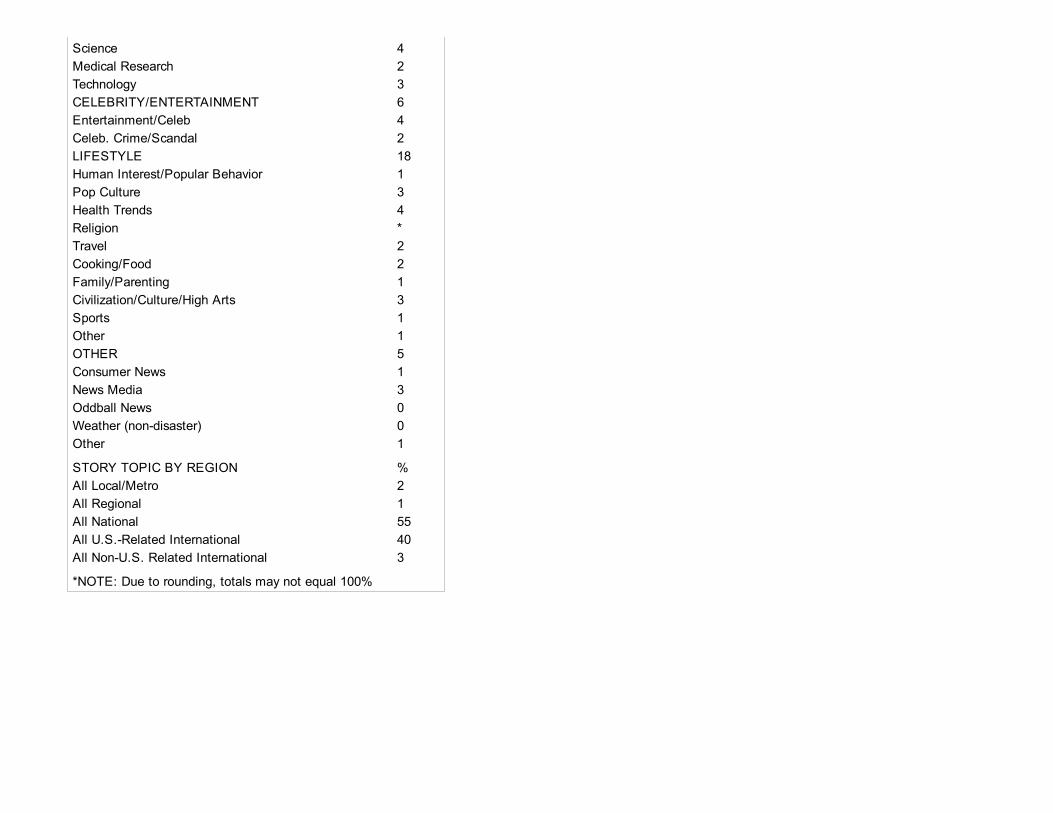
How celebritydriven were newspapers compared with other media? Overall, 4 percent of newspaper articles studiedfocused around a celebrity – primarily on the style sectionfront. This compares with 19 percent for magazine articles.
Newspapers By Size
How much difference does circulation size make in the character of what people get from newspapers? Do the verylargest papers in the country – those with circulations above 750,000 – cover the same topics in roughly the same wayas slightly smaller metropolitan newspapers or even mediumsized papers? (Comparisons below look at the two midrange groups combined.)
In general:
The news becomes more and more local and less international as circulation size decreases.
Wire copy becomes more prevalent as the paper gets smaller.
Articles become shorter at smaller papers.
Anonymous sourcing becomes less common as circulation size decreases.
At the largest papers, those with more than 750,000 circulation, just 40 percent of the space studied was devoted tolocal articles (remember one section front is metro). This increases to 69 percent at midrange papers, 100,000 to750,000 (the twomid circulation groups combined), and then 75 percent at the smallest papers (less than 100,000).
The reverse occurs with national coverage. Large papers devoted 25 percent of the space studied to national articles.Midsized papers devoted 14 percent and small papers 12 percent.
And, if one relies on a smaller local paper, those with less than 100,000 circulation, how much international news wouldthey get on the three section fronts? Just 9 percent of the space examined, versus 22 percent at the largest papers and13 percent at the papers in between.
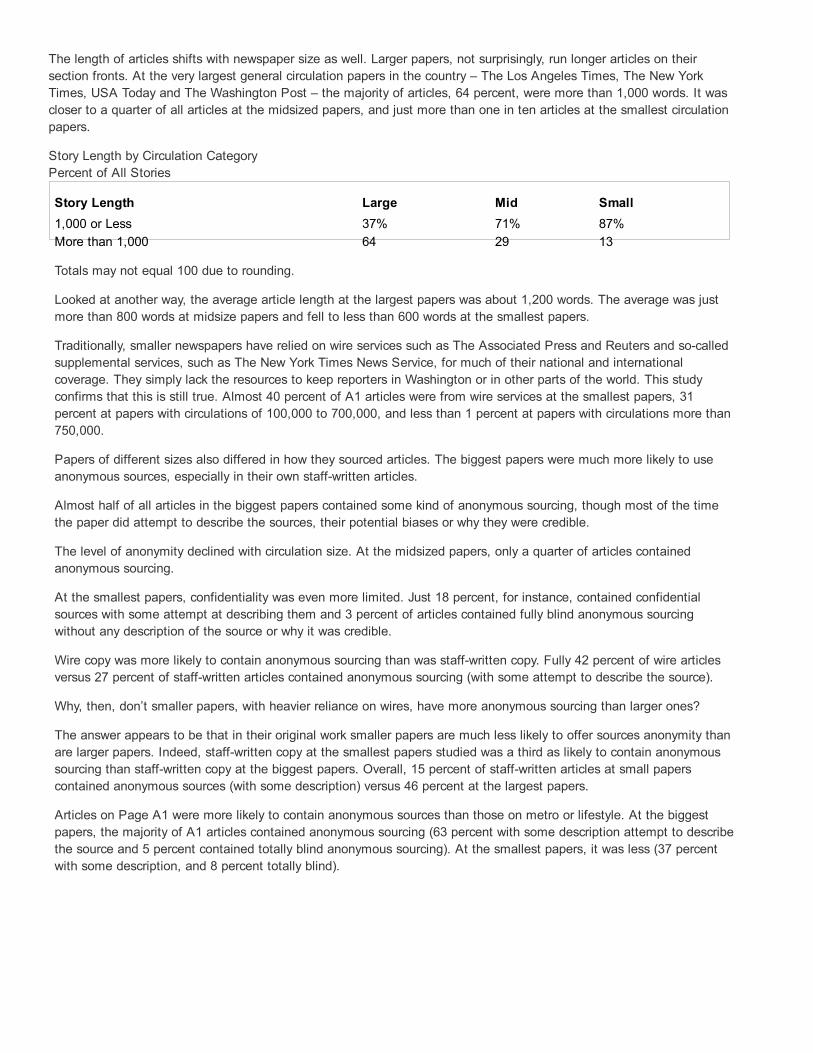
The length of articles shifts with newspaper size as well. Larger papers, not surprisingly, run longer articles on theirsection fronts. At the very largest general circulation papers in the country – The Los Angeles Times, The New YorkTimes, USA Today and The Washington Post – the majority of articles, 64 percent, were more than 1,000 words. It wascloser to a quarter of all articles at the midsized papers, and just more than one in ten articles at the smallest circulationpapers.
Story Length by Circulation CategoryPercent of All Stories
Story Length Large Mid Small1,000 or Less 37% 71% 87%More than 1,000 64 29 13
Totals may not equal 100 due to rounding.
Looked at another way, the average article length at the largest papers was about 1,200 words. The average was justmore than 800 words at midsize papers and fell to less than 600 words at the smallest papers.
Traditionally, smaller newspapers have relied on wire services such as The Associated Press and Reuters and socalledsupplemental services, such as The New York Times News Service, for much of their national and internationalcoverage. They simply lack the resources to keep reporters in Washington or in other parts of the world. This studyconfirms that this is still true. Almost 40 percent of A1 articles were from wire services at the smallest papers, 31percent at papers with circulations of 100,000 to 700,000, and less than 1 percent at papers with circulations more than750,000.
Papers of different sizes also differed in how they sourced articles. The biggest papers were much more likely to useanonymous sources, especially in their own staffwritten articles.
Almost half of all articles in the biggest papers contained some kind of anonymous sourcing, though most of the timethe paper did attempt to describe the sources, their potential biases or why they were credible.
The level of anonymity declined with circulation size. At the midsized papers, only a quarter of articles containedanonymous sourcing.
At the smallest papers, confidentiality was even more limited. Just 18 percent, for instance, contained confidentialsources with some attempt at describing them and 3 percent of articles contained fully blind anonymous sourcingwithout any description of the source or why it was credible.
Wire copy was more likely to contain anonymous sourcing than was staffwritten copy. Fully 42 percent of wire articlesversus 27 percent of staffwritten articles contained anonymous sourcing (with some attempt to describe the source).
Why, then, don’t smaller papers, with heavier reliance on wires, have more anonymous sourcing than larger ones?
The answer appears to be that in their original work smaller papers are much less likely to offer sources anonymity thanare larger papers. Indeed, staffwritten copy at the smallest papers studied was a third as likely to contain anonymoussourcing than staffwritten copy at the biggest papers. Overall, 15 percent of staffwritten articles at small paperscontained anonymous sources (with some description) versus 46 percent at the largest papers.
Articles on Page A1 were more likely to contain anonymous sources than those on metro or lifestyle. At the biggestpapers, the majority of A1 articles contained anonymous sourcing (63 percent with some description attempt to describethe source and 5 percent contained totally blind anonymous sourcing). At the smallest papers, it was less (37 percentwith some description, and 8 percent totally blind).
abecker
Typewritten Text
See end of document for content analysis methodology.
this study. No complete stories are found on Page A1 of the Register; rather, abridged stories are presented, referringthe reader to the full account, found on other pages throughout that day’s edition. Stories published on the lead pagesof the Metro/Local and the Style/Living sections of the Register are included in this analysis.For the New York Times, the following daily selections were made re: applicable “soft news” section: Monday, Tuesday– Arts & Culture; Wednesday – Dining In; Thursday – House and Home; Friday – Escapes; Saturday – Arts & Ideas;Sunday – Styles.
2. The comparable papers are the four papers in our largest circulation category, those with more than 750,000 copiessold daily. Since the early studies looked at number of articles, the comparison here is by articles rather than by inchesas is done below. In the 2003 data, the percentage breakdowns of articles and inches are nearly identical.
3. The analysis now is by words for print and seconds for broadcast. Again there was vast similarity in the two ways ofexamining the data — volume and story.
abecker
Typewritten Text
1. All Page One stories from the Rockford (Illinois) Register were removed from the newspaper database before analysis. This was dictated by the unique frontpage format of the Register, which differed from all other newspapers in
abecker
Typewritten Text
abecker
Typewritten Text
Footnotes
abecker
Typewritten Text
abecker
Typewritten Text
abecker
Typewritten Text
abecker
Typewritten Text
abecker
Typewritten Text
abecker
Typewritten Text
abecker
Typewritten Text
abecker
Typewritten Text
abecker
Typewritten Text
AudienceAudienceNewspaper circulation is in decline....
The root problems go back to the late 1940s, when the percentage of Americans reading newspapers began to drop. Butfor years the U.S. population was growing so much that circulation kept rising and then, after 1970, remained stable.
That changed in 1990 when circulation began to decline in absolute numbers.
And the problem now appears to be more than fewer people developing the newspaper habit. People who used to readevery day now read less often. Some people who used to read a newspaper have stopped altogether.
Today, just more than half of Americans (54 percent) read a newspaper during the week, somewhat more (62 percent) onSundays, and the number is continuing to drop. 1
Overall, some 55 million newspapers are sold each day, 59 million on Sunday.
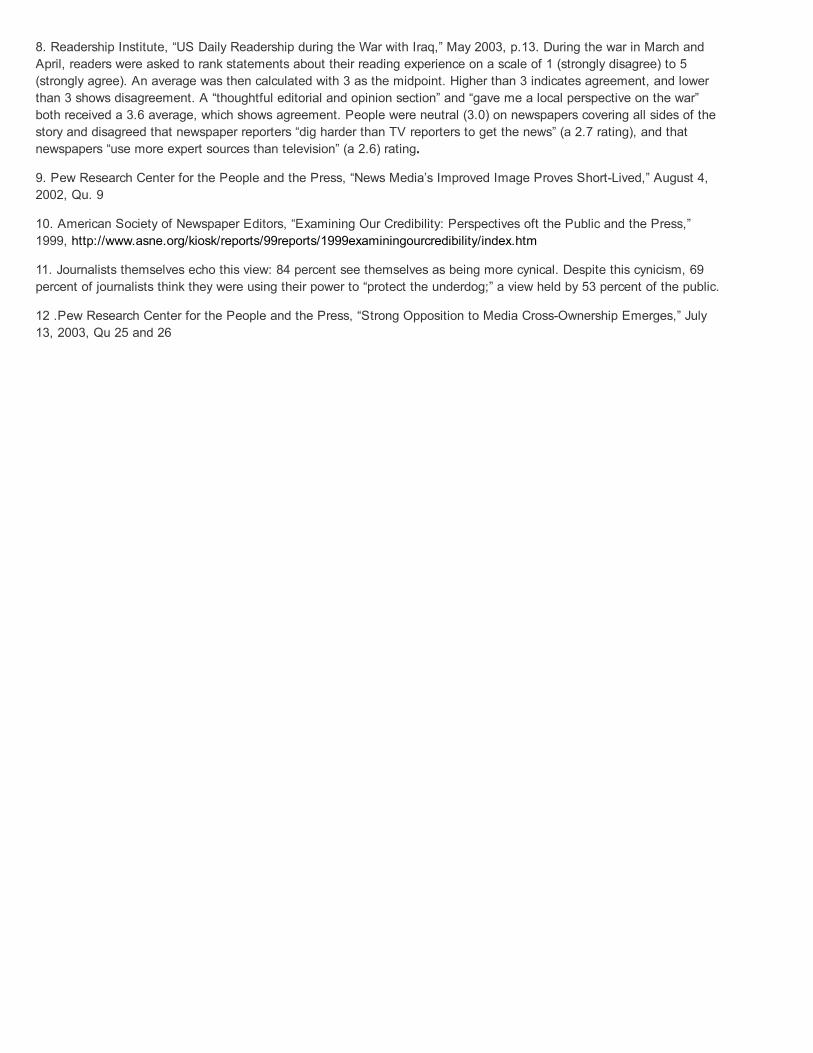
At the same time, the number of newspapers in the country has been on a steady decline for even longer, droppingnearly 1 percent a year for now two decades to 1,457 in 2002. 2
Where are readers going? It is impossible to say fully. Some people may be getting news online, some perhaps fromcable television. Some may be opting out of traditional news sources. Others may be sharing copies of a paper amongmultiple readers. Many people now read newspapers only occasionally, a couple days a week, but no longer everyday.Much of the loss came from people no longer reading afternoon papers. Whatever it is, these people are not payingeveryday for the journalism produced by newspapers, even if they are reading it in other outlets such as online.
Some newspaper companies are now deemphasizing paid circulation and pushing total readership as more meaningful.Readership helps capture multiple readers in a single household or people reading a copy in public settings like a coffeeshop or waiting room. And readership studies can provide advertisers with more detailed information about who reads,what they read and how much time they spend with a newspaper. But the emphasis on readership is also a sign that thecirculation story is not a good one.
Daily Circulation
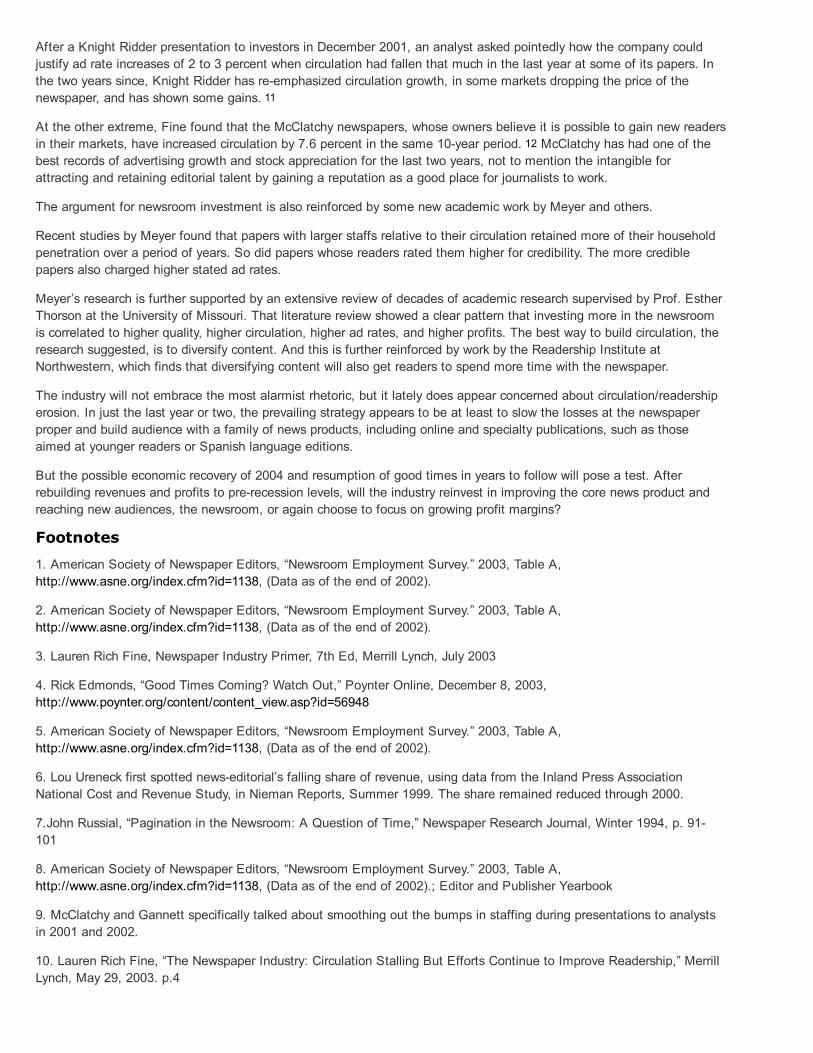
In some ways, it is remarkable how long newspaper circulation remained so stable. From World War II until 1970, as theUnited States saw tremendous economic growth, a rising and changing population, a move to suburbia, and the adventof television, the number of newspapers sold each day in the United States was still growing.
During this time, a smaller percentage of Americans read a newspaper every day – especially after the evolution of TVnews in the 1960s. The erosion, however, was outpaced by population growth – a nearly 50 percent increase in thenumber of U.S. households between 1970 and 1990. 3 By 1970, indeed, newspaper reading in the United States hadreached a new peak. Some 62 million newspapers were sold in the country every day. 4
abecker
Typewritten Text
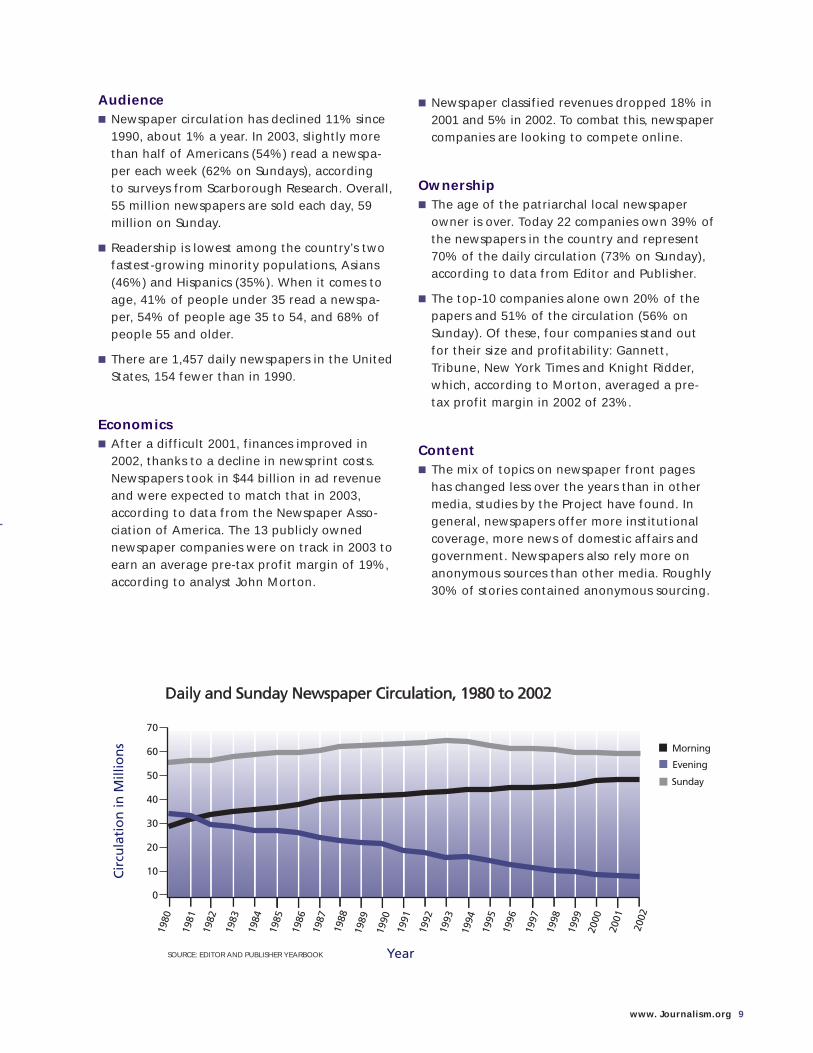
Design Your Own ChartSource: Editor and Publisher Yearbook data.By 1990, however, even the boost from a growing population was not enough to maintain how many newspapers weresold each day. Circulation began dropping at the rate of 1 percent every year from 1990 to 2002. By 2002, weekdaycirculation of U.S. newspapers had dropped 11 percent in 12 years 5
The real rate of circulation decline could be even greater. The Audit Bureau of Circulations changed the way it countedcirculation to include bulk sales of papers to places like airlines and hotels for free distribution. These sales are technically“bought” by the hotel or airline, often through a barter exchange, but can make up a significant part of total circulation.For example, 46 percent of USA Today’s circulation – 987,670 papers – comes from bulk sales. 6 And the ABC ruleshave been liberalized in other smaller ways through the years, masking even further the true extent of circulation loss,according to Rick Edmonds at the Poynter Institute who has examined this closely. 7
The vast majority of circulation loss in the last 30 years has been at afternoon papers, and much of that from papers thatceased publishing. Some other losses in overall circulation since 1990 came from papers purposely trimming delivery todistant outlying communities. Thus some of the loss does not suggest freefall. Indeed, morning circulation in 2001 wasthe highest it has ever been – 46.8 million – before declining slightly in 2002 (the first decline in morning circulation since1975). 8
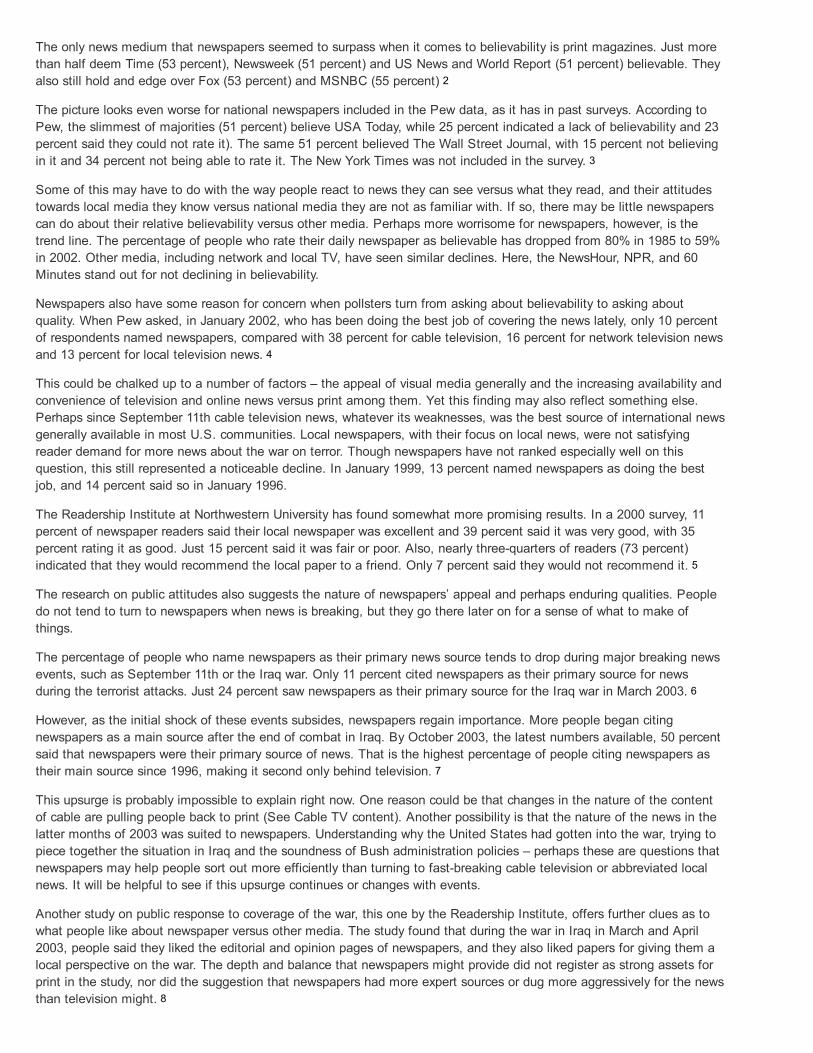
To fully appreciate the drop in the newspaper’s popularity, it is also useful to take a closer look at socalled “householdpenetration” – the number of newspapers sold as a percentage of all households in the country. In one sense, penetrationreveals the full extent of newspapers’ declining appeal. In 1950, 123 percent of households bought a newspaper (in otherwords there were 1.23 papers sold per household.) By 1990, only 67 percent of households bought a newspaper. By2000, it was 53 percent. 9
abecker
Typewritten Text
U.S. Daily Newspaper Circulation Weekday and Sunday editions, measured in five-year increments, 1940 to 2000
abecker
Typewritten Text
abecker
Typewritten Text
Design Your Own ChartSource: Editor and Publisher Yearbook data; U.S. Census Bureau
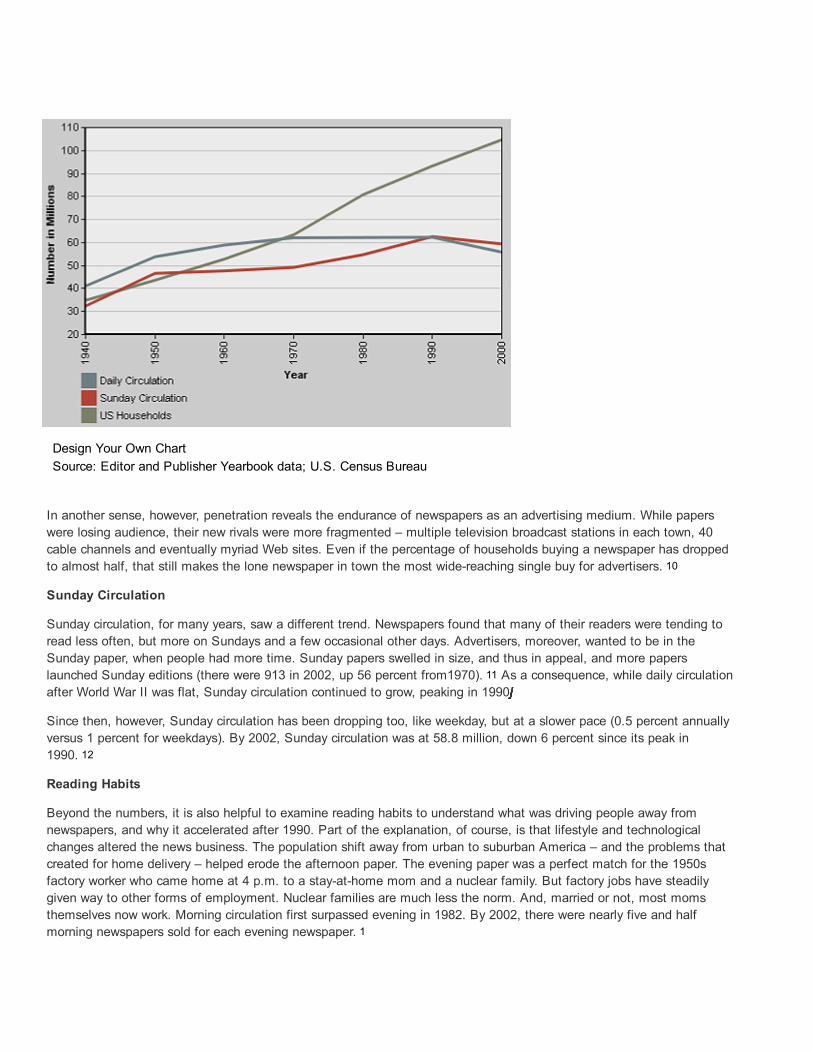
In another sense, however, penetration reveals the endurance of newspapers as an advertising medium. While paperswere losing audience, their new rivals were more fragmented – multiple television broadcast stations in each town, 40cable channels and eventually myriad Web sites. Even if the percentage of households buying a newspaper has droppedto almost half, that still makes the lone newspaper in town the most widereaching single buy for advertisers. 10
Sunday Circulation
Sunday circulation, for many years, saw a different trend. Newspapers found that many of their readers were tending toread less often, but more on Sundays and a few occasional other days. Advertisers, moreover, wanted to be in theSunday paper, when people had more time. Sunday papers swelled in size, and thus in appeal, and more paperslaunched Sunday editions (there were 913 in 2002, up 56 percent from1970). 11 As a consequence, while daily circulationafter World War II was flat, Sunday circulation continued to grow, peaking in 1990 jjjjjjjjjjjjj
Since then, however, Sunday circulation has been dropping too, like weekday, but at a slower pace (0.5 percent annuallyversus 1 percent for weekdays). By 2002, Sunday circulation was at 58.8 million, down 6 percent since its peak in1990. 12
Reading Habits
Beyond the numbers, it is also helpful to examine reading habits to understand what was driving people away fromnewspapers, and why it accelerated after 1990. Part of the explanation, of course, is that lifestyle and technologicalchanges altered the news business. The population shift away from urban to suburban America – and the problems thatcreated for home delivery – helped erode the afternoon paper. The evening paper was a perfect match for the 1950sfactory worker who came home at 4 p.m. to a stayathome mom and a nuclear family. But factory jobs have steadilygiven way to other forms of employment. Nuclear families are much less the norm. And, married or not, most momsthemselves now work. Morning circulation first surpassed evening in 1982. By 2002, there were nearly five and halfmorning newspapers sold for each evening newspaper. 1
abecker
Typewritten Text
U.S. Daily Newspaper Circulation vs. Number of Households Number in millions, measured in 10-year increments
abecker
Typewritten Text
abecker
Typewritten Text
abecker
Typewritten Text
abecker
Typewritten Text
abecker
Typewritten Text
abecker
Typewritten Text
abecker
Typewritten Text
Design Your Own ChartSource: Editor and Publisher Yearbook data
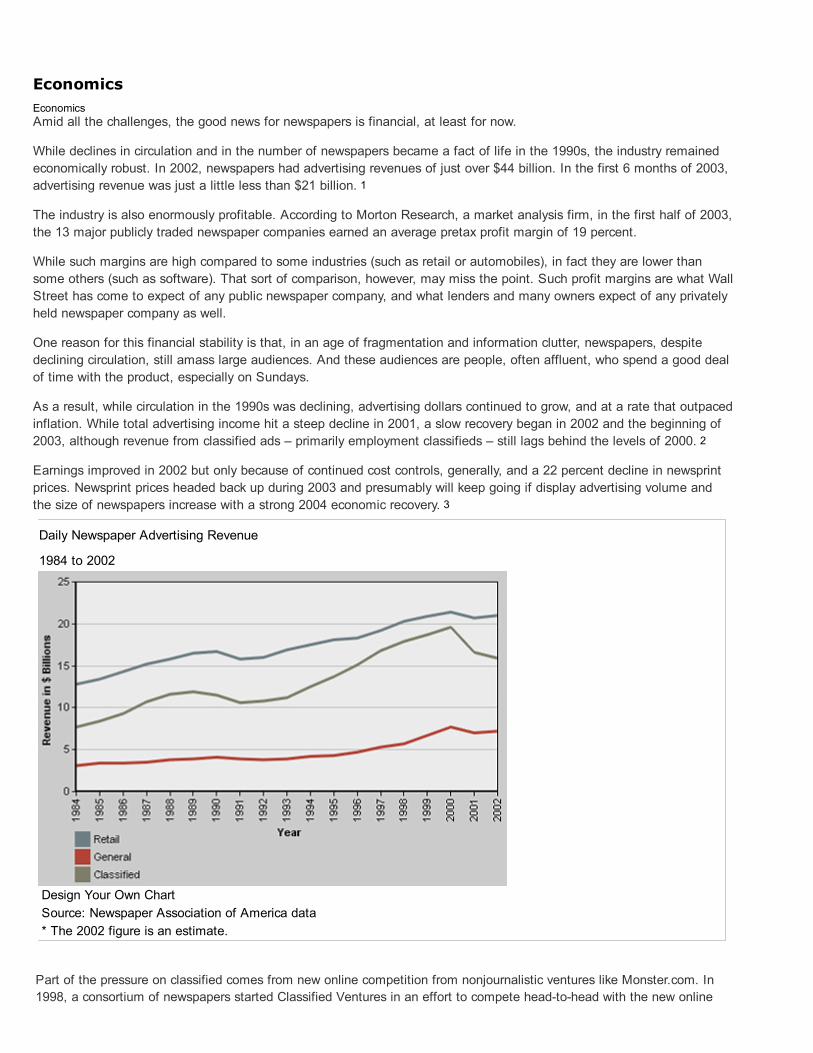
But as those shifts were occurring, the newspaper industry also made choices that had important and likely negativeconsequences on readership and circulation. Newspapers make roughly 80 percent of their revenue from advertising, andonly 20 percent from circulation. 15 Indeed, it costs most papers more to print each paper than they actually sell it for, buthigher sales allow the papers to charge higher advertising rates. Influenced in part by advertisers who increasingly wantedto focus exclusively on people who were likely to buy a lot of goods, newspaper companies in the 1970s and 1980sdecided to chase demographics rather than readers. Around the same time, many newspapers also began embarking onpricing strategies that further made the newspaper even more forbidding to less affluent audiences
That shift toward elite audiences dictated where the circulation declines occurred. By and large, when the afternoonpapers that appealed more to working class readers died, those readers stopped reading newspapers.
People can debate which came first – the disappearance of middleclass audiences or the pricing and coverage strategiesthat made newspapers even less appealing to those audiences. Whichever, they reinforced each other. In the short run,that may have made economic sense. Why add readers who advertisers are not interested in, when the cost of producingand delivering additional newspapers does not pay for itself without new advertising dollars to underwrite it?
But in the long run, as the circulation numbers suggest, the strategy raises questions. As the children of these lostreaders become more affluent and influential, can it be assumed that they will just gravitate to a newspaper no matterwhat? And how can a publisher grow a business in the longterm if it is not growing its audience?
abecker
Typewritten Text
abecker
Typewritten Text
abecker
Typewritten Text
Number of U.S. Daily Newspapers Weekday and Sunday editions, 5-year increments, 1940 to 2000
abecker
Typewritten Text
abecker
Sticky Note
Completed set by abecker
abecker
Typewritten Text
abecker
Typewritten Text
abecker
Typewritten Text
abecker
Typewritten Text
Design Your Own ChartSource: Editor and Publisher Yearbook data
The Rise of National Newspapers
An exception to the 20year slide in circulation has been national papers. USA Today has gone from a dead start to acirculation of 2.1 million daily. There is no exact measure of its impact on other dailies, but it clearly supplants localpapers for conventiongoers and other travelers and represents competition to the other two nationally circulated dailies,The New York Times and The Wall Street Journal. Only 14 percent of USA Today’s circulation comes from home delivery.The Wall Street Journal holds its own, going back over the 2 million mark (with the addition in the most recent ABC auditof 300,000 paid subscribers to its online edition). 16 Threequarters of its circulation is attributed to home delivery andsubscription sales spread across the country. Less obviously, The New York Times has gradually shifted from ametropolitan New York paper with some national circulation to having nearly half its circulation outside the New York Cityarea. 17
In addition to a variety of free Internet news sites and the rise of CNN and NPR, the competitive climate for providing abasic national and international news report has grown far tougher for the typical metropolitan or smallcity newspaper.Together, the top 7 percent of the nation’s newspapers (105 out of 1,457) command 55 percent of the total circulation. 18
abecker
Typewritten Text
abecker
Typewritten Text
abecker
Typewritten Text
Average Circulation of U.S. Daily Newspapers Weekday and Sunday editions, measured in five-year increments, 1940 to 2000
Design Your Own ChartSource: Editor and Publisher Yearbook 2003* Due to rounding, percents do not add up to 100.
Number of U.S. Daily Newspapers with Circulation Over 50,000
1950 to 2000, measured in 5year increments
Design Your Own ChartSource: Editor and Publisher Yearbook data
Percent of Newspapers and Total Circulation by Circulation Category, 2002
abecker
Typewritten Text
abecker
Typewritten Text
abecker
Typewritten Text
abecker
Typewritten Text
abecker
Typewritten Text
abecker
Typewritten Text
abecker
Typewritten Text
The problem for the newspaper industry is not just young readers. People of every age bracket – except those over 65– are starting to read newspapers less.
The newspaper industry is failing to attract newer immigrant groups. The backbone of the industry remains nonHispanic whites and African Americans, the two population groups not growing much.
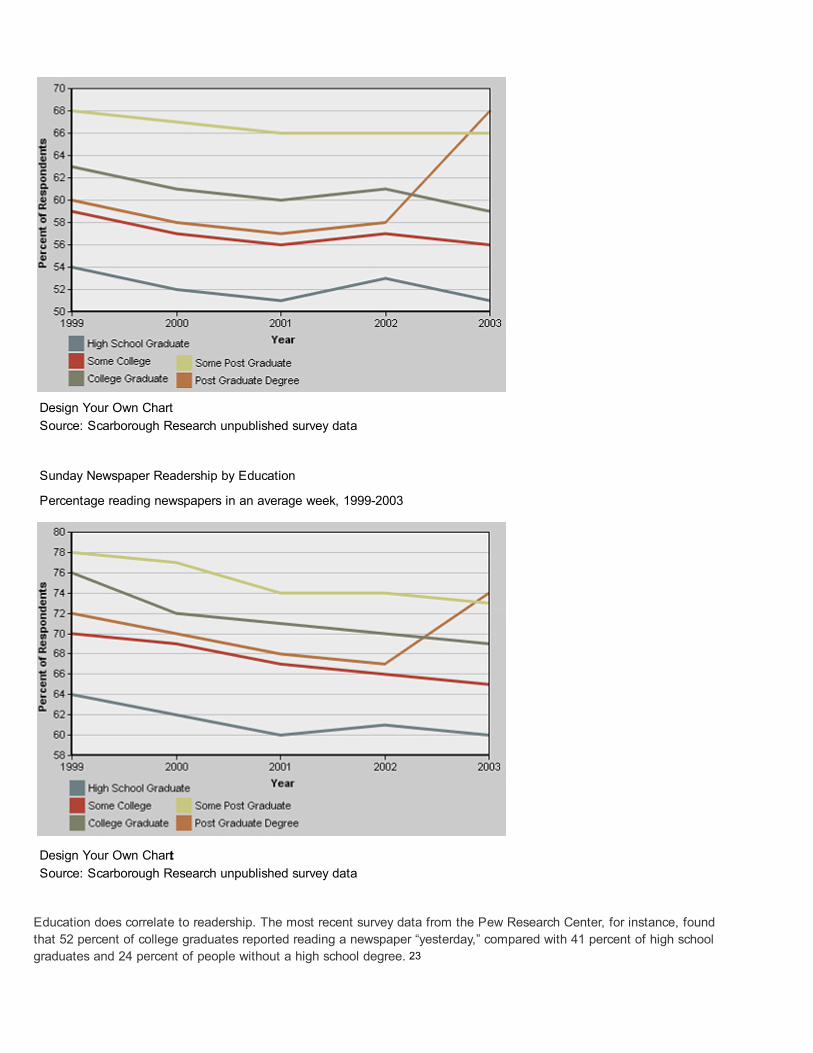
Papers are losing among people at all educational levels, although that trend may have reversed somewhat sinceSeptember 11.
Age Groups
As always, young people appear to read newspapers less than their elders. According to 2003 data from ScarboroughResearch, a consumer market company, only 40 percent of people aged 18 to 24 read a paper on weekdays, and lessthan half on Sundays (48 percent). The numbers are slightly higher for people 2534 (41 percent weekdays and 52percent Sundays). 19
Weekday Newspaper Readership by Age Grou.p
Percentage reading newspapers in an average week, 19992003
Design Your Own ChartSource: Scarborough Research unpublished survey data
In trying to assess circulation and readership trends, there are other elements of demographics that need to be understood beyond income. Three stand out.
abecker
Typewritten Text
abecker
Typewritten Text
Who Is Reading: A Question Of Demographics
abecker
Typewritten Text
Design Your Own Char.tSource: Scarborough Research unpublished survey data
The more important trend today may be what is happening to readers between the ages of 34 and 64, the people whoshould be the prime target for becoming citizens engaged in civil society. These are the people buying houses, havingchildren, worrying about schools, building their careers, running for office, becoming leaders in their communities. Theirnumbers are declining as well, and in some cases at a faster rate than for people under 34.
These findings are borne out by new studies by the Pew Research Center for the People and the Press. While its earlierstudies of what it called the “Age of Indifference” suggested that young people were not acquiring the news consumptionhabits at the same rate in their 20s as was true of earlier generations, the newest survey on news consumption, in 2002,found evidence that developing the habit was no longer the lone issue. People who had become newspaper consumershad stopped. 20
The bright spot for newspapers remains, as it has for some years, older people. Readership for people over 65 is justbarely declining – 1 percent since 1999 for both daily and Sunday. One question is whether Baby Boomers, who willbegin to turn 65 in 2011, will read newspapers as heavily as people that age do now. If so, that could be a boon tonewspapers. If not, more trouble looms.
This is one reason why current experiments by papers like The Washington Post and The Chicago Tribune to producefree papers aimed at young adults (18to34yearolds) are being so closely watched.
To many in the newspaper industry, the fact that newspapers began only recently to experiment with such papers reflectsthe industry’s slowness to innovate and to invest in research and development generally. These kinds of enterprises aretypically defensive moves to protect the franchise. They are most often initiated out of fear that a portion of the market isslipping away or has never developed the newspaper reading habit. Free papers first appeared as alternative papersmany years ago and were considered competition for entertainment advertising but were never thought to be a seriouscompetitor or an idea that the metro papers should try.
Such thinking is explained, in part, by the old newspaper business model for doing something new: return on investment.There had to be projected revenue to offset costs of a new venture in a relatively short term. Newspapers were not likelyto favor such investments solely for their longterm value without a clear prospect for a new revenue stream. Indeed, evensome of these experiments are projected to generate revenue and are being conducted at limited cost.
Ethnicity and Readership
The second major area of concern for the newspaper industry may be ethnicity. The newspaper industry was built, morethan a century ago, by populist publishers such as Joseph Pulitzer and E.W. Scripps on the appeal of newspapers to themasses, particularly immigrants. Often these publishers themselves were immigrants, as in the case of Pulitzer, Scripps,Adolph Ochs and others.
abecker
Typewritten Text
Sunday Newspaper Readership by Age Group Percentage reading newspapers in an average week, 1999-2003
abecker
Typewritten Text
The industry, now run by corporations rather than (often immigrant) entrepreneurs, has moved in a very different direction(see Reading Habits, above). At the beginning of the 21st century, readership is lowest among the country’s two fastestgrowing minority populations – Asians and Hispanics. The industry is seeking to address this now. For instance, this yearnewspapers in Dallas and Fort Worth joined the paper in Miami in offering Spanishlanguage editions. The Los AngelesTimes is launching a Spanishlanguage edition in Southern California to compete with its former partner, the familyowned La Opinion, which in turn joined forces with a New York Spanishlanguage daily, El Diario/La Prensa, so that theycould compete with the major newspaper chains for major advertisers. This battleground is a trend to monitor..
Among Asians, weekday readership in 2003 had dropped 5 percentage points in the four years since 1999 (to just 46percent). That is a faster rate of decline than for whites (down 3 percentage points in that time) or African Americans(down 2 percentage points). 21
Among the fastestgrowing group in America, those who describe themselves as Latino or Hispanic, there has been a 4point drop, again higher than for whites or African Americans. This group, indeed, has the lowest weekday readershiprates of the four groups (just 35 percent, down from 39 percent four years earlier). The same rapid declines are true onSunday. 22
Data on the Spanish language presses (see ethnic and alternative news chapter) suggest that these immigrants arereading newspapers, but they are choosing Spanishlanguage papers over those in English.
Weekday Newspaper Readership by RaceEthnicity
Percentage reading newspapers in an average week, 19992003
Design Your Own ChartSource: Scarborough Research unpublished survey data
Design Your Own ChartSource: Scarborough Research unpublished survey data
Educatio.n
While people with more education remain more likely to read a newspaper, declines in readership have been occurringregardless of education level.
Indeed, in the last four years, according to Scarborough, readership has actually fallen somewhat faster among thosewith fouryear college degrees than among those with only high school diplomas.
Among college graduates, the group most likely to report reading the paper, readership has fallen 4 percentage points inthe last four years on weekdays (from 63 to 59 percent) and 7 points on Sundays (from 76 to 69 percent). Among highschool graduates, the decline was 3 percentage points on weekdays and 4 on Sundays (54 to 51 percent and 64 to 60percent, respectively).
Readers with postgraduate degrees, however, reverse the trend. From 1999 to 2002 their readership was declining alongwith the other ages. But in 2003, their daily readership shot up 10 percentage points from one year earlier to 68 percent.
abecker
Typewritten Text
Sunday Newspaper Readership by Race-Ethnicity Percentage reading newspapers in an average week, 1999-2003
abecker
Typewritten Text
Design Your Own ChartSource: Scarborough Research unpublished survey data
Sunday Newspaper Readership by Education
Percentage reading newspapers in an average week, 19992003
Design Your Own Char.tSource: Scarborough Research unpublished survey data
Education does correlate to readership. The most recent survey data from the Pew Research Center, for instance, foundthat 52 percent of college graduates reported reading a newspaper “yesterday,” compared with 41 percent of high schoolgraduates and 24 percent of people without a high school degree. 23
abecker
Typewritten Text
abecker
Sticky Note
Completed set by abecker
abecker
Typewritten Text
abecker
Typewritten Text
Weekday Newspaper Readership by Education Percentage reading newspapers in an average week, 1999-2003
Design Your Own ChartSource: Pew Research Center for the People and the Press
Footnotes
1. Different surveys come up with slightly different numbers for how often people read newspapers. The broadestmeasure, which the Pew Research Center for the People and the Press has used, asks if a person reads a newspaper“regularly” without specifying weekday or Sunday and found 63% in 2002. Pew also has a survey question it has used forseveral years that asks if people read a newspaper “yesterday” and found in 2002 41%. Scarborough Research askswhether people read a newspaper “in an average week” and finds the numbers we used above. As this number comesclosest to household penetration and sits between the two other ways of asking the question, it seems the safest numberto use.
2. Editor and Publisher Yearbook Online data, 19402003, www.editorandpublisher.com
3. U.S. Census Bureau
4. Editor and Publisher Yearbook Online data, 19402003, www.editorandpublisher.com
5. Editor and Publisher Yearbook Online data, 2003, www.editorandpublisher.com. These are the most complete databecause Editor and Publisher collects circulation data from both ABC and directly from nonABC newspapers. Data for2003 were not available at the time of this report.
6. Audit Bureau of Circulations, Newspaper Publisher’s Statement, March 30, 2003, www.accessabc.com. In bulk sales,we included all papers listed outside of individually paid circulation, which includes hotel sales, educational copies andthird party sales to such business as airlines and restaurants.
7.In 2003, Edmonds notes, ABC made it easier to count thirdparty sales – that is in combination with a magazine orother entity – and let papers report certain paid electronic edition circulation.
8. Editor and Publisher Yearbook Online data, 19402003, www.editorandpublisher.com
9. Editor and Publisher Yearbook Online data, 19402003, www.editorandpublisher.com; U.S. Census
10. The work of the scholar Robert Picard, professor at Finland’s Turku School of Economics and BusinessAdministration, finds this the central explanation for the longterm trend of thriving newspaper advertising in a flat ordeclining circulation environment. Lauren Rich Fine, a Merrill Lynch analyst, says in her 2003 annual Newspaper Primerthat some share of advertisers simply want to buy the newspaper in a given market and hence may be indifferent to smallchanges – up or down – in circulation.
11. Editor and Publisher Yearbook Online data, 19402003, www.editorandpublisher.com
Percent of People Reading a Newspaper the Day Before By education, June 2002
12.Sunday circulation surpassed daily in 1990, and in 2002 was still 7 percent larger, some 3.6 million more papers sold,than weekday circulation.
13. Editor and Publisher Yearbook Online data, 19402003, www.editorandpublisher.com
14. In terms of the number of newspapers, it was not until 2000 that morning newspapers pulled ahead (766 to 727). Butonly two years later the gap had widened to 777 versus 692.
15. Veronis Suhler Stevenson, “Communications Industry Forecast,” July 2002, p. 302. Data from 2001.
16. Mark Glaser, “Journal Takes Broader View of Circulation with Online Inclusion,” Online Journalism Review, November11, 2003. Available online at www.ojr.org/ojr/glaser/1068601595.php.
17. Audit Bureau of Circulations, “Newspaper Publisher’s Statements,” March 30, 2003, www.accessabc.com
18. Editor and Publisher Yearbook Online data, 2003, www.editorandpublisher.com
19. Scarborough Research, unpublished data, www.scarborough.com. Each year, each year Scarborough surveys arandom sample of more than 200,000 adults 18 and over using a combination of a telephone interview and a mailedsurvey. These surveys occur in the top 75 designated market areas (DMAs). The data are weighted to create an accurateportrayal of the surveyed DMAs, which accounted for 75 percent (84,675,100) of all U.S. households in 2003, accordingto Nielsen Media. They found 62 percent reading the Sunday paper in an average week. The Pew Research Center forthe People and the Press asks more generally if a person “reads a newspaper regularly” and reports 63 percentresponding yes for April 2002 in the report “Public’s News Habits Little Changed By Sept. 11,” June 9, 2002, p, 57. Whenthey ask about reading a paper yesterday, the number falls to 41 percent (p. 34).
20. Pew Research Center for the People and the Press, “Public’s News Habits Little Changed By Sept. 11,” June 9,2002, p.3
EconomicsEconomicsAmid all the challenges, the good news for newspapers is financial, at least for now.
While declines in circulation and in the number of newspapers became a fact of life in the 1990s, the industry remainedeconomically robust. In 2002, newspapers had advertising revenues of just over $44 billion. In the first 6 months of 2003,advertising revenue was just a little less than $21 billion. 1
The industry is also enormously profitable. According to Morton Research, a market analysis firm, in the first half of 2003,the 13 major publicly traded newspaper companies earned an average pretax profit margin of 19 percent.
While such margins are high compared to some industries (such as retail or automobiles), in fact they are lower thansome others (such as software). That sort of comparison, however, may miss the point. Such profit margins are what WallStreet has come to expect of any public newspaper company, and what lenders and many owners expect of any privatelyheld newspaper company as well.
One reason for this financial stability is that, in an age of fragmentation and information clutter, newspapers, despitedeclining circulation, still amass large audiences. And these audiences are people, often affluent, who spend a good dealof time with the product, especially on Sundays.
As a result, while circulation in the 1990s was declining, advertising dollars continued to grow, and at a rate that outpacedinflation. While total advertising income hit a steep decline in 2001, a slow recovery began in 2002 and the beginning of2003, although revenue from classified ads – primarily employment classifieds – still lags behind the levels of 2000. 2
Earnings improved in 2002 but only because of continued cost controls, generally, and a 22 percent decline in newsprintprices. Newsprint prices headed back up during 2003 and presumably will keep going if display advertising volume andthe size of newspapers increase with a strong 2004 economic recovery. 3
Daily Newspaper Advertising Revenue
1984 to 2002
Design Your Own ChartSource: Newspaper Association of America data* The 2002 figure is an estimate.
Part of the pressure on classified comes from new online competition from nonjournalistic ventures like Monster.com. In1998, a consortium of newspapers started Classified Ventures in an effort to compete headtohead with the new online
startups for key classified ads. In 2003, Classified Ventures investors included Belo, Gannett, Knight Ridder, McClatchy,The Tribune Company and the Washington Post Company. The group runs Cars.com and Apartments.com, and connects170 online newspaper and television Web sites. 4
While it has been successful with these sites, it has not always been able to best the new companies. ClassifiedVentures’ auctions.com, launched in 1999, failed to rival the online giant eBay and is now defunct. The TribuneCompany, Knight Ridder and Gannett have sought to address the decline in employment advertising with their ownemployment online site, CareerBuilder.com, and have gained substantial ground on industry leader, Monster.com.
Still, since late 2000, newspaper recruitment classified dropped from 19 percent of total industry revenue to less than 8percent in 2003, according to research from Goldman Sachs. One market analyst, Peter M. Zollman, founder ofClassified Intelligence, an online classified consulting firm, predicts that newspapers’ share of online classified will declinefor “a long time.” Even with the moves that some of the big newspapers have made, he contends, many papersresponded too slowly to employers’ needs. 5
The problem is compounded by a loss in the 1980s of department and grocery store retail ads, which had once been thetwo biggest sources of retail advertising. As these stores died out or consolidated, the discount retailers that sprang up toreplace them, like WalMart and Best Buy, bought little or no newspaper advertising. While this has been going on fordecades, it is another longterm pressure on the industry. 6
In the long run, newspapers may have to prove themselves as a medium that can build new audience by offeringsomething that the rivals from online and elsewhere do not. They need to cover aspects of the community, offer a depthof information, and provide a level of synthesis other media do not.
Print, uniquely, has the potential to tell people what they can trust and not trust in an age that the journalist and educatorMichael Janeway has called one of “fact promiscuity, fact chaos.” 7 Or what Vartan Gregorian, the president of theCarnegie Corporation, has called a time when information is in oversupply but knowledge in undersupply. 8
Accomplishing this may depend on the willingness and ability of newspapers to sustain their quality and diversify theircontent to win back disappearing readers.
Footnotes
1. Newspaper Association of America, “Quarterly Newspaper Advertising Expenditures,”http://www.naa.org/UtilArtPage.cfm?AID=1399&TID=378
2. Newspaper Association of America, “Quarterly Newspaper Advertising Expenditures,”http://www.naa.org/UtilArtPage.cfm?AID=1399&TID=378
3. Lauren Rich Fine, Newspaper Industry Primer, 7th Edition. Merrill Lynch, July 9, 2003. p.10
4. Classified Ventures web site: http://www.classifiedventures.com/business/who_we_are.htm
5. Lucia Moses, “Help Wanting,” Editor and Publisher online, December 8, 2003, www.editorandpublisher.org
6. Leo Bogart makes the point that the industry has been resilient in finding new types of advertising – such as cell phoneplans – to cover the loss of these two giant categories. Leo Bogart, “Newspapers. Figure out how to give readers a choiceand take your eye off the quarterly earnings report,” Media Studies Journal, Spring/Summer 1999, p. 6068.
7.Meeting at Columbia University to discuss journalism curriculum at which author was in attendance, November 14,2003.
8. Gregorian has made this point many times, but specifically did so at a meeting of Columbia University Task Force toreexamine journalism education, Winter 2002 with the author in attendance.
OwnershipOwnershipHundreds of owners run the nation’s 1,457 newspapers, but about two dozen companies dominate.
Percent of Daily Newspapers Owned by Largest Newspaper Groups
Design Your Own ChartSource: Editor and Publisher Yearbook; PEJ research* The largest groups include the 22 newspaper groups with a combined daily circulation of over 500,000.
Percent of Daily Circulation Belonging to Largest Newspaper Groups
Design Your Own ChartSource: Editor and Publisher Yearbook; PEJ research* The largest groups include the 22 newspaper groups with a combined daily circulation of over 500,000.
Design Your Own ChartSource: Editor and Publisher Yearbook; PEJ research* The largest groups include the 22 newspaper groups with a combined daily circulation of over 500,000.
In order to get an accurate view of the major newspaper groups’ influence, consider a few numbers: In 2002, the 22largest newspaper chains owned 39 percent of all the newspapers in the country (562 papers). Yet those papers represent70 percent of daily circulation and 73 percent of Sunday. And their influence appears to be growing. These circulationpercentages are a full percentage point higher than in 2001, even though the number of newspapers owned by thesegroups dropped slightly. 1
Top Ten Groups’ Percent of Total Weekday Circulation
Design Your Own ChartSource: Editor and Publisher Yearbook; PEJ research* The top ten groups are by combined weekday circulation.
Percent of Sunday Circulation Belonging to Largest Newspaper Groups
abecker
Typewritten Text
abecker
Typewritten Text
Design Your Own ChartSource: Editor and Publisher Yearbook; PEJ research* The top ten groups are by combined weekday circulation.
The circulation power is even greater for the biggest of these companies. The top 10 chains account for more than half ofall circulation in the United States – 51 percent daily and 56 percent Sunday. 2
The power is also seen in the economics. Overall, the newspaper industry in 2002 took in more than $55 billion in totalrevenue. 3 Yet the 14 biggest companies took in about 40 percent of that, or nearly $22 billion in total revenue. 4
Publicly Owned Companies
Four of the large chains stand out due to their size: Gannett, The Tribune Company, The New York Times Company andKnight Ridder. Not only are these companies much larger than their other public company counterparts, but they alsoenjoy a greater profit margin (23 percent). 5 Meanwhile, some of the smaller chains were able to realize large profitmargins, but saw stagnant revenues. For these companies, profits do not necessarily mean growth.
Gannett
Gannett is the largest of the four big chains, with annual newspaper revenue approaching $6 billion. Gannett was alsothe only of the four chains to see revenue growth in both 2001 and 2002, even with a drop in income. Gannett managesits news operations very tightly, and sharply cut back at some of its newspapers, such as the highly regarded Des MoinesRegister and The Courier Journal in Louisville. Since 1991, the company has increased its revenues by 54 percent ininflationadjusted dollars (including new acquisitions). Since 1992, Gannett has maintained an average profit margin of 25percent, including a 25 percent margin in 2001 when total advertising dropped 9 percent in the industry. 6
Tribune
The Tribune Company is the secondlargest newspaper company in terms of revenue due to its acquisition of the TimesMirror Company in 2000. This drove revenue from $1.4 billion in 1999 to more than $4 billion in 2000, before slipping in2001 and 2002. Before 2000, The Tribune Company experienced a nineyear stretch of stagnant revenue, in inflationadjusted dollars, although it had earnings margins of well over 20 percent. The company was hit hard in 2001, with a 34percent drop in income, but saw a steep rise in income in 2002 and the first half of 2003.
New York Times
After several years of stagnant growth, The New York Times Company managed to nearly double its inflationadjustedrevenue from 1991 to 2000. After taking a hit in 2001, The Times is starting to see higher margins, with a 17 percent ratefor the first six months of 2003.
Knight Ridder
Knight Ridder has had less growth in recent years than the three other large chains, and in 2002 was off nearly $400million in revenue from its peak in 1999. In 2001, the company cut 10 percent of its jobs. The chief executive, Tony
abecker
Typewritten Text
abecker
Typewritten Text
Top Ten Groups’ Percent of Total Sunday Circulation
abecker
Typewritten Text
abecker
Typewritten Text
abecker
Typewritten Text
abecker
Typewritten Text
Ridder, indicated that most of those jobs would not be restored, which led to a greater profit margin in 2002 without a risein revenues. 7 Criticism over Knight Ridder’s approach was embodied by the resignation of Jay Harris, publisher of TheSan Jose Mercury News, in 2001 when he said that further cuts threatened the journalistic integrity of the Knight Riddernewspaper. 8
Changes in Ownership
There was a slight increase in the mergers and acquisitions front in 2003, although still not to the levels reached from themid1990s through 2000, during which The Tribune Company purchased Times Mirror and Gannett bought CentralNewspapers.
Perhaps the most meaningful sale in 2003 was that of the familyowned Freedom Communications, a 65newspaperchain, which includes The Orange County Register in California and 27 other dailies. According to Advertising Age, thechain had newspaper revenues of $662 million in 2002. 9 In the end, it was sold to a consortium of family members. Butthe highest of a number of bids were from Gannett and MediaNews. That could signal that a faster pace of acquisitionsis about to resume – though there are probably not so many desirable properties left as in the l980s and l990s.
The other major story in the newspaper industry was the continued fight between The Seattle Times and The SeattlePostIntelligencer. The two papers have a joint operating agreement under which The Times (which is 50.5 percentowned by the Blethen family and 49.5 percent by Knight Ridder) has merged noneditorial operations and splits any profitearned with the Hearstowned PostIntelligencer. The Times says it has lost money for three consecutive years and hassued to end the operating agreement, which Hearst has said would lead to closing The PostIntelligencer. A September25th 2003 court decision ruled against the Times, not allowing the first year of its loss to be counted inside the operatingagreement because it was incurred partly because of a strike. This keeps the agreement active for another year, but thebattle will continue in 2004.
And the prospect that Hollinger newspapers would be sold due to financial improprieties by its top executives, includingthe press baron Conrad Black, is a further signal of more merger activity to come. Still more mergers are possible, too,given intentions by the Federal Communications Commission to allow companies to own outlets across different mediaplatforms (newspapers and television stations, for example) in the same community. (See Local TV). But Congressionaland judicial action blocking the FCC deregulation for the moment has put the prospect of such deregulatory mergeractivity on hold.
Footnotes
1. Editor and Publisher Yearbook Online data, 2003, www.editorandpublisher.org
2. Editor and Publisher Yearbook Online data, 2003, www.editorandpublisher.org
3. Lauren Rich Fine, Newspaper Industry Primer, 7th Edition. Merrill Lynch, July 9, 2003, p.7
4. Morton Research, unpublished “Newspaper Segment Data,” Silver Spring, Maryland. The 14 companies are A.H. Belo,Dow Jones, Gannett, Hollinger, JournalRegister, Knight Ridder, Lee, McClatchy, Media General, New York Times,Pulitzer, E.W. Scripps, Tribune, and the Washington Post.
6. Newspaper Association of America, “Quarterly Newspaper Advertising Expenditures,”http://www.naa.org/UtilArtPage.cfm?AID=1399&TID=378
7.”Even when the economy recovers, many newspapers that have gone a lean diet won’t be bulking up again,” Editor andPublisher. March 4, 2002, www.editorandpublisher.org
8. Poynter Online, “The Harris Case: What Next for Newspapers?”http://www.poynter.org/dg.lts/id.13025/content.content_view.htm
9. Advertising Age, “100 Leading Media Companies,” AdAge.com, August 2003. Companies are ranked by their totalmedia revenues collected in the United States in 2002. The list is available at http://www.adage.com/page.cms?pageId=1018.
News InvestmentNews InvestmentOver the last two decades, a series of problematic trends in newsroom investment have developed. During hard times,many newspapers have made sharp cutbacks in newsroom staffing and expenditures. And during good times, while thereare modest expansions, many have not made up for what was lost, particularly in staffing. The lion’s share of the growingrevenues has been turned instead into higher profit margins.
The effect, all evidence suggests, is that newspapers have seen a net drop in the overall number of people and asqueeze on resources devoted to covering the news. The cuts coincide, moreover, with the sharper decline in circulationthat began in 1990.
The cycle of deep cutbacks followed by only modest expansion goes back about 15 years. Between 1990 and 1992, forinstance, the number of fulltime professional newseditorial employees shrank by 3,300. It rose gradually through the restof the 1990s. But then the number fell again in 2001 by 2,000 – about 4 percent of the total newseditorial workforce atAmerican dailies. During 2002, about 300 net jobs returned, only 15 percent of those lost the previous year. Totals for allof 2003 are not available, but the job gains will likely again be small. 1 But as of 2002, newspapers have about 2,200fewer newsroom employees than in 1990. 2
Newspaper Newsroom Work Force
1978 to 2003
Design Your Own ChartSource: American Society of Newspaper Editors
Hard numbers on newsroom budgets are not available, but indirect evidence paints a similarly bleak picture. From thetrough of the last recession in 1991, through the peak year of 2000, newspaper ad revenues rose 60 percent. Operatingprofit margins, meanwhile, nearly doubled, from 14 to 27 percent, according to estimates by Lauren Rich Fine, a MerrillLynch analyst. 3
Profits jumped by 207 percent during the period. That reflects continued improvements on the cost side of the businessas well. New production technology, in particular, has facilitated reductions in total industry employment for 15 years. 4
But with these eight years of soaring revenues and sharp reductions on the cost side, newsroom jobs saw only a 3percent gain, most of which then got wiped away during the 2001 downturn. 5 Newsroom budgets surely rose much morethan that, but, according to the annual Inland Cost and Revenue Study, fell as a percentage of revenue. 6 The net effectis that the cutbacks in hard times are not being fully recouped in the good times.
Often, as in 2001, job reductions are achieved to a substantial degree by buyouts. The effect, then, has been extrasavings by shedding experienced, highersalaried reporters and editors. And the budget cuts hit hardest in areas like
training, travel and resources for investigative and indepth reporting, the areas some deem most critical in providingquality news content.
Some argue the real cuts and lagging investment in the newsroom may be even greater than the numbers suggest. A keyreason is that the workload of the newsroom is actually bigger than it was two decades ago. Pagination – the electronicreplacement of hot type or page pasteup – swept through the industry in the late 80s and early 90s. It was a huge netefficiency, but it also moved work out of the composing and into the newsroom. Prof. John Russial, a copy editor turnedacademic, demonstrated in his doctoral dissertation more than a decade ago that the newsroom got more extra work thanextra people. 7 The time available for toplevel copyediting has been pinched ever since.
There has also been a trend in recent years toward zoned editions and to more specialized coverage for many interestgroups, like the fastrising Hispanic and other immigrant populations. Both are staffintensive. Feeding content to Internetor television affiliates is another new part of the newsroom routine
It all adds up to a mission creep with a reduced work force, and possibly less time for artful storytelling and highlevelreporting and analysis.
Prof. Phil Meyer at the University of North Carolina, has variously described all this as an industry on a slippery slope, oressentially liquidating itself. Others, such as the stock analyst John Morton and the press critic Alex Jones, havedescribed what they considered the excessive profits of newspapers as an industry eating its seed corn.
Their argument is that such cost cutting is shortsighted. The benefit of a higher profit margin is immediate – it satisfiesWall Street or bottomlineoriented private investors – but the benefits of an investment in news quality inevitably takelonger. The industry should maintain quality during the hard times, and an industry that does not invest cannot possiblygrow, create new products and reach new audiences. If the industry is losing readers, lack of innovation and investmentespecially in the last 15 years – is part of the reason.
On the other side, various industry and financial professionals argue that matters are not so simple. For one thing, thecuts and rising profit margins, some argue, make longterm strategic sense. As a “mature” industry rather than a growingone, newspapers should focus on efficiency and cost cutting to provide investors a competitive return. After 60 years ofdeclining circulation penetration, the case for growth is hard to prove, they argue. These industry analysts and newsexecutives believe that only in a few unusual circumstances would investing more in the newsroom pay for itself in newreaders and higher revenues.
Others argue that the drop in newsroom staffing and investment may not be as serious as it appears. After all, there were154 fewer papers in 2002 than in 1990. The drop in the number of employees (4 percent from 1990) is not nearly assteep as the drop in circulation of 11 percent. 8 Also, given the cyclical nature of the business, there is some managingaround the ups and downs. Cost and the size of news staffs are controlled during good times and, with a few exceptionslike Knight Ridder, cuts are not as deep as the decline in revenues and profits in a down year like 2001. 9
On top of that, even if newsroom budgets and staffs were lagging during the good times of the 90s, most companies didinvest in the development of an online presence. Some – The Tribune Company and Media General, particularly – haveextended the investment in socalled convergence, to television stations they own. What’s more, in the last three yearssome companies are launching their own youthoriented or Spanishlanguage papers.
And while newsgathering is inescapably laborintensive, a gain in efficiency or productivity – “working smarter,” as it isknown – is certainly possible. In the current presidential campaign, for example, many regional papers have decided thatthere are better and less expensive forms of coverage than assigning reporters to trek with the major candidates by bus orby plane to every campaign stop.
So which side of the argument has more merit?
In part, it depends on geography and demographics. Some markets are growing and have more potential. Other citieshave stagnant populations and economies as well as lower levels of education and other likely indicators of potentialreaders.
Also, both arguments are, in part, theoretical and impossible to prove conclusively. Still, there is some growing evidenceon Meyer’s side of the analysis – that the industry can only dodge the bullet of the rapid circulation losses for so long.
Recently, for instance, Fine, the Wall Street analyst, said that Knight Ridder and Gannett (not counting USA Today) hadlost more than 20 percent in circulation at a group of their larger papers she tracked over a period of just 10 years. 10
After a Knight Ridder presentation to investors in December 2001, an analyst asked pointedly how the company couldjustify ad rate increases of 2 to 3 percent when circulation had fallen that much in the last year at some of its papers. Inthe two years since, Knight Ridder has reemphasized circulation growth, in some markets dropping the price of thenewspaper, and has shown some gains. 11
At the other extreme, Fine found that the McClatchy newspapers, whose owners believe it is possible to gain new readersin their markets, have increased circulation by 7.6 percent in the same 10year period. 12 McClatchy has had one of thebest records of advertising growth and stock appreciation for the last two years, not to mention the intangible forattracting and retaining editorial talent by gaining a reputation as a good place for journalists to work.
The argument for newsroom investment is also reinforced by some new academic work by Meyer and others.
Recent studies by Meyer found that papers with larger staffs relative to their circulation retained more of their householdpenetration over a period of years. So did papers whose readers rated them higher for credibility. The more crediblepapers also charged higher stated ad rates.
Meyer’s research is further supported by an extensive review of decades of academic research supervised by Prof. EstherThorson at the University of Missouri. That literature review showed a clear pattern that investing more in the newsroomis correlated to higher quality, higher circulation, higher ad rates, and higher profits. The best way to build circulation, theresearch suggested, is to diversify content. And this is further reinforced by work by the Readership Institute atNorthwestern, which finds that diversifying content will also get readers to spend more time with the newspaper.
The industry will not embrace the most alarmist rhetoric, but it lately does appear concerned about circulation/readershiperosion. In just the last year or two, the prevailing strategy appears to be at least to slow the losses at the newspaperproper and build audience with a family of news products, including online and specialty publications, such as thoseaimed at younger readers or Spanish language editions.
But the possible economic recovery of 2004 and resumption of good times in years to follow will pose a test. Afterrebuilding revenues and profits to prerecession levels, will the industry reinvest in improving the core news product andreaching new audiences, the newsroom, or again choose to focus on growing profit margins?
Footnotes
1. American Society of Newspaper Editors, “Newsroom Employment Survey.” 2003, Table A,http://www.asne.org/index.cfm?id=1138, (Data as of the end of 2002).
2. American Society of Newspaper Editors, “Newsroom Employment Survey.” 2003, Table A,http://www.asne.org/index.cfm?id=1138, (Data as of the end of 2002).
3. Lauren Rich Fine, Newspaper Industry Primer, 7th Ed, Merrill Lynch, July 2003
4. Rick Edmonds, “Good Times Coming? Watch Out,” Poynter Online, December 8, 2003,http://www.poynter.org/content/content_view.asp?id=56948
5. American Society of Newspaper Editors, “Newsroom Employment Survey.” 2003, Table A,http://www.asne.org/index.cfm?id=1138, (Data as of the end of 2002).
6. Lou Ureneck first spotted newseditorial’s falling share of revenue, using data from the Inland Press AssociationNational Cost and Revenue Study, in Nieman Reports, Summer 1999. The share remained reduced through 2000.
7.John Russial, “Pagination in the Newsroom: A Question of Time,” Newspaper Research Journal, Winter 1994, p. 91101
8. American Society of Newspaper Editors, “Newsroom Employment Survey.” 2003, Table A,http://www.asne.org/index.cfm?id=1138, (Data as of the end of 2002).; Editor and Publisher Yearbook
9. McClatchy and Gannett specifically talked about smoothing out the bumps in staffing during presentations to analystsin 2001 and 2002.
10. Lauren Rich Fine, “The Newspaper Industry: Circulation Stalling But Efforts Continue to Improve Readership,” MerrillLynch, May 29, 2003. p.4
11. Knight Ridder increased its daily and Sunday circulation in 2002 and the first months of 2003. It fell back some in thesix months ending September 2003
12. Lauren Rich Fine, “The Newspaper Industry: Circulation Stalling But Efforts Continue to Improve Readership,” MerrillLynch, May 29, 2003. p.4
Public AttitudesPublic Attitude.sThere is an enormous amount of data that has been collected over the years about public attitudes toward the newspaperindustry, more perhaps than for any other medium. Taken together, the survey data reveal four key trends.
People tend to trust newspapers less than other mediums.
That trust is declining, as it is for other kinds of news mediums.
People think newspaper journalists are out of touch and motivated by commercial imperatives.
But people still turn to newspapers, particularly during certain kinds of news events and particularly for local news andfor an opinion forum.
Trust: Believability and Credibility
The history and enduring nature of newspapers do not, in the end, give the medium an edge when it comes to publicperception. Asked a number of different ways, citizens continuously give newspapers worse marks than other mediums,despite the sense by most print journalists to the contrary.
In general, Americans give newspapers lower marks for believability and credibility than they do for local television news,or any of the three network newscasts and CNN. And this has been the case for decades. NBC’s “Dateline,” a primetimetelevision newsmagazine that tends to focus on softer and sometimes more tabloidoriented subjects, rates nearly as highas newspapers.
Media Outlets Ranked by Believability, May 2002
Design Your Own ChartSource: Pew Research Center for the People and the Press*Survey qu: Please rate how much you think you can believe … Includes ratings of 3 and 4 on a scale of 1 (notbelievable) to 4 (believable)
While there are various surveys tracking this, one of the latest, a study by the Pew Research Center for the People andthe Press, found that a majority of Americans tend to believe their daily newspaper – 59% gave it the highest two ratingson a scale of 1 to 4 in May of 2002. Nevertheless, this is lower than the roughly twothirds of respondents who rated thevarious television news categories this way. A full 66 percent gave believability ratings to NBC and CNN, 68 percent toABC and local news, and 64 percent for CBS (“Dateline” received top ratings from 58 percent). 1
(National Public Radio and the NewsHour with Jim Lehrer appear lower on the believability scale, but that is only becauselarger percentages of Americans haven’t heard of or say they can’t rate them, 29% for NPR, and 49% for the NewsHour).
The only news medium that newspapers seemed to surpass when it comes to believability is print magazines. Just morethan half deem Time (53 percent), Newsweek (51 percent) and US News and World Report (51 percent) believable. Theyalso still hold and edge over Fox (53 percent) and MSNBC (55 percent) 2
The picture looks even worse for national newspapers included in the Pew data, as it has in past surveys. According toPew, the slimmest of majorities (51 percent) believe USA Today, while 25 percent indicated a lack of believability and 23percent said they could not rate it). The same 51 percent believed The Wall Street Journal, with 15 percent not believingin it and 34 percent not being able to rate it. The New York Times was not included in the survey. 3
Some of this may have to do with the way people react to news they can see versus what they read, and their attitudestowards local media they know versus national media they are not as familiar with. If so, there may be little newspaperscan do about their relative believability versus other media. Perhaps more worrisome for newspapers, however, is thetrend line. The percentage of people who rate their daily newspaper as believable has dropped from 80% in 1985 to 59%in 2002. Other media, including network and local TV, have seen similar declines. Here, the NewsHour, NPR, and 60Minutes stand out for not declining in believability.
Newspapers also have some reason for concern when pollsters turn from asking about believability to asking aboutquality. When Pew asked, in January 2002, who has been doing the best job of covering the news lately, only 10 percentof respondents named newspapers, compared with 38 percent for cable television, 16 percent for network television newsand 13 percent for local television news. 4
This could be chalked up to a number of factors – the appeal of visual media generally and the increasing availability andconvenience of television and online news versus print among them. Yet this finding may also reflect something else.Perhaps since September 11th cable television news, whatever its weaknesses, was the best source of international newsgenerally available in most U.S. communities. Local newspapers, with their focus on local news, were not satisfyingreader demand for more news about the war on terror. Though newspapers have not ranked especially well on thisquestion, this still represented a noticeable decline. In January 1999, 13 percent named newspapers as doing the bestjob, and 14 percent said so in January 1996.
The Readership Institute at Northwestern University has found somewhat more promising results. In a 2000 survey, 11percent of newspaper readers said their local newspaper was excellent and 39 percent said it was very good, with 35percent rating it as good. Just 15 percent said it was fair or poor. Also, nearly threequarters of readers (73 percent)indicated that they would recommend the local paper to a friend. Only 7 percent said they would not recommend it. 5
The research on public attitudes also suggests the nature of newspapers’ appeal and perhaps enduring qualities. Peopledo not tend to turn to newspapers when news is breaking, but they go there later on for a sense of what to make ofthings.
The percentage of people who name newspapers as their primary news source tends to drop during major breaking newsevents, such as September 11th or the Iraq war. Only 11 percent cited newspapers as their primary source for newsduring the terrorist attacks. Just 24 percent saw newspapers as their primary source for the Iraq war in March 2003. 6
However, as the initial shock of these events subsides, newspapers regain importance. More people began citingnewspapers as a main source after the end of combat in Iraq. By October 2003, the latest numbers available, 50 percentsaid that newspapers were their primary source of news. That is the highest percentage of people citing newspapers astheir main source since 1996, making it second only behind television. 7
This upsurge is probably impossible to explain right now. One reason could be that changes in the nature of the contentof cable are pulling people back to print (See Cable TV content). Another possibility is that the nature of the news in thelatter months of 2003 was suited to newspapers. Understanding why the United States had gotten into the war, trying topiece together the situation in Iraq and the soundness of Bush administration policies – perhaps these are questions thatnewspapers may help people sort out more efficiently than turning to fastbreaking cable television or abbreviated localnews. It will be helpful to see if this upsurge continues or changes with events.
Another study on public response to coverage of the war, this one by the Readership Institute, offers further clues as towhat people like about newspaper versus other media. The study found that during the war in Iraq in March and April2003, people said they liked the editorial and opinion pages of newspapers, and they also liked papers for giving them alocal perspective on the war. The depth and balance that newspapers might provide did not register as strong assets forprint in the study, nor did the suggestion that newspapers had more expert sources or dug more aggressively for the newsthan television might. 8
Newspaper Believability Over Time
Surveys: 1985 to 2002
Design Your Own ChartSource: Pew Research Center for the People and the Press* Survey qu.: ’’Please rate how much you think you can believe the daily newspaper you are most familiar with.’'''''''''
Which way is trust heading? There are clear signs of decline, but for all of the news media. Since 1985, believability ofthe daily newspaper has fallen by a quarter, from 80 percent in 1985 to 59 percent in 2002, according to Pew data. Thethree television network news divisions and local news also saw significant drops from 1985, when they were all above 80percent for believability. 9
Believability of News Outlets Over Time
Surveys: 1985 to 2002
Design Your Own ChartSource: Pew Research Center for the People and the Press*Survey qu: Please rate how much you think you can believe … Includes ratings of 3 and 4 on a scale of 1 (notbelievable) to 4 (believable).
What is driving what some have called a “credibility crisis?” In part it is a cultural divide. People think newspaperjournalists are isolated and out of touch. In part, the credibility crisis is a disconnect over motive. Journalists think they areworking in the public interest. The public thinks they sensationalize and report articles to make money.
This cultural divide is seen in various numbers. Some of them have to do with a sense that journalists are isolated. In amajor 1999 survey conducted for the American Society of Newspaper Editors, for instance, a majority of the public, 53percent, viewed the press as “outoftouch with mainstream Americans.” And 78 percent thought that journalists weremore interested in the interests of their editors than their readers. 10
Some of the numbers deal with the attitude of journalists. Twothirds of the public viewed journalists as more cynical thanpeople in other professions, according to the ASNE credibility study. 11
The other part of the crisis has to do with motive. More than half of those polled, 59 percent, told the ASNE study thatnewspapers were more concerned with making profits than with the serving the public interest. And half thought thatadvertisers swayed coverage. Pew surveys over the years similarly find a decline in the sense that journalists are servingthe public interest.
This sense of lack of professionalism and sensationalizing to sell papers was clearly seen following the scandal in 2003 atThe New York Times, particularly the news that the reporter Jayson Blair had engaged in extensive fabrication. TheTimes, which prides itself on respectability, took heat for the incident, which resulted in the resignations of the executiveeditor, Howell Raines, and the managing editor, Gerald Boyd.
But one of the saddest revelations to come from the scandal was that many people thought such unethical conduct wastypical of newspapers. Nearly a quarter (22 percent) told a Pew survey in the summer of 2003 they thought that thepractices engaged in by Blair happened frequently, while 36 percent said they thought it happened occasionally. Andmost of the public (58 percent) thinks journalists do not care about complaints of inaccuracies (only 35 percent thinkmembers of the press do care). 12 The credibility problem can be seen in polling data going back nearly 20 years. It ishardly limited to print journalism. Some of it clearly tracks the decline in public trust in all institutions, and thus is morecultural than something that the newspapers or even journalists generally can do anything about. But not all of it. Andhere is where newspapers can react.
Footnotes
1.Pew Research Center for the People and the Press, “News Media’s Improved Image Proves ShortLived,”, August 4,2002, Qu. 9
2.On the other end of the scale, 9 percent said that they could not believe their local newspaper (they gave it a 1 on a 1to 4 scale); 25 percent gave it a 2. Thus, over a third of people do not believe their newspaper, which is much higher thanthose not believing cable or network news. The poll has a margin of error of +/ 3 percent.
3. A 2001 survey by the Online Publishers Association asked about the credibility of national newspaper in general andreported that 80 percent found national newspapers credible compared to 83 percent for cable and just 68 percent forlocal newspapers. Online News Association, “Digital Journalism Credibility Study,” 2002, www.journalists.org.Respondents were asked to rank the credibility of news in different media on a scale of 1 (Not credible at all) to 5(Extremely credible). Answers of 4 or 5 were considered as denoting credibility, 3s was considered neutral, and 1s or 2swere considered as not credible.
4. Pew Research Center for the People and the Press, “Unusually High Interest In Bush’s State Of The Union,” January17, 2002, Qu. 9
5.Readership Institute, “Characteristics of Subscribers, SingleCopy Buyers and Passalongs,” January 2003, p. 8
6. Pew Research Center for the People and the Press, “President’s Criticism of Media Resonates, But Iraq UneaseGrows,” October 21, 2003, Qu. 8. Respondents were allowed to name two media.
7.Ibid. Respondents were allowed to name two media.
8. Readership Institute, “US Daily Readership during the War with Iraq,” May 2003, p.13. During the war in March andApril, readers were asked to rank statements about their reading experience on a scale of 1 (strongly disagree) to 5(strongly agree). An average was then calculated with 3 as the midpoint. Higher than 3 indicates agreement, and lowerthan 3 shows disagreement. A “thoughtful editorial and opinion section” and “gave me a local perspective on the war”both received a 3.6 average, which shows agreement. People were neutral (3.0) on newspapers covering all sides of thestory and disagreed that newspaper reporters “dig harder than TV reporters to get the news” (a 2.7 rating), and thatnewspapers “use more expert sources than television” (a 2.6) rating..
9. Pew Research Center for the People and the Press, “News Media’s Improved Image Proves ShortLived,” August 4,2002, Qu. 9
10. American Society of Newspaper Editors, “Examining Our Credibility: Perspectives oft the Public and the Press,”1999, http://www.asne.org/kiosk/reports/99reports/1999examiningourcredibility/index.htm
11. Journalists themselves echo this view: 84 percent see themselves as being more cynical. Despite this cynicism, 69percent of journalists think they were using their power to “protect the underdog;” a view held by 53 percent of the public.
12 .Pew Research Center for the People and the Press, “Strong Opposition to Media CrossOwnership Emerges,” July13, 2003, Qu 25 and 26
ConclusionConclusionThe decline in circulation and the decline in public trust are problems that the newspaper industry has been strugglingwith for years. In some ways, the good news is twosided. The financial durability of newspapers offers them theresources to diversify the product and seek out new audiences.
Yet the longterm profitability of newspapers, and the clear advantages in content that print offers over some othermedia, can also be a crutch. Newspaper publishers can justify not investing more in new product, in new content, indiversifying their target audiences, because they can argue that they are already the strongest newsgathering operationin their community. More quality, they may think, will not pay for itself. And the financial markets have come to expect,with a few exceptions like The New York Times, a mature industry that must justify itself to investors by producing highprofits, not by investing them back into the product for a potentially risky return.
At the same time, if the newspaper industry falters because of its failure invest for the long term to attract new readersand advertisers, the insistence on continuing those high profits will become even more selfdefeating.
The challenge is that the continuing loss of audience and the aging demographics suggest that, in time, somethingmust give. It is possible that newspapers will have to change a great deal more than they have or their financial healthwill not be sustained.
Online – IntroIntroBy the Project for Excellence in Journalism
Although the economics are still evolving, the Internet has now become a major source of news in America.
In September 2003, over half of the people in the United States – 150 million – went online, a record for Web use. 1And half to twothirds of those who go online use it at least some of the time to get news.
Whether the new medium is replacing the old, however, at this point is less clear. Although some people report gettingnews online at the expense of getting it from magazines and newspapers, the majority of online news consumers saythey spend as much time with print as they did before. Television news, research shows, may be more affected.2
The Internet is the medium having the most success attracting young people to news, something that the older mediawere having trouble with before the Internet even existed.
Economically, producers of Web news are still trying to translate the rising number of people who get news online intothe kind of profits to which traditional news media companies are accustomed. Journalism has traditionally been a slowgrowth industry (CNN, for instance, took ten years to turn a profit). The Internet seems no different. Some of thebiggest news Web sites are not yet breaking even. And the revenues that media companies do get from their Webactivities, while rising, account for only a small fraction of their overall revenue. Gannett makes more revenue from itsnewspaper division in a week than its online division makes in an entire year.3
Still, online advertising revenues are growing at a much quicker pace than those in the traditional media. The Web hasalso continued to gain prominence with consumers, as evidenced by the $12.2 billion spent online betweenThanksgiving and Christmas in 2003, an increase of 42 percent over 2002.4
The Web has produced a new breed of online competitors vying for local advertising dollars, especially classified. Theirchief rival, the newspaper industry, has kept these new competitors at bay for now, but the battle is far from over.
In the meantime, a handful of giant media companies have come to dominate Web news, at least for the moment.Time Warner, the largest of them, controls two of the top four news sites. Nearly 69 percent of the most popular newsWeb sites are owned by one of the 20 biggest media companies. There are also a myriad of local Internet news sites,whose goals are not to compete for the nationwide audience but rather to appeal to the local community. Theirpopularity is harder to track.
Web logs, or blogs, such as instapundit.com and kausfiles.com, are an exciting new prospect for the Web. And some ofthese bloggers are influential. For now, though, bloggers appear to command only a fraction of the online audience.During the first week of the Iraq war, for instance, the Pew Internet & American Life Project found that only 4 percent ofInternet users had visited a blog.
The Web is the only part of the mainstream news business that generally is seeing audiences grow, especially amongthe young. People like the convenience of the Web, its availability at work, its speed for delivering breaking news, andincreasingly they are coming to trust the accuracy of the information they receive there. The problem is an economicone. How will Web journalism begin to pay its own way? If people increasingly substitute the Web for their old mediabefore a robust economic model for the Web evolves, the economic effect could be devastating for journalism.Companies might begin to cut back significantly on their newsgathering abilities, as audiences abandon profitable oldplatforms in favor of less profitable new ones. The net in this case might weaken, not strengthen, the economic vitalityof news organizations and the quality of American journalism.
Footnotes
1. comScore, “comScore Media Metrix Announces Top 50 U.S. Internet Property Rankings for September 2003,” pressrelease, October 21, 2003, www.comscore.com
2. Jupiter Research, “Individual Consumer Survey,” June 2003, www.jupiterresearch.com; UCLA Center forCommunication Policy, ”The UCLA Internet Report – Surveying the Digital Future,” January 2003; Pew Research Centerfor the People and the Press, “Internet Sapping Broadcast News Audience,” June 11, 2000, P. 1
3. Advertising Age, “100 Leading Media Companies,” AdAge.com, August 2003; “What Newspaper Web Sites Earn,”Borrell Associates Inc., April 2003, p. 8.
4. Nick Wingfield, “Internet 2.0: Etailing Comes of Age,” Wall Street Journal, December 8, 2003, p, B1.
Content AnaylsisContent AnalysisThe promise of Internet news is its availability, immediacy, interactivity and unlimited space. Which of thesecharacteristics are really being taken advantage of?
To get an answer, the study conducted a content analysis of eight news Web sites, including the five most popular asmeasured by ratings. This content study suggests that the Internet has made marked progress in the last few years, butthe degree to which it is fulfilling its potential varies widely.
Among the findings:
Internet journalism is still largely material from old media rather than something original.
There is a mixed message when it comes to immediacy. While a good many of the lead stories are new through thecourse of the day (roughly half), the amount of updating of running stories with substantive new information is morelimited (a little more than one in ten stories).
For now, perhaps the strongest trait the Internet is taking advantage of is providing background information to itsstories, such as links to archival material or other sources.
Content on the web is still driven by text narratives. Most sites make only limited use of the multimedia potential ofembedding such things as videos, audio, still photos and user feedback into news stories.
Among those studied, there are three kinds of sites – those generating staff content, usually from their parentcompany, those relying almost entirely on wire service and those trying to edit and adapt wire copy and adding someoriginal content.
To examine the Internet, the Project looked at a range of Web sites throughout each day, rather than look at sites oncea day. We looked at eight sites – two from cable television (CNN and Fox), two associated with broadcast televisionnetworks (CBS News News and MSNBC.com, which is affiliated with both MSNBC cable news and NBC), two Internetonly sites (Yahoo and AOL) and two newspaper sites (NYTimes.com for a large circulation market andreviewjournal.com of The Las Vegas Review Journal for a smallmarket newspaper). Altogether, 709 news articles wereexamined in four downloads a day on the eight sites over five days scattered over four months, or a total of 160downloads. The study examined all articles on the front page tied to a graphic image, plus the next top three articles. Italso noted the links within each article.
Perhaps most distinctive were the differences among the outlets. While many critics complain that television networknews all looks alike, that local television news is identical from city to city, or that basics of newspaper writing differ littlefrom paper to paper, that is not the case for Internet. A series of visits to the Internet sites studied revealed anassortment of different styles and approaches.
CNN’s busy home page, for instance, typically features links to about 50 articles, plus content from sister organizationsTime, Sports Illustrated and Fortune. The New York Times Web site typically has even more articles, 75 to 80, most ofthem staff written, yet little video. Yahoo, on the other hand, normally features just 20 articles. All of these articles arefrom wire services, but several include streaming video.
Whether this variety reflects a medium still trying to find a single successful model, or a medium by its nature likely tocontinue to sustain more variety than the old media is impossible yet to discern.
Originality of Reporting
How much original reporting occurs online? Based on the eight sites studied, Internet journalism on the major newssites is still largely a medium made up of secondhand material, usually from the old media.
Overall, only about a third (32 percent) of the lead articles on the sites studied was material produced by theorganization’s own staff. And much of that came from a few of the sites, particularly those from newspapers, postingarticles from their print parents. Thus even most of this material was not original to the Web.
A larger percentage of lead pieces, 42 percent, were wire stories posted without any editing and produced by othersources, particularly The Associated Press and Reuters.
A quarter (23 percent) were wire stories that included enough editing or additional material that they carried a combinedstaff/wire credit line or byline.
It should be noted, however, that much of the time those additions or editis were so minimal that they were difficult todetect when these versions were compared with the original wire stories.
Still, at least users could tell that someone at the Web site had edited these stories and made some attempt to checkthe material or compare it to other wires. This is a significant distinction. It means that the journalistic function ofsynthesizing and verifying had occurred.
The reliance on wires also meant a fair amount of repetition among sites. When a big story hits, one is likely to comeacross the same story on any number of Web sites. On the day of the Midwest Black Out (August 15th), for example, aquote from a woman in Cleveland who was arriving to work in a TShirt and shorts without having brushed her teeth wascarried on five of the eight sites we studied. Web readers from 9 a.m. to 9 p.m. were wellinformed of attorney LoriZocolo’s inability to brush her teeth.
But not all sites are just wires. Basically the news sites studied fell into three categories when it comes to lead stories:
Sites that were primarily staff written or performed their own verification and reporting.
Sites that customized wires and produced some original content.
Sites that relied almost entirely on wire stories without rewrite or much editing. These sites are really more portalsthan news organizations.
The type of medium sponsoring a site did not dictate where the site’s stories came from. The only exception was thetwo newspaper sites, which matched closely in origin of information. CNN was the only other site that took on the lookof a newspaper. At all three of these, more than 70 percent of the articles were staff written.
The sites most likely to customize wires were a network television news site, CBS.com, and MSNBC.com, which is ajoint venture of Microsoft and NBC. The CBS News site was dominated by wire/staff combination stories (82 percent).MSNBC.com was more of a hybrid – 48 percent staff/wire combinations, 17 percent original material, and 36 percentstraight wire or other news organization.
Finally three sites were largely straight wire copy. Two of these, AOL and Yahoo, were the two Internetonly sites.Sometimes referred to as portals, they relied entirely on straight wire stories without any evidence of checking theirveracity.
The third, Foxnews.com, whose sister cable channel produces continuous original content on television, did someoriginal reporting, though not much (13 percent). About a third of its stories were wire/staff combinations (35 percent),but the majority of its lead stories were straight wires (53 percent).
It should be noted that the study did not include some of the wellknown sites, such as Salon or Slate/MSN, thatproduce original Internet content. An earlier study by the Project of political coverage examined these sites and foundthat Salon mixed the sharp attitude and tone of the Internet with solid reporting. Slate, on the other hand, leavened itsopinion journalism with summaries of the day’s hottest political events in a kind of puckish tone, something like “Hotlinefor the Internet.” 1 These sites, however, like blogs, are more analogous to elite journals of opinion in print. Theiraudiences are smaller than those studied here (except for the Las Vegas ReviewJournal’s), and their content is moreessay and argument rather than breaking news, which is the focus of this audit.
Does it matter that the Web, on balance, is still more a medium for getting news via wire stories? This means the Website is entrusting the accuracy of the copy to someone else, a wire service. In the past, this has proved detrimental asfalse information gets passed on downstream.
In addition to the issue of verification, other differences stand out in the study. The wire stories were shorter than staffwritten pieces and were also somewhat less likely to be updated with important new facts.
On the other hand, Web sites were somewhat more likely to post new wire stories than they were staffwritten pieces(55 percent of wire stories were new, versus 47 percent staff written).
Story Freshness
Like cable television news, the Internet promises the ability to continuously update users with the latest turn in events.
The study wanted to determine how much new information news Web sites actually posted through the day. To do so,we checked every four hours to see what percent of the lead stories were altogether new, what percent were unchangedand what percent were in some way updated. 2
There are, moreover, degrees of updating: Was there something substantively new to the stories, just some minordetails added or was it a rewrite around a new angle? 3
Story FreshnessPercent of All Stories
Fresheness All StoriesExact Repeat 21%Repeat: No New Substance 14Repeat: New Angle 2Repeat: New Substance 14New Story 49
Totals may not equal 100 due to rounding.
Overall, half of all lead stories (49 percent) were thoroughly new through the course of the day. The figure drops evenmore if you discount the 9 a.m. stories, which were all coded as entirely new. For the remaining three visits each day,just 34% were entirely new.
Still, only 21 percent of lead stories were left unchanged.
The remaining 30 percent of lead stories involved some form of update of an existing story. Of these, however, onlyabout half (or 14 percent overall) contained substantive new information. Another 14 percent involved just adding minornew details. And 2 percent were what journalists call a rewrite, the same basic story but rewritten around a new angle.
Looked at another way, about 63 percent of the stories on the Web sites studied were either altogether new orsubstantively updated through the course of the day.
abecker
Typewritten Text
abecker
Typewritten Text
Is there a news cycle on the Internet? And is the news updated continuously in an even flow? Or does it change sharplytoward the end of the day, after the close of business but a good 10 or 12 hours before the morning newspaper arrives?
Based on the eight sites examined, which included the five most popular news sites on the Web, the Internet stillfollows the news flow of morning newspapers to a significant degree.
The morning generally opens (For this study, all downloads and references to time are Eastern) with new headlines andcontent. As the day wears on, new stories are less and less likely to appear. Indeed, the lowest percentage of newstories appeared between 5 p.m. and 9 p.m.
On the other hand, the number of stories that were substantively updated increased as the day wore on. Starting freshat 9 a.m., 16 percent were updated by 1 p.m., 19 percent by 5 p.m. and 21 percent by9 p.m. Thus, somewherebetween 9 p.m. and 9 a.m. is when the Internet converts to a new news cycle.
Are some sites more or less likely to add new content than others? Yes, but it does not correlate to what kind of sitethey are or the nature of their content.
Story Freshness, by OutletPercent of All Stories
Fresheness AOL CBS CNN Fox LVRJ MSNBC NYT YahooExact Repeat 23% 27% 10% 15% 70% 6% 25% 0%Repeat: No New Substance 17 13 15 11 0 24 4 27Repeat: New Angle 0 6 3 1 0 0 0 4Repeat: New Substance 14 13 22 11 0 21 11 20New Story 47 41 51 63 30 49 59 49
Totals may not equal 100 due to rounding.
Wireheavy Yahoo and AOL, for instance, posted new stories less often than staffdriven NYTimes.com. YetFoxnews.com, also mostly wire copy, was the most likely of the sites studied to post completely new material.
On the other hand, Fox was one of the least likely sites to offer substantive update stories in its leads. Its substantiveupdates matched that of the NYTimes.com, 11 percent, compared with more than 20 percent at cablesiblings CNN andMSNBC.
Does the web break stories? The study as constructed this year cannot answer that. It is something to watch in thefuture.
Story Components
How multilayered are Internet stories? Do they take advantage of the unlimited space and ability to use multimediacomponents?
In the Project’s first study of the Internet, in 2000, fully a third of the political stories studied, including 100 percent ofthose on AOL and MSNBC, had no audio or visual links. Links even to external sites or additional information wereminimal.
Today, the Internet has become more multifunctional and links to background information in particular have becomecommonplace. Sites still vary widely, however, and some kinds of multimedia links are still not the norm.
Overall:
Threequarters of stories contained links to archival or background information.
A third of the stories contained at least one link to video.
A third also contained links to still photos or photo galleries.
And a third of stories offered links to other sites.
Audio links, however, were almost nonexistent.
The one thing all the sites seemed to do consistently was to link to their own archives so users could read past storiesto get background on events. The proverbial newspaper “morgue” or clipping library is now more readily available to thepublic. These background links, moreover, were not restricted to old stories. They also included onlineonly featuressuch as summaries of candidate positions, image galleries, profiles of people in the news and timelines of events.
When it came to multimedia elements, such as video or galleries of still photos, there were wide differences amongsites.
Multimedia and Interactivity on the InternetPercent of Stories With Link Present, By Site
In general, broadcast sites were the most likely to have links to videos or still photos in their lead stories. Cable siteswere more likely to have map or graphic links. Internetonly sites as well as MSNBC.com were more likely to have aplace for user feedback.
Sites also varied widely in how often they linked to outside sources. Almost every story on Yahoo has an external link,as did more than half of the stories at MSNBC.com (58 percent) and Foxnews.com (51 percent). Only 6 percent ofNYT.com lead stories had external links, 13 percent at CBS News, and 12 percent at AOL.
How much opportunity did sites offer users to react to stories? In all, 40 percent of stories studied had some way forusers to offer feedback or participate in online discussions about the topic. But the findings varied widely and had nocorrelation to the kinds of stories, the nature of the parent organization or the popularity of the site.
Story Length
One question about the Internet is how long stories can be. On one hand, the Internet has the potential for infinitedepth. On the other, some people question whether users can absorb long stories onscreen.
Is there an optimal length? Do sites vary much when it comes to this question?
Overall, the lead stories on the Web were shorter than newspaper frontpage articles and than print magazine coverpieces. Internet lead stories were generally between 500 and 1,000 words (54 percent) while newspaper front pagearticles tended to run to more than 1,000 words (54 percent of front page articles) as did magazine cover stories (42percent).
There seems to be no accepted norm among the sites studied when it comes to length of lead stories. Moreover, thedifferences did not seem to be tied to their originating news medium. At MSNBC.com, for instance, nearly half of all ofstories were more than 1,000 words.
Some sites broke up long stories by dividing them into multiple pages. In the middle of the story, then, users must clickthe “next” button again and again to read on. Thus, while space is indeed unlimited, the amount of work the user has todo can often increase with length.
Sites also varied widely in how many short stories they carried. AOL and Fox ran a lot of short stories, under 500 words– nearly a third of those at AOL (31 percent) and more than a quarter at Fox (28 percent). At CBSNews.com,meanwhile, only 18 percent were that short.
In general, 39 percent of the 709 stories studied on the Internet contained anonymous sourcing, roughly double that ofweekly news magazines, and more than newspapers overall, but less than newspaper front pages (45 percent of frontpage articles had anonymous sources).
Six in ten stories (59 percent) had the highest level of source transparency – at least four sources named with someattempt to describe the source’s potential biases or point of view.
At least in lead stories, sourcing seems pretty strong. It is important to note that much of this sourcing arrives secondhand, from wire services and, as mentioned above, much has not been verified by the Web site itself. Still, some of thewire copy seems the best sourced of all. MSNBC.com, for instance, which relies heavily on edited wire copy, was themost likely to run stories with four or more fully identified sources (71 percent of stories). CNN, with more originalreporting, was the least likely to run stories with this highest of level of fully identified sources (45 percent).
Lead Story Topics
What is the top news agenda of Internet news sites and how does it differ from other media?
Here our answers are more limited than for some other media. To focus on the broader character of the Web – the levelof interactivity, updating and other features the study chose to look at a limited number of days but to examine thosedays in detail every four hours. Given that, there is little we can say quantitatively about the news agenda of the Websites analyzed.
What we can offer is more impressionistic. Here, we were left with the sense that in its lead stories the Internet is moretied to traditional news topics than is often the case in cable and broadcast television, which have become somewhatmore infotainment or tabloid in flavor. Web managers may be conscious that a sizable part of their audience isaccessing their sites during the day at work. On the other hand, the infinite space on the Internet gives it a luxury thattelevision does not have. It can cover everything. It is also, at this point, a less visual medium than television.
Perhaps given those similarities to print, the top stories on the Internet, at least according to our limited sample, sharemore in common with newspapers than with television.
But the Internet is more than print online. The degree to which the differences are developed and used varies from siteto site, and it does not appear to be a matter of some sites having interactivity and others not. Rather, different sitesseem to have chosen certain kinds of interactivity over others.
abecker
Typewritten Text
abecker
Typewritten Text
See end of document for content analysis methodology.
abecker
Typewritten Text
abecker
Typewritten Text
2. For this study, 9 a.m. was considered the starting point of a day. Therefore, while it could not definitively be statedthat all 9 a.m. stories are new, they were categorized as such for the purposes of this analysis.
3. The study visited sites every four hours at four different times during the day, 9 a.m., 1 p.m. 5 p.m. and 9 p.m.
abecker
Typewritten Text
1. “ePolitics: A study of the 2000 Presidential Campaign on the Internet,” Project for Excellence in Journalism, April 10,2000.
abecker
Typewritten Text
abecker
Typewritten Text
abecker
Typewritten Text
abecker
Typewritten Text
abecker
Typewritten Text
abecker
Typewritten Text
abecker
Typewritten Text
abecker
Typewritten Text
Footnotes
abecker
Typewritten Text
abecker
Typewritten Text
abecker
Typewritten Text
abecker
Typewritten Text
AudienceAudienceHow many people use the Web for news? And is that number growing or has it stabilized?
In trying to understand the answers, three trends stand out:
A majority of Americans now go online and most of them use the Web at least some of the time for news.
Whether the new media are cannibalizing the old is less clear than some people think.
While the audience may be growing, there seems to be a winnowing of the number of sites that dominate the Web fornews.
Audience Overall
To get an accurate picture of how many people use the Internet for news, we must first start with the bigger picture ofhow many use the Internet at all..
At this most basic level – whether you ever go online – the numbers vary from just over half to 70 percent of Americans,depending on how the question is asked. 1 When pollsters ask about more regular usage – in the last month or the lastweek – the data point to a lower number, just over half of Americans in September 2003, according to ComScore MediaMetrix. 2 The higher numbers are associated with only occasional use.
Online News Audience
What percent of these online users go there for news? Most of them do. According to surveys, anywhere from half to 70percent of those online get news there. 3 Extrapolating, that would put the number of total online news users at 80 millionto 105 million Americans. 4
Percent of Internet Users Who Access News Online Each Week
Design Your Own ChartSource: UCLA Center for Communication Policy, ‘’The UCLA Internet Report – Surveying the Digital Future,’’ January2003, p. 18
Design Your Own ChartSource: Pew Internet and American Life Projec.t The Pew Internet Project found in June 2003 that 69 percent of people online had “ever” gotten news there. That was upfrom 60 percent three years before. Jupiter Research found in June 2003 that 55 percent of people online had gottennews there “monthly or more frequently” (up slightly from 53 percent a year earlier). A study at UCLA found that 52percent of those online got news “during a typical week” in 2002. 5
Another Pew Internet survey, which asks people if they went online for news “yesterday,” found a smaller number, 26percent, in June 2003. While this number is lower, getting news remains a perennial top activity online. This suggeststhat while online news use for many people is not yet a daily activity, its occasional use mirrors people’s online usepatterns in general. 6
The Question Of Growth
Beyond the latest numbers, there is the question of whether online news use is still growing or whether it has peaked.Here, the data are conflicting.
Pew and Jupiter show the percentage of people that go online for news mostly growing. The UCLA study shows itfluctuating.
But even if the number is stable, if the number of people who go online overall is growing, then a steady percentage ofnews consumers would signify growth. Pinning this down, however, is difficult.
Pew Research Center data show online usage generally leveled off at around 62 percent in early 2001. The UCLAfindings also show it basically flat since 2001. But Jupiter Research predicts that usage of the Internet overall will growbecause it expects household penetration – the percentage of homes connected to the Internet – to rise from 63 percentin 2003 to 73 percent in 2007. That would be a gain of 14 million new online households, of which presumably more thanhalf would become news consumers online. 7
A shift from dialup connections to highspeed cable modems and DSL is also occurring in America’s homes. Ninemonths into 2003, 15 million homes had a cable modem, up 30 percent from the start of the year, according the NationalCable and Telecommunications Association. 8 This makes getting news online quicker and easier, and opens the door tostreaming video and vastly more amounts of data. In the years to come the shift to more bandwidth will transform onlinenews.
The Online Appeal
What attracts people to online news? One appeal is convenience. Part of the rise in news consumption online is occurringat work, a place where in the past people generally did not have the time or means, or found it unacceptable to get news.
Percent of Internet Users Who Get News There 2000 to 2003
A May 2003 study by the Online Publishers Association found that 62 percent of atwork Internet users visited a news sitein a typical week. (A Jupiter survey in July 2003 found that a quarter of all people followed breaking news at work.Roughly half of the respondents did not have online access, so of those online, the figure would be closer to 50percent). 9
This, as online journalists are quick to point out, is essentially a new group of news consumers. Previously, most newsconsumption occurred largely at home, at morning and night. Sitting around the office reading the newspaper wasfrowned upon. Sitting in the office reading news on the computer apparently is not, or in any case is not forbidden.
When people go online for news, they break down into three distinct groups, according to studies of the Pew Internet andAmerican Life Project. About half go online to see what the latest headlines are. Indeed, many online news operationssay their “prime time” is the period from 1 to 3 p.m., when people are returning to their jobs after lunch or a middayactivity. About 30 percent pursue news online after they have encountered it while doing something else online (forinstance, checking out information on a portal and seeing the news displayed on the home page), and the rest arepursuing information about a story they have already heard about from another media source. 10
Cannibalization of Old Media?
If Web usage does continue to grow, including going online to get the news, it raises a fundamental question: Will theWeb kill old media? One longstanding worry among traditional news producers, particularly newspapers, is the fear thatas more people turn to online news, it will sharply accelerate the pace at which their audience in the old media will shrink.Research in this area, though, suggests that the threat of technology may not be so cut and dry.
In 2002, nearly threequarters of users (72 percent) said that they spent the same amount of time reading printnewspapers today as they did before they began reading news online, according to Jupiter Research. Less than a quarter(22 percent) reported spending less time than before and a few, 3 percent, even said they spent more. 11
A similar pattern holds true for print magazines. 12
The Web may be having a greater negative impact on television news, but it still may not be as much as some peoplethink. In the Jupiter study, 36 percent of Internet users indicated that their television viewing time has decreased sincegoing online, 14 percentage points more than for newspaper. About 61 percent said it was the same and 2 percent said itincreased. 13
A 2000 survey from the Pew Research Center for the People and the Press also found that those who regularly wentonline reported watching less network television news than two years earlier. 14 Fewer watched television news overall,and those who did watched less of it. Meanwhile, viewing among those who did not go online was unchanged.
Amount of Time Online News Users Spent Reading Newspapers, 2002
Design Your Own Chart Source: UCLA Center for Communication Policy, ‘’The UCLA Internet Report – Surveying the Digital Future,’’ January2003; PEJ Research Light use is under 60 minutes a week, medium is 60 to 119 minutes, heavy is 120 minutes or more.
abecker
Typewritten Text
abecker
Typewritten Text
At the same time, however, the Web may be attracting young people to news who have not gravitated to more traditionalmedia. While television and newspapers have been struggling to find ways to attract younger viewers and readers, morethan 55 percent of Internet users aged 18 to 34 were getting news online in a typical week in 2002. 15
P.e rcent Of Internet Users Accessing News in a Typical Week By age group, 2002
Design Your Own ChartSource: UCLA Center for Communication Policy, ‘’The UCLA Internet Report – Surveying the Digital Future,’’ January2003; PEJ Research
.
Minutes Spent Reading Online News Weekly By age group, 2002
abecker
Typewritten Text
abecker
Typewritten Text
abecker
Typewritten Text
abecker
Typewritten Text
abecker
Typewritten Text
abecker
Typewritten Text
Source: UCLA Center for Communication Policy, ‘’The UCLA Internet Report – Surveying the Digital Future,’’ January 2003; PEJ Research
Design Your Own ChartSource: UCLA Center for Communication Policy, ‘’The UCLA Internet Report – Surveying the Digital Future,’’ January2003; PEJ Research Light use is under 60 minutes a week, medium is 60 to 119 minutes, heavy is 120 minutes or more.
The data from UCLA add another dimension to understanding the question of cannibalization. They suggest that the We.bdoes not change the basic nature of a person’s news consumption. People generally can be put into one of threecategories – heavy, medium or light news consumers. 16 According to the UCLA data, heavy consumers of online newsare also heavy consumers of newspapers. They read newspapers for an average of 225 minutes a week, a full 10 percentmore than the average of online and nononline users combined (which is 201 minutes per week).
Similarly, medium consumers of online news report midlevel usage of newspapers (159 minutes per week). And lightconsumers of online news are light consumers of newspapers (144 minutes per week, 28 percent less than the overallaverage). The Web didn’t change their behavior.
Thus the question of whether the Internet is cannibalizing or supplementing other media is complicated. The heaviestusers online are also heavy users of old media. And while some substitution is going on, getting people interested innews online could also get them interested in news elsewhere.
All this has implications. It suggests, we would theorize, that news executives perhaps should be less worried about onemedium cannibalizing another and more worried about making the news more engaging, relevant and interestinggenerally, and making their advertising and sponsorship strategies more valuable to the people paying for their products.
At least for now, people spend less time getting news online than they do getting it from other mediums. People reportspending roughly two hours a week acquiring news online, a full hour less than they spent reading newspapers, andnearly half an hour less than they did reading magazines. Online news consumption appears to be a way of gettingcertain kinds of news – perhaps updates, news pertaining to work, looking at something a coworker has mentioned – butit may be a different kind of consumption than for newspapers and magazines. If that inference is correct, it may beanother sign that the mediums may complement each other.
Where People Go Online for News
The other major audience trend in online news is that there already appears to be a shakeout in popularity among sites.
Pinning down where people go is complicated. But the best reckoning suggests not only that the big sites are gettingbigger in terms of audience, but also that the very biggest are becoming runaway winners.
Blogs
The structure of the Web allows all people with Internet connections to post their own site with their own observations,which has resulted in the birth of millions of Web logs or “blogs,” which can be periodically updated Web pages containinga single author’s thoughts. For many people, this is the most exciting part of online journalism, the promise of the Webcome to life.
Amount of Time Online News Users Spent Reading MagazinesWeekly minutes, 2002
abecker
Typewritten Text
Measuring the total number of blogs is something of an impossible task. The number is certainly in the millions, thanks toeasy access to hosting services and home pages. Perseus Development Corp., an Internet survey software company,estimated that the number of blogs on bloghosting services to be 4.12 million. While this number is staggering, Perseusalso estimated that 66 percent of these were abandoned. A quarter of all these blogs were only used once. Just 2.6percent of the blogs (around 100,000) were updated weekly. Of the active blogs, only 10% linked to a traditional newssite. And who is the average blogger? Perseus found that more than half (52 percent) of bloggers were teenagers and 40percent were people in their 20s. 17
On the other hand, this is a broader definition of bloggers than some have in mind. In some cases yesterday’s influentialprint columnists are today’s bloggers. Journalists like Mickey Kaus (formerly of The New Republic), Howard Kurtz (of TheWashington Post), Virginia Postrel (former editor of Reason) and Rich Lowry (editor of National Review), are peoplewhose blogs are often cited by the old media and thus whose influence reaches much farther than their direct audience.The Web log culture is fascinating and still evolving.
Whether it will become a serious online presence and influence on journalism remains unclear. Several panelists at theOnline News Association’s 2003 conference predicted that 2004 would be the year of blogging. 18 At this point, though,the hard data suggest that its influence, like journals of opinion in print such as The Nation or The Weekly Standard, willbe more intellectual than commercial. In 2003, many political analysts credited conservative blogs for playing a role in theresignation of Senate Majority Leader Trent Lott when the mainstream press did not do much with the story of hiscomments in favor of past segregation. Whether blogs come to define the Internet or represent only a small butappealing aspect of it, is still a questio.n .
Top Sites
In contrast with the young and transitory nature of these 100,000 active bloggers, the biggest news sites appear to bestable and growing rapidly.
According to Nielsen//NetRatings, traffic on the top 20 news sites on the Web grew by 70 percent from May 2002 toOctober 2003. That is far greater than any of the reported increases in either online users overall in 2003 or thepercentage of those users who were going to all news sites. Many sites saw increases in visitors between the last sixmonths of 2002 and the first six months of 2003. The Web sites of the cable news channels saw their audience sizesgrow, Fox News by 45 percent, MSNBC by 21 percent and CNN by 7 percent. Yahoo and The Washington Post each hada 12 percent increase. Increases also occurred at the local level: Hearst’s combined Web site traffic increased 18 percentand Gannett’s rose 6 percent. 19 The fact that traffic to these sites is swelling has a bearing on the economic side, too.As these sites draw sizable audiences, they will attract more advertising dollars.
In October 2003, the top 20 sites drew an average of 8.5 million “unique visitors” – that is, 8.5 million individuals – persite. And the biggest of the big do even better. The two most popular sites for news, CNN and MSNBC.com, eachattracted more than 20 million unique visitors in October. The next most popular news Web sites, Yahoo and AOL,attracted 17 million and 16 million a month, respectively. Some online executives say that their internal audiencenumbers are even higher, in part because atwork users are understated in the online audience ratings.
Design Your Own ChartSource: Nielsen//NetRatings, Editor and Publisher Online
Top News Web SitesBy average monthly unique visitors, January through October 2003
Design Your Own ChartSource: Nielsen//NetRatings, Editor and Publisher OnlineKnight Ridder figure does not include January through March; Tribune figure does not include January and February.
After the four biggest sites, there is a massive dropoff. The fifth site on the list averages half as many visits as AOL. Andmost of what makes up the rest are not single Web sites but combinations of various Web sites by a single owner(Gannett’s 99 local newspapers or the combined sites of the Knight Ridder newspapers, for instance). After the big four,indeed, only two others on the top 10 list are actually individual sites, those of The New York Times and The WashingtonPos.t....
Average Monthly Unique Visitors for Top 20 News Web Sites May 2002 Through November 2003
.Design Your Own ChartSource: Nielsen//NetRatings, Editor and Publisher OnlineTop 10 is based on average monthly unique visitors for the first 11 months of 2003. Blank spaces indicate that a sitedid not appear among the top 20 news sites for that month. In 2004, these top sites are poised to see continuing gains in audience as they pour resources into coverage of thepolitical year. These sites are turning to a variety of tools, some unique to the webincluding candidate backgrounders,access to voting records, matching users views to the candidates, allowing users to compare candidates by issue, andmore during the presidential campaign. 20
Time Spent
When it comes to time spent, the list of the top four sites is slightly different than the top four in usage. The top four sites– The New York Times, Fox News, CNN and AOL – are consistently those that are able to keep visitors the longest, anaverage of over 29 minutes a month per unique visitor. The average for the rest is just under 19 minutes a month. 24
Conclusion
The Web is journalism’s growth area. More people are going online everyday, and while the growth rate may be slowing,as is inevitable with new technologies, growth still is predicted to continue, and with it, so is consumption of news online.This may be causing some erosion in the use of old media, but it is not across the board. At least so far, the Internetmay be hurting television viewing more than newspaper and magazine reading. Instead, the bigger question about theWeb has to do with economics.
Footnotes
1. The Pew Research Center for the People and the Press found just over 60 percent of people 18 and over went onlinein 2002. When people as young as 12 years old are added to the total, a UCLA survey put the number in 2002 at 71percent.
2.The first number comes from Pew Research Center for the People and the Press, “Public’s News Habits Little Changesby Sept. 11,” June 9, 2002, p. 70. Adults over 18 were surveyed. The second number comes from the UCLA Center forCommunication Policy, ”The UCLA Internet Report – Surveying the Digital Future,” January 2003, p.18. Respondentswere 12 and older. In both cases, the data were weighted against census demographics in order to estimate usage forthe entire population. See also comScore, “comScore Media Metrix Announces Top 50 U.S. Internet Property Rankingsfor September 2003,” press release, October 21, 2003. comScore derives its numbers on overall Internet through acontinuous telephone survey using a random digit dialing (RDD) method.
3. Pew Internet and American Life Project, tracking surveys, June 2003; UCLA Internet Report – Year Three, p. 18.Jupiter Research, “Individual User Survey,” June 2003, www.jupiterresearch.com
abecker
Typewritten Text
abecker
Typewritten Text
abecker
Typewritten Text
abecker
Typewritten Text
Top Four Online News Sites by Unique Visitors May 2002 Through November 2003
4. We calculated the possible range of online news users by starting with comScore’s September 2003 online universeestimate of 150 million Internet users. News use estimates range from 55 percent (Jupiter Research) and 70 percent(Pew Internet and American Life Project), which would put the number of online news consumers at between 83 and 105million).
5. Pew Internet and American Life Project, tracking surveys, June 2003; UCLA Internet Report – Year Three, p. 18.Jupiter Research, “Individual User Survey,” June 2003, www.jupiterresearch.com
6. Pew Internet and American Life Project, tracking surveys, June 2003
7. Pew Research Center for the People and the Press, “Public’s News Habits Little Changed By Sept. 11,” June 9, 2002,p. 70; 2003 UCLA Internet Report – Year Three, p. 18, Jupiter Research “Jupiter Consumer Survey Report: Technology inthe Home,” 2003, www.jupiterresearch.com
8. David Wilkerson, “Broadband, digital boost cable in Q3,” CBS MarketWatch, November 19, 2003
9.Online Publishers Association, “At Work Internet Audience Media Consumption Study,” May 2003, www.onlinepublishers.org; Jupiter Research, “The AtWork Audience: Programming for the Office,” 2003, www.jupiterresearch.com
10. Pew Internet and American Life Project Research, email from Lee Rainie, director, November, 21, 2003.
11. Jupiter Research, “Individual Consumer Survey,” June 2003, www.jupiterresearch.com
12. Heavy online news users report spending nearly three hours a week (165 minutes) reading magazines, 27 minutesmore than most people, according to the data. Medium and light online news users similarly reflect their magazine habits.
13. Jupiter Research, “Individual Consumer Survey,” June 2003, www.jupiterresearch.com
14. “Internet Sapping Broadcast News Audience,” Pew Research Center for the People and the Press, June 11, 2000, P.1. In 1998, 59 percent of both Internet and nonInternet users reported watching nightly television network news on atypical day. In 2000, the percentage of Internet users who regularly watched had dropped to 53 percent. In addition, thenumber of Internet users who reported watching at least half an hour a day of network television news dropped from 48percent in 1998 to 40 percent in 2000. Among nonInternet users, Pew found virtually no dropoff in the amount of timespent with network news.
15. 2003 UCLA Internet Report – Year Three; PEJ Research. The UCLA Internet Report is an annual survey of 2,000households in the United States. First conducted in 2000, the sample includes both Internet users and nonusers. Formore information and a copy of the 2003 report “Surveying the Digital Future,” visit the UCLA Center for CommunicationPolicy at www.ccp.ucla.edu.
16. Most people fall into one of three categories of news consumption according to many researchers–news junkies,moderate users and light users of the news. The Web attracts all three. As of 2002, more than a third (39%) of the onlinenews audience were news junkies, spending more than two hours a week online getting news. Roughly the same percent(38%) reported medium usage (60119 minutes) and only 23% said they were light users (less than 60 minutes a week).
17. Perseus Development Corporation, “The Blogging Iceberg: Of 4.12 Million Hosted Weblogs, Most Little Seen, QuicklyAbandoned,” white paper. 2003, http://www.perseus.com/blogsurvey/thebloggingiceberg.html
18. 2003 Online News Association Annual Conference, November 15, 2003, Evanston, Illinois.
19. The list of the top 20 news and current events Web sites comes from Nielsen//NetRatings, and is displayed on theEditor and Publisher Online site. The rankings are calculated through monitoring the usage of a panel of Web users todetermine the sites with the greatest number of unique visitors. Nielsen//NetRatings classifies news Web sites accordingto the media companies’ preferences; thus, some newspaper Web sites are counted separately in these rankings whileothers are aggregated for a single ranking for the entire chain. Several of the entries on the Top 20 list are actuallygroups of sites owned by the same company.
20. Mark Glaser, “Best Coverage of the US Elections,” Online Journalism Review, December 11, 2003. Available onlineat: http://www.ojr.org/ojr/glaser/1071184205.php
21.Nielsen//NetRatings, “RoundtheClock News Coverage of the War in Iraq Draws Surfers Online, According toNielsen//NetRatings,” press release, March 27, 2003
EconomicsEconomicsMany Web sites have now reached a point where they can claim profitability.
That good financial news, though, must be put into perspective. First, the money being made on the Internet is still arelatively small part of company income. Second, how much of a profit center it is depends to a certain extent on howcosts are accounted for, and many news Web sites do not pay for the cost of supplying much of their content.
It will still be years until the Internet becomes a major economic engine that is paying for the journalism it produces ratherthan piggybacking off its older media parents.
Still, the Internet is journalism’s growth area, at a time when other areas are shrinking in audience, which is puttinginevitable pressure on economics and quality. The growth rates for revenue and profit are high, and at the close of 2003,the projections for 2004 and beyond were aggressive. Some of this optimism stems from a belief that companies willbecome savvier at using the data that they collect from users, both through requiring registration and by tracking people’sactual use of the site. As Web publishers learn more about their users, they will be able to increase their revenue fromadvertisers willing to pay more to reach specific demographics. 1
Revenues
It is important to recognize that the Web represents only a small part of the overall revenue of these companies. Thenumbers, realistically, would be barely worth mentioning for these corporations except for the perceived potential growthof the sector. In a report, “What Newspaper Web Sites Earn,” Borrell Associates examined the 2002 online revenues fromthe 11 largest publiclytraded newspaper companies. 2 These online revenues on average accounted for only 2 percent oftotal revenues of the companies. Dow Jones, which charges for online access, had the highest percentage with 3.2percent. 3 Even if the online revenues continue at robust rates of growth, it should be kept in mind that it will be someyears before they make up a significant portion of company revenue. 4
Even a comparison of newspaper groups’ online revenues to their newspaper revenues demonstrates online divisions’relatively small contribution. At the New York Times, online revenues were only 4 percent of newspaper revenues in thethird quarter of 2003.
Online Revenues for Newspaper Companies, 2002
Design Your Own Chart
Source: Borrell Associates, ‘‘What Newspaper Web Sites Earn,’’ April 2003, p. 8 *Includes revenue from nonNewspaper related sites, such as television Web site revenues and other Web ventures.New York Times Co. includes the Web sites for the New York Times and the Boston Globe. Gannett figure does notinclude the USA Today Web site.
Keeping this in mind, however, the rate of growth is impressiveand important. Except for Dow Jones, each of the 11newspaper companies reported a doubledigit increase in revenue for their online operations in 2002, according to BorrellAssociates. Belo led with a gain of 49 percent. Gannett, Tribune, Knight Ridder, Lee, and Media General all hadincreases of at least 25 percent, and The Washington Post reported 18 percent growth. 5
The projections for 2004 are that such growth rates will continue and perhaps increase. The Online PublishersAssociation said that in a survey of 26 leading media companies, which included many newspapers, 2003 thirdquarteradvertising revenue was 46 percent higher than in the third quarter of 2002. 6 Even if 25 percent growth persists,newspaper companies will double their online revenues by 2005 over 2002 levels and triple them by 2007.
There are suggestions that this impressive rate of growth is true at other Web outlets. Richard Deverell, head of BBCInteractive, remarked in 2003 that BBC.com was getting 3 million readers every day and was growing by 50 percent ayear, while BBC television was getting 10 million viewers a day and was declining by 5 percent a year. 7
While the revenue model of the news on the Web is still emerging, the picture is clearly improving.
One factor is classified advertising. McClatchy reported an 80 percent increase in 2003 online classified revenue over2002. 8 WashingtonPost.com, on the other hand, has reported over 60 percent growth n revenues excluding classifiedadvertising, and 30 percent overall. 9 Classified revenue, in other words, is not growing at the same rate as otheradvertising sectors.
Online Revenue as Percent of Total Company Revenue, 2002For 11 public newspaper companies
Design Your Own Chart
Source: Borrell Associates, SEC FilingsIncludes Media General Inc., Lee Enterprises Inc., Belo Corp., McClatchy Co., Washington Post Co., Dow Jones Inc.,Knight Ridder Inc., New York Times Co., Tribune Co., and Gannett Inc
Profitability
Getting a grip on the next part of the economic picture, profitability, is a little harder. Borrell does not collect profit figures,only revenue. Even where there are numbers, moreover, profitability is hard to gauge since Web sites require substantialinvestments as seed money to design and operate them. So, while a site or online division may be making money oncurrent operations, the startup costs have to be considered when calculating the Web’s full impact on the company.
Design Your Own ChartSource: SEC FilingsNew York Times Digital does not include the New York Times Regional Group
The evidence suggests, however, that profits are improving. Some bigger companies, indeed, are now able to argue theyhave crossed the breakeven point. ABC News announced that its online division turned a profit in its 2003 fiscal year. 10For newspapers, four large corporations report operating profits for their online divisions to the SEC. The onlineoperations of two of these companies – the Tribune Co. and The New York Times – became profitable for the first time in2002, after incurring large losses in 2000 and 2001. Two others, Knight Ridder and the smaller Belo, continued toapproach profitability in 2002 but still had losses. It may be that The Times and the Tribune Co. have been able toleverage the size of their individual newspaper audiences with advertisers looking to get a good price for as many eyeballsas possible. Chains with smaller newspapers may have to work harder in order to collect ad dollars.
Some have raised the concern that even these profit numbers and, to some extent revenues, may be inflated throughcomplicated accounting procedures. Newspapers often sell print and online classified advertising as a package deal. It isthen up to each company to decide how much of each classified dollar belongs to print and how much to online. Byshifting around the distribution, online divisions can appear more or less profitable. “There’s no hint here of EnronWorldComstyle accounting,” Dominic Gates wrote in the Online Journalism Review. “It’s not crooked – it’s justcomplicated with lots of room for fiddling with the numbers.” 11
One thing is clear, however. As the newspaper industry watches shrinking readership, declining circulation and stagnantadvertising revenues, the investment in the Web represents, to date, the industry’s primary investment in the future.
Different Economic Models on the Web
At this point, there is no established financial model for online news divisions. Will the revenue come more fromadvertising, as it does in newspapers in TV, or more from subscriptions, as it does in newsletters, or from a combination?Many companies are trying different approaches with their sites in hopes of finding a sure formula. To understand thediversity of models springing up, consider the sites of three of the largest print dailies, The New York Times, The WallStreet Journal and The Washington Post.
The New York Times
The New York Times Web site is operated by a subsidiary of the New York Time Company, New York Times Digital(NYTD), which also operates The Boston Globe’s boston.com. The Times site remains mostly free for users, as long asthey register and provide some personal information. By requiring registration, NYTD is able to track users’ movementsthrough the site. These movements are then used as leverage with advertisers, allowing them to target their mostdesirable consumers.
Unlike most newspapers, NYTD does not acquire its content free. The online division purchases content from the printdivision for the amount of 10 percent of the NYTD’s revenue. In turn, NYTD draws revenue from two main streams:selling advertisements on the site and licensing Times content to electronic databases. The Times has promoted its
abecker
Typewritten Text
abecker
Typewritten Text
abecker
Typewritten Text
Revenues and Profits for Select Newspaper Online Divisions2000 to 2002
abecker
Typewritten Text
abecker
Typewritten Text
abecker
Typewritten Text
abecker
Typewritten Text
abecker
Typewritten Text
abecker
Typewritten Text
abecker
Typewritten Text
abecker
Typewritten Text
abecker
Typewritten Text
abecker
Typewritten Text
online advertising opportunities as a way to reach a desirablely affluent audience of about 10 million unique visitors eachmonth. To help grab users’ attention, the site sells “surround sessions” where advertisers can purchase all the advertisingspaces on a screen, ensuring that users will only see their advertisements. 12
Not all of The Times’s Web site is free, however. Users must pay for such special content as crossword puzzles ($34.95for an annual subscription). In a larger move in May 2003, The New York Times site started charging for its popular email alerts service, News Tracker. For $29.95 a year, subscribers receive emails of Times content on up to 10 topics.Before the fee was imposed, the service had 500,000 readers. By August 2003, the service had 20,000 subscribers. 13
The mix of streams has resulted in profits for NYTD. For the third quarter of 2003, the division announced profits of $5.7million on revenues of $21.8 million (the New York Times Company as a whole had revenues of $759 million). About 71percent of NYTD’s revenue comes from advertising and the rest from electronic licensing of Times content and otherservices. 14
The Wall Street Journal
The Wall Street Journal follows a different route to reap its revenues. Like The Times, it sells advertisements on itspages. But anyone who wishes to read The Journal online must pay an annual subscription. Even those who alreadysubscribe to the Journal in print form must pay for it, though at a lower rate.
The Journal, owned by Dow Jones, remains one of only a few – and the only major newspaper – to charge for access.While not uncommon with magazines and the trade press, as of January 2003, Editor and Publisher reported, only 21daily newspapers were employing the subscription model. 15
The Journal charges $79 a year to subscribe online ($39 for print subscribers), or $6.95 a month. As of September 2003,the site had 686,000 subscribers, which represent the bulk of the site’s revenue (approximately $16 million in the thirdquarter of 2003). Unlike the Times, the Wall Street Journal’s site does not benefit from database licensing (chargingonline archive companies for access to older articles); this activity belongs to another division of Dow Jones, which alsomakes money online through the Dow Jones Newswire. 16
Many newspapers have feared that charging users would chase them away. Yet Editor and Publisher’s Steve Outingpredicts that “[w]hat is likely is that an increasing number of news sites – including the most prominent ones – will createmore and more ‘premium’ content, for which they will charge fees to view.” 17 Outing warns that such a system hasnegative effects since this premium content falls below the radar of search engines, a key magnet for drawing traffic. Oneadded benefit enjoyed by The Journal has been being able to add each of its online subscribers paying the full $79 a yearsubscription fee to its overall ABC circulation total, which led to a 290,000 jump in circulation between 2002 and 2003. 18
The Washington Post
The Washington Post represents a third online approach. Unlike the New York Times’s push for targeted advertising andThe Wall Street Journal’s insistence on a subscription, the Washington Post’s online site relies on general advertising,including classifieds, in order to produce its revenue.
The Post Web site is run by a subsidiary of the Washington Post Company called Washingtonpost.Newsweek Interactive(WPNI), whose offices are across the Potomac River from Washington in Arlington, Virginia. The site does not charge asubscription or ask users to register, though it does ask for some basic demographic information. It also does not have topay for content.
As a result, nearly all of the revenue comes from advertising. Revenue for WPNI, which mainly comes from The Postsite, was $12 million for the third quarter of 2003, an increase of 32 percent over the third quarter of 2002. A large chunkof this revenue, 40 percent, came from classified advertising, which The Post has aggressively sought to increase with itsWashingtonJobs.com section. 19
In its efforts to generate revenue from the Web, the Post defies longestablished standards that govern the print product.For example, the newspaper would not dare run advertising on its front page or next to the editorials, yet ads greet userson the Web in both places. This has become the norm on many advertisingsupported Web sites, as newspaper sitesdevelop unique norms on what is an acceptable space for advertising.Making Ends Meet
The model that online news sites follow may depend in part on the size of the publication. For now at least, the larger thepaper, the more remunerative its online division is. Borrell found that the largest newspapers (those with circulations of
more than 200,000) took in nearly four times as much revenue as the smallest dailies after accounting for differences insize.
Indeed, the smallest papers (those with circulations of less than 50,000) average less than $6 in online revenue for eachof their print subscribers. Newspapers with circulations of more than 200,000 were able to collect more then $20 in onlinerevenue per print subscriber. Revenues for newspapers between 50,000 and 200,000 fell in the middle. Overall, the sitesin the study averaged $14.49 in online revenue per unit of print circulation.
Newspaper Online Revenue Per Subscriber, 2002
Design Your Own ChartSource: Borrell Associates, ‘‘What Newspaper Web Sites Earn,’’ April 2003, p. 12 Based on 246 newspapers.
Where Local Online Advertising Goes, 2002
Design Your Own ChartSource: Borrell Associates, ‘‘What Newspaper Web Sites Earn,’’ April 2003, p.5
In the latest year for which data were available, 2002, newspaper Web sites procured a 40 percent share of online localadvertising. The next largest slice belonged to online yellow pages, with 24 percent. Yahoo, AOL and MSN got 12percent. Local television and radio sites got 3 percent. 20
Newspaper publishers’ greatest concern comes from the 21 percent of local advertising dollars going to the socalledvertical companies online such as eBay, Monster.com, and AutoTrader.com. Borrell Associates labels these new
companies as “classified killers” because they eat away at the robust income that newspapers have enjoyed for so long.As they are in print, classifieds are an important revenue stream online. The McClatchy newspaper company, forinstance, draws 60 percent of its online revenue from classifieds. 21 In an already shallow pool of online advertisingdollars, newspaper Web sites are having to learn how to compete to a much greater degree than they have had to inprint.
There is another problem. If the newspaper Web sites lose substantial portions of online classifieds, they seem likely tolose them out of their newspapers as well. Why would someone who chose Monster.com over the local newspaper for anonline classified ad then turn around and make a separate purchase of a newspaper classified?
The problem has a societal as well as business implication. If substantial portions of classified advertising shifts awayfrom paying for journalism, the political and social impact could be enormous. The resources of the most importantnewsgathering organization in every town in America could shrink. Instead of endeavoring to cover the totality of theircommunities, newspaper companies, in whatever delivery form, would be forced to be much smaller, targetednewsgatherers, with smaller staffs and more limited news agendas. Newspapers, in that sense, would move more in thedirection of local television.
Local TV
Television stations do not face the same threat as newspapers of losing large advertising sectors. But the transition frombroadcast to online content is more difficult than it is for newspapers, for which text on paper simply can become text onscreen. And the Web is an even more paltry part of television company revenue at this point. The national televisionnetworks and cable channels have been able to build popular sites, but while most local television stations now have Websites and are accustomed to adding new content quickly, they have difficulty competing with the depth of the localnewspaper.
Who’s Making a Profit on Local News Web Sites, 2002Survey of station managers
Design Your Own ChartSource: RTNDA/Ball State Survey by Bob Papper, RTNDA Communicator, April 2003
As part of his annual survey for the Radio Television News Directors Association, Prof. Bob Papper of Ball StateUniversity asked local television news directors if their Web sites were making money. Only 13 percent indicated a profitwhile 25 percent reported a loss. About 44 percent of respondents said they did not know if their sites were makingmoney. This could indicate widespread detachment of news directors from the online activities of their stations, a theorysupported by the fact that news directors in the largest markets were the most likely to be in the dark (74 percent). In thesmallest markets the figure was only a third, 34 percent. As the market grows, so does the newsroom, and news directorscould be somewhat more specialized in their responsibilities. Or, perhaps, many of those surveyed chose for one reasonor another not to reveal the financial status.
Stations’ online profitability does not seem to be in proportion with its market size. The highest percentage of newsdirectors indicating an online profit came from the middlesized markets. Yet news directors from both the next larger andnext smaller markets were less likely to report online profits.
Many television stations turn over their sites to companies that specialize in creating television Web sites. Two of thesecompanies – Internet Broadcasting Systems (IBS) with 65 stations and WorldNow with 143 stations – are in theNielsen//NetRatings top 20 News Web sites list. “All IBS sites over a year old are profitable, and we are growing thosemargins,” the IBS chief executive, Tolman Geffs, said in an article in the Online Journalism Review. 22
Certainly, the television station sites’ audience growth suggests the potential for profit. From September 2002 toSeptember 2003, IBS’s aggregate monthly online audience grew by 50 percent to 8 million unique visitors. In the sameperiod, WorldNow’s total traffic increased by 32 percent to 3.3 million unique visitors
In the end, the economics of news on the Web are promising but still evolving. While revenues are growing, andaudiences are robust, generating bigtime revenue remains a struggle and the model is unclear. While Web journalism istrying to sort out reliable ways to make money, it is also having to fend off new forms of online competition for ad dollars,such as Monster.com, that are not engaged in journalism. For now, the biggest Web sites and newspaper companies arefaring best. Smaller ones may thrive in chain combinations. But in many ways, the economics of the Web might beanalogous to radio in the 1920s. It is not clear yet what the industry will look like even 10 years away.
Footnotes
1. Dave Morgan, “News Web Sites: A Future Waiting to Happen,” Editor and Publisher, December 18, 2003. Availableonline at: http://editorandpublisher.com/editorandpublisher/headlines/article_display.jsp?vnu_content_id=2054556
2.These companies are: Gannett, Tribune, New York Times, Knight Ridder, Dow Jones, Washington Post, McClatchy,Belo, Lee Enterprises, Media General and Journal Register.
3. Borrell Associates Inc, “What Newspaper Web Sites Earn,” April 2003; Advertising Age, ”100 Leading MediaCompanies list,” http://www.adage.com/page.cms?pageId=1018
4. New York Times SEC Quarterly Report, November 5, 2003. The comparison is made between the revenues of NewYork Times Digital ($22 million), which operates the Web sites for The New York Times and The Boston Globe, and therevenues of The New York Times and the New England Newspaper Group ($582 million), which includes The Worcester(Mass.) Telegram and Gazette as well as The Globe.
5. The lone exception, Dow Jones, which owns the subscriptionbased Wall Street Journal Web site, had only a 3 percentincrease. The Wall Street Journal’s lack of online growth may stem in part from the downturn in business advertising in2003. Another factor may be its choice to follow a subscriptionbased Web site rather than a completely advertisingbasedsite, which is discussed below. A third part of the explanation may be that Dow Jones is simply farther along in itsdevelopment, so its growth is slower.
6.Online Publishers Association, “Quality Online Content Providers Show Substantial Third Quarter and YeartoDate AdRevenue Growth,” press release, November 20, 2003. Online at http://www.businesswire.com/cgibin/cnnstorydisplay.cgi?story=/www/bw/webbox/bw.112003/233244978.htm
7. Richard Deverell, comments made at the 2003 Online News Association Annual Conference, November 15, 2003,Evanston, Ill.
8. Leon Lazaroff, “Profitable classifieds poised to climb in ’04,” Chicago Tribune, December 13, 2003
9. “The Washington Post Company Reports Third Quarter Earnings,” Quote.com, October 31, 2003. Available online atfinance.lycos.com/qc/news/story.aspx?story=200310311517_PRN_DCF003
10. “ABC News Online Services Turns to Profit,” Reuters, December 18, 2003.
11. Dominic Gates, “Dubious Accounting?” Online Journalism Review, July 10, 2002. Available online atwww.ojr.org/ojr/future/1026348767.php.
12.New York Times Web site: http://www.nytimes.com/ads/marketing/surroundsessions/
13. “NYTimes.com’s Paid News Tracker Service Surpasses 20,000 Subscribers,” Business Wire, August 7, 2003.
14. New York Times Quarterly Report (10Q), November 5, 2003
15. Carl Sullivan, “More Publishers Try AllPaid Web Model,” Editor and Publisher, January 23, 2003
16. www.wsj.com; Dow Jones, Inc. Quarterly Report (10Q), November 14, 2003
17. Steve Outing, “Stop the Presses!” Editor and Publisher, January 27, 2003, www.editorandpublisher.com
18. Mark Glaser, “Journal Takes Broader View of Circulation with Online Inclusion,” Online Journalism Review, November11, 2003. Available at www.ojr.org/ojr/glaser/1068601595.php.
19. Melinda Gipson, “Playing the Game to Win,” Newspaper Association of America, August 2002, p. 20.
20. “What Newspaper Web Sites Earn,” Borrell Associates Inc., April 2003, p. 5, fig. 1
21. “Playing the Game toe Win,” Newspaper Association of America, August 2002, p.7
22.Cory Bergman, “TV Stations May Finally Get the Point,” Online Journalism Review, April 24, 2003. Available online atwww.ojr.org/ojr/bergman/1051220842.php.
OwnershipOwnershipWhile technologically the Internet maintains its potential for open access and interactivity, when it comes to garneringlarge audiences, only a few succeed. And, those few are most often wellestablished names from other mediums.
The vast majority of the top 20 news sites are owned by big companies that make their money primarily from existingmedia. They have been able to leverage their brands and their resources in order to dominate online as well.
The major news sites on the Internet are not only big, but the names are familiar as well. The big companies includeTime Warner (CNN and AOL), Disney (ABC), General Electric (NBC) and others.
Proportion of 2003 Top 20 News Sites Owned by the 100 Top Media Companies
January through October, 2003
Design Your Own ChartSource: Advertising Age 100 Leading Media Company list; Nielsen//NetRatings and Editor and Publisher Online; PEJResearchThe top 100 list is determined by domestic media revenues. The top 20 Web sites are by monthly unique visitors. Inthe first 10 months of 2003, 26 sites appeared in the top 20 list.
In the first half of 2003, 26 different sites made it on the monthly list of the top 20 for audience. 1 Fully 85 percent ofthese sites (22 out of 26) have parent companies among the top 100 media companies, according to Advertising Age. 2
And most of them are the biggest of the big; 69 percent of the most popular news Web sites are owned by the 20 biggestmedia companies.
Close to half of the most popular Web sites (42 percent) are owned by one of the 10 largest media companies. And four– CNN, AOL, Netscape and Time Magazine – are owned by a single company, Time Warner, the biggest media companyof all in revenue. (The other 10 owners include Viacom (CBS), Disney (ABC), News Corp. (Fox), Gannett, and Microsoftand General Electric (MSNBC).
A quarter of the most popular news Web sites (27 percent) are owned by companies in the next tier in size (the 11ththrough 20th biggest companies in revenue). These include some of the nation’s bigger newspaper companies, such asthe Tribune Co., Hearst, Advance Publications, The New York Times and Knight Ridder.
Yahoo, which ranked as the third most popular news site during the first half of 2003, is one of the few companies thatderives its revenue chiefly from online ventures. It ranks 40th in the Advertising Age list.
The 15 percent of the top sites not owned by one of the top 100 media chains includes Internet startups such asWorldNow and Internet Broadcasting Systems. It also includes older, established outlets such as the BBC and Microsoft.
And one of these companies is not as independent as one might think: Internet Broadcasting Systems counts HearstArgyle, PostNewsweek and McGrawHill as investors.
Beyond the fact that the major players on the Internet are large and familiar media company names, perhaps the moreinteresting question is: What is the business strategy they are following?
The prevailing trend in the era of online news has been to create synergy. On the Web this is true not only within acorporation, but also across different companies. In this way, there can be popular news sites that produce no news oftheir own.
Two of the top four news sites – CNN and AOL – fall under a single owner, Time Warner. On the one hand, the companyleverages its worldwide cable news brand name with CNN, which it uses for promotion as well as Webonly news andfeatures. AOL is the opposite. It can be seen only by the nearly 25 million AOL subscribers and relies on content from avariety of other sources, both from Time Warner (CNN and Time) and from other national outlets such as ABC, The NewYork Times and The Wall Street Journal. 3
Yahoo news parallels the AOL model. Rather than strike out into the world of online journalism by reporting its own news,Yahoo culls from more than 100 outlets. For example, the Yahoo news page features links to Washington Post and USAToday articles. MSNBC is owned jointly by Microsoft and NBC. It also draws heavily from The Washington Post, as wellas Postowned Newsweek.
The top newspaper sites – The New York Times, The Washington Post and USA Today – supply their sites with content,using the Web as a showcase for breaking stories before they appear in the paper the following morning.
At the same time as these large media corporations are finding new ways to promote news content on the top Web sitesand cementing their hold at the top of the online news world, another strong movement has been toward the personallyowned blog. The nature of the Web means that anyone with a computer and an Internet connection can effectively ownhis or her individual news outlet. Web hosting prices are low enough that even the largest blogs can be run for less than$500 a month. 4 While most blog sites go unnoticed or are quickly abandoned, some have had enough impact to offer analternative to the mainstream news media.
The Web makes it possible for the coexistence of big media, with its resources for covering news quickly, and smallmedia, with their penchant for opinion and even breaking stories that may escape the attention of the rest of the press.
Footnotes
1. The 26 sites are: ABC News, Advance Internet, AOL News, BBC World Service, CBS News, CNN, Cox Newspapers,Fox News, Gannett, Hearst Newspapers Digital, Internet Broadcasting Systems Inc., Knight Ridder Digital, LA Times,McClatchy Newspapers, MediaNews Group, MSN Slate, MSNBC, Netscape News, NYTimes.com, The Boston Globe,Time Magazine, Tribune Newspapers, USAToday.com, washingtonpost.com, WorldNow, Yahoo! News
2. Advertising Age, “100 Leading Media Companies,” AdAge.com, August 2003. Companies are ranked by their totalmedia revenues collected in the United States in 2002. The list is available at http://www.adage.com/page.cms?pageId=1018.
3. Howard Kurtz, “AOL Version 2004: You’ve Got News,” Washington Post, December 22, 2003, p. c1.
4. Kathy Kiely, “Freewheeling ‘bloggers’ are rewriting rules of journalism Objectivity? Not here — and the masses eat itup,” USA Today, December 30, 2003, p. 1A.
News InvestmentNews InvestmentHow much are companies investing in their online newsgathering? In one sense, online is the area where newscompanies are devoting much of their real R&D for the future. This is due to changes in technology, including theincrease in the number of homes with broadband and mobile devices, such as cell phones and personal digital assistants(PDAs) that can receive video. People in the industry agree that these developments will transform online news from achiefly textbased medium to one that is more multimedia. Such a transformation requires both new equipment andreporters able to make use of this equipment. 1 Companies are devoting more efforts to getting multimedia into theirsites. They are also doing a great deal to modify their product for mobile consumption. The day is near when one canwatch Peter Jennings deliver the news on demand on his or her telephone.
The question of how much to invest online is one of culture, vision and guts. And different companies are taking clearlydifferent approaches.
There are competing pressures at play that might lead one to risk more investment or make one hesitant. On the onehand, the Web is the one part of the news business that is clearly growing. That would seem to demand investment toget ahead of the curve.
On the other hand, since many Web sites are just beginning to make a profit, it may be difficult to siphon still moremoney and employees into something that is not yet a major contributor to the bottom line and may indeed weakenmargins. Many companies, such as MSNBC.com, have not added the kind of staffing they imagined they would a fewyears ago. In December 2001, when the site was experiencing a huge surge in traffic following the September 11 attacks,the site actually shed 9 percent of its staff of 200. 2 Much of this was due to the sustained advertising downturn that hitmedia outlets at the time. The site also had to deal with a phenomenon that television counterparts have not had to dealwith: A larger audience requires more money in order to acquire the necessary bandwidth. PostSeptember 11 streamingvideo cost the site an extra million dollars. 3
Cuts at MSNBC.com did not cease, and the staff shrank to 170 in October 2002 and then to around 155 in 2003.Moreover, the site has revised its prediction of profitability in 2001 to 2005. 4 The former head of the news site, MerrillBrown, left the company reportedly in frustration over cutbacks in June 2002. On the cable side, MSNBC has haddifficulty making a profit, leading Microsoft’s chief executive, Steve Ballmer, to say that had he known the difficulties thatwould be faced, he likely would not have made the investment. 5
Washingtonpost.com does not release the number of its online employees, but taps the resources of all its reporters invarying degrees, from daily bloggers like media writer Howard Kurtz to simply posting stories from the newspaper. NewYork Times Digital reported employing 240 people at the start of 2003, though they didn’t break down how many of thosewere engaged in newsgathering. 6
In July 2003, The Washington Post set out to take advantage of its Web site’s large daytime traffic by creating adepartment of continuous news in its newsroom. With a staff of five, this department is charged with getting Post storieson the Web as early as possible. The hope is that this investment will lead to less of a reliance on wire stories during theday and more exposure for Post content in the national, and even international, news arena. 7
The emphasis on getting articles submitted earlier for the Web has met some resistance. The Post’s ombudsman,Michael Getler, wondered whether the time spent getting earlier versions of an article in for the Web would reduce thetime editors and reporters have to get the story ready for the paper. Post staffers were anxious that the new departmentwould lead to an increased workload with no increase in pay. As online news gains in both exposure and moneymakingpotential, questions arise whether news organizations will invest in new staff members or require more from those alreadythere. 8
What does a site do when it does not have the resources of a newspaper at its disposal? The online arm of CBS Newsshows another path. It started out in 1998 as CBS.com and was larger than it is now; like other media outlets, it wasforced to make cuts in 2000 and 2001. In May 2002, CBSNews.com was formed with a smaller staff focusing ondelivering aroundtheclock news. 9 Instead of focusing on creating original reporting (like The Post), CBSNews.com usesa lot of repackaged content and interactive features. As a result, the site is making money, according to Michael Sims,the director of news and operations. 10
Data gathered about local television and radio Web sites suggest that the number of people involved in these operationsremains fairly modest.
Average Staffing of Local TV News Web SitesSurvey of news directors
Design Your Own ChartSource: RTNDA/Ball State Survey by Bob Papper, RTNDA Communicator, April 2003 The response rate for the survey was 62.6 percent, or 890 of the total 1,421 stations.
Average Staffing of Local Radio News Web SitesSurvey of news directors
Design Your Own ChartSource: RTNDA/Ball State Survey by Bob Papper, RTNDA Communicator, April 2003
The number of people involved in these operations remains small. Local television stations in 2002 averaged just 2.7members devoted to their online operations. While this is a significant increase from 2001 – 40%, in fact – the total
In addition, roughly half are current staff members who now devote part of their time to the Web site, rather than beingfulltime Web employees.
The bigger stations (in markets 125) have more resources, but they are not putting many more people to the task thanare smallermarket stations. The average staff size for stations in the top 25 markets was 3.4, while the smallestmarketstations still averaged three staff members. The difference seems to be that in the largest markets most of the staff isfulltime while in the smallest the bulk is parttime.
Radio is also investing online, although to a lesser extent. In 2002, local radio stations, according to the survey data,averaged 2.1 staff members for online operations, an increase of 15 percent over 2001. The major markets by far had themost staffers, over 4 on average, while the smaller markets had fewer than 2 staffers. 12
Given that the economics of online news are still evolving, it is probably not surprising to find differences in how muchcompanies are investing in their online newsgathering. But the histories of other mediums, particularly newspapers andtelevision, suggest that when a medium faces audience growth but an advertising downturn, the longterm winners maybe those that invest in hard times to build audience loyalty, even at the cost of shortterm profitability.
Whether this means, for example, that The Washington Post, which is building, will overtake MSNBC.com, which wascutting, is not so simple. One is a national online entity. The other is associated with a newspaper that circulates largelyonly in the Washington, D.C., metropolitan area and whose attempt at a print national product, The Washington PostWeekly, never succeeded. The picture is made more complicated by joint ventures and other agreements: The Post andMSNBC.com have one of those shared agreements. But experience would suggest that in an evolving medium, thosewith the longterm approach and vision will prevail, and early leaders can easily disappear.
Footnotes
1. Vivek Shankar, “Reporters, readers get new ways to publish and read,” Online News Association, November 15, 2003.Online at http://www.journalists.org/2003conference/news/000040.html.
2.”MSNBC.com tightens purse strings,” Reuters, December 3, 2001. Available online at: http://news.com.com/21021023_3276528.html
3. “NBC Announces layoffs at MSNBC.com” Marketplace, Minnesota Public Radio, December 4, 2001
4. “8 Journalists laid off at struggling MSNBC.COM,” Seattle Times, October 11, 2002
5. John Lafayette, “What does Microsoft really think of the MSNBC venture?” Cable World, October 7, 2002, p. 13
6. New York Times SEC 10K Filing, February 24, 2003.
7. Steve Outing, “News is Really Continuous at washingtonpost.com,” Editor and Publisher Online, January 14, 2004
8. Michael Getler, “Department of Continuous News,” Washington Post, July 31, 2003, p. B6; Erik Wemple, “WebSpinning,” Washington City Paper, July 4, 2003
9. Private conversation with CBS Employee
10. Mark Glaser, “CBSNews.com trying to win as tortoise in online news race,” Online Journalism Review, August 12,2003
11. These statistics comes from RTNDA surveys of news directors conducted in 2001 and 2002 by Prof. Bob Papper ofBall State University. The response rate for television was 62.6 percent (890 total). For radio, 272 news directors from445 radio stations responded.
RTNDA is the world’s largest professional organization devoted exclusively to electronic journalism. RTNDA representslocal and network news executives in broadcasting, cable and other electronic media in more than 30 countries. RTNDFpromotes excellence in electronic journalism through research, education and training for news professionals andjournalism students. The Foundation’s work is supported by contributions from foundations, corporations, members of theRadioTelevision News Directors Association, and other individuals. Its code of ethics can be found here:http://www.rtnda.org/ethics/coe.shtml.
12. Help from other staffers also increased from 2001 to 2002 for both local television and radio. In local television, threeout of ten news directors (29 percent) said other staff members helped Web content in 2002, up 8 percent from theprevious year. Also, the percentage of staffers helping with the Web tended to increase as the markets got smaller. Radio Web sites are even more likely to be operated through the multitasking of current employees. Radio news directorswere more than twice as likely (64 percent) as their television counterparts to report that other staffers help with the Web.That is a 14 percent increase from 2001.
Public AttitudesPublic AttitudesThe Internet’s attraction as a news medium seems, according to the data, to stem from three characteristics:
Information arrives continuously and can be accessed anytime.
Users are not limited in their choices; they can get news, videos, audio, and other information from anywhere in theworld.
Most of it is free.
These attributes have contributed to more and more Americans making the Web their news medium of choice. InOctober 2003, 20 percent of people indicated that the Web was how they received most of their news on national andinternational issues, according to a survey by the Pew Research Center. This is up from 14 percent in January 2002. 1
At the same time, one of the criticisms of the medium is that the source and accuracy of information may sometimes beharder to discern than in other media. According to these data, people have doubts about the accuracy and reliability ofthe Web in general, but they have high confidence in the sites they visit.
Accuracy
How accurate do people consider the Web?
The answer, it seems, is a matter of a glass half full or half empty.
Perceptions of Internet’s Reliability, OverallSurvey qu.: ’’How much of the information on the Internet do you think is reliable and accurate?’’
Design Your Own ChartSource: 2003 UCLA Internet Report; PEJ ResearchResponses are from people who use the Internet for news at least once in a typical week.
According to the UCLA study, nearly half of online news users (48.5 percent) believe that most of what they find on theWeb is accurate.
Design Your Own ChartSource: 2003 UCLA Internet Report; PEJ ResearchResponses are from people who use the Internet for news at least once in a typical week. Does not add up to 100 dueto rounding.
However, the numbers change when the question turns to sites that respondents visit regularly. Here 81.6 percent ofusers think that the sites they regularly visit are entirely or mostly accurate (13.1 percent entirely, 68.5 percent mostly).And those numbers remained stable whether someone was a heavy, moderate or light news user.
This may be a function of people rationalizing that they would not visit sites that were not reliable. If they go there, theymust be good sites – whether they really were or not. But these numbers could also be a function of people findingthrough trial and error that there really are havens of reliability on the Web and that they have found them. The fact thatold established news brands so dominate the Web would suggest this is the case.
Yet some of the brands that dominate – such as Yahoo or even MSNBC.com – are not old brands. And Web blogging,one of the most exciting aspects of Web journalism, entails much of the risk of the Web. The most likely guess is there issome of both – rationalizing and careful consumption – in these figures.
What is it that people like about the Web for news? The Pew Internet and American Life Project probed this during thewar in Iraq. Twothirds cited the ability to get news from a variety of sources, followed closely by the ability to getbreaking news. In addition, more than 50 percent of respondents valued being able to get different points of view fromthose of traditional news and government sources. 2
abecker
Typewritten Text
abecker
Typewritten Text
abecker
Typewritten Text
Perceptions of Internet’s Reliability, on Favorite Web Sites Survey qu.: ’’How much of the information on the Internet sites you visit regularly do you think is reliable andaccurate?’’
Design Your Own ChartSource: Pew Internet and American Life Project report, ‘’The Internet and the Iraq War,’’ April 1, 2003. Respondentswere surveyed between March 20 and 25, 2003.
Thus, for all that people may gravitate to major traditional news sites, the sense of being able to go to multiple sitesquickly – perhaps comparing what is at MSNBC.com to what is available on CNN.com – is a major factor. So, of course,is speed.
Importance
When asked to rank the importance of the Internet as a source for information from 1 (not important) to 5 (extremelyimportant), more than a third, almost 38 percent, of online news users gave it a 5, indicating how essential the mediumhas come to be seen. Another third gave it a 4 ranking. Less than 1 percent said it was not important at all. Amongheavy Internet news users, the importance was even higher, with 42 percent ranking it as extremely important.
Expectations of Internet, Users vs. NonUsersSurvey qu.: ’’If you need reliable, uptodate news, would you expect to be able to find this online?’’
abecker
Typewritten Text
abecker
Typewritten Text
Why People Go Online For News and Information Survey of Internet users during the start of the Iraq war
abecker
Typewritten Text
abecker
Typewritten Text
abecker
Typewritten Text
abecker
Typewritten Text
Design Your Own Chart Source: Pew Internet and American Life Project¸ “Counting on the Internet¸” December 29¸ 2002
From what we have seen above, attitudes about the Web indicate a growing reliance on the medium as an intrinsicsource of news and information. People are drawn to the ability to get updated news around the clock from a seeminglyendless array of sources. Yet, how much they trust these sources varies. Even if overall there is some doubt about theveracity of what appears online, people tend to gravitate toward sites they come to believe in. As trust in certain sites’accuracy grows, it is likely that the Web will become an even more important source of news.
Footnotes
1. The 26 sites are: ABC News, Advance Internet, AOL News, BBC World Service, CBS News, CNN, Cox Newspapers,Fox News, Gannett, Hearst Newspapers Digital, Internet Broadcasting Systems Inc., Knight Ridder Digital, LA Times,McClatchy Newspapers, MediaNews Group, MSN Slate, MSNBC, Netscape News, NYTimes.com, The Boston Globe,Time Magazine, Tribune Newspapers, USAToday.com, washingtonpost.com, WorldNow, Yahoo! News
2. Advertising Age, “100 Leading Media Companies,” AdAge.com, August 2003. Companies are ranked by their totalmedia revenues collected in the United States in 2002. The list is available at http://www.adage.com/page.cms?pageId=1018.
3. Howard Kurtz, “AOL Version 2004: You’ve Got News,” Washington Post, December 22, 2003, p. c1.
4. Kathy Kiely, “Freewheeling ‘bloggers’ are rewriting rules of journalism Objectivity? Not here — and the masses eat itup,” USA Today, December 30, 2003, p. 1A.
ConclusionConclusionThe evidence suggests that the Internet is clearly in journalism’s future. But it is less clear that it will be its only future.While most Americans are now online, and getting news, as of 2004, the Web appears to complement traditional mediafor most of these people rather than replace it.
The Internet is attracting young people. It offers the potential of a global audience, the potential of new jobs and newtypes of journalists. There will, however, be dislocation.
What is most intriguing is the evidence that television rather than print is suffering most. This is surprising because, atthis point, the Web is still largely a textbased medium. One might have thought that the print media would thus be hurtby the greater convenience that the Web offers, in much the same way that cable seems to have eroded the appeal ofnetwork television. This is not the case.
What this means down the road is harder to figure. The future, say online professionals we have consulted, is an age inwhich the distinctions between media blur. Online, The Washington Post will not be a newspaper company but a text,picture and video news provider. CBS News will not be a broadcaster. It, too, will be a text, audio and video newsorganization. Nor will news just be consumed on computers, television or in print. News will be made to fit computers,PDAs, phones and perhaps more. Before too long, people riding the subway home from work may turn on their phonesand watch a network anchor delivers the news, not because the anchor happens to be on but because he or she is “on,”on demand.
The Internet is a continuous, ondemand medium, like cable, but it is updated only when there is something to update,and users do not have to sit through the stories they don’t care about. As they can in newspapers, online users cansearch out what they want, but they also can access background material and previously published stories. Unlike anyother single medium, they can read the news, watch video, listen to audio, read long transcripts, access originaldocuments, or link to outside sites for more detail. The Internet, in other words, offers the strengths of all media–theimmediacy of cable, the skillful storytelling of network, the depth and deliberation of newspapers, plus more, all in oneplace. That, at least, is the potential.
It likely will depend on the economics to see if that potential is fulfilled. And it may depend on a few large organizationscapturing large portions of that audience for that to happen. Thus there would be two Internets, in a sense. There wouldbe the big media, the handful of places where large audiences assemble, and where huge multiplatform newsorganizations would deliver news on demand worldwide in sophisticated ways, perhaps better than they do now. Andthen there would be the open Internet – the water cooler, bloggers and clamoring citizens, off in their niches, in chatrooms and grass roots organizations, creating movements and confounding the establishment. And the Internet wouldbe home to both. As of 2004, the signs are pointing in that direction.
Network TV – IntroIntroBy the Project for Excellence in Journalism with Andrew Tyndall
Network television news was once the most trusted source of information in America. It also had a monopoly overpictures and television reporting from across the country and around the world.
Neither of these things is true anymore.
Network news in 2004 is an industry trying to find its place in the changed world of 21stcentury journalism. It is also anindustry on the brink of generational change, with the retirement of its most visible symbols, the current nightly networkanchors, beginning with the stepping down of NBC’s Tom Brokaw at NBC later this year.
What place does covering the major events of the day or acting like an important public institution play in a network’sidentity in the age of a hundredplus channels? How important is news at all?
A detailed look at the content of network news reveals that the evening newscasts are still network television’s frontpage, and by traditional standards still home to its most serious journalism. Nearly 30 million people still watch thenightly news, and the programs remain profitable.
But the trend line is ominous. Evening news ratings have dropped 59 per cent since their peak three decades ago. Andthe audience is aging – nearly 60 years old on average, while the average age of Americans is 35. The economics ofevening newscasts is headed in a troubling direction.
The picture for network morning news is quite different. Its audience is stable and even grew in 2003. Morning newsshows, which have half the audience of nightly news programs, also enjoy twice the revenue as their eveningcounterparts, according to available data. Yet the content in the morning is softer. People who get their news frommorning programs know a very different world – one that is less global and more oriented around entertainment,celebrity and true crime – than those who get their news from newspapers or evening news.
What the networks believe they can afford to offer the public also has changed. Available numbers suggest that thenews divisions have fewer correspondents and offair journalists to produce the news than they once did, and fewerbureaus or listening posts here and abroad. Foreign bureaus have been cut by more than half. At the same time, thenewsgathering technology has become more sophisticated, the editing capabilities and satellite reach more vast andinstantaneous.
The net effect, many network journalists say, is the news at all three organizations tends to be focused on the majorstories that have to be covered, leavened with features or sidebars routinely chosen for their appeal to targeteddemographic groups. Privately, network veterans say the unexpected is less common. So is the original. There is morehomogenization. Large portions of the domestic news agenda, such as the environment, science, prisons and the poor,content analyses suggest, are often absent. Other topics of special interest to targeted demographic groups, such ashealthcare, retirement and financial markets, are emphasized.
Overall, more people now say they turn to cable television for major breaking news events than say they turn to networkor local broadcast news. The reason appears to be convenience and availability. We live in an ondemand world. Yet onthose occasions when network television news goes head to head with cable, such as with morning news shows,network still tends to attract more audience.
What does all this suggest about the future of the network news divisions?
The answer probably depends on how the parent companies that own the networks perceive news as adding value totheir franchise. Do they believe that news has an intangible value that transcends the immediate bottom line – that anews department’s reputation for quality and commitment to the public interest enhances a network’s brand, therebystrengthening its entertainment programming, its local affiliates, its other media endeavors? Or do they see newsmostly as commodity, which justifies itself in quarterly and measurable terms in return on investment. Both arejustifiable views. But they lead to different strategic visions and different levels of investment.
The journalists at the networks still address a mass audience that surpasses any other medium. They still possess aninstitutional memory for news delivery that rivals journalists elsewhere. However, the decline of the television networks
as a medium means that these advantages of scale and history are dwindling year after year, although they have notyet been dissipated.
Most likely the future will be determined by the degree to which the news divisions’ owners have the imagination andthe will to create new business models that employ both traditional and emerging technologies, target both old and newaudiences, expand to more channels of transmission and generate new revenue streams. If they do, they can add valueto their conglomerate parents, providing diversified news for their entire media franchise in broadcast, cable, Internetand beyond, just as they did for the standalone networks in the last century. If they do not, they will probably wanderdown the path of contraction they have followed over the past two decades.
Network Content AnalysisContent AnalysisWhat are Americans now getting from network news?
In recent years, five major trends have dominated the broadcast news divisions: shrinking audience, intensifying budgetconstraints, competition from 24hour cable news, the fast growth and then decline of prime time news magazines, andthe increased influence within news divisions of morning programs.
It seems logical to ask what impact they are having on what viewers see. Have the nightly newscasts retreated fromtheir traditional role of resembling, in effect, the frontpage of the daily newspaper, in favor of becoming moreinfotainmentoriented? Have the journalistic styles of the nightly newscasts and the morning programs converged to theextent that the first hour of the morning programs is now an alternative source for the same type of news? Has PBS’s“NewsHour” managed to stake out a separate journalistic terrain in which it not only covers stories differently but alsocovers altogether different stories than the three network news programs?
To get answers, this study conducted a content analysis of all three network evening and morning newscasts, as well asthe “NewsHour” on PBS. The study encompassed a month of weekday newscasts (20 days), selected to include four ofeach weekday (see Methodology), 110 hours of news programming, an examination of nearly 2,000 separate stories. 1Earlier studies have offered some sense of the news agenda of prime time television news magazines.
The quick answers:
Having experimented with tabloid, sensation, lifestyle and celebrity during the mid1990s, nightly network newscastshave become more traditional, some might say serious, in their topic agenda since September 11. It is anoversimplification, however, to suggest they have returned to the news agenda of 15 years ago.
However they have evolved, nightly newscasts remain quite distinct from morning newscasts or cable–more likely tocover the major news of the day and to do so with stories that are carefully written and edited, and more denselysourced than elsewhere on television.
People who get their news from network morning shows, on the other hand, are seeing a world more focused aroundtrue crime, entertainment, lifestyle, and, when they are covered, the human interest angle on government andforeign affairs.
The “NewsHour” resembles morning news in its interviewheavy format as well as the nightly news in its public policycontent. But it has adopted a focus on government and foreign affairs that is even heavier than the front pages ofmost newspapers.
The Three Commercial Nightly Newscasts
The best evidence suggests there is something of a Ucurve to the nightly news agenda over the last 20 years. Lookingat studies from different researchers, there was a steady move after the Cold War toward subjects like entertainment,lifestyle and celebrity crimes, and away from subjects such as international events and public policy debates. That movetoward a lighter agenda began to ease in the late 1990s and the news agenda has become even more serious againafter September 11.
The Project for Excellence in Journalism (PEJ) has tracked the news agenda — the topics of stories — on networknightly news off and on for 26 years. The Tyndall Report, using slightly different methodology, has tracked time devotedto different topics on network news every weeknight for 16 years. The Center for Media and Public Affairs, whosepresident is Robert Lichter, has published tracking of topics by story on network news every night (weekday andweekend) going back to 1990 using a methodology similar to that of the PEJ. All three approaches concur in revealingthis gradual shifting of the news agenda on nightly news. 2
The methodology of the Tyndall Report, whose publisher is Andrew Tyndall, counts specific story themes but notbroader topic categories. The report shows that coverage of U.S. foreign policy has returned to levels found at the endof the Cold War, although coverage of international affairs not related to the U.S. has not. But Tyndall also notes thatthe war in Iraq is a singular event that makes projections into the future uncertain. The PEJ’s more episodicmeasurements of the full topic agenda of nightly newscasts, reinforces Tyndall’s findings about international coverage. It
also finds, though, that the agenda is still less oriented to government and public policy than in the 1970’s and 80’s.Government coverage had declined to just 5% in 2001 and 2002, down from 32% in 1987. In the 2003 study,government topics climbed back to 16% of all stories, though still just half of where it was in 1987.
If coverage of foreign affairs and government were up, what was down? Generally crime and more lifestyle andentertainmentoriented news topics. Stories were half as likely to be about crime in 2003 than they were in 2002 (6percent in 2003 versus 12 percent in 2002.) Entertainment and lifestyle coverage dropped to just 8 percent of stories;these topics had come to make up nearly 20 percent of stories studied in 2001. They declined after September 11 androse back to 19 percent of stories in the first six months of 2002.
Science coverage appears to have declined somewhat over the last two years (to 2 percent of stories).
Almost certainly one reason for the more traditional agenda on nightly news is the foreign policy of the currentadministration. Given the Bush administration’s decision to go to war in Afghanistan and Iraq, the networks have hadlittle choice but to have government, military or foreign policy dominate their story selection, irrespective of cost.
Yet one interesting thing about the 2003 war in Iraq and the Gulf War 12 years ago, Tyndall says, is that the usualpatterns of overseas coverage were not followed. Increased U.S. foreign policy coverage normally has the effect ofincreased international coverage unrelated to U.S. foreign policy as reporters try to put U.S. actions in a global context.That tended to happen during the Cold War, when coverage of the internal affairs of the Soviet Union and EasternEurope increased. It also happened immediately after the September 11 attacks, but it did not continue in 2003.
Tyndall also suggests words like hard and soft news may be misleading in describing the shift. In the 1970s, he remindsus, Walter Cronkite, who was then the CBS anchor, would often close with a fourorfiveminute humaninterest piece byCharles Kuralt “On the Road.” Tyndall suggests that in the 1990s the networks added an array of family and lifestyletopics, covering such things as childrearing, sexuality, reproduction, tobacco, nutrition, obesity, eldercare and earlyeducation. He says that demographic calculations to target more women go into the decisions to cover these topics. Buthe suggests that it is unfair to consider these necessarily less serious issues.
While the domestic agenda has broadened and become a larger part of network news over the years, some topics arenotably absent in the composite month of newscasts studied in 2003. The environment, for instance, made up just 1percent of the stories on nightly news. The same was true of education, transportation and religion. Technology madeup even less. Coverage of the healthcare system in the country made up 3 percent of the stories. By contrast, accidentsand disasters (excluding weather) made up 6 percent of the stories on the nightly news.
Nightly News Topics Over Time Percent of All Stories
Looked at another way, if you watched a commercial nightly newscast every weeknight for a month – some 10 hours ofprogramming – you would have seen: 3
Less than a minute about culture and the arts
Less than a minute on family and parenting
About four minutes on the environment
Less than five minutes about transportation
Slightly less than seven minutes about education
About 14 minutes on healthcare
About 16 minutes of crime
About 22 minutes on accidents and disasters
About 74 minutes on government matters
About 97 minutes on foreign affairs
How does this news agenda compare to Page A1 of America’s newspapers?
The three network nightly newscasts remain the closest thing one can find to it on commercial television. Whilenewspaper front pages are slightly more oriented to government and slightly less oriented to foreign affairs and the war,in the main they are quite similar. Neither focused heavily on crime, and both avoided celebrity and lifestyle coverage.
Topics in the News: Newspapers vs. Nightly News, 2003 Percent of All Stories
The commercial nightly news was more likely to focus on alwaysgraphic disasters (10 percent versus 4 percent ofnewspaper front pages). They were also twice as likely to carry business stories, though a portion of that is the nightlyrecitation of the advance or decline of the Dow Jones Industrial Average, and newspapers normally have a separatesection devoted exclusively to business.
The “NewsHour” on the noncommercial PBS is closer to newspaper front pages in its orientation toward government.And, it focused more on foreign affairs than either newspaper front pages or commercial nightly news. Fully 63 percentof “NewsHour” stories studied were government and foreign affairs. The program, in turn, carried less other kinds ofdomestic news, including crime.
Morning News vs. Evening News Agenda
If nightly news is still the place where viewers can get the most comprehensive sense of the day’s events, morning newsprograms have become clearly more important to network news divisions (see Audience and Economics). They haveheld onto more of their audience and become more important economically to network fortunes.
What are Americans getting in the morning, and how does it compare to evening news? Here we can compare hownightly and morning news allocate their total time for news (rather than just story counts).
The morning news format is suited to flexibility. The programs will transform themselves into covering major breakingnews in times of crisis. They revert back to a softer mix in more normal times. Recent times have seen a series ofcrises.
Yet even during major events, network morning programs offer a markedly different and softer news agenda than nightlynews. The two types of newscasts, in other words, are hardly substitutes for each other. And that is not just a matter ofapproach, where the morning programs emphasize live interviews by the anchors and the evening programs featureedited pieces taped by correspondents.
Compared with the total time on nightly newscasts, the morning news programs:
Are much more focused on crime (19 percent vs. 5 percent)
Spend much less time on affairs of government (8 percent vs. 17 percent)
Spend half as much time on foreign events (13 percent vs. 26 percent)
Spend vastly more time on celebrities (14 percent vs. 2 percent)
Spend twice as much time on lifestyle news (15 percent vs. 7 percent)
And these differences are just looking at the first hour of morning news – the more hardnewsoriented hour. If thesecond hour (and the third in the case of the “Today” show on NBC) had been sampled as well, the differences wouldhave almost certainly been even more pronounced.
Given that morning news ratings are stable or rising, while evening is shrinking, this has significant implications. Thosewho get their television news in the morning are learning about a different agenda of what matters and are far morelikely to talk about the trial in the murder of Laci Peterson, Michael Jackson’s childmolestation case or Tom Cruise’smovie, even in the supposedly hardnews hour of the morning, than those who get their news in the evening. When theydiscuss the war in Iraq around the water cooler, it is personalized as human interest in Jessica Lynch rather than issuessuch as compliance with Security Council resolutions. It is a world where the economy is covered as household financetips; where science is covered as innovations in personal health or consumer electronics; and where environmentalstories such as global warming are covered as the latest weather disaster.
On the other hand, it might be a mistake to imagine that these programs gained in ratings in 2003 because of a lighternews agenda. Indeed, some evidence suggests the morning news programs have moved more in the direction oftraditional news about government and foreign affairs lately, thanks, perhaps, to several major events.
Research by the Tyndall Report finds that the 2000 Florida recount represented one such moment. Viewers waking upwanted to know who the next President was, and ratings rose. Eight months later, however, a study of one month ofmorning show content by the Project for Excellence in Journalism in 2001 saw little in the way of substantive coverage
of major news events. That changed after September 11, when coverage became more serious again. Yet that, too, didnot last. A PEJ study of the first six months of 2002 found a return to softer topics, though not as far back as in thesummer of 2001.
In 2003, the content analysis finds, the war in Iraq represented another spike in coverage of major events in themorning television news and a move toward a more serious agenda.
In June 2001, for instance, only 4 percent of morning stories pertained to government, defense or foreign affairs. In thefirst half of 2002, that had risen to 14 percent of stories. In 2003, that had doubled again to 29 percent.
Morning News Topics Over Time Percent of All Stories
While celebrity and lifestyle make up a large percentage of morning news, that percentage is apparently down, from 70percent of all stories in June 2001 and 58 percent in 2002 to 25 percent in 2003.
Still, to the extent that morning news is becoming the key newscast in any news division, this has significantimplications in terms of the values of the news division, the expertise of its reporters and producers, and the knowledgeand brand that it provides to the American public. Their prominence and popularity represent a change in the mission ofthe network news divisions to an emphasis of less serious policyoriented fare. The fact that these divisions’ resources,promotional efforts, star anchors and profits are focused more than they were 15 years ago on the morning programs,and less on their evening newscasts, demonstrates a shift in the center of gravity of their news values.
The Lehrer News Menu
If the nightly news has become somewhat less important, and the morning programs more important, to what extenthas that created a larger niche for public broadcasting’s “NewsHour” with Jim Lehrer? The Lehrer show by reputationcertainly would be positioned as the most traditional, the most hardnews oriented, the most likely to report in depth onissues that others in television might shun. Is that borne out in the content analysis? Does the “NewsHour” cover adifferent agenda of topics?
The content study suggests that in some ways, Lehrer is indeed staking out a distinct journalistic terrain for itself,perhaps one carefully tailored to a PBS audience. With an hourlong newscast and feature interviews, it takes on moreof the format of the morning shows. At the same time, though, its news agenda is more in line with the evening news:a commitment to foreign policy and government, and a disdain for entertainment, celebrity and pop culture – only moreso. The “NewsHour” spends even less time than evening news on crime, accidents and disasters.
The program’s coverage of government and domestic issues, however, may be influenced by other considerations aswell. For one, focusing on interviews with government newsmakers is an inexpensive way to do news, particularly for abroadcast based in Washington.
Beyond the question of topics, there are a host of other differences in the content of evening, morning andnoncommercial news.
News Content Versus Ads and Teases
These differences begin with how much news content one gets inside each of these programs. For 30 minutes ofprogramming, we examined the average number of news minutes versus advertisements and promotionalannouncements.
The nightly newscasts used to be described as 22 minutes of news in a 30minute program. 4 That is no longer thecase. In the month of programs studied, the amount of news on the three commercial nightly newscasts, after teases,promotional announcements and commercials were removed, was closer to 18 minutes 48 seconds. This varied,somewhat noticeably, by network. NBC’s “Nightly News” had significantly more news content (an average of 19 minutes45 seconds) than either ABC’s “World News Tonight” (18 minutes 30 seconds) or CBS’s “Evening News” (18 minutes 56seconds).
The evening network news nevertheless had more content time than the morning news programs. In the mornings, only15 minutes 6 seconds of every halfhour is content (based on the first hour of programming), once the commercials,promotional announcements and teases, and local news inserts are removed.
NBC’s news program again came out on top. In the New York market, where our sample of morning shows wasvideotaped, the local NBC station averaged 16 minutes 21 seconds per halfhour. The CBS station was second with 14minutes 54 seconds and ABC was third with 14 minutes 6 seconds.
While local news inserts were not analyzed in this study, they are certainly an important part of the content for morningnews shows. According to research by Andrew Tyndall, in the second quarter of 2003 the local New York stationsaveraged the following amount of time for local news: WABC averaged 6 minutes in the first hour, WCBS 5 averagedminutes 42 seconds, and WNBC averaged 3 minutes 6 seconds.
The “NewsHour” is “commercialfree,” of course, although it still contains teases of what is to come on the program andfunding credits and the beginning and end of the program. Still, once those are taken out, there is a good deal morenews packed in. In 30 minutes of the “NewsHour,” 26 minutes were news content, more than 7 minutes more than onthe commercial networks’ nightly news and 11 minutes more than on the network morning programs.
Nightly News Beyond Topic
Beyond time, what is the structure of the three commercial nightly newscasts in 2004?
They remain the showcase for the work of correspondents, their editors and producers. That is because these programsare made up largely of taped, edited packages. By comparison, the “NewsHour” and the morning programs, with theiremphasis on extended interviews, are an anchor’s medium.
Almost the entire news hole on the three commercial nightly newscasts is devoted to edited packages (84 percent of thetime on these programs versus the “NewsHour’s” 31 percent and the morning programs’ 36 percent). 5
The three networks average 6.8 such packages each evening, at an average length of 138 seconds, including theanchor’s introduction.
Story Origination on Evening NewsPercent of All Time
This reliance on taped packages and correspondents has consequences beyond style. The time involved in writing,editing and checking a story translates into more time to verify facts and more sources than can be found in other storyforms, including live interviews. The power to check and to edit is important.
This is quantifiable in the sourcing measurements.
Unlike the live standups, which are the staple format for cable news correspondents, these taped packages are morecomprehensively sourced, with named and identified institutions and individuals, often in the form of direct quotations,soundbites from people whose inflection, mood, tone and sincerity viewers can assess directly.
To isolate this, the study examined how many sources a story cited, and whether those sources were named and theirlevel of expertise and potential biases were described so that audiences could determine more for themselves how toevaluate the information.
The less transparency there was, the more audiences would have to accept the word of the news program that thesesources were believable. At the bottom of the sourcing scale would be a story based on a lone anonymous source. Atthe top would be a story with at least four named and fully described sources.
Overall, the three commercial nightly newscasts had higher levels of sourcing on average than did other kinds of newsprograms. Nearly half of all stories (48 percent) had two or more fully named and described sources, and 18 percentcited four or more of these sources.
What about anonymous sourcing? Overall, less than a third (29%) of nightly news stories contained anonymous sources.Usually the networks made some attempt to describe these anonymous sources so that viewers could have some basisto judge their credibility. Only 14 percent of the stories had at least one anonymous source without any explanation ofwhy the source was credible, such as “CBS has learned” or “sources tell ABC.”
Story Length
For all that people complain about brevity on television news, network nightly newscasts tended to rely either on fairlylong stories by modern standards or very short ones.
About half of all stories on the three commercial nightly newscasts, 52 percent, were more than 90 seconds while 42percent were less than 40 seconds. Very few stories, just 6 percent, fell anywhere in between (41 seconds to 90seconds), the type of truncated package that is a staple of some local television newscasts. The biggest differencebetween the commercial network news and the “NewsHour” was that the “NewsHour,” following the format of themorning news, tended to do more very long stories. A third, 33 percent, of its stories were longer than three minutes.The bulk of these long stories, however, were interviews or panel discussion, which often provide indepth discussionswith a limited range of people. The downside is that these often replace edited packages, which are more denselysourced and written and are less vulnerable to an interview subject’s filibustering.
Some in network news say that modern television news stories are probably more densely packed with information thanwere stories of similar lengths in earlier years. The new technology – satellites, video feeds, computergeneratedgraphics and more sophisticated editing equipment – allows producers and editors to more easily add more informationfrom more sources. The technology also allows journalists to include more, pithier and shorter soundbites in storiesrather than longer but perhaps longwinded ones. Modern audiences are also presumed to process information morequickly. In the period of film in television news, in the mid1970s and earlier, there was less content available and whatwas available was more difficult to pack into pieces. As a result, television professionals argue, stories sometimes grewto fill the space.
Bush as Protagonist
For years critics also have argued that television has personalized news, causing journalists to build their stories morearound people or institutions, and less around events. This was supposedly especially true of coverage of thepresidency. The White House became a backdrop for the president. But even elsewhere, government stories becamefocused around a single personality, perhaps the mayor in a town, taking on the special interests. Politics became morepersonal. Television was a characterdriven medium.
Does the 2003 content bear this out? To a large degree, no. In all, only 23 percent of evening news stories focused atleast half of their content around a single personality, even less than newspapers (32 percent and 28% on newspaperfront pages).
abecker
Typewritten Text
abecker
Typewritten Text
Sourcing on Nightly News
Morning Shows
If the nightly news is still built around correspondents and taped, edited packages, morning news is not.
Instead, the majority of time on morning news is spent in live interviews (55 percent), usually conducted by anchors.Only about a third of the time on morning news is taped, edited packages (36 percent).
Reading of the news by people on these programs accounts for 5 percent of the time (but 31 percent of the stories),usually in the news summary at the top of the hour, read not by the main anchor but a separate “news” anchor orreader.
Story and Segment Length
Time is also spent differently in the mornings than on evening news. The shows produce fewer very short stories, 40seconds or less, (29 percent versus 42 percent on commercial evening news). They also air fewer stories between 90seconds and three minutes (30 percent versus 48 percent on commercial evening). Instead morning news relies more onlong segments, over three minutes. Nearly a third of morning segments go that long, (31 percent versus 4 percent atnight). This may be part of the morning news’ appeal. But these are usually interviews, not stories. And that hasconsequences.
Sourcing
Since morning news relies so heavily on interviews as the storytelling medium, audiences are getting their informationfrom fewer sources, usually just one or two people being interviewed by the anchor. The ability to doublecheck whatthese people are saying against the facts, or balance that with not only opposing views but also with independent orneutral experts, is more limited. It is by no means impossible, but it is more difficult, and, we found, not often done.
Only 8 percent of stories or segments on morning news had the highest level of sourcing and transparency – fournamed sources whose expertise and potential biases were explained so that audiences could judge their credibility.(That compares to 18 percent on commercial nightly news).
Format alone is not the whole explanation, though it is a significant part. The “NewsHour,” with a similar format, wasmore likely to have the highest level of sourcing (13 percent of stories, compared to 8 percent for morning).
What about anonymous sourcing? In all, 27 percent of morning stories included at least one anonymous source withsome attempt to describe for audiences why the source was credible. This was about the same as nightly network news.And 7 percent of stories included at least one blind anonymous source, about half that of nightly news.
Protagonists
Morning news also stood out for focusing its segments and stories more around people as central protagonists. Nearlyhalf (48 percent) of all stories or interviews primarily concerned how something affected a central protagonist in theaction: How do you feel about your son coming home from Iraq? Or how will this affect the president? Or did KobeBryant rape that woman? That was a good deal more than commercial nightly news (23 percent) or newspapers (32percent) and markedly more than on the “NewsHour”(20 percent).
Prime Time News Magazines
This year’s study did not include a separate content analysis of prime time news magazines. But two previous studies ofthose programs, in 1997 and 1999, showed a clear pattern. With the exception of “60 Minutes,” the magazines in noway could be said to cover major news of the day. 6 Instead, these programs, up against prime time entertainmentshows, specialize in lifestyle and behavior stories, consumer newsyoucanuse pieces and celebrity entertainment. Inthe 1997 study, 55 percent of their stories concerned these issues. In addition, 23 percent concerned crime.
Only 8 percent of stories concerned the combined areas of education, economics, foreign affairs, the military, nationalsecurity, politics, government or social welfare issues. A similar audit of the magazine programs two years later by thejournalist Marc Gunther published in Nieman Reports found similar results.
The CBS “60 Minutes” program stands out as an exception, more likely to touch on issues or topics that involved majorevents of the day. At the midway point in the 2003 – 2004 season, the program aired 12 foreign segments out of 50,about 22 percent, according to an audit compiled for a yettobepublished paper by Elizabeth Weinreb, Director ofSpecial Projects at Columbia University Graduate School of Journalism and a former journalist at “60 Minutes.” 7 That
abecker
Typewritten Text
abecker
Typewritten Text
percentage is about what the show averages in a regular season, according to “60 Minutes” staff calculations. The otherexception is “Nightline,” the ABC news program that differs from the magazines not only in content but also in time slotand in format. It remains probably the most serious and distinctive news magazine program on television.
Why have the magazines other than “60 Minutes” and “Nightline” moved so far away from major news events? It wasn’talways this way. Over the past 20 years, the main mission of prime time news magazines has changed. When “60Minutes” began in 1968, it was largely seen by CBS as a way to fulfill Federal Communications Commissionrequirements for public affairs broadcasting. While the network would have liked the show to make money, the otherneeds it helped meet sustained the show through seven years of poor ratings when it aired irregularly in the Tuesdaynight 10 pm time slot. It was not until 1975, when CBS moved the show to the dead hour between 7 and 8 p.m. onSunday that it became noticed. By 1978 it was among the top 10 rated programs on the air and it has been a bigsuccess and moneymaker for CBS ever since. 8
Seeing that news magazines could be moneymakers – and, more important, moneymakers that could be producedrelatively cheaply compared with most entertainment programs – the networks went on a news magazine binge in the1980s and particularly the 1990s. But as revenues and ratings became the new bottomline, that brought changes inhow segments were put together and how they were selected. These programs were competing with entertainmentshows and that affected content.
Topics that scored viewers on one program began appearing on different shows within weeks or even days of eachother. Tom Yellin, the executive producer of “Peter Jennings Reporting” on ABC summed up the problem this way:“Deciding you want to do a story because you think it’s interesting is a risk. If it doesn’t work you will be called toaccount.” 9
To determine a segment’s success, according to Weinreb, many executives turn to research, including minutebyminuteratings, to determine what kinds of stories hold viewers. And some networks tested story concepts to determine whethersegments were winning the “right” (i.e., young) viewers.
The result is that most programs are largely not the home of heavy investigative pieces anymore. And the longtermtrend here may be troubling for news professionals when one looks at what is drawing desirable demographics.President Bush’s first interview about the war in Iraq after the capture of Saddam Hussein on ABC did not win theratings battle for younger viewers. More were tuned into Paris Hilton’s turn on Fox’s reality program “The Simple Life.”
See end of report for content analysis methodology.
abecker
Typewritten Text
abecker
Typewritten Text
abecker
Typewritten Text
abecker
Typewritten Text
8. Elizabeth Weinreb, “The News About News Magazines.”
9. Interview with Tom Yellin, February 2004.
Footnotes
1. The full programs were studied for the network evening news programs and the PBS “NewsHour.” The first hour ofthe network morning news programs was studied. The 110 hours of programming encompassed more than 66 hours ofeditorial matter.
2. Lichter’s research, for instance, finds that international coverage dropped from half the stories on nightly news in theearly 1990s to as little as 20 percent of the stories in 1997. Environmental coverage dropped by 65 percent from 1990to 1999. Entertainment coverage was up 28 percent from 1990 to 1999. Crime news was up 37.5 percent from 1990 to1995, and, after declining at the end of the decade, again was still 45 percent higher in 2000 than a decade earlier.
3. These breakdowns were calculated by taking the total number of seconds devoted to each topic overall, dividing by60 (seconds), and then dividing by 3 (thee commercial networks). This results in an average number of minutes on acommercial network over the course of 28 days.
4. Before 1963, network evening newscasts were 15 minutes long, not 30.
5. This difference also holds up if one looks at the percent of all stories as opposed to all time. More than half, 52percent of all commercial network stories are edited packages, compared with 17% of stories on the “NewsHour.”
6. See “Changing Definitions of News,” Project for Excellence in Journalism, March 6, 1998; and Marc Gunther, “TheTransformation of Network News,” Nieman Reports, Summer 1999, p. 26.
7. Elizabeth Weinreb, “The News About News Magazines.”
abecker
Typewritten Text
Network TV AudienceAudienceWhen it comes to audiences of network news, the headlines are generally grim. Only one or two programs are increasingtheir audiences. For most, flat ratings are a victory. The networks are showing no real signs of innovation or of creatinggenuinely new kinds of news programming that might win new audiences. The lone exception is morning television news,which saw an upturn in 2003.
Some points:
The three nightly newscasts have seen ratings decline by 34 percent in the past decade, nearly 44 percent since 1980,and 59 percent from their peak in 1969. 1
The war offered the nightly news little bump in viewership in contrast with past major news events. 2
Morning news is the one relative bright spots for the networks, with audiences holding steady rather than decliningover the past 10 years. It had an increase in audience size in 2003 and in 2000 as well. 3
The best evidence suggests it is availability, rather than content, that is hurting evening news, but there seems littleopportunity to change that.
The Nightly Newscasts
The problems confronting the network news divisions are most acute, and for fans of traditional news, most alarming, inthe falling fortunes of nightly news.
Television audiences are counted numerous ways. The most familiar is ratings, which count the number of all televisionsets in the United States tuned to a given program. Share is the percentage of just those sets in use at a given timetuned in to a program. Viewership is ratings converted into the number of people actually estimated to be watching,taking account of the fact that often more than one person is watching a given set.
In November 1980, the year CNN was launched, 75 percent of television sets in use were tuned to one of the threenightly network newscasts each night during the dinner hour. In 2003, it was a 40 percent share.
Of all television homes, 20.6 percent were tuned to the nightly news in November 2003, a drop of 44 percent from 1980,when the networks’ nightly news broadcasts had a combined 37 rating.
Yet, much of this decline did not come with the advent of cable, between 1980 and 1990. The drop in audience has beeneven steeper in the last 10 years, as the number of cable outlets has proliferated, than in the previous 13 years. 4 Adecade ago (November 1993), 40.7 million Americans watched the nightly newscasts. By November 2003, that numberwas 29.3 million, a decline of 28 percent in 10 years. 5
Design Your Own ChartSource: Nielsen Media Research unpublished data, www.nielsenmedia.com
The decline from the historic peak of nightly news audience is even steeper. In 1969, when viewing choices wereadmittedly limited, the three network newscasts were watched in 50 percent of all American homes and 85 percent of thehomes tuned to television at the time that the newscasts were shown. 6 Since then, ratings have fallen by 59 percent.Share has fallen 53 percent.
Evening News Ratings
November 1993 to November 2003
Design Your Own ChartSource: Nielsen Media Research unpublished data, www.nielsenmedia.com
abecker
Typewritten Text
abecker
Typewritten Text
Evening News Viewership, All Networks November 1993 to November 2003
Design Your Own ChartSource: Nielsen Media Research unpublished data, www.nielsenmedia.com What is driving the flight away from nightly news? How much is it a loss of viewers to cable, or a migration of people tothe Internet? Is there a decline in interest in news generally? Do people dislike the changing content of the newscasts?Or how much is the increasingly disadvantageous time slot of nightly news to blame or the shift to more twoincomefamilies and longer commutes?
Certainly some of the falloff seems an inevitable result of technology creating more alternatives. In the 1970s manyviewers had only three or four choices on their broadcast television dial. Cable arrived in 1980, expanding the range oftelevision choices to 20, then 30, then 40, or in the case of some cable or satellite systems, 200 or 300 channels. Thenumber of broadcast stations also grew, with the development of UHF stations, and the Fox network (see Cable TVAudience).
Research also suggests that the Internet, including Web sites associated with the networks themselves, has drawnaudience more from television than other media, but the extent of that is difficult to assess. A 2000 survey from the PewResearch Center for the People and the Press found that those who regularly went online reported watching less networktelevision news than two years earlier. 7 Fewer watched television news overall, and those who did watched less of it.Meanwhile, viewing among those who did not go online was unchanged. It is unclear, however, to what extent this trendhas continued in the last three years.
Local television news, too, now has access to many of the same pictures and stories that were once the exclusive domainof the networks; in recent years local television news viewership has also declined somewhat (see Local News Audience).In 1980, the three commercial networks monopolized national and international news, releasing their footage on thesestories only after they had been broadcast on the networks, and even then only in limited amounts. CNN changed that byoffering to share its footage with local stations in exchange for their material. In response, the networks began to increasefeeds to affiliates. In the process, they inevitably hurt their own newscasts, making them stand out less.
Tastes also have changed. More people brought up on infotainment may prefer lighter fare and may get more of itelsewhere. The branding that comes with specialization (“CNN, the Most Trusted Name in News” or “Fox News, WeReport, You Decide”) may also be luring viewers away. In an age of such niche fragmentation, a single onesizefitsallnewscast may not appeal to as broad an audience.
Nightly newscasts are also hurt by their fixed time slots compared with the ubiquity and convenience of cable. In the1970s, the nightly news was generally on later than it is now in most markets – 7 p.m. – and many more Americans werehome, in singleincome families, and the working fathers had notably shorter commutes. Today, the evening newscastsare often on much earlier, as early as 5 or 5:30 p.m. in some West Coast markets. On the West Coast, the evening newsprograms have the added problem of being tapedelayed. Viewers know the news they are watching is three hours old.Cable and local news has the advantage of being more up to date.
Add to that the fact that the socalled dinner hour simply offers less of an audience than it once did. Fewer people arehome, particularly working people, as commuting times have lengthened, 8 and many parents are seeing their children forthe first time since the early morning. The evening news time slot is probably the most disadvantageous on television.
Changes in the content of network evening newscasts may also be a factor. As the evening newscasts have lost viewers,they have cut back on their newsgathering. This has led to a decline in the number of bureaus and beats, and a shrinkagein the number of minutes of news produced in each program (see Newsroom Investment). The evening newscasts havealso tried changing their tone, particularly in the mid1990s, doing more lifestyle coverage and less traditional news aboutnational and international affairs (see Content).
The changes in content and the shift toward seeing news divisions as profit centers have had other implications. Thenews divisions see themselves as having a different responsibility and persona in American life than they once did. Thenetworks once felt obliged to do authoritative documentaries on major issues of the day – “NBC White Papers” or “CBSReports,” for instance – which burnished the networks’ image as serious public institutions. Today, the networkdocumentary has been replaced in prime time by the news magazine program, shows that are much closer to a form ofnonfiction reality entertainment than an exercise in social responsibility.
To some extent, all these changes – the new character of existing programs, the growing importance of the morningshows compared to the evening newscasts, the elimination of public obligation programs and their substitutions withinfotainment news programming – contribute to the public’s no longer seeing network news divisions as authorities to turnto each day, or even on special occasions, for information and insight.
Most likely, all these factors are at play, interacting with each other.
One element here, the impact of time slot, is sometimes overlooked and deserves more comment. While the nightlynewscasts are on a downward path in terms of viewers, what may be even more remarkable, given the increasingdisadvantages of the time slot, is how many people still watch. Nearly 30 million viewers each night make the networknews programs the three mostwatched and influential news outlets in America, even if they have become something of afamiliar punching bag for television writers and perhaps even a subject of doubt for their owners. 9
Twice as many people watch these programs as are watching the morning shows at any given time. More than threetimes as many people watch each of these programs as read any of the nation’s biggest newspapers.
Yet these viewers tend to be older and thereby not so attractive to television advertisers, which are highly concerned withattracting young audiences. Money, rather than solely demand, has relegated what some might argue is the best ofnetwork news to a subordinate position and has made the problems of the evening newscasts something it is not clearthe networks are willing fundamentally to address. Many in network news privately worry about how long the networkswant to produce signature evening newscasts at all. 10
One comparison that seems relevant to understanding this is network versus local viewership. For many years of networknews decline, local news programming seemed to hold its audience, in part, as indicated above, because satellitetechnology had led to their offering national and international news before the networks did. But today local news is alsono longer holding its audience.
Since the late 1990s, local news and the networks appear to be losing audience at roughly the same rate. Nielsen datagathered by the financial research firm BIA show that, on average, early evening local news programs, which usually arebroadcast right before or right after the network evening news, have suffered a combined market share decline from a 50share in 1997 to 41 in 2003. 11 (See Local TV Audience.) This tracks almost exactly with the decline in network eveningnews share, which has gone from a 49 share in 1997 to 40 in 2003. In any kind of television programming, news orentertainment, the size of the audience of the leadin program is a dominant factor in determining the size of theaudience of the program that follows.
But network news has not suffered as much audience loss as other network programming. Between 1993 and 2001, forinstance, according to the Cable Television Advertising Bureau, the three networks saw their share of prime timeaudience drop by 42 percent. Nightly news during that time dropped 23 percent. 12
The Race Among the Networks
Which of the three networks is on top in the evening news?
This was once a vital question. In the late 1980s and 1990s, the evening newscasts contributed big profits to thenetworks. For even longer, being No. 1 in nightly news was a key to a network’s brand, adding prestige. It gave the newsdivisions not only bragging rights, but better access to newsmakers as well.
For much of that time, the history of network news was characterized by several distinct eras. In the early 1960s, the“HuntleyBrinkley Report” on NBC dominated. In the late 1960s and 1970s, Walter Cronkite on CBS was No. 1, and thatnewscast continued to lead for some time in the 1980s when Dan Rather took over. NBC News was emerging as No. 1until General Electric took over the network in the mid1980s and made moves that caused the network to temporarilystumble. In the late 1980s and early 1990s, Peter Jennings’ ABC “World News Tonight” dominated. And in the late1990s, a resurgent NBC saw Tom Brokaw on top, although this owed more to the other networks losing viewers thanNBC gaining. 13
Evening News Viewership
November 1993 to November 2003
Design Your Own ChartSource: Nielsen Media Research unpublished data, www.nielsenmedia.com
Throughout 2003, NBC had a narrow edge in ratings, followed closely by ABC, then, farther back, by CBS. 14
To understand the race, consider the fortunes of each network over the last decade. Using numbers from the criticalNovember sweeps month, the CBS “Evening News” with Dan Rather has seen the biggest decline. Its viewership hasfallen 37 percent in the last decade (from 13.1 million viewers in 1993 to 8.3 million in 2003), and even more since 1980.“World News Tonight’s” viewership on ABC has fallen 29 percent (from 14.3 million viewers in 1993 to 10.1 million in2003). NBC’s “Nightly News” has fallen the least, but still a substantial 18 percent (from 13.3 million viewers in 1993 to10.9 million in 2003), according to Nielsen data. These Nielsen numbers actually show a near 2 percentagepoint gain forNBC in the last year. 15 NBC’s “Nightly News” took over the No. 1 spot in 1997, and has remained there most weekssince.
Why has NBC fared better generally over the last seven years? A detailed analysis of one program over another is not thefocus of this report. But some mention of possible factors can show how complicated the mix of variables can be. NBChas the advantage of having a cable network and one of the biggest news sites online with MSNBC.com, which waslaunched in 1996. Strategically, each of the brands was supposed to reinforce each other. Loyalists to MSNBC.comwould naturally turn to its siblings when they wanted broadcast (NBC) or cable (MSNBC) or even financial news (CNBC).NBC has almost one minute more of news content above the three networks’ average, which, given channel switchingduring commercials, is probably also significant. In addition, the popularity of the “Today Show” in the morning may beanother factor, building loyalty to NBC News as a brand, which spills over into viewers watching the network’s nightlynews as well. According to at least one survey by TV Guide, Tom Brokaw is the most trusted anchor on television, eithernetwork or cable, although it is not known whether this is a result of Brokaw’s audience size or the cause of it. 16 Another
important factor was that during much of this period, NBC had the most successful prime time lineup of the threenetworks.
It must be stressed, however, that NBC took the No. 1 spot more because of ABC losses than NBC gains. In 1994, whenNBC was third in the ratings, it had 11 percent more viewers than it does today, when it is No. 1.
The Age Factor
The ratings trends for nightly newscasts are a problem by themselves, but the age issue makes the longterm prospectseven more complicated. Not only are their audiences shrinking, but they are also getting older. The commercials on anetwork evening newscast tell something about the audience. They are often a string of pharmaceutical ads aimed atolder Americans.
The median age of network evening news viewers in 2003 (from 59.5 for ABC to 61.2 for CBS) 17 is around 10 yearsolder than network programming as a whole (which was 45.7 to 52.2 in 2002). For the American population as a whole,the median age is 35.3. 18 This makes the nightly news a less attractive sell to advertisers, preoccupied with youth (seeEconomics) and thus less lucrative for the networks. According to network officials, the ad rates networks can charge forolder audiences are substantially less, perhaps even a third lower, than those charged for the youngest demographics. 19In terms of longterm strategy, moreover, what happens in 10 years when a significant portion of the network newsaudience has died?
The Networks in 2003: War No Cure for the Problems
Traditionally in times of national crisis, like the war in Iraq, viewers have turned to the networks for coverage, if not thefirst night, then within a day or two.
That did not happen in 2003 with the war in Iraq, and some television writers called this an important change, anothersignal of decline for the network news and the evening newscasts in particular. 20
The total number of viewers tuned to nightly news actually dropped during the war. After rising just slightly the first weekof the war, to 32.2 million viewers, nightly news viewership fell as the war continued. The number of viewers on the threenightly newscasts dropped by 2.7 million the second week of the war and 1.6 million more the third week as Americansoldiers got to Baghdad. 21 On cable, by contrast, ratings more than doubled during the war (see Cable), though thataudience has vanished since. 22
Does this spell an even more dire future for nightly news, as some journalists have predicted?
Not necessarily.
A closer look at the Iraqi war ratings suggests two other lessons.
In a headtohead moment, when cable news and network news are both in continuous live coverage, Americans stillprefer the old broadcast networks.
On the first night of the war, from 9:30 to 11 p.m., 42.2 million people turned to the three networks and their nightlyanchors, according to estimates made by Nielsen. Less than half as many (19.2 million viewers) tuned to the three cablenetworks, and 7.7 million more turned to Fox News on broadcast. Combining Fox broadcast and Fox cable would putRupert Murdoch’s two channels in second place among the networks (at 15.6 million), well behind the combined NBC andMSNBC (at 22.2 million). But that would be ahead of CBS (at 13 million) and ABC (at 11 million), neither of which has anews cable sibling. 23
Design Your Own ChartSource: Jesse Hamlin, “NBC declares victory in war’s TV ratings battle,” San Francisco Chronicle, quoting NielsenMedia Research data.
A further look at the ratings also suggests that people turn to network for some things and cable for others. During timesof intense crisis, the continuous 24hour coverage of cable may be appealing. Indeed, the networks converted tocontinuous coverage during the first two days of war and saw viewership spike, then went back to regular programmingand saw viewership fall. The contrasting formats we found in the content of evening newscasts versus cable are alsoinstructive. Evening news specializes in taped packages, cable in live standups. The Pentagon’s embedded reporterprogram tended to showcase cable skills (felicity with extemporaneous firstperson monologue) and made traditionalnewsgathering (interviewing, factchecking, getting all sides of the story, editing) logistically impossible.
But during other times, when events are moving more slowly, people may still look to the somewhat more reflectivecoverage offered by the onceaday evening newscasts. The runup to war may be a case in point. Nightly newsviewership actually rose in the weeks leading up to the war. The highest ratings in 2003 occurred in mid and lateFebruary, when 32.7 million viewers tuned in to the three evening newscasts, according to Nielsen Media Research. TheTyndall Report said that these two weeks were dominated by coverage of Hans Blix’s preliminary report on Iraq’sweapons programs and the United Nations debate on a resolution in support of using military action against SaddamHussein. 24
NBC Fares Best, Wins the War
The network that drew the most viewers during the war was NBC. In the first week of the war, NBC’s “Nightly News”recorded its single highest number of viewers for the entire year (13.2 million viewers). While NBC’s “Nightly News” pickedup a point in share during the week, ABC and CBS lost a point each, though the bump in viewers at NBC was shortlived. One interpretation of these share figures is that NBC’s gain was at the expense of ABC and CBS. 25 Yet anotherinterpretation is that during major news events, marginal news viewers tune in to the network nightly newscasts, and doso disproportionately to the time slot leader (in this case NBC). At the same time, some hardcore evening news viewers,news junkies, defect to 24hour cable. Thus ABC and CBS might have lost more viewers to cable than they gained innew viewers, while NBC gained more than it lost to cable. This is, however, only a theory.
Morning News
After a night of bad news, network executives are probably quick to tell themselves things will look better in the morning.
And they do. Morning show viewership, in contrast with evening, has held steady and in some cases has actually risenslightly in recent years.
As of November 2003, 14.6 million Americans watched the three network morning news shows, one million more than adecade earlier.
abecker
Typewritten Text
Breaking News Viewership, First Night of Iraq War Viewership between 9:30 pm and 11:00 pm on the night of March 19th, 2003.
The rise has not been steady. For instance, looking again at the critical November sweeps numbers, ratings rose in 2000,during the Florida election fiasco (14.5 million Americans watched the morning shows). Yet a year later, as the U.S.moved into Afghanistan after September 11, the number of people watching the morning shows was actually smaller(13.8 million). The number drifted upward again in November 2003. 26
Morning News Viewership, All Networks
November 1993 to November 2003
Design Your Own ChartSource: Nielsen Media Research unpublished data, www.nielsenmedia.com
Why have morning shows proved more stable than evening? Again several factors likely converge here.
Clearly the question of time slot is significant. The morning shows are on, or at least begin, when most Americans arestill home, just starting their days. The number of people home in the evenings is shrinking.
The researcher Andrew Tyndall also theorizes that on the two top morning shows – the “Today” show on NBC and “GoodMorning America on ABC – a factor in their appeal is that they offer 20 minutes of content without commercialinterruption. People wanting news and information, or even diversion, in the morning and getting ready for work will leavewhen the commercials start. In an age of growing commercial time, this stands out.
The morning shows are also far more flexible and lighter in content. They can fill their time with infotainment, scandalmongering, tabloid fare, thinly veiled reality programming (wedding planning or makeovers) or seasonal recipes, all with astraight face. Or they can devote the first halfhour to news from Iraq or Washington, although they do not often do so.
The morning shows have also tinkered with their formats and changed their looks somewhat more than the eveningnewscasts to keep viewers interested and freshen their genre. In 1994, NBC began the wave of changes when it movedthe show back to a groundfloor studio in Rockefeller Center in New York City that had a window out onto the street (as ithad in its earliest days with its first host, Dave Garroway) and began to incorporate the street crowd more in the program.Not long after, CBS and ABC followed suit with their own elaborate studios. 27 (The trend has also spread to cable: bothCNN and Fox News use streetside studios for their morning programs.) Morning musical guests and street concerts alsobecame a bigger part of the morning show routine in this time. And the weather segments have become longer featuresthat involve the assembled throng. In many ways, too, the anchors of the “Today” show and “Good Morning America,”particularly Katie Couric and Diane Sawyer, are the biggest stars of the news divisions today, the most highly paid andpromoted.
Morning news programs are attractive to advertisers because they provide access to a younger audience than the eveningprograms. In fall 2003, according to analysis by Magna Global USA, a market research firm, the median age for each ofthe networks morning shows audience ranged from 51.3 to 53.1 years, compared with 59.5 to 61.2 years for each of thenetwork’s evening shows. 28 Looked at another way, while the 25to54yearold audience for evening news is 27 percentlarger than the morning news audience, the 50plus demographic is 145 percent higher than the same demo duringmorning news. The morning shows are a more efficient way to reach the younger audience that advertisers prefer. 29 The
morning programs also get “softer” as the younger demographics go to work and the nonworking mothers and olderviewers remain at home.
Median Age of News Program Audience
Design Your Own ChartSource: MagnaGlobal USA, “Daypart briefings”
”Today” on Top
Among the morning shows, NBC’s “Today” has been the clear leader since 1995. Its viewership had actually risen to thetop spot by a significant margin in the mid1980s but declined after the network’s takeover and shakeup by GeneralElectric. “Today” vaulted back to the top in the mid1990s after the arrival of Katie Couric and after it moved to its streetlevel studio, largely taking viewers from ABC. Overall, “Today’s” audience is 38 percent larger than it was a decade ago(6.5 million viewers in November 2003, up from 4.7 million viewers in November 1993). 30 “Today’s” totals peaked at 7.2million in November 2000 when NBC’s Tim Russert appeared on an almost daily basis, having sealed his reputation as apolitical oracle with his Election Night blackboard prediction that results would depend on “Florida, Florida, Florida.”
Morning News Viewership
November 1993 to November 2003
abecker
Typewritten Text
Design Your Own Chart Source: Nielsen Media Research unpublished data, www.nielsenmedia.com
abecker
Typewritten Text
ABC’s “Good Morning America” now draws the same number of viewers that it did a decade ago, but it has been a rollercoaster ride. The No. 1 morning show in 1993, its audience fell by 36 percent by 1998. After revamping the show aroundCharlie Gibson and Diane Sawyer in 1999, it had rebuilt its audience by the November 2003 sweeps back to 5.2 millionviewers. That had narrowed the gap with “Today” but still put it in second place by 1.3 million viewers. 31
CBS’s “Early Show” is a distant third. Despite ups and downs and format changes, its audience in November 2003 was21 percent smaller than a decade earlier. 32
The Sunday Shows
Another franchise of network news that deserves note is the Sunday morning talk show. In recent years, “Meet the Press”on NBC, whose host is Tim Russert, has established itself as the dominant ratings leader. At the end of the 20022003season, it led its nearest competitor, CBS’s “Face the Nation,” with its host, Bob Schieffer, by 1.8 million viewers (4.7million versus 2.9 million). Since the 19971998 season, it has led consistently. ABC has changed the format of “ThisWeek,” with George Stephanopoulos as host, under producer Tom Bettag and a team from Nightline. This is worthwatching. At the end of the 20022003 season “This Week” averaged 2.75 million viewers.
The Cable News Challenge
It is difficult, as mentioned before, to apportion precisely where network news audiences are going to, given the variety ofchanges that have occurred in technology, competition and lifestyle, plus the content of network news.
But since the steepest decline in network viewership dates back to the 1980s and the advent of cable, it makes sense tolook closer at the impact of that medium.
Network executives are quick to point out that, even while ratings have dropped, more than 29 million people still watchthe networks news on average in the evening, and just under 15 million still tune in for the morning shows. Thosenumbers far outstrip any cable network news program at anytime, even when the cable networks’ highestrated programsare airing. There are 2 million people watching the average cable news program in prime time, but that figure hardlymatches the losses in network viewership in nightly news. 33
Ratings and viewership, as cable executives are quick to note, are not the whole story. Ratings tell only how many peopleare watching a given program. They do not add up how many different people cumulatively turn to cable or network newsover the course of a day, a number analogous to unique visitors in the online world. This, cable professionals say, isimportant in understanding the appeal of their medium.
abecker
Typewritten Text
abecker
Typewritten Text
To more fully assess the flight of network news audiences, one must turn to survey data. These suggest that a more significant part of networks’ loss has been cable’s gain. Contrary to the ratings data, according to studies by the Pew Research Center for the People and the Press, more people now prefer cable news than network news as their source for national and international news. As far back as 1993, when CNN was the sole cable news channel, the public was as likely to turn to cable as network. By 1999, Pew data showed cable with a 13-point advantage over network. In March of 2003, the gap had widened to 27 percentage points.34
Where People Go for National/International News, Network vs. Cable
Do you get most of your news about national and international issues from network TV news, from local TV news, orfrom cable news networks such as CNN, MSNBC, and the Fox News Channel?
Design Your Own ChartSource: Pew Research Center for the People and the Press unpublished data, www.peoplepress.org* Dates not to scale. Based on survey responses. Respondents allowed to give two answers.
Why? Is there something in the nature of cable news content that people prefer over network news content? Or is thispreference for cable a function of availability?
Here the superior ratings of network news programming over cable become relevant. In head to head competition, whennetwork news and cable news are on at the same time, network news prevails, and by a large margin. This suggests thatpeople apparently do not prefer the way cable does the news; they prefer its instant availability. The age of appointmentnews – when people would structure their time to wait for a certain program to come on – has faded. People now wanttheir news, or their kids’ programming, or their cooking show, when they want it.
One question is what the networks will do when the current evening anchors retire. Will audiences for evening news shrinkfurther when the familiar faces are gone? If so, will the networks decide to abdicate covering news nearly entirely, havingskeletal crews that can offer just enough traditional hard news to fill a morning show or an occasional prime timemagazine segment, but not purport to cover the world in any comprehensive way? Or will they seek newer ways ofoffering news, perhaps to a younger audience? Some say NBC has already taken steps in this direction with CNBC andMSNBC.
Researcher Andrew Tyndall says, “NBC has become the crossmedium multidemographic news division for the entireconglomerate. It was a great institutional failure of ABC News and CBS News not to have replicated what NBC News hasdone. If, for example, CBS News was responsible for news for children (on Nickelodeon), for youth (on MTV), for AfricanAmericans (on BET), for men (on Spike), on the radio (Infinity) and so on, it would once again address the mass marketthat Cronkite once did and put the Tiffany in Viacom, as it were. That potential audience for CBS News is already waitingin Viacom’s distribution system, but the news division just does not have the vision or the corporate ambition to revive itsoncefamous name.” 35
1. Nielsen Media Research unpublished data, www.nielsenmedia.com.
2. Associated Press weekly wire stories for 2003.
3. Nielsen Media Research unpublished data.
4. Nielsen Media Research unpublished data.
5. Nielsen Media Research unpublished data. Nielsen also collects this data by households rather than viewers. The datashow a 24 percent drop in total households for network news since 1993.
6. Craig M. Allen, News Is People (Iowa State University Press, 2001), p. 65.
7. “Internet Sapping Broadcast News Audience,” Pew Research Center for the People and the Press, June 11, 2000, P.1. In 1998, 59 percent of both Internet and nonInternet users reported watching nightly network news on a typical day. In2000, the percentage of Internet users who regularly watched had dropped to 53 percent. In addition, the number ofInternet users who reported watching at least a halfhour a day of network television news dropped from 48 percent in1998 to 40 percent in 2000. Among nonInternet users, meanwhile, Pew found virtually no dropoff in the amount of timespent with network news.
8. According to data collected by the Census Bureau, the average commute in 2000 was 25.5 minutes, three minuteslonger than in 1990, when the average commute was 22.4 minutes. By comparison, the change in commuting timebetween 1980 and 1990 was only 40 seconds (from 21.7 minutes to 22.4 minutes). See U.S. Census Bureau AmericanFactfinder, “A Nation on the Move,” 2003, and Federal Highway Administration, “Journey to Work Trends in the UnitedStates and Its Major Metropolitan Areas, 19601990,” Table 22. Online:http://www.itsdocs.fhwa.dot.gov/jpodocs/repts_te/6@w01!.pdf.
9. Nielsen Media Research unpublished data
10. Numerous onair and offair senior people in network news have aired this concern privately to the authors of thisreport over the years.
11. BIA data. The numbers also show a drop in late local news, after prime time. Late local news shows have seen theiraudience share drop from 57 to 48. The higher share numbers for late night news suggest that it is seen as moreappealing than the alternative programming available at the time.
12. 2003 Cable TV Fact Book, Cable Television Advertising Bureau, chart “Long Term TV Household Share Trends.”Prime time share trend data are based on the OctoberSeptember television year. Available online:http://www.cabletvadbureau.com/02facts/viewership2.htm.
13. Nielsen Media Research unpublished data.
14. Nielsen Media Research unpublished data.
15. Nielsen Media Research unpublished data. Increasingly, television professionals have raised questions about theaccuracy of ratings and viewership data, especially when the margins between rivals are close. In 2003, for instance, thenetworks thought changes in methodology were to blame for sudden drops in the number of adult males watching primetime programming. Nielsen Media Research issued a memo defending its methodology and suggesting that less networkprogramming appealed to that demographic group. It is beyond the scope of this chapter to analyze the quality of Nielsendata. It is the industry standard, and in this case, all of the networks are evaluated by the same methodology.
16. J. Max Robins, “Wins of War,” TV Guide, April 7, 2003.
17. Lisa Quan and Stephanie Spady, “Daypart briefings,” Magna Global USA Media Insights, p. 11.
18. “For networks, finding younger viewers is a gray area,” Los Angeles Times, June 11, 2002.
19. Interviews with authors.
20. Jim Rutenberg, “Suffering News Burnout? Rest of America Is, Too.” New York Times, August 11, 2003.
21. In first week of the war, March 1723, 2003, 32.2 million people watched the nightly news on average. The secondweek of the war, that of March 2430, 29.5 million viewers tuned in; the following week, viewership stood at 27.9 million;
and finally, in the week when American armed forces entered Baghdad and Saddam Hussein’s statue was toppled, April9th, 28.5 million viewers were watching.
22. The average number of households turned to cable news channels jumped from 3.3 million to 8.8 million. See CableWorld, “Ratings,” March 24, 2003; Cable World, “Ratings,” March 31, 2003.
23. Jesse Hamlin, “NBC declares victory in war’s TV ratings battle,” San Francisco Chronicle, March 22, 2003, p. W2.
24. Tyndall Report, February 22, 2003 (http://www.tyndallreport.com/tw0308.html), and Tyndall Report, March 1, 2003(http://www.tyndallreport.com/tw0309.html).
25. Associated Press weekly wire stories for 2003. The share of televisions in use tuned to the three newscasts declinedslightly. For the week of March 915, the three newscasts together received a 43 share. For the week of March 1622, thethree newscasts received a 42 share. NBC gained a point of share, while ABC and CBS each dropped a point of share.
26. Nielsen Media Research unpublished data.
27. See “Morning news wars,” The NewsHour with Jim Lehrer, October 29, 1999.
28. Lisa Quan and Stephanie Spady, “Daypart briefings,” Magna Global USA Media Insights, pp. 2 and 11.
29. Ibid, pp. 1 and 10. For example, in fall 2003, the “Today” show on NBC received 2.6 ratings in the 2554yearolddemographic and 3.9 ratings among those older than 50, while the NBC “Nightly News” received 2.8 ratings in the 2554demo and 8.4 in the 50+ demo.
30. Nielsen Media Research unpublished data.
31. Nielsen Media Research unpublished data.
32. Nielsen Media Research unpublished data.
33. Nielsen Media Research unpublished data.
34. Pew Research Center for the People & The Press, “Late March 2003 War Tracking Poll,” March 2027, 2003.
35. The press made a fair amount of another turning point in 2003 in the rivalry between cable and the three networks.This was the year that the combined totals for cable channels supported by advertising (this does not includenoncommercial premium channels such as HBO) surpassed the three broadcast networks in prime time viewers,according to the Cable Television Advertising Bureau, Cable TV Fact Book, “Long term total TV household share trends.”(Online: http://www.cabletvadbureau.com/). In the 20022003 season, commercial cable drew 41.3 percent of viewers.The Big Three networks accounted for 30.6 percent. All other viewing (including Fox, UPN, WB, PBS, independentstations and pay cable networks like HBO) received 28.1 percent of viewers.
A decade earlier, in the 19931994 season, the three networks accounted for 52.4 percent of all primetime viewership,while commercial cable had 21.3 percent. Pay cable and other broadcast networks accounted for the other 26.3 percent.
Network EconomicsEconomicsFor all that people think of network news as some kind of dinosaur, financially news is an important part of the networktelevision bottom line. Maybe, some might argue, it has become too important.
Overall, news contributes a big part of network profits, particularly in times when developing hit entertainment shows isproving difficult and signing sports contracts too expensive.
Several things stand out.
Revenue from nightly news was up in 2003 (based on projections), the first uptick since 1999. 1
Despite having less than half as many viewers, morning shows greatly outshine nightly news as moneymakers, in largepart because they are on two hours a day rather than 30 minutes and pack in more commercial time. The “Today”show and “Good Morning America” bring in nearly three times the revenue of their evening news counterparts. 2
The heyday of the prime time network magazines shows may be over. They air less often than they did a few yearsago and earn less in advertising revenues. 3
Getting a handle on the finances of network news is difficult. The news divisions are now small elements inside largecorporations, of which even the networks themselves are just a small part. Many news organizations no longer havepeople covering network news from a financial point of view and the companies release little information publicly aboutthem.
What is more, events can change the finances of news substantially. For instance, executives at one of the threenetworks report confidentially that in 1991, their network was headed toward returning $100 million to the bottom line oftheir company from news before the first Gulf War began. The cost of covering that war, including the giving upcommercials, reduced that number to $65 million in operating profit from news for the year.
Twelve years later, insiders report, after covering the second war in Iraq, the same news division was fighting to remainrevenueneutral, to return no profit to the bottom line, but also not fall into the red.
Becoming a Profit Center
The first great change in the finances of network news came in the mid1980s, when the news divisions were asked tobecome profit centers for their companies.
Until then, network news divisions were asked to bring prestige, rather than profits, to their owners. In the language oftoday, prestige was essential to “branding.” News, in other words, was relevant to network economics but in a longtermand more indirect way. As the late CBS chairman William Paley once was quoted as telling his correspondents, “Youworry about the news. I’ve got Jack Benny to bring in the profits.” 4
News also kept the federal regulators off the networks’ backs. Today this is no longer much of a concern, not since theFCC began systematically deregulating television in the 1980s.
Evening News Economics
As is true with audience trends, the direction of evening newscast economics in recent years has not been good, but 2003may have bucked that trend as the economy showed some strengthening.
Still, say industry insiders, the nightly newscasts remain profitable and solid part of the network’s bottom line.
Unfortunately, there are little or no public data on the operating profitability of news divisions alone. To a large extent, intrying to get a handle on finances, we are limited to looking at estimates of revenues. And even here accounting practicesand bundling of ad sales make the picture fuzzy.
From 1999 to 2002, the three networks together have seen their evening advertising revenues drop 6 percent, accordingto data from TNS Media Intelligence, a market research firm. Most of this decline occurred in 2000 and 2001, as aslumping economy resulted in a shrinking advertising market.
But the drop cannot all be tied to a sluggish economy. It began before the economy sagged and at some points occurredeven while ratings had seen an uptick.
Both the NBC “Nightly News” and the ABC “World News Tonight” took in considerably more money in advertisingrevenues in 1999 than they did in 2002. In four years, NBC’s revenues fell off 13 percent and ABC’s fell 9 percent. Thesetwo programs saw big drops in 2001, around $14 million each, as the advertising downturn rippled across all media. 5 Butthis is not entirely attributable to ratings, which were rising for both NBC and ABC in 2000. ABC saw a big ratings jumpin 2001 as the revenues fell. 6 The advertising slump that began in 2000 with the sharp decline in the stock market andthe popping of the dot.com bubble is also a factor here, industry professionals add, making a difficult situation looksomewhat worse.
At CBS, which has the leastwatched nightly news broadcast, ad revenues improved: The CBS “Evening News”experienced an 8 percent jump in advertising revenues from 1999 to 2002. In 2002, CBS eked its way into the secondplace revenue spot, even while it was the clear thirdplace finisher in ratings. 7
Partial 2003 data suggest the trend may be changing. The networks saw strong advertising revenues for the first eightmonths of 2003 and appeared to be on course to show significant gains over 2002. 8 By August of 2003 all the eveningnews show had taken in more than $100 million in revenues. 9
According to the TNS data tracking advertiser spending, the NBC “Nightly News” with Tom Brokaw had taken in revenuesof more than $110 million through August. The program was thus projected to have its best year since 2000, withestimated revenues of $165 million. CBS, which had taken in $106 million by August, looked ready to have its best yearsince before 1999 ($159 million in revenue). And ABC, with more $100 million in its coffers, was on track to beat its 2001results (with $150 million in revenue).
These revenue numbers, however, need to be viewed carefully, industry insiders say. The networks, particularly NBC andABC, are selling ads in packages. So an NBC ad buy could include, for instance, the network nightly news, CNBC andMSNBC, plus online deals with MSNBC.com. That gives networks leeway in terms of how they assign the revenues todifferent programs. It is possible that the revenue data, insiders say, are comparing apples and oranges.
Indeed, some network news professionals say the bundling of ad sales has become an important factor in the race forNo. 1 in evening news. If you are on top, you have more leverage to bundle ad sales, to tell advertisers that if they wantpreferred spots on the evening news, they may be forced to buy time in other programs.
According to internal network sales data provided to the Project for Excellence in Journalism by a confidential source, infact, these public projections of 2003 revenues are close but not entirely accurate. This internal network accounting for2003 shows the No. 1 rated NBC “Nightly News” topping $200 million in ad sales. The No. 2 rated ABC “World NewsTonight” was second at more $170 million and No. 3 CBS “Evening News” took in about $133 million. It is difficult toassess which numbers are more accurate, the internal or the public estimates. Executives say the bundling of ad salesmake all the estimates somewhat softer, or more a matter of accounting judgment, than they once were.
abecker
Typewritten Text
Design Your Own ChartSource: TNS Media Intelligence/CMR unpublished data, www.tnsmicmr.com* 2003 revenue is PEJ projection based on Jan.Aug. data.
Morning Shows
Far from the downward trend surrounding the evening newscasts, the revenue picture of morning news appears morestable. Other than “Meet the Press” on NBC, indeed, the network’s “Today” show is the longestrunning program onnetwork television. 10
And today, in an age when success in entertainment programming is becoming more difficult, morning shows, with their10 hours of programming a week (15 hours for the “Today” show on some affiliates plus four more on weekends), morningshows are more important than ever. This is why networks like ABC are trying to create weekend versions of theirmorning programs to compete with NBC.
Not only are the morning shows enduring, but they are also growing. In the four years of 1999 through 2002, morningshow revenues are up 37 percent, according to the data from TNS.
To get a sense of their significance, consider this: Together, the three morning shows take in more than double therevenues of nightly news, despite half the ratings. 11 A key reason is that the morning shows are on four times longer –two hours a day versus 30 minutes – and pack more commercial time or sponsored segments into each halfhour.
In 2002, NBC’s “Today,” ABC’s “Good Morning America,” and CBS’s “Early Show” brought in over a billion dollars incombined advertising revenues to the networks.
The national economic slowdown had only the smallest of impacts. Only “Good Morning America” had a decline inrevenue from 2000 to 2001, and a small one at that ($4.6 million). In 2002 its numbers were up again. 12
abecker
Typewritten Text
Evening News Revenue, by Network 1999 to 2003*
abecker
Typewritten Text
abecker
Typewritten Text
abecker
Typewritten Text
Design Your Own ChartSource: TNS Media Intelligence/CMR unpublished data, www.tnsmicmr.com
Financially, morning is something of a twonetwork race. According to the data from TNS, NBC’s “Today” show andABC’s “Good Morning America” are actually closer in revenues than they are in ratings, and have been since 1999.Through the first eight months of 2003, both programs had taken in about $300 million each. 13
From 1999 to 2002, moreover, both had seen revenues grow by at least 30 percent.
CBS clearly lags behind though it has made significant gains since 1999, when the “Early Show” replaced the struggling“CBS This Morning.” Since then, it has had the greatest growth in advertising dollars among the three networks, 56percent, although it is building on a smaller base. 14
In the reverse of what we see for evening news, the morning shows are able to generate these powerful increases inrevenue without increases in ratings.
Again, this has something to do with demographics. The younger viewers these shows bring in, including stayathomemoms, may allow the networks to command more from advertisers.
Yet this is only part of it. Morning shows have also found ways to generate new revenue by creating advertisingopportunities even within the content of the programs, and outside the commercial breaks. Sponsored weather spots,productoriented gardening tips and other potential revenue opportunities are now commonplace.
How Morning News Shows Use Their Time, 2001 Division of Time, in Minutes
June 2001 October 2001 AverageTotal Air Time (minutes) 120 120 120Commercials 35 35 35Local News 9 9 9Products 16 17 16.5Promotions 10 5 7.5Subtotal 70 66 68Remaining Time 50 54 52
Source: “Before and After,” PEJ study, November 2001
abecker
Typewritten Text
Morning News Revenue, by Network 1999 to 2002
abecker
Typewritten Text
abecker
Typewritten Text
abecker
Typewritten Text
abecker
Typewritten Text
abecker
Typewritten Text
abecker
Typewritten Text
abecker
Typewritten Text
abecker
Typewritten Text
abecker
Typewritten Text
abecker
Typewritten Text
abecker
Typewritten Text
abecker
Typewritten Text
abecker
Typewritten Text
In addition, a 2001 study conducted by the Project found that, excluding commercials and local news inserts, thesemorning news programs dedicated 32 percent of their time, or roughly 24 minutes of program, to selling viewerssomething – a book, a movie, a kitchen or garden gadget, a Web site, other network programs or a segment later in theshow, some of which, though not all, were sponsored segments.
Add in the 35 minutes of commercials per program, and more than half of every twohour show was spent selling viewerssomething. In short, if viewers tuned in for an hour of morning news, they would get just 25 minutes of network news,weather and other features not related to products and promotions.
The shows also have become vast sources of selfadvertising, or synergy, for the corporate owner. In the study, each ofthe morning shows did more stories about its own parent company products than it did about any other single company,especially its media competitors. Disney products were most likely to appear on ABC, Viacom products on CBS and G.E.products on NBC. 15
The morning time slot is also interesting for another reason. It is the one time of day where the networks go headtoheadwith cable news operations with virtually the same kind of programming. From 7 to 9 a.m. Eastern time, both cable andnetwork air similar morning shows. 16 And in this time slot the networks prevail. As we saw in nightly news, head to head,many more people watch network morning news programs than comparably styled cable news morning programs. 17
Fox plays an interesting role in the morning show battle as well. On the West Coast, where the NBC, ABC and CBSmorning shows are tape delayed, Fox’s affiliates offer local live alternatives.
Sunday Show Economics
When it comes to Sunday morning programs, industry insiders say that NBC’s “Meet the Press” is a significant profitproducer for the network. In 2001, NBC reported that the show earned an operating profit of $50 million. That was up,reportedly, from $800,000 in 1991. 18 The other Sunday shows reportedly add to the bottom line but not as significantly.
Prime Time Magazines
If morning shows show a dazzling durability, the revenue figures for prime time news magazines reveal a downward trendthat suggests that the golden era of the network magazine show is over.
Through most of the 1990s these shows had been a boon to the news divisions. The genre really took off in 1992 withNBC’s “Dateline,” which used a different organizational concept to change the game. Instead of using a small staff toproduce a onceaweek show as the other magazines had done, NBC used its entire news staff to churn out storiessteadily. “Dateline” did not air once a week, but instead it was on more often – at its peak five times a week – and thereweren’t stars. There was a rotating cast of anchors and reporters. The brand of the show was NBC news and the showname, not any specific person. The other networks began to follow suit, putting magazines on multiple nights. ABC putits “20/20” and “Primetime” together and made them into a threenightaweek production. And CBS even took the stepof expanding its news magazine franchise, “60 Minutes,” into a twiceweekly show, and its “48 Hours” magazine also airedtwice a week. At the peak of the prime time news magazine craze in 1997, 10 out of a possible 22 hours of prime timenetwork programming on the big three was filled with news magazines. 19
But from 1999 to 2002, revenues for these programs fell 48 percent. 20 And the most obvious reason is quantity. Fromthat 1997 high of 10, the amount of time devoted to prime time magazines per network has shrunken to, in most weeks,two hours, clearly affecting these program’s revenues.
Design Your Own ChartSource: TNS Media Intelligence/CMR unpublished data, www.tnsmicmr.com Perhaps the most interesting question is why the networks cut back on magazine programming. To some extent, themarket for magazines had been glutted. There were too many of them. The history of television networks is filled withgenres that were “hot” and later discarded, from westerns to quiz shows.
The issue is not how many people watch a magazine show. It is how many people might watch something else instead.And in 1999 networks found a new alternative with many of the same advantages as news magazines and a potentialgreater upside.
News magazines became popular as prime time programming because they were cheaper to produce than entertainmentprogramming – sitcoms and dramas – roughly half the cost. 21 Thus a network magazine could make money with amagazine show that generated lower ratings than an expensive hourlong drama or two halfhour sitcoms. In a sense, sayindustry insiders, networks used prime time magazines, in part, to plug holes in their entertainment schedules and tendedto use more of them if they were having trouble finding successful entertainment shows.
In the last four years, the networks found even cheapertoproduce programming – reality TV. And if one hits big, like“Survivor,” the first “Bachelor,” or “American Idol,” the upside is far greater, if more short lived.
News magazines are being supplanted, in part, because Americans prefer shows like “Fear Factor” and “The Bachelor.”As a result, NBC’s “Dateline,” which was on five nights a week in 1998, is now on only twice a week.
On the other hand, there are some, such as Lawrence Grossman, a former NBC News president, who argue that, asidefrom “60 Minutes,” the term “news magazine” has become something of a misnomer for these programs. They might bebetter labeled “nonfiction entertainment magazines.”
One question to watch is whether “60 Minutes” will continue to be the exception in 2004 and beyond with the departure,not entirely voluntary, of the founder Don Hewitt, the 81yearold network news legend who is among the last offairexecutives who was powerful enough on his own to push against the more transitory financial concerns of his businesssuperiors.
“Nightline”
Standing apart from most of these characterizations is “Nightline.” It does not air in prime time and it does not follow thetraditional news magazine format. As many of the magazines have gone more infotainmentoriented and sensational incontent, “Nightline” has resisted. It also has changed its format and updated its look and feel a good deal more thansome might imagine, without changing its seriousness, becoming much more flexible than its original format of a sixminute setup piece followed by 15 minutes of interview. And while it has also seen its revenues decline in recent years, ithas been far more stable than most news programs and much more than entertainment programming.
abecker
Typewritten Text
abecker
Typewritten Text
News Magazine Revenue, Select Programs 1999 to 2002
But avoiding the problems and resisting the pressures that have beset other network shows has not entirely protected“Nightline.” In 2002, ABC considered luring David Letterman away from CBS to fill the 11:30 p.m. Eastern time slot. Thedeal eventually fell through and Letterman stayed with CBS, but the fact that ABC pursued him suggests that“Nightline’s” approach to a weeknight magazine may be threatened. The problem wasn’t that Nightline wasn’t profitableor that its audience was too old. According to internal numbers from ABC Nightline at the time was expected to make$13 million in profit. 22 The problem was merely that Lettermen might have made more money and attracted evenyounger demographics. The issue becomes one of purpose. If a network’s owner feels that it gains something fromoffering a “Nightline” program to the society, it will view things one way. If it feels it gains operating income from offering“Nightline” and little more, it will view things another way.
The Value of News
This raises the question that ultimately will face all network news programming. To what extent are the news divisionsimportant to the viability of television networks and their conglomerate parents as a whole, even if they do not happen tobe significant profit centers? To what degree are the lead anchors, for instance, major faces for the brand? How muchdoes a strong news presence makes the network more attractive to affiliates? To what degree is news less vulnerablethan entertainment programming to fads and strongarm negotiations from Hollywood stars? How important is it that,because news is a capitalintensive form of programming, once the investment has been made, the incremental cost ofproducing more news – be it a special report or an added night of prime time magazine programming – is relatively lowwhile the cost of entry for competitors is high or a new entertainment program is high?
These are more subtle issues than how much a nightly news program or a morning show adds to the bottom line. Theseare intangible matters of judgment, even intuition. They come down, to a greater degree than some other choices, to thevalues of the people who run the company. Yet they play a role in the strategic planning of a network, in the willingnessto invest in news content, in budgeting and in what new business models a media conglomerate might want to invent.
Footnotes
1. TNS Media Intelligence/CMR unpublished data, www.tnsmicmr.com; PEJ research.
2. Nielsen Media Research unpublished data, www.nielsenmedia.com; TNS Media Intelligence/CMR unpublished data
3. PEJ research; TNS Media Intelligence/CMR unpublished data.
4. Interview with the former CBS correspondent Marvin Kalb by the author, Tom Rosenstiel, director of the Project forExcellence in Journalism.
5. TNS Media Intelligence/CMR unpublished data.
6. Nielsen Media Research unpublished data; TNS Media Intelligence/CMR unpublished data.
7. TNS Media Intelligence/CMR unpublished data; Nielsen Media Research unpublished data.
8. TNS Media Intelligence/CMR unpublished data.
9. TNS Media Intelligence/CMR unpublished data.
10. “Morning television programs,” Encyclopedia of Television, online athttp://www.museum.tv/archives/etv/M/htmlM/morningtelev/morningtelev.htm.
11. TNS Media Intelligence/CMR unpublished data; Nielsen Media Research unpublished data.
12. TNS Media Intelligence/CMR unpublished data.
13. TNS Media Intelligence/CMR unpublished data.
14. TNS Media Intelligence/CMR unpublished data.
15. See section on “Corporate synergy” in Project for Excellence in Journalism, “Before and After: How the War onTerrorism Has Changed the News Agenda,” November 19, 2001, online athttp://www.journalism.org/resources/research/reports/agenda/default.asp.
17. In summer 2003, for example, the three morning cable programs (CNN’s “American Morning,” Fox News’ “Fox &Friends,” and MSNBC’s “Imus in the Morning”) drew just 2.3 million viewers all together. See Peter Johnson, “Fox wakesup morning TV,” USA Today, August 17, 2003, online at http://www.usatoday.com/life/television/news/20030817foxam_x.htm.
18. Lisa de Moraes, The Washington Post, “Tim Russert signs record deal with NBC News,” December 12, 2001, p. C1.
19. Elizabeth Weinreb, “The News About News Magazines,” unpublished essay.
20. TNS Media Intelligence/CMR unpublished data.
21. “Newsmagazines woo viewers as mustsee TV drama,” Christian Science Monitor, February 20, 1998, p. B1.
22. Tom Rosenstiel and Bill Kovach, “Why We Need ‘Nightline’,” The Washington Post, March 6, 2002, p. A19.
OwnershipOwnershipIn the last 10 years two networks of the big three, ABC and CBS, have been part of largescale mergers, and the third,NBC, which went through a largescale merger of its own earlier, has spread its news division onto cable with allnewschannels. As 2004 began, another merger possibility appeared on the horizon, the takeover of Disney, the owner of ABC,by a smaller cable company, Comcast. Network ownership stands out from the other media sectors in two important
The big three networks that air nightly newscasts are owned by true behemoths of American media. All three owners –Viacom, Disney and General Electric – were among the top five media companies in the country in overall revenue in2002. 1
Because these conglomerates are so big, their news divisions are proportionally a much smaller part of the companythan they were under their previous owners.
These two points play an important role in where network television news may be headed. Increasingly the question fornetwork news divisions is how they will carry on in a world where they are a smaller and smaller element of the whole. Itis difficult, for instance, to find any mention of NBC News in General Electric’s annual report, one indicator of wheresomething stands on corporate strategic planning boards.
The Biggest Big Boys
Viacom, the owner of CBS, is the secondlargest media company in the country. Disney, the owner of ABC, is the fourth.(as a division of G.E.) is the fifth. 2
In some ways this should insulate the network news divisions. Their owners are powerful and in theory should bediversified enough that they would have more resources for news and more economies of scale to produce news moreefficiently. But size can also mean that news becomes a smaller and potentially less important part of a company’spurpose, farther away from its core values, just another contributor to the bottom line.
Television Revenue as Percent of Total Corporate Revenue Dollars in millions
Viacom’s broadcast television holdings, for instance, generated $7.5 billion in revenue for 2002. As hefty as that sumsound, it was not even a third of the company’s $24.6 billion in revenues overall. Disney took in $4.5 billion in
broadcast revenue in 2002. That was not even a fifth of the company’s total of $25 billion. And NBC’s $6.7 billion inbroadcast revenue was barely 5 percent of General Electric’s $132 billion. 3
The Networks and Their Owners
It should be noted that the companies that own the ABC, CBS and NBC have television holdings beyond their overthenetworks. They all own some cable networks, though the extent of that ownership varies. Disney owns the sports giant
and its sibling networks as well as the Disney Channel and ABC Family..
G.E. owns all or portions of A&E, Bravo, the History Channel, as well as CNBC and MSNBC (a 24hour news network)on cable, and the Hispanic broadcast network Telemundo.
Viacom owns Showtime, Nickelodeon, MTV and BET on cable, as well the UPN broadcast network. While the ownershipthose cable networks allows the parent companies to generate revenue by network entertainment shows, it has had
less effect on the news division’s programming, with the exception of NBC and its cable news outlets. Below is a quicklook at the individual relationships between the owners and their news divisions.
ABC and Disney
When Disney purchased Capital Cities Corporation (and ABC) for $19 billion in 1995, it was thought to be a dream cometrue for believers in synergy. 4 The network would give Disney, which created a lot of content, a place to air its work. Butfor ABC’s news division, the merger has not led to success. From the start there were problems, such as when ABC’s“Good Morning America” was broadcast live from Disney World, a move that was lambasted by press critics. The DisneyCEO, Michael Eisner, made statements that raised doubts about his understanding of the ABC brand, as when hefamously said that it was impossible for ABC News to cover Disney. Shortly after the merger, Disney made another tellingdecision. It scrapped plans to launch a 24hour cable news network, a move that would have allowed ABC to follow thecrossplatform plan that has so helped NBC. Disney thought the costs would be too great. Yet at the time, the widelyaccepted superiority of ABC’s news division would have likely given it an enormous leg up over any rival.
The numbers are even more revealing. At the time of the merger, ABC was the leader of the network news divisions – ontop in ratings and revenues, and its programs dominant in most of their time slots, including nightly news.
Under Disney, nearly every program has stumbled, and the poor performance of ABC’s entertainment division has onlymade the problems worse. The news division has since gone through several rounds of staff reductions (either throughcontracts not being renewed or layoffs), closed bureaus around the world and the United States and has watched its
sink to second in ratings on the evening news and third in revenues. The network also developed a plan toreplace its “Nightline” franchise, considered by many the best news program on commercial network television, and woo
Dave Letterman program from CBS for its time spot. After two humiliating weeks for Disney and ABC, Lettermanturned them down, in significant part because he, unlike Disney, did not want to be known as the man who killed“Nightline.” All of these were bottom line decisions, caused by the parent company wanting a larger return.
Some argue that the focus on the bottom line and cost cutting did not begin with Disney, and the record shows that is thecase. There certainly was downsizing under the previous owner, Capital Cities, coinciding with declining viewership. Butrelative to other networks, ABC News prospered economically and in the view of media critics. That has not been the
since the acquisition by Disney.
In early 2003, Disney’s tortured stewardship of the news division seemed to come full circle. Disney considered thepossibility of merging with CNN to get access to cable’s second source of revenue – subscription – as well as the ability toamortize product across multiple platforms. The deal never happened.
With the arrival of the unwanted bid for Disney by Comcast, ABC in many ways seemed at the center of the deal. Whilewould become an even smaller part of a bigger company, television (both broadcasting and cable), would become a
bigger part of the whole. ABC had fared better critically and financially under Cap Cities than it had under Disney. WouldComcast’s background in television make a difference?
NBC and General Electric
General Electric purchased RCA, and by extension NBC, in 1986 for $6.4 billion and the initial result was not good. 5When G.E. and its CEO, Jack Welch, bought NBC, the network was viewed, say insiders, as a new division in a giantcompany with the same responsibility as any other to show a return to the bottom line.
In news, G.E. reportedly had plans to grow the network’s NewsChannel affiliate service to a point where ultimately someform of evening news program could be done from Charlotte, N.C., in a nonunion environment.
At the same time, the news division was cut severely in what NBC veterans privately refer to as “the Long March.” Staffand budget cuts hit the network news division and knocked it into third place. In his book “Three Blind Mice,” Ken Aulettadescribed a corporation ignorant of broadcasting and unfamiliar with the methods of building a network brand. The focuson the cost of things rather than their value seemed to reach its nadir when the network’s new prime time magazine“Dateline” faked a news story about exploding G.M. pickup trucks.
The exploding pickup truck was a turning point, insiders recall. Reportedly, it persuaded top G.E. executives of theimportance of a news division. One source close to NBC says Welch personally got complaints from fellow CEOs.Whatever occurred, changes began.
Andrew Lack was named president of news and the division began to rebuild. Lack hired Neal Shapiro from ABC tothe magazine franchise and Jeff Gralnick from the same network to work with Tom Brokaw in rebuilding NBC’sNews.” He also committed $10 million for the streetfront studio for “Today.”
While the bottom line remained important, insiders say G.E. was now making available the money to rebuild, withincorporate reason. From 1993 to 1996, the “Nightly News,” “Today” and “Dateline” programs were reconceived. Under thenew news management team, each of the programs became No. 1 in their time slots. They did so in part, the contentanalyses reveal, by leading the march toward softer coverage, yet they maintained their lead in recent years as nightlynews became more serious again.
Even before this period began, the man in charge of NBC, Bob Wright, saw a niche for business news and persuadedto purchase FNN, a struggling financial cable news network, which became CNBC. It now returns to the bottom line
reportedly in excess of $400 million a year.
Part of the concept behind the rebuilding was to spread the resources of the news division across multiple platforms,including MSNBC and MSNBC.com. (MSNBC was created with the infusion of money from Microsoft). The result is a
array of products that can share costs and sell advertising in combination, amortizing investments and makingmore use of correspondents and news resources. Lack, who received a lion’s share of the credit for the rebuilding of NBC,
promoted to run the whole network, but that did not go well and he soon left the NBC altogether.
An open question now is whether his successors, led by the new NBC News president, Neil Shapiro, who used to run“Dateline,” will have similar success. While often unknown to the public, the president of news, the history of networktelevision suggests, is often (perhaps always) the critical figure in the health and integrity of a network’s news division. Atcritical points in their histories, it has been enormously important that the news divisions were run by individuals withvision and the credentials to stand up to their network bosses – Roone Arledge at ABC, Reuven Frank at NBC andRichard Salant at CBS to name only a few.
Two news presidents have lost their jobs in television history for standing up to ownership. In the 1960s, Fred Friendly atCBS lost his job for protesting network decision to air reruns of “I Love Lucy” rather than coverage of Senate hearingsconcerning American involvement in Vietnam. In the 1980s, after G.E.’s purchase of NBC, the NBC news president,Lawrence Grossman, lost his job after fighting G.E.’s attempts to cut the news division.
Last year G.E. announced its plans to absorb the entertainment giant Vivendi/Universal. The merger would put a moviein G.E.’s hands and would give NBC “a relatively steady stream of content” that was less reliant on independent
producers, according to one analyst. 6 Other than the fact that entertainment would make up a larger part of G.E.’smedia holdings, it may be hard to calculate the effect of the merger. Even combined, NBCUniversal would representonly a fraction of GE’s total annual revenue of $130 billion.
CBS and Viacom
The effects of the ViacomCBS merger are still difficult to know. Viacom’s purchase of the network from Westinghousefor $46 billion in 2000 is still relatively recent. 7 Perhaps more telling, Viacom has made fewer visible changes at the topof CBS news than G.E. and Disney did when they took over their networks.
In many ways, CBS is still recovering from the leadership of Lawrence Tisch, who “rescued” the network from a hostiletakeover in 1986 and then slashed the news division, cutting loose 230 news employees and cutting the news budget by$30 million. 8 Westinghouse, which came in and bought the network in 1995 and then sold it four years later, was littlemore than a temporary caretaker.
News Sliver of the Pie Shrinks
The end result of the wave of mergers is that the news divisions have become a much smaller sliver of their owners’ piesthus much more likely to get lost in the big picture. They are more likely to become part of a homogenized whole,than a brand apart with a notably different mission than the rest of the parent companies. The nature of the
owners is different as well.
Newspapers were, and to a large extent still are, owned by newspaper companies. Radio stations and magazines maybe owned by news companies, but they are still largely owned by media companies. Networks operate differently.
Two of the big three networks that air nightly newscasts – ABC and NBC – are owned by companies that make most oftheir money in the world outside of media. (As noted above, a scant 6 percent of G.E.’s revenue comes from mediaventures, according to calculations by Advertising Age magazine, while only 35 percent of Disney’s revenues comes from
its broadcast and cable holdings, of which news is a tiny part. More comes from theme parks and film studios. 9 Thesecompanies have less of a history with the journalistic mission of serving the public interest than most media companies,and certainly less than most news media companies.
In these environments the news divisions are having a harder time getting the investments they need to cover the newsthey once did (see Newsroom Investment).
Barring a sudden change in ownership or these parent companies selling off their networks, it is hard to see how thesituation will change.
Footnotes
1. Advertising Age, 100 Leading Media Companies chart. Time/Warner and Comcast round out the top five. Online:www.adage.com.
2. Advertising Age, 100 Leading Media Companies chart.
3. These figures include all revenues from television operations: network income, ownedandoperated stations revenue,revenue from syndicated programming and all other operations.
4. “The Walt Disney Company Annual Report, 1999.” Online athttp://www.reportgallery.com/work/disney99/dis99ar08.html.
5. “Mergers and Acquisitions,” Encyclopedia of Television, online athttp://www.museum.tv/archives/etv/M/htmlM/mergersanda/mergersanda.htm.
6. James Peltz, “G.E would gain risk with assets; The firm would face Hollywood volatility in bid to boost growth,” LosAngeles Times, September 3, 2003, p. C1.
7. “Viacom, CBS merger gets OK,” USA Today, May 4, 2000, p. 2B.
8. “Laurence A. Tisch, investor known for saving CBS Inc. from takeover, dies at 80,” obituary, The New York Times,November 16, 2003, Section 1, p. 43.
9. Advertising Age, 100 Leading Media Companies chart.
News InvestmentNews InvestmentAs viewers have left, the network news divisions have shrunk in size. And the priorities about where money goes haveshifted. In the process so has the culture of network newsgathering. What once could be described as organizations withlarge battalions of experienced correspondents, producers, editors and camera crews stationed in bureaus worldwidemight better be characterized today as organizations with a small pool of highpriced anchors supported by lessexperienced, less wellknown, correspondents and offair staffers who can parachute in from afar or assemble satellitefootage in New York and cover anything.
Some trends:
Staff cuts, some severe, have hit all of the big three news divisions, forcing a smaller number of correspondents toproduce the same number or more stories. 1
Bureaus, particularly overseas, have been closed, giving the news organizations a smaller global footprint and fewerstaff members with the understanding that comes from having correspondents immersed in foreign cultures.
Many of the correspondents who have left are those with the longest experience and greatest expertise.
The news hole for both morning and evening newscasts is shrinking as time for advertising grows. 2
Staffing
A look at the average network newsroom is the most fundamental way to understand what has happened to investmentin the newsroom. News staffs have shrunk markedly.
The number of correspondents featured on air during the average evening newscast has been cut by more than a thirdsince the peak in 1985, from 76.7 to 50 in 2002, according to Joe Foote, a professor of journalism at Arizona StateUniversity. That is a drop of 35 percent.
And that reduction in staff has meant an increase in reporter workload. In 1985, reporters appearing in evening newscastsdid an average of 31.4 stories a year. By 2002, that number had climbed to 40.9, according to Foote. Figures for othernetwork staff (producers, cameramen, etc.) were not available, but reductions among them may be even greater due totechnological changes.
Average Network Newsroom Size and Reporter Workload
1983 to 2002
Design Your Own Chart
abecker
Typewritten Text
Source: Professor Joe Foote, Arizona State University, unpublished data
The reductions should be understood in context. Some argue that the networks were bloated during the era of oligarchy,when the three nightly newscasts together shared 75 percent of viewers during the dinner hour. Too many people at thenetworks, critics said, had too little to do. It is almost certain that some bloat existed in such an environment.
Some of these reductions have also come as a result of new technologies that have increased productivity.
Yet cuts of more than onethird probably go beyond the efficiencies created by technology or trimming the unproductiveemployees. The casualties of these cuts are not just smaller, relatively unknown correspondents, or the underemployed,but some of the networks’ bigger names with the greatest expertise. Often these are people who would be most resistantto being shifted from a foreign bureau or specialized beat to a general assignment, but other times, these are simplypeople who didn’t want to take sizable pay cuts.
Whatever the reason, they reflect not just cutting costs but also a change in the nature of network coverage. Take awaythese reporters’ expertise and some diminishment in quality becomes unavoidable, network veterans argue.
Each of the networks has cut back on its beats as it has cut back on its correspondent staff, pushing more people intogeneral assignment work. Most of the networks no longer have Supreme Court correspondents, for instance, but haveinstead just one correspondent who covers justice. 3 Prior to the 2003 war in Iraq, the networks no longer had separatecorrespondents at the State Department and the Pentagon. 4 Instead, they each had a single national securitycorrespondent. Networks usually had both a science correspondent and a health correspondent. Now, it is more common,as is true at NBC, to have a merged sciencehealth reporter, such as NBC’s Robert Bazell.
Some of the effects of these changes are difficult to quantify. Critics, however, suggest that the consequences reachfarther than may meet the eye.
Where networks once assigned two or even three reporters to places such as Congress, the Pentagon and the StateDepartment, the job is usually filled by one correspondent and less experienced offair staffers. On its face, not havingduplicate reporters may seem like good sense. Some critics argue that without its bench, network coverage has becomethinner. Another consequence, some network veterans say, is that when a major story develops and the networks “golive,” the lone correspondent is often stuck for hours in front of the camera, his or her reporting confined to what can begotten over the cell phone. Moreover, everything that has happened in front of the camera has occurred in the editorialstructure of camera crews, producers, editors and researchers who are unseen.
Such consequences may be an unavoidable effect of declining audience, but they affect the product and may, in a viciouscycle, encourage still more viewers to turn away.
Bureaus
As they have let go of staff, the networks have also shrunken their presence in the world. Each of the networks once hadabout 15 bureaus abroad. They now have about half a dozen, or less. And in some cases, these bureaus are really justoffices or are staffed largely by contract employees or virtually fulltime freelancers. 5
According to accounting by American Journalism Review, since the peak in the 1980s, ABC has closed seven foreignbureaus and now has six remaining. NBC has locked the doors in seven as well, also leaving six. CBS has done a bitless, closing only four, but that is because they had fewer to begin with. It, too, had six left, according to AJR, as of thesummer of 2003. 6
Other network veterans cite additional bureaus that have closed, including Johannesburg at ABC and Cairo and Beijing atNBC. Given the fact that bureaus open and close over the years, as changes in the news demand coverage from variousregions for periods of time (as in Iraq), an exact accounting is difficult.
With the exception of one bureau in Nairobi at ABC, whose correspondent is a freelancer, the networks have no bureausin Latin America, South America, Africa, India or Pakistan. ABC has no bureau anywhere in Eastern Europe or theformer Soviet Union.
Asia is covered from Hong Kong. Europe and Eastern Europe is covered from London. Outside of temporary bureaus inBaghdad, the Middle East is covered from Tel Aviv or Jerusalem.
Current and Former International Network News BureausSource: Lucinda Fleeson, “Bureau of missing bureaus,” American Journalism Review; PEJ research.
ABC 2003 ABC Closed CBS 2003 CBS Closed NBC 2003 NBC ClosedLondon Rome London Paris London BeirutHong Kong Beirut Rome Beijing Tel Aviv JohannesburgJerusalem Bonn Tokyo Bonn Hong Kong ParisBaghdad Moscow Tel Aviv Johannesburg Moscow FrankfurtNairobi Tokyo Moscow Baghdad BerlinBeijing Cairo Baghdad Havana Manila
Paris Rome
Not all of these bureau closings are purely economic. The closing of ABC’s and NBC’s Beirut bureau can be easilyexplained as a function of how the news environment has changed. The same argument could be made about the closingof ABC’s and CBS’s Bonn bureaus. However, since closing the Bonn bureaus in the capital of the former country of WestGermany, neither network opened a bureau in Berlin, the new capital of unified Germany. NBC, which had bureaus inBonn and Frankfurt, has also left Germany. And even though the Cold War is over, there is no shortage of news comingout of Russia. Still ABC decided to close its Moscow bureau. At the same time, ABC is the only network to have abureau anywhere in Africa.
What does this say about the networks’ international coverage? Basically, the nature of the coverage has fundamentallychanged. Much of the network international coverage is actually camera work shot by freelancers mixed with voiceoverfrom a correspondent at the nearest bureau. What is more, the content analysis found that little international coverageaired on the nightly newscasts or morning news in 2003 that was not directly related to U.S. policy. To some extent thesame thing occurs in domestic coverage. Bureaus are expensive to run and can be difficult to manage. And networksargue that little is lost in the transition. The model still provides news from around the world, just in a different way.
The question is whether something is lost in the change. While freelancers can provide video footage and even reporting,the bureau system provided more than a reporter and a camera in a remote part of the world when news broke. It gavethe networks a feel for the cultures and nations where they had correspondents. It gave them an institutional intelligenceand an continuing sense of changing events. Even the choice of where to locate bureaus carried with it some intrinsicbias toward where the “important” international news would come from. Nevertheless, the bureaus at least left thenetworks more prepared cover news as it was bending, not just when it had broken, and to cover certain parts of theworld in a sustained way, not just to parachute in and then leave.
Another factor is that the foreign bureaus were set up primarily to service the evening newscasts, not the morningprograms. As the news divisions switched emphasis to the mornings, the domestictooverseas mix shifted accordingly.
On one hand, it would be a mistake, some network veterans caution, to give the old networks too much credit for the feelthey had for distant cultures. The television networks never had as many bureaus as did The New York Times or evenThe Los Angeles Times, for instance.
Still, the decline in foreign bureaus raises another question that relates to the agendasetting power of television. Networkexecutives contend that the withdrawal from covering the globe, at least before September 11, was driven by viewerdemand. Americans were no longer so interested in international events after the Cold War ended. The networks couldcite ratings figures and, privately, suggested they had market research as well, to prove it. Critics of the networks, on theother hand, charge that the American public’s declining interest in international affairs, at least before September 11, wasdriven in part by the news media, particularly television, pulling back on foreign news to save money. If Americans in theage of globalization were uninterested in events around the world, this sentiment goes, it was only because the newsmedia were failing to make these events as relevant as they really were.
Which argument has more merit? Certainly some decline in interest in foreign affairs was inevitable and logical after theend of the Cold War. Yet the full explanation is probably more complex than that. In most cases, the closing of bureauswas generated by a mandate to cut costs, not simply to redeploy resources. Foreign bureaus are more expensive to runthan others, so closing them yields more savings. In addition, it is difficult for journalists to know in advance whataudiences want. News by its nature is the unexpected, the unplanned, the new. Journalistic market research by its natureis soft.
Finally, to deny that the media have any agendasetting power – that it merely reflects viewer interest and does notshape it – flies in the face of nearly all the social science research on the influence of television. The truth, in otherwords, is probably some combination of these factors. Television’s pullback from covering the world before September 11may have reflected an American impulse. But it doubtless over time reinforced and intensified that impulse. And it hadthe advantage of helping the bottom line.
One last note: each of the networks lists Baghdad as the site of one of its bureaus. If and when the situation stabilizes inIraq, one would expect those bureaus to close as well. If they close and no other new bureaus are created, the networkscould each be left with five foreign bureaus apiece.
News Hole
As staffs get smaller and bureaus close, another change occurring in network news is that there is less of it. In both themorning and evening news time slots, the evidence suggests there are fewer minutes devoted to news in the newscasts.
Data from the researcher Andrew Tyndall show that the amount of time devoted to news — as opposed to ads, promosand teasers — on the halfhour network nightly news has shrunk 11 percent in 12 years, from 21 minutes in 1991, afterthe first Gulf War, to 18.7 minutes in 2002, on the eve of the second Gulf War. Extra time devoted to coverage of theSeptember 11 attacks in 2001 accounts for the only anomaly in the downward trend.
Average Time Devoted to News on Evening Newscasts1988 to 2002
Year Time (in Minutes)1988 21.01989 21.01990 21.01991 21.01992 20.61993 20.41994 20.11995 19.91996 19.61997 19.11998 19.01999 18.82000 18.82001 19.02002 18.72003 18.8
Source: Andrew Tyndall, unpublished data
More limited data also suggest a similarly pronounced shrinkage in the news hole of the morning news, where every hourcontains on average two fewer minutes of programming over 10 years — 44 minutes 10 seconds in 1992 versus 41minutes 57 seconds in 2001, according to a study from the American Association of Advertising Agencies and theAssociation of National Advertisers. These figures are softer than the Tyndall data since the advertisers study tracks justone week of programming each year, rather than being a census of every broadcast, and there are fluctuations week toweek. Still, it mirrors what has happened in the evening news and suggests that more than a minute of it went tocommercials with another minute going to commercials, promos and public service announcements, or PSAs.
The pros and cons of these changes are interesting to ponder. Giving up more of the news hole for promotions and adsclearly has an impact on the program, shrinking it and perhaps making it more irritating to the audience since it has morecommercials and promos.
Yet that extra minute of ads per hour can mean extra money for the news divisions and the salaries of the stars whopopulate them. The decision to sell off more of the newscast, in other words, is probably one that involves weighingshortterm gain versus longterm cost and estimating the marginal impact on audiences. Will they notice? Will they care?
The changes add up fairly simply. Fewer people, based in fewer places, are filling more hours of news, although the sizeof the news hole in each of those programs is actually somewhat smaller.
The net effect is seen in the content. The networks have a harder time sustaining coverage of complex events. There arefewer specialists and beats. For instance, while the news agenda of network news changed sharply after September 11,2001, that shift was not sustained in the first six months of 2002, when the nightly news returned partly to the same newstopic agenda it had before the terrorist attacks. (see content). Even in the weeks following September 11, networkexecutives said, the networks felt that they had excelled, but they had become exhausted. As one thenretired executivewith close ties to one of the networks put it at the time, “they no longer had the bench” to do this kind of coverage formore than a few weeks.
A comparison of the size of the news hole with the average number of correspondents per newsroom shows that thenumber of onair reporters per minute of news has basically remained constant. But as the charts show, the number ofreporters is smaller than it was in 1988, but there is less time available for those correspondents’ stories.
On the one hand, with fewer viewers watching the traditional evening newscasts, one can argue that it makes sense fornews divisions to shift resources away from nightly news and the areas of expertise needed for those programs, such asforeign bureaus.
On the other hand, one can also argue there is a question of chicken and egg. A smaller news hole, and thus a smallerand perhaps more limited program, may be one of the reasons viewership has declined.
Footnotes
1. Professor Joe Foote, Arizona State University (Tempe, Az.), unpublished data.
2. Andrew Tyndall, unpublished data, www.tyndallreport.com; American Association of Advertising Agencies and theAssociation of National Advertisers, “Television Commercial Monitoring Report,” p. 18.
3. Leadership Directories, News Media Yellow Book, 2003.
4. Leadership Directories, News Media Yellow Book, 2003.
5. Lucinda Fleeson, “Bureau of Missing Bureaus,” American Journalism Review, October/November 2003. Online:http://www.ajr.org/Article.asp?id=3409.
6. Lucinda Fleeson, “Bureau of Missing Bureaus.,” American Journalism Review, October/November 2003. Online:http://www.ajr.org/Article.asp?id=3409.
Public AttitudesPublic AttitudesThe public’s opinion of the network news divisions is similar to the feelings they have about the news media in general.They feel that news coverage by the networks is less accurate and that generally the networks are not doing as good ajob they did 15 to 20 years ago. Some facts and figures:
The number of people giving ABC, CBS or NBC news the highest mark for believability has fallen from roughly 32percent in 1985 to 23 percent in 2002. 1
Tom Brokaw is the most trusted anchorman, followed by Peter Jennings and then Dan Rather, mirroring the ratingsfor the three nightly newscasts. 2
From 1995 to 2002, the number of people giving Network News an A or B for overall news coverage remainedrelatively steady, but the number giving the networks a D or F increased. 3
In addition to these numbers, surveys indicate that the networks are no longer the place viewers go when news isbreaking. Increasingly they are turning to cable. A 2003 TV Guide poll found that viewers were more likely to name oneof the cable networks as their source for breaking news; CNN was the choice of 31 percent of the public, “more thanABC (8.5 percent), NBC (11 percent) and CBS (6 percent) combined.” Fox News came in second after CNN. 4
The Anchor the Public Trusts
When it comes to afamiliar face delivering the news, the networks still have the respect of viewers. According to surveysfrom TV Guide, all of the network’s primary anchors scored even with or above the highest of their cable counterparts inoverall trustworthiness.
The overall winner was NBC’s Tom Brokaw, who was considered the most trusted anchor in news by 22 percent,according to the TV Guide poll. That number may reflect the fact that NBC is the ratings leader in the evening newstime slot. While 22 percent may not sound large, consider that is in comparison to all anchors on the air – network orcable. In fact, Brokaw has a fairly sizable lead over his next nearest competitor. ABC’s Peter Jennings and CBS’s DanRather are in a virtual tie for second being most trusted by 17 percent and 16 percent, respectively.
Here too, however, there is reason for the networks to be concerned. Fox News’s Shepard Smith, is essentially tied withJennings and Rather with 16 percent citing him as the most trusted anchor. And Smith is viewed as most trusted by awide majority among younger viewers 18 to 24 years old.
CNN’s Aaron Brown was voted most trusted by 11 percent of viewers. Brian Williams, who has been identified tobecome the successor after the 2004 election to Tom Brokaw as anchor of the NBC “Nightly News,” got the lowestmarks with 4 percent. 5
Paul Friedman, the former executive vice president of news for ABC, notes that over the years, exposure is animportant part of what develops trust. Walter Cronkite was trusted in part, in other words, according to this thinking,because he sat in the anchor chair for so long. Time confers trust. Obviously, that alone is not enough. Dan Rather, thelongestsitting anchor, does not rank at the top of this list. Still, it is a factor, and cable anchors, with the number ofhours they are on the air, get a lot of exposure.
Weaker Coverage
Getting away from the explicit question of “believability,” the networks are no longer seen as even doing the best job intheir news coverage. A survey conducted in summer 2001 by The Pew Research Center for the People and the Pressfound that 56 percent of the public graded the broadcast news divisions an A or a B for their overall news coverage.Cable news, by contrast, was given an A or B by 67 percent of the public. The numbers for network news have changedlittle from a poll that asked the same question in 1995, when 57 percent of the public gave network news an A or B. 6
Grading the Network News Organizations
A B C D F Can’t SayNetwork News, 1995 15 42 31 6 2 4Network News, 2002 18 38 26 10 4 4
abecker
Typewritten Text
abecker
Typewritten Text
Source: Pew Research Center
By many key traditional measures of journalistic quality – breadth of topics covered, comprehensiveness of sourcing,resources devoted to writing and editing – this study may lead people to conclude that the content of the networks’newscasts is superior to that of the cable networks. It is unclear whether people responding to the Pew surveys actuallyprefer the content of cable or like the convenience and immediacy of it and the fact that it comes from a source that isdedicated to the deliver of news and information exclusively.
Footnotes
1. Pew Research Center, “News media’s improved image proves shortlived,” August 4, 2002, Topline, Question 2.Online: http://peoplepress.org/reports/display.php3?ReportID=159
2. J. Max Robins, “Wins of War,” TV Guide, April 7, 2003.
3. Pew Research Center, “America’s Place In The World, III,” August 21September 5, 2001
4. J. Max Robins, “Wins of War,” TV Guide, April 7, 2003.
5. J. Max Robins, “Wins of War,” TV Guide, April 7, 2003.
6. Pew Research Center, “America’s Place In The World, III,” August 21September 5, 2001.
Network ConclusionConclusionThe most immediate question about the future of network news concerns the anchors. At each of the three networks,the man occupying the anchor chair is near retirement. The first expected to leave, Tom Brokaw of NBC, is scheduledto step down after the November elections.
What will happen when a new generation of anchors, people who rose during the current, and less influential, era ofnetwork news takes over? Will it lead to an innovative reimagining of the nightly news? Or will the retirements of thebig three anchors mean a loss in prestige for the newscasts with audiences, largely older Americans, more comfortablewith familiar faces?
Change, of course, has long been part of the story of news, for the networks and for the dissemination of information ingeneral. But how the networks respond to this next shift will depend in part on how much the corporations that own thenetworks – General Electric, Viacom and Disney – want to be in the news business.
There are probably three ways to look at network news. It can be seen as something clearly quantifiable, a product thatjustifies its existence in current return to the bottom line. One can also have a more complicated and also skepticalview, that news is a cost of doing business but a bit of a headache, an obligation that viewers have come to expect thatis something of a financial drag. Or one may have a more optimistic view, that news is a service that adds genuine ifunquantifiable value – personality, credibility, a sense of public responsibility – that in turn translates into viewer loyalty,stronger affiliates, better ratings and a brand exportable to new product lines like the Internet.
All three viewpoints are defensible. In the end, they come down to the values of the owners, their vision of theirbusiness. Yet each shapes how much one is willing to invest in news and thus the business model for the future. Theoptions are many.
The networks could keep their news largely a mass medium product, but likely a smaller one. This means producingprograms mainly for their core broadcast channel, as they do now. In this vision, network news would likely continue tolose audience. That would probably translate into further cuts in the news division and a diminution in quality, whichmight further chase audience away. This is the easiest model to imagine.
The other networks also could follow NBC’s example and create 24hour news channels on cable to reach moreaudience and distribute use their resources more widely. Fox is approaching this in a smaller form with some networknews programming in addition to its cable channel. ABC discussed the option with CNN before backing out. Theconcern is whether the cable universe is already too crowded.
The networks also could create even more paths for transmission, to more targeted and customized audiences. Imaginea newscast for MTV, another for Discovery, one for the History Channel, even in different languages. ABC and CBSexecutives have proffered plans along these lines, but were rebuffed by their companies. The news divisions also couldgo further into the business they offer local affiliates now, providing the news piecemeal, offering stories, newsbriefs andinserts for other channels to provide, a kind of supplemental television wire service for any outlet on television.
The biggest question for the networks may be what happens in the age of broadband, when the distinctions betweencable and network television become less important. As the convergence of news technologies grows, there will almostcertainly be more and deeper amounts of content available for those who want it. If people are getting television newson demand, on their phones and PDAs as well as their televisions, will the advantages cable has now – immediacy andconvenience – mean as much as they do today? Or will the reporting and storytelling strengths of network news thatviewers apparently still prefer on the occasions when network and cable compete head to head become moreimportant?
Predictions about the future of news usually prove wrong. Some combination of options is likely. What probably mattersmore is whether the large corporations that control the networks now add more than incrementally to their currentbusiness model. If institutions that prevail in the future are entrepreneurial enough – with a vision, a willingness toinvest and take risks – and the old networks die, a halfcentury of expertise, experience and credibility that are difficultto replace will go with them.
Cable TV – IntroIntroBy the Project for Excellence in Journalism with Andrew Tyndall
The convenience of 24hour cable TV news, offering the latest breaking headlines at any time of the day or night,represents an enormous structural advantage for cable over network television. Cable has become the television newsmedium of choice. The network most cited as the No. 1 source for news remains CNN, preferred over the broadcastnetworks and even its cable rivals.
Yet all is not so rosy. Cable television’s audiences are not as large or as constant as its boosters depict. The growth ofits core audience reached a peak around the time of the September 11 attacks and has stalled since. Inside cablenewsrooms, Fox still seems to be trying to build staff (perhaps because, unlike CNN and MSNBC, it is still gainingaudience) but, overall, the age of innovation and investment in new kinds of programs or people that characterizedcable news is no more.
Increasingly, anchors or even control room managers – but not correspondents are the primary figures in cable. AfterCNN merged with AOL, it began to shed people and to imitate Fox’s less costly livechat model. MSNBC remainssomewhat more of a showcase for NBC correspondents, but this may be helping NBC News more than the cablesibling.
One of the most deeply held notions that journalists are taught, that they are telling stories, does not strictly apply tocable news. Instead, viewers often see newsgathering in the raw: live interviewing illustrated by unedited videotape,extemporaneous reporting with little time to write or consult sources. The traditional staple of television news, theproduced, written, edited and taped package, has been sidelined. What was once the raw ingredient of journalism isnow the product.
Hour after hour, across all parts of the day, cable television news features constant repetition, a narrow news agenda,an obsession with headlines, scanty sourcing and little autonomy for correspondents in the field.
Many ideas about cable’s audience may also defy conventional wisdom. Contrary to press reports, the cable audienceappears to have flattened since 2002. It is not growing. The medium kept none of the viewers it gained during the 2003war in Iraq, and now that Fox and MSNBC are carried on most systems, continued growth may be harder to come by.As of early 2004, roughly 2.2 million viewers typically watched the three cable news networks every day in prime time,about the same number as in early 2002.
Fox, while the leader in ratings, also may not dominate as much as people imagine. Of the three channels, Fox is stillgaining in ratings, while CNN and MSNBC are losing. At any given moment, Fox’s audience is 60 percent higher thanCNN’s. Still, polling data continue to suggest that more people cite CNN as a news source overall. The problem in thenumbers for CNN is that people are not all watching at the same time.
Financially, the story is clearer. When it comes to revenue and profit, CNN, not Fox, remains the leader, by a largemargin. Fox is beginning to narrow that gap, but there is a long way to go. The leadership in cable, in other words, is amore complex picture than it might seem.
On the other hand, MSNBC is clearly third in both audience and economics.
One question is what will happen down the road when television and the Internet begin to merge with the expansion ofbroadband technology. At that point, cable, broadcast and the Web will more closely begin to compete for the sameaudience. The convenience of getting television news on demand will become less of an advantage for cable alone. Willdifferences in content play a bigger role in determining audience preference? Even now, when cable networks andbroadcast news go headtohead – during the first day or two of a breaking news event, or even during the morningnews hour – the traditional networks remain the preferred medium.
The technology is not yet there. Television news is still something viewers watch mainly in a passive way. Yet when thetechnology changes and the media converge, the advantage may depend more on which media and which outlet havethe strongest news gathering and storytelling abilities.
Cable Content AnalysisContent AnalysisThe most notable finding here is that cable news has all but abandoned what was once the primary element oftelevision news, the written and edited story. In doing so, it has deemphasized the story package’s strengths, namelythe chance to verify, edit and carefully choose words and pictures. The stress in cable news is on mmediacy and costefficiency of the live interview and unedited reporter standup.
Next, rather than covering a comprehensive menu of issues, each morning the cable channels settle on a limitednumber of core stories that are then repeated, and only occasionally substantively updated, as the day proceeds. Thelevel of repetition on cable is enormous. The level of updating is minor.
There are four distinct parts to the cable day — morning news, daytime, early evening and prime time — and each hasdifferent qualities. Prime time is remarkable for the fact that, for channels label themselves news, it is almost totallybereft of newscasts. If viewers wanted a comprehensive prime time survey of the national and international news of theday on these cable channels, only CNN offers such a newscast, and then for only one hour of its prime time schedule.
While there are differences among the three cable channels, the similarities in how they are put together and what theychoose to cover stand out.
The dominant impression is that managers in the control room, rather than the onair talent, function as the real agentsof influence in cable. They decide what pictures to air, what stories to cover, where to go next, who gets to expressexpert knowledge and analysis. They define the personality of the product.
To get a sense of the nature of cable news, the study looked at five sample days for the three cable news networks,CNN, Fox News, and MSNBC, and studied those five days intensively, for 16 hours each day, or 240 hours ofprogramming, some 5,570 story segments.
This intensive approach, examining days in depth over many hours, allowed researchers to get a sense of how cablenews is constructed throughout the day. More conventional studies have tended to examine short periods of time oncable, usually a single program, over a longer number of days, the way that traditional network evening newscasts arestudied. This conventional approach, while useful, leaves too much of the cable day unexamined.
For this study, instead, one of each of the five weekdays was selected at random from May to October of 2003. 1 Forthose dates, our partner, ADT Research, publisher of the Tyndall Report, monitored and coded the cable programmingcontinuously from 7 a.m. to 11 p.m. Eastern time. 2
The Abandonment of the Written Edited Story
The most striking finding is the means by which cable news now communicates information.
Of the 240 hours of programming studied, only 11 percent of that time and 8 percent of the stories consisted of writtenand edited packages.
This makes cable news markedly different from most other forms of journalism, including nightly news, televisiondocumentaries, newspapers, the Internet or even local television. On the commercial broadcast networks’ nightlynewscasts, packages occupy 84 percent of their editorial time.
Instead, 62 percent of the time on cable is conducted in “live” mode. Most of this is conducted through interviews,usually by anchors. A third of the cable news day (32 percent) is devoted to interviews conducted with newsmakers,outside experts, celebrities or ordinary people. Another 9 percent is devoted to questionandanswer sessions with thecable channels’ own inhouse analysts, experts and staffers.
What then is the reporter’s role on cable news? Mostly it is to do live reporter standups–continuous talking, uneditedand unpunctuated by soundbites from any other source. In all, reporter standups made up 21 percent of the entirecable news hole.
This tendency is drastically different than commercial nightly news. There live standups take up only 2 percent of thetime.
A further 15 percent of cable time is spent with anchors narrating video or doing “tells,” reading copy without pictures.
Live events themselves, such as those covered by CSPAN, are not a significant part of cable news, at least during thetimeperiod sampled. Only 8 percent of the time in the sample was made up of live events.
Crosstalk, or banter between anchors or between anchors and correspondents, was negligible (3 percent) and almostentirely confined to morning programming.
Taken together, this emphasis away from edited stories and toward interviews and standups has two importantimplications.
One is it deemphasizes the role of the reporter. Cable is increasingly becoming an anchor medium, in stark contrast towhere it began, and this is particularly true in the morning and evening.
Second, the majority of time on cable is something close to a first draft, or in the case of interviews, news gathering inthe raw. Both live interviews and standups are produced without any chance to edit, and usually with limited or no timeto write.
Correspondents talk either extemporaneously or from notes on a legal pad, something akin to what dictating once wasin newspapers. On TV, however, there is no rewrite man or woman on the other end of the phone to clarify and verify.In a sense, that is left to the audience.
The average reporter standup was 130 seconds, a little over two minutes, and just 12 seconds shorter than the fewedited packages. Talking for that length of time without interruption, usually extemporaneously, says researcher AndrewTyndall, tends to make talkativeness and telegenicity major virtues for cable correspondents. Traditional journalism skillssuch as writing, editing, cultivating sources andwriting to pictures tend to become less important. Indeed, therequirement that reporters be so frequently available during the day to do these repetitive standups necessarily eatsinto the time that they otherwise would have to be in the field collecting information and talking to sources. Everythingis filtered through the reporter since audiences cannot hear or see sources for themselves in soundbites.
On the relatively few occasions when cable stations presented written and edited packages, they tended to be lessdensely packed with information than on broadcast nightly newscasts. For instance, on the three commercial networksand the PBS “NewsHour,” 47 percent of the stories cited at least two separate named and identified sources, while only24 percent of stories on cable had that level of sourcing.
Cable packages were also slightly shorter than on network nightly news, with an average length of 142 seconds, versus164 for nightly news on broadcast television.
Though less densely sourced than network packages, packages on cable, rare as they were, were still more heavily andclearly sourced than cable’s more dominant methods of communicating — interviews or standups. Take, for instance,the difference between packages and reporter standups on cable. Only 15 percent of cable standups cited at leastthree fully identified sources, whereas 35 percent of their edited packages contained that density of sourcing.Furthermore, any source cited in a standup is not quoted in the form of a soundbite that audiences can see and hearfor themselves. Instead, their words are characterized secondhand by the reporter.
Average Story Length on Cable News Length in Seconds
Interviews, the primary and most detailed means of communicating in cable, averaged more than six minutes in length.They also offer audiences the chance to assess a source for themselves. The problem, though, is that that may be theonly source heard from in a piece, the only point of view offered.
Even these totals for named and identified sources, however, slightly overstate the degree to which cable reportersengage in firsthand reporting. We took a threeday subsample to examine the extent to which the cable news networksuse other journalistic organizations as sources rather than checking with primary sources directly. We found that 11percent of all named and identified sources cited by the three cable news channels were actually other newsorganizations (CNN cited 144 news organizations among its 1,131 separate sources; Fox News 104 of 1,049; MSNBC108 of 997).
Immediacy and Updating
The second major finding about cable is the limited breadth of the cable news agenda and the limited amount ofupdating.
Considering all the time cable news has to cover global developments across any number of beats and subject areas,each day’s news agenda was narrowly defined, determined in the morning and largely just replicated thereafter.
In the course of 16 hours of viewing starting at 7 a.m., threequarters of the stories on cable throughout the day (73percent) are the same matter turned to repeatedly.
The cable channels would have you believe that these stories they turn to again are developing stories they arefollowing and updating through the course of the day. It turns out that is not the case.
The content analysis found that only 5 percent of the stories returned to during the day contained substantive new facts.
In other words, 68 percent of the stories on cable news were segments that repeated the same information without anymeaningful new information. 3
Sometimes these stories are returned to with peculiar urgency, with labels describing them as breaking news, despitelittle of substance changing. This seemed to be particularly the case if there was a new picture of some kind. It is notunusual, for instance, to see moments, such as one in December on CNN, when a Santa Barbara, Calif., prosecutorwas followed getting out of his car, walking up the sidewalk and into a building without saying a word. Yet the footagecarried the header “Breaking News: Jackson Prosecutor Arrives at Court Building.”
Such images are often little more than what television people call “Broll,” the raw footage that camera crews shootthrough the course of the day, being put out on the air live. What were once the raw ingredients that made upjournalism, the grist that was ground down into onair material with the chaff discarded, now are the product. It is thetelevision set as “feed room.”
Other times, the cable channels decide to repeat stories but make them look new. They return, for example, to anotherlive standup by a White House correspondent who again delivers reaction to economic figures released earlier in theday, even though the reaction is the same one the correspondent described an hour earlier and could just have easilyhave been taped and rerun. This repetition looks more immediate because it is live and because the correspondentdoes not explain that the reaction came earlier in the day. The anchors often introduce these segments as going backfor “the latest” rather than as repetition. It takes some decoding by the audience to recognize that there is nothing newhere.
Topics
What is the news agenda on cable?
Here conclusions must be tentative because the study examined a large number of hours, but only over five days. Theextreme frequency of story repetition in a day, moreover, makes the diversity of topics even more limited.
Most striking is what was missing. There were only a handful of programs organized around specialized news beatareas. These included CNN’s “Inside Politics” and “Lou Dobbs Tonight” (economics), Fox’s “On the Record” (crime) andMSNBC’s “Abrams Report” (crime).
On the weekdays we studied, none of the three cable networks produced any programs devoted to indepth coverage ofany other specialized areas, social issues or other domestic or international themes. There are no designated programs,for instance, on healthcare, the environment, arts and culture, religion, travel education or the family. The headlinedriven story selection criterion at each cable network determined that these beats were covered only scantily if they didnot happen to surface as headline stories.
In our sample, for example, the limited nature of topics can be seen even more clearly if we look at just one area,domestic affairs. The subcategories of public health, education, the environment, the health care system, andtransportation accounted for just 2 percent of the time on the three cable channels. Terrorism accounted for double that.
Here is another way to look at it. If people had watched one of these cable channels for the entire 16 hours, they wouldhave in the course of the full day seen: 4
Two minutes about education
One minute about the environment
One minute about healthcare
Four minutes about the arts and culture
Two and a half minutes about science
Half a minute on medical research
Just under four minutes on transportation
Six minutes on family and parenting issues
Given that most people do not watch a cable channel for 16 hours a day, in practical terms they saw virtually nothingabout these areas.
In contrast, on a given day, watching for 16 hours, they would have seen:
More than an hour of crime news
One hour of accidents and disasters
53 minutes of lifestyle coverage
41 minutes of celebrity/entertainment news
An hour and 35 minutes about politics
Two hours and 17 minutes about Iraq
Differences In Cable Networks
Much of the popular discussion of cable surrounds the question of ideology, and whether Fox News is, as advertised,fairer and more balanced than the other networks or, as some critics allege, it is a more ideologically conservativenetwork.
This study does not attempt to quantify this. Ideology, to some degree, is in the eye of the beholder and is a difficultmatter to pin down with numbers.
But a close look at the journalistic makeup of cable news suggests that the more manifest “Fox Effect” on cable news iseconomic – an orientation toward using fewer people to produce news by focusing on fewer topics, doing fewer editedstories and airing more live reports.
CNN was more likely to do taped packages (18 percent of total airtime versus 8 percent for MSNBC and Fox News).This is especially true during early evening, when CNN’s “Politics Today” and “Lou Dobbs Tonight” are shown. Duringthat time, 29 percent of the CNN news hole is edited packages (compared with 14 percent taped packages in the earlyevening on Fox News and 10 percent on MSNBC).
By contrast, voiceover videotapes, reports in which the anchor comments while the screen shows silent video, are aspecialty of Fox News. In the course of a day, Fox News presents an average of 11 each hour (CNN and MSNBC eachaverage eight), reaching a dizzying peak in the anchor Shepard Smith’s “Fox Report,” whose hour contains a dailyaverage of 46 voiceovers, as many as ABC’s Peter Jennings would deliver in 10 halfhour newscasts.
Beyond that, however, the similarities among the networks are bigger than the differences. The topics on the threenetworks, for instance, are remarkably similar. And, the three networks are virtually indistinguishable in the level ofrepetition, the percentage of new stories through the course of the day and the level of substantive updates.
They are virtually identical in the level of national versus international stories.
They are also similar in the sourcing of their stories. At each of the networks only between 22 and 26 percent of theirsegments cited and identified at least two named sources. They differed little in the use of anonymous sourcing. At
CNN and Fox News, about a quarter of the stories (23 percent each) relied on anonymous sources. The number wasonly slightly lower at MSNBC, 19 percent.
Daypart May Make More Difference Than Network
While the journalistic makeup at the three cable channels is similar, it is a misleading to talk about cable news as if itwere one seamless product. Rather, there are four distinct personalities to the cable news day morning news, daytime,early evening and prime time. Except in the morning, they bear striking resemblances on all three channels.
Morning
The morning news, from 7 a.m. to 9 a.m. (and until 10 a.m. on CNN), is one of the few periods when there are clearand measurable differences among the networks in their fundamental journalistic approaches. 5
CNN’s “American Morning” has more of a hint of a traditional news program. About 12 percent of the time is filled withpackages by correspondents. Just 3 percent of the time is filled with anchor banter.
MSNBC’s morning program is literally the Don Imus radio show put on television, with 25 percent of the time anchorbanter and only 3 percent packages. It may make corporate sense for NBC News to devote such minimal resources tocable programming in this time slot since its biggest hit, the “Today” show, airs simultaneously on broadcast.
Fox News’s morning show, “Fox and Friends,” is a hybrid of a morning network television news show and a morningdrive time radio show. There are virtually no story packages (1 percent of the time) and 18 percent of the time is anchorbanter.
All three morning programs rely more heavily on interviews (39 percent at CNN, 45 percent Fox News and 47 percentfor Imus at MSNBC) than in any other part of the day that was examined.
Cable Morning News, Story Type Percent of All Time
At midmorning (9 a.m., but 10 a.m. on CNN ) 6, the three cable channels convert to newsdesk programs following thehandful of selected stories of the day, usually those with some visual component they can follow. This is the daytimepart of cable, with generic, unpackaged content embodied in the programs’ titles: CNN’s “Live From…” or “Fox NewsLive” or “MSNBC Live.” With more correspondents now working, and the news day in full swing, there is more use ofreporter standups, which make up a third of the daytime news hole. Anchor “tell” stories (even though they average just30 seconds in duration) are now so numerous that they take up more total time than twominuteplus taped reports.Interviews become less frequent than at any time of the day and anchor banter all but disappears.
Early Evening
As daytime programming switches to early evening, all three cable news networks adjust again. 7 On all three channels,this is the time of day when traditional taped packages are most likely to air, but there are great disparities betweentheir decisions about how prominently to use this format. CNN uses this format frequently (29 percent of the time,compared to 14 percent at Fox News and only 10 percent at MSNBC) in programs such as “Wolf Blitzer Reports,” “LouDobbs Tonight” and “Anderson Cooper 360º.”
Fox News uses this time period to showcase its panel of inhouse experts (13 percent of the time, compared to 6percent at CNN and 10 percent at MSNBC), the most notable fixture being Brit Hume’s panel of political pundits on“Special Report.”
By contrast, MSNBC’s interview subjects tend to be guests rather than staffers (42 percent of the time, compared to 29percent at CNN and 38 percent at Fox News). Chris Matthews'”Hardball” on MSNBC has an interview format tocounterprogram Cooper on CNN and Smith on Fox News.
Cable Early Evening News, Story Type Percent of All Time
As the cable channels move into prime time, after 8 p.m., the term “cable news” is arguably something of a misnomeraltogether. 8 Few of the programs are newscasts in the traditional sense of the term. They might more accurately bedescribed as talk radio on television – interview programs, often with people who are also radio talk show hosts duringthe day. CNN’s “NewsNight With Aaron Brown” is the closest prime time cable comes to a conventional newscast.
Interviews with guests – newsmakers, celebrities, experts, political activists – begin to dominate. They are even morefrequent than in the mornings (at CNN 45 percent of the time, at Fox News 46 percent and at MSNBC 55 percent). Thecontent, moreover, switches from being driven by the day’s headlines to topics chosen by the networks’ intervieweranchors such as CNN’s Larry King, Fox News’ Bill O’Reilly and MSNBC’s Joe Scarborough.
abecker
Typewritten Text
abecker
Typewritten Text
abecker
Typewritten Text
abecker
Typewritten Text
abecker
Typewritten Text
abecker
Typewritten Text
Management — The Control Room as Star
Much of the commentary and analysis about the cable news networks performed by others has focused on teasing outthe underlying political ideology informing what stories they select to cover, what journalistic angles they choose toemphasize and what personnel they hire as correspondents and inhouse experts.
This analysis was designed to examine those same decisions but to inspect them instead according to journalisticcriteria. What we have found is a series of decisions that strengthen management’s control over content and weakenautonomous decisionmaking by reporters.
On cable, whoever runs the control room is the star, more than the anchor and certainly more than the correspondentproducer team gathering news in the field.
This is manifest in many ways. It begins with the limited number of stories that the cable channels actually follow atlength. Control goes to whoever makes the decision about what those stories will be. The control room makes thedecision about what pictures will run over the correspondents’ standups, and thus at least half of viewers’ impressions,whereas in a more storydriven medium, such as nightly news, the correspondents and their producers choose thepictures to illustrate their pieces. The notion from network nightly news, of the anchor as the “managing editor” of thenewscast, being involved in decisions about story lineup, correspondent assignments and more along with the executiveproducer, is unthinkable in this live format, and unworkable. The exception is the prime time program – more interviewthan news program – in which the star anchor is the central figure.
These trends are true at all three cable channels. In some small ways, however, it might be argued that Fox Newskeeps somewhat tighter editorial control on the content of its interviews than its rivals. Fox, for instance, devotes moretime to questions and answers with inhouse experts than it does with “outsiders,” interview subjects who are not on thepayroll.
The whole picture, at all three networks, is ofa medium with enormous time to fill, with a great deal of repetition andperhaps with an impression of immediacy that is greater than reality. Viewers get closer to the raw elements that oncewent into journalism rather than what, in other forms of television news, was once considered the end product.
Footnotes
1. Within those months, the dates that randomly came up were Monday, June 16; Tuesday, July 15; Thursday, August21; Friday, September 19, and Wednesday, September 24.
2. The intensive approach makes it difficult to compare the topic agenda on cable news to that of other media studiedin this report, since there were fewer days and the dates did not overlap. In future years, we intend to combine both theintensive approach taken here with the more multiday approach taken for other media.
3. Our daily samples started with the morning programming at 7 a.m., so in the first few hours we may have beenmonitoring updates or repetitions of stories that had been airing overnight. These were not necessarily new material butinstead just fresh to our monitors.
4. These breakdowns were calculated by taking the total number of seconds devoted to each topic overall, dividing by60 (seconds) and then dividing by 3 (the cable channels). This results in an average number of minutes on a cablechannel over the course of 28 days.
6. For this study, the daytime category consisted of 10 a.m. to 4 p.m. on CNN, 9 a.m. to 3 p.m. on Fox and 9 a.m. to 4p.m. on MSNBC).
7. Early evening ran from 4 to 8 p.m. on CNN, 3 to 7 p.m. on Fox and 4 to 7 p.m. on MSNBC.
8. For this study, prime time ran from 8 to 11 p.m. on CNN and 7 to 11 p.m. on both Fox and MSNBC.
abecker
Typewritten Text
5. For the purposes of this study, the four day parts are roughly equal among the three cable networks but may vary by one hour depending on each network’s specific programming. The morning segment ran from 7 to 10 a.m. on CNN and 7 to 9 a.m. on Fox and MSNBC.
abecker
Typewritten Text
abecker
Typewritten Text
abecker
Typewritten Text
See end of document for content analysis methodology.
abecker
Typewritten Text
abecker
Typewritten Text
Cable AudienceAudienceWhen trying to understand the audience for cable news, these questions stand out:
How many people watch cable news, and is that number growing?
Who is really No. 1?
How many people watch cable news versus broadcast?
The answers, we found, are not as simple as some people may think.
It has become fashionable of late to describe the current era as “the age of cable rising.” The ratings surge during the warin Iraq is usually cited.
The truth is much more complicated. If looked at clearly, the cable audience is really no larger today than it was twoyears ago.
The notion that cable is surging is based on numbers translated for journalists by the cable channels themselves, whichconvert the Nielsen ratings data into annual “averages.” By that accounting, thanks to an enormous but brief spike duringthe war, the cable news audience is described as surging. As reported in the press, Fox News in 2003 was up 53 percentoverall (to 1 million viewers on average) and 45 percent in prime time (an average of 1.7 million viewers) over the yearbefore. CNN had a 24 percent rise in all day viewing (665,000 at any given time) and a 22 percent jump for prime time (to1.1 million). 1
Yet such “averaging” tends to create a misimpression, the idea that the audience is spread relatively evenly through theyear. In reality, cable ratings are among the most volatile in journalism, spiking and falling wildly with news events. Ayearly average implies the typical cable audience is larger than it usually is. Instead, there is something closer to a normalbase level cable audience most months punctuated by occasional spikes during rare major news events.
In mathematical terms, this would translate into looking at the median (defined as the middle value) rather than theaverage. For instance, taking the average viewership for 2003 and comparing it 2002 shows a large increase in the cablenews audience – up 34 percent for the day and 32 percent for prime time. However, if we take the median, or the middlevalue of the 12 months, cable viewership was basically stagnant, showing no growth during the day and a gain of just 3percent in prime time. Looking at the medians, CNN and MSNBC lost viewers in 2003, while Fox News saw an 18percent rise in its median monthly audience. 2
2003 Median and Average Audience Growth from 2002 Source: Nielsen Media Research
Median AverageDaytime Cable 0% +34%Prime time Cable +3% +32%Daytime CNN 11% +20%Prime time CNN 6% +20%Daytime Fox News +18% +53%Prime time Fox News +18% +44%Daytime MSNBC 13% +17%Prime time MSNBC 19% +22%
Going back even farther, a detailed monthbymonth analysis of cable shows the following basic story line over the last sixyears. Cable audiences saw a gradual growth after the launch of Fox News and MSNBC in 1996, then a jump afterSeptember 11, 2001. Since, then, however, the cable news audience at any given time overall is probably mostaccurately described as flat except for the beginning of the war in Iraq in 2003.
abecker
Typewritten Text
Cable viewer data are generally broken down by daytime and prime time. Looking at audiences each month, fewer than700,000 people watched cable during any given daytime moment between October 1997 and July 1998, and fewer than1.2 million watched in prime time. 3
That changed when the ClintonLewinsky scandal led to the Clinton impeachment proceedings in August 1998. Theaverage daytime audience broke the 700,000 level six out of the next seven months. Prime time exceeded 1.2 millionevery month. But the audience began drifting downward again after the impeachment proceedings ended. 4
The Florida election fiasco in November 2000 proved to be the next major boost for cable. Daytime audiences doubledand prime time audiences nearly did that month, and while audiences began to recede again, they never fell back all theway to their previous levels. For each of the first eight months of 2001, audiences were larger than they were in the samemonth the year earlier.
Then came September 11, which seemed to create a structural change in the appeal of cable news. The averagedaytime cable audience in September 2001 surged well above 2 million for the first time. It has not dropped below 1.3million since, more than double its usual monthly total before then. The prime time audience surpassed 4 million viewersfor the first time, and has not fallen below 2 million since. Cable had a new sea level – nearly double what it was in 1998.
Yet since September 2001, there has been no rise in that base level audience. Even the war in Iraq in 2003 did not havethe kind of lasting impact on cable that September 11 did.
The war did represent a boon for cable news. When it began in March, cable ratings nearly tripled from the week before.For April overall, more than 6.9 million people watched cable news in prime time on average at any given time, a newmonthly high (see Sidebar on this page).
Yet the gains were shortlived. In May the monthly average number of viewers watching in prime time plummeted backdown to 2.7 million viewers, in June to 2.4 million and in July to 2.2 million.
The war, in other words, did not change the base level audience.
Another way of looking at this is to look number of people watching cable news each month year to year. FromSeptember 2000 to August 2002, cable had a positive yearoveryear audience growth every month in daytime and everymonth but one in prime time.
Yet since then, that growth has stopped. In four of the last six months of 2003 fewer people were watching cable news inboth prime time and daytime than the year before.
In other words, cable news has held on to basically none of the viewers it gained during the war.
The cable news world is certainly much bigger than it once was. The typical base level for audience cable news is morethan double what it was six years ago. And the spikes during major news events may be higher, too. More people turned
cable during the war than ever before.
The Battle for the Top
Anyone who has followed the cable news industry over the two last years has surely heard that Fox News has overtakenCNN when it comes to audience. Or has it?
Looking only at Nielsen data, the most widely used source, the picture seems pretty clear. For 16 years, since itsinception in 1980 until the launch of Fox News and MSNBC in 1996, CNN had a monopoly over cable news. Since late1996, Fox News has grown rapidly. MSNBC, despite being carried on more cable systems initially than Fox News, neverseemed to gain many viewers. Soon, it was largely a twonetwork race.
Starting in 2001, CNN began to lose viewers while Fox News slowly but steadily built an audience around shows suchas”The O’Reilly Factor.” 5 The election dispute in Florida represented a boon for the medium, with viewership at all threenetworks spiking significantly in November 2000 compared with the rest of 2000. Then, in the election aftermath, FoxNews held on to more of its new viewers than CNN.
In January of 2002, Fox News for the first time surpassed CNN in total viewers and held its lead. This was due more tobig CNN losses, however, than Fox News’s fairly steady but modest gains in viewers. (Fox News at the time averaged 1.1million viewers in prime time versus 921,000 for CNN. MSNBC, a distant third, averaged 358,000 viewers in primetime.) 6
A year later, in January 2003, Fox News had maintained its advantage (with 1,014,000 viewers on average, compared721,000 for CNN, and 252,000 for MSNBC). 7 And immediately after the war in Iraq, it appeared in May that the
network was possibly pulling farther ahead, holding onto more of its wartime audience than CNN.
In the months since, however, Fox News’s losses have actually accelerated, and its margin over CNN has narrowedslightly. Still, as of December 2003, Fox News has drawn better ratings than CNN in every month since January 2002 –24 consecutive months as the cable news leader.
In 2003, the median monthly viewership of Fox News was 770,000 daytime viewers and 1.4 million in prime time, 52 and62 percent more, respectively, than CNN. In December 2003, Fox News averaged 1.4 million viewers in prime time, and961,000 in daytime, both roughly 60 percent more than CNN. In conventional ratings terms, Fox News is well ahead.
Two elements, however, need to be understood about the Nielsen data. First, Nielsen measures only the viewers inprivate homes. Thus, there are not reliable data on how many viewers tune in at work, the gym, airports or elsewhere.(About 18 million travelers are exposed to the CNN Airport Network each month, according to CNN). 8
Second, Nielsen data measure only how many people are viewing a given program at a given time. This is what mattersto advertisers. But the numbers do not tell us whether the people who are watching a given program at one time aredifferent people or the same as are watching another program later on.
In other words, the ratings data do not tell us how many people watch cable news overall. There is no number here thatwould be analogous to newspaper readership or circulation, or the number of “unique visitors” to a Web site.
This may have worked fine for describing the appeal of broadcast television, where every show was a distinct product. Butmisses something in capturing the scope of a medium like cable television, where much of the broadcast day is
indistinct from another part.
As a result, CNN executives argue, the ratings numbers significantly undercount CNN’s real total viewership and mayoverstate Fox News’ appeal.
CNN executives argue that their internal research suggests that through the course of the day, more different peoplecheck in on their network for news updates. Fox News, they contend, has a smaller overall audience, but Fox News’saudience is more loyal and watches for longer periods of time, thus giving Fox a slightly bigger audience at any givenmoment. 9
Is this just network PR spin?
Actually, there is some public research to suggest CNN may have something of a point.
The only way now to find out how many people overall are watching a given cable station, or even cable news generally,is through survey research rather than ratings. The survey work by the Pew Research Center has examined this overseveral years and finds that while Fox News is gaining, CNN actually is cited by more people as the source they turn tofor most of their news.
In October 2003, in the latest data available, 17 percent of those surveyed cited Fox News as their primary news source,while 20 percent cited CNN. And in July, closer to the March/April war in Iraq, during which Fox News enjoyed a spike inratings, CNN’s margin over Fox News was even bigger – five points rather than three (27 percent versus 22 percent). 10
Thus, Fox News is widely understood in the general press as the cable news leader in viewers, and at any given moment,which is what advertisers care about, that seems true. In another sense, however, Fox News’ dominance is less clear. It ispossible, but hard to pin down, that more Americans turn to CNN over time. But they are spread out over more of thebroadcast day or even week.
Looking at the survey data, MSNBC remains a distant third, as is the case with ratings. Just 6 percent of respondentscited MSNBC as their primary source of news in October (and 9 percent in July). 11
Cable Versus Network
The inevitable limitations of ratings raise another issue when it comes to trying to assess the reach of cable: How manypeople now turn in the course of a day or a week to cable instead of the older, traditional broadcast networks — ABC,CBS, and NBC?
For all that people like to note the rise in cable’s numbers, many critics are quick to point out that their ratings are nothingcompared to those commanded by the old broadcasters. Indeed, if they aired on broadcast TV, even the cable networkshows with the highest ratings — “The O’Reilly Factor” and “Larry King Live,” for instance — would be consideredproblems. Their 1 or 2 ratings points would probably get them canceled after a week.
Consider this: In June 2003, the CBS “Evening News” was watched by 6.5 million viewers, a recent low. Yet that was stillthree times higher than the average prime time viewership of all three cable news channels combined during the same
12
abecker
Typewritten Text
abecker
Typewritten Text
abecker
Typewritten Text
abecker
Typewritten Text
abecker
Typewritten Text
week
abecker
Typewritten Text
abecker
Typewritten Text
abecker
Typewritten Text
abecker
Typewritten Text
abecker
Typewritten Text
If the three nightly network newscast audiences in November 2003 were combined, a total of 29.3 million viewers, itwould be more than 12 times the prime time audience for cable, 2.4 million viewers, during the same period.
What is more, this is comparing network shows that are on at a time when Americans increasingly aren’t even home –p.m. and even earlier in some West Coast areas to a cable average that includes programs that are on during the
heaviest television watching period, prime time. When looked at this way, the cable numbers seem even lower.
Here, again, however, the limitations of traditional ratings in trying to reflect the full impact of cable may present aproblem.
The ratings numbers do capture a sense of how many people are watching the three nightly network newscasts during thedinner hour versus any given cable program. And they show a remarkable, even underestimated vigor for the old nightlynewscasts. Not only are these programs substantively different than cable in the nature of their news (see NetworkContent), but they are also vastly more popular as individual programs.
Yet these simple ratings comparisons do not fully capture how many people turn to cable news versus network newsgenerally today to get their information.
For that, survey research again may tell us more. And the survey work suggests that cable has become more importantthan traditional ratings reflect. Cable may have even surpassed network as a source for news and information.
For example, in 2003, the household weekly average for time spent watching cable news was 3 hours and 6 minutes,significantly higher than the 2 hours and 19 minutes spent watching broadcast news (including network news magazineshows), according to an analysis by CNN of Nielsen data. This was an increase of 41 minutes a week for cable news in2003 and a 2minute drop for broadcast news. 13
For some time, the Pew Research Center surveys have asked people where they go for most of their national andinternational news. Today, more people cite cable than network, and have for some time.
In January 2003, for instance, a Pew survey asking people simply to identify whether their favored news source wascable, network or local found cable held a 36point advantage over network (49 percent cable, 13 percent network). 14Pew has asked that same question for 10 years, and has seen cable’s advantage increasing since 2001, though the gapnarrowed slightly during the Iraq war. 15
When people are asked to name a specific channel where they go for “most” of their national and international news,CNN ranks No. 1 and Fox News No. 2, both ahead of any of the three broadcast networks. 16
These comparisons also, of course, reflect the vast differences in supply. Cable is on 24 hours a day. Network news is on,even if one were to include prime time magazines, at most three or four hours a day.
And, again, increasingly the nightly network newscasts are on at times when people are not home. People’s commutesbeen getting longer, making it harder for them to be home when network newscasts are on, whether in the evening
or morning. This is why in local news the earlymorning programming, before 7 a.m., is the only growth area.
One has to ask about the level of commitment the networks really have to a signature evening newscast or to coveringnews in a systematic way. If one wanted to structurally limit a television program’s chances of success, airing it at 6:30p.m. or even 7 p.m. would be a fair way of doing it, and that is when the network news is on. In many places in the West,moreover, such as San Francisco, the evening newscasts go on in an even less enviable time slot, as early, for somenetworks, as 5:30 p.m., when the number of television sets in use is much smaller.
Whatever the reasons, the disadvantages tonightly news have added up, and the audience is clearly shrinking. From 1993to 2002, the percentage of Americans in the Pew surveys who said they regularly got their news from the networkssteadily declined, from 58 to just 32 percent. 17
Cable News’ Expanding Reach
One other factor has hastened cable’s growth, particularly Fox News’s. Over the last five years, Fox News and MSNBCbecome available in more people’s homes.
Shortly after their launches in 1996, Fox News was available in 21 million homes, and MSNBC in 33 million. CNN,meanwhile, was already available in 72 million homes. Now, the numbers are much closer, with CNN available in 86million homes, Fox News in 80 million, and MSNBC in 76 million.
Now Fox News could have difficulty, however, trying to build more audience. There are 90 million cable homes and thatnumber is not likely to increase very much. Thus, most increases in Fox News ratings would depend on people choosingits programming rather than suddenly having Fox News available to them for the first time. By the same token, thisadded availability, or “carriage,” makes the lack of growth at MSNBC appear more pronounced. Even if only a steady butmodest percentage of cable subscribers preferred MSNBC, it would have seen its ratings grow based on expanding thenumber of available households.
Demographics
There is another facet of cable news usage that bears noting. The average age of those who watch the cable newschannels is older than for other cable programming. While these may be affluent elites watching the news, they are olderelites. This may be a sign of danger ahead for cable news.
The median age for CNN viewers is 59.6; for Fox News it is 58.3, and for MSNBC it is 52.4. 18
This gives Fox News a slight advantage over CNN and has always been the key to MSNBC’s appeal – it has theyoungest cable audience.
The age of its viewers offers some advantages to cable over broadcast networks, though again, the limits of whenbroadcast news shows air is probably a key factor. In fall 2003, the median age for the three network evening newsprograms ranged from 59.5 for ABC to 60.3 for NBC to 61.2 for CBS, slightly older than cable.
The limits of who is home when the broadcast news programs are shown is probably a factor. While retirees may behome at 6:30 or 7 pm, working people are more likely to be still on the job or in transit. The fact that these demographicfigures for cable are based only on home viewership, not in hotels, airports or offices, where again many workers arelikely to be in the evening, may also skew those numbers older as well.
Footnotes
1. Caroline Wilbert, “Fox fattens lead on CNN in peak year for cable news,” Atlanta JournalConstitution, January 6, 2004,p. D1. MSNBC had an allday viewing increase of 22 percent to 320,000 viewers and a prime time increase of 23 percentto 443,000 viewers.
2. The statistical methodologist Esther Thorson of the University of Missouri explains the choice of median rather thanmean this way:
The median is a better indicator of central tendency than the mean when there are extremely high or extremely lowobservations in the distribution. These greatly influence the mean, but have little effect on the median. In other words,the median is the closest on the average to all of the scores in the distribution. Because there are some very high levels
of cable viewing during the war, these observations pull the mean away from the average viewing scores too much. Forthat reason, the median is the better indicator of typical viewing levels.
3. Only one month, March 1998, when the relationship between Bill Clinton and Monica Lewinsky was revealed, provedto be an exception.
4. The only exceptions were the Columbine shooting and the death of John F. Kennedy Jr. in the spring and summer of
5. Phil Kloer, “Slow news period causes CNN’s ratings to drop,” Atlanta JournalConstitution, June 29, 2000, p. D3.
6. “Fox News Channel overtakes CNN in ratings for the first time,” Associated Press, January 30, 2002.
7. “Ratings,” Cable World, January 13, 2003.
8. “CNN Nuts and Bolts,” available at http://www.cnn.com/SPECIALS/2000/CNN20/story/nutsbolts/facts. How many canactually be counted as “viewers” is subject to debate. Executives at CNBC, the financial network, say that their officialnumbers would be higher if workplace televisions were included; the other cable news networks would probably make thesame argument. See David Bauder, “Bad business news boosts CNBC,” Associated Press, July 4, 2002.
9. According to Paul Farhi, Nielsen data show that in a threemonth period, the average Fox News viewer tunes in for 8.9hours while the average CNN viewer will watch 4.9 hours. See Paul Farhi, “Everybody Wins,” American JournalismReview, April 2003. Online: http://www.ajr.org/Article.asp?id=2875.
10. Pew Research Center for the People & The Press, “October 2003 News Interest Index,” Final Topline, Question 9.Available at: http://peoplepress.org/reports/print.php3?PageID=748.
11. Pew Research Center for the People & The Press, “October 2003 News Interest Index,” Final Topline, Question 9.Available at: http://peoplepress.org/reports/print.php3?PageID=748.
12. CBS “Evening News”: 6.5 million; cable news prime time viewers: 1.88 million. See David Bauder, “CBS News hitsratings low,” Associated Press, July 3, 2003, and “Ratings,” Cable World, June 30, 2003.
13. Caroline Wilbert, “Fox fattens lead on CNN in peak year for cable news,” Atlanta JournalConstitution, January 6,
14. Pew Research Center, “January 2003 News Interest Index,” January 812, 2003. Available at: http://peoplepress.org/reports/print.php3?PageID=669.
15. Pew Research Center, “January 2003 News Interest Index,” January 812, 2003. Available at: http://peoplepress.org/reports/print.php3?PageID=669.
16. Pew Research Center for the People & The Press, “October 2003 News Interest Index,” Final Topline, Question 9.Available at: http://peoplepress.org/reports/print.php3?PageID=748.
17. Pew Research Center, “Public’s News Habits Little Changed by September 11,” June 9, 2002, Question 20. Availablehttp://peoplepress.org/reports/print.php3?PageID=618.
18. See Allison Romano, “Wish you were younger? So do many cable nets.” Broadcasting & Cable, August 25, 2003.
19. “Ratings,” Cable World, March 31, 2003.
20. CNN was watched by 3.4 million viewers on average, while Fox News was seen by 1.9 million and MSNBC by 1.2million. These figures come from Kevin Downey, “Viewers, not $s, drive cable news networks,” Media Life Magazine,September 19, 2001. Available at:http://www.medialifemagazine.com/news2001/sep01/sep17/3_wed/news1wednesday.html.
21. Richard Huff, “Even minus Brown, CNN led cable ratings Sat.,” New York Daily News, February 5, 2003.
22. Jesse Hamlin, “NBC declares victory in war’s TV ratings battle,” San Francisco Chronicle, March 22, 2003, p. W2.
23. Caroline Wilbert, “Saddam drama helps CNN, but Fox News carries day,” Atlanta JournalConstitution, December 17,
24. David Bauder, “For CNN, Fox’s openandshuttle case of piracy,” Associated Press, February 17, 2003.
25. Verne Gay, “High stakes in the war for cable news supremacy,” Cable World, March 24, 2003.
26. Mercedes M. Cardona, “TV ad spending rebounds during week three of war,” Advertising Age, April 23, 2003.
27. Kevin Downey, “Viewers, not $s, drive cable news networks,” Media Life Magazine, September 19, 2001.
Cable EconomicsEconomicsWhile some ambiguity hovers over which cable news channel attracts more people, there is no question when it comes towhich is winning the dollar war.
Here the leader is not Fox News but CNN.
CNN’s operating profits are roughly five times those of Fox News, while MSNBC has barely broken even so far.
While Fox News has closed the gap, and the trends may become more worrisome to CNN with time, the distancebetween them remains sizable. Some narrowing might be expected, but CNN still has some advantages in its multiplechannels to sell to advertisers.
Cable News Profitability
1997 to 2003
Design Your Own ChartSource: Kagan World Media unpublished data, www.kagan.com* CNN figures include Headline News
CNN’s operating profits, according to data collected by Kagan World Media, a media market research company, rose from$277 million in 1997 to $297 million in 2002. Fox News went from operating at a loss of $84 million to having a profit of$60 million. MSNBC almost moved out of the red, from losing $60 million in 1997 to losing just $300,000 in 2001, beforedropping back to a loss of $15.5 million in 2002.
Kagan’s estimates for 2003 suggest that Fox News has made further inroads: it was projected to increase its profits from$60 million in 2002 to $96 million in 2003, a 60 percent increase. CNN, however, after a drop in 2002, was projected toclimb from $297 million to $351 million in profit in 2003, a 15 percent increase. MSNBC was projected to break into theblack with an operating profit of $3.1 million.
Design Your Own ChartSource: Kagan World Media unpublished data, www.kagan.com* CNN figures include Headline News, except subscriber revenue which is CNN only.
CNN
Why is CNN so much more robust financially when it is trailing Fox News in ratings?
Part of CNN’s financial advantage is that it can offer advertisers package deals on its various channels. These figuresdescribe only domestic revenues and profits for CNN and its sibling 24hour general news network, Headline News. Thetwo networks are often sold as a package deal to advertisers.
In addition to these, however, CNN also has a separate international arm, CNN International, which operates sevenregional networks targeted towards viewers throughout the world (CNN Asia/Pacific and CNN Latin America, forexample). CNN also operates a business news network, CNNfn. These networks bring in separate streams of revenue (asdo other operations, such as CNN’s airport news service and its Newsource operation, which supplies footage of nationaland international events to local television stations), but all rely on the same news gathering structure and offeradvertisers more options.
Another CNN advantage has to do with the fact that it has been around longer and recovered most of its startup costsyears before Fox News and MSNBC began. Outside accounts of CNN’s history estimate that it first broke even around1985, five years after its launch by Ted Turner. Thus it has an advantage of 10 years of profitability over its rivals. 1
This particularly comes into play because of the subscription fee system in cable. Unlike the broadcast networks, cablechannels acquire part of their revenue from subscribers. This is based on a subscriber fee negotiated between each cablechannel and the cable providers. These fees are normally set up under longterm contracts of five to ten years. The mostpopular cable entertainment networks (such as Nickelodeon and TNT) charge roughly 50 cents to $1 per subscriber permonth. 2 CNN’s subscriber fee has remained stable, at around 33 to 37 cents, since 1997.
Fox News and MSNBC rates have been much lower, roughly 17 cents per subscriber for Fox News and 13 cents atMSNBC. Both of the newer cable networks have seen steady increases in their average fee per subscriber since theywent on the air. This suggests new contracts negotiated with higher subscriber fees.
The multiyear nature of the subscriber fee system has insulated CNN to some degree but means that some of itsfinancial advantage will diminish unless it can improve its ratings.
CNN is available in almost every cable household in the country (again there are approximately 90 million cablehouseholds in the United States, and CNN is available in 86 million). This means that soon CNN will no longer be able tosign on additional cable systems in order to increase its subscriber revenue. Instead, it will have to renegotiate contracts
along favorable terms to increase subscriber revenue and to get those higher persubscriber fees CNN may have to showits desirability by scoring better ratings.
Fox News and MSNBC are also approaching the ceiling in subscriber reach, but if Fox News continues to beat CNN inthe ratings, it will be in a much better position relative to the other networks when the time comes to renegotiate itscontracts. CNN may very well see its subscriber revenue stagnate while Fox News manages to obtain higher fees.
Monthly Revenue per Subscriber
1998 to 2002
Design Your Own ChartSource: Kagan World Media unpublished data, www.kagan.com
Fox News
When Rupert Murdoch launched Fox News in late 1996, as part of his strategy for an international news conglomerate,his News Corp. deployed a novel tactic to establish itself. Many cable channels began as initiatives of the cable systemsthemselves in order to provide programming that would entice viewers to start subscribing to cable. Other channels werebegun to provide niche programming, such as Lifetime, now known as “Television for Women.” Fox News, which is notlinked to any cable system and was attempting to crowd into a niche already occupied by CNN, took a different approachin order to gain distribution for its new 24hour channel: When it was launched, Fox News decided to pay for its spot onthe cable box by offering local cable systems a $10 fee for every one of their subscribers. It was, according toMultichannel News, “an unprecedented move at the time.” 3 Cable technology then could accommodate a much smallernumber of channels than today. Other networks, such as Animal Planet and the Cartoon Network, adopted the samestrategy of paying for their spot on the cable box. 4
Fox News executives apparently gambled that if the channel proved successful, this socalled cashforcarriage paymentwould pay off down the road, since Fox News is getting 13 cents per subscriber every month. One press account at thetime of Fox News’ launch reported, “Murdoch says he doesn’t expect FNC to break even until the next century.” 5
While Fox News is now making a profit, what about that $10persubscriber investment over the long term? By now, at 13cents a subscriber a month, Fox News has probably taken in almost $6 per head in subscriber fees in return for that $10 itpaid out in the 1990s.
Fox News network executives suggest that shows like “The O’Reilly Factor” helped draw attention and increasedawareness of Fox News to the point where subscribers began to demand that their cable systems provide it. 6 Also, withthe arrival of digital cable boxes, there are fewer bandwidth restrictions on the number of channels a cable system canoffer, making it easier for Fox News to get placement on even more systems.
The path to profitability has also depended on keeping costs low. Fox News, basically, tries to produce a cable newschannel with fewer reporters and bureaus than CNN does and to focus in depth on fewer stories. Its success is changingthe nature of cable news, shifting it away from taped edited packages and toward a narrower menu of stories (see NewsInvestment).
MSNBC
MSNBC, meanwhile, was created as part of a strategy devised under Andrew Lack, the former NBC News president, toamortize the costs and brand of NBC News across multiple platforms. The content and even much of the staff feedsdirectly off of NBC News, keeping costs at a minimum, and providing revenue for NBC News that might not otherwiseexist. So with minimal added cost, NBC brings in additional revenue from MSNBC, CNBC and also the MSNBC Website. In 1999, CNBC alone brought in revenues of nearly $400 million and pretax profits of $200 million. According to thejournalist Marc Gunther, NBC’s average cost per hour of news fell from $250,000 in 1994 to just $50,000 by 1998. 7
NBC sells itself to cable system operators as a package of MSNBC, CNBC and an agreement to carry NBC’s broadcaststations. Part of the appeal for cable systems is NBC’s strategy of spreading Olympics coverage among all threechannels, although some smaller cable operators have complained that NBC’s practices, which obligate them to pay feesfor three networks at once, are unfair. 8
Revenue Streams
Cable channels sometimes complain that Nielsen’s methods for measuring audience undercount the true audience. Thereason for their irritation is that advertising rates are based on those ratings. Because their Nielsen audience ratings areso much smaller than the broadcast networks’, cable channels are unable to command anywhere near the ad prices ofthe broadcaster.
On the other hand, cable, unlike broadcast, has two revenue streams, not one. In addition to advertising, cable operatorsand cable channels get revenue from subscriber fees.
The question is what happens if the cable universe continues to rise, while broadcasting continues to suffer. Shouldbroadcast networks be paid subscriber fees by cable companies the way cable channels are? Isn’t the ability to get theold networks in a clear signal a major attraction for viewers to buy cable? And if the networks were to rearrange theireconomic structure, would they invest any new revenue in news gathering? Or, because of audience trends, are theymoving toward a point where they might get out of the business of providing a signature nightly newscast and sustaininga general news division and abdicate the role of basic news gathering to cable? If so, the content studies suggest theeffect on television news quality might be devastating.
Footnotes
1. See “Cable News Network,” entry, The Encyclopedia of Television. Available at:http://www.museum.tv/archives/etv/C/htmlC/cablenewsne/cablenewsne.htm.
2. See Richard K. Miller & Associates, The 2002 Entertainment, Media and Advertising Market Research Handbook, p.172.
3. Steve Donohue, “Fox News raced to 80M subs,” Multichannel News, June 3, 2002.
4. Robin Dougherty, “Animal Magnetism,” Salon, March 25, 1997. Available at:http://www.salon.com/march97/media/media970325.html.
5. Marcus Errico, “Fox News Channel goes live Monday,” E! Online, October 6, 1996. Available at:http://www.eonline.com/News/Items/0,1,237,00.html.
6. Steve Donohue, “Fox News raced to 80M subs,” Multichannel News, June 3, 2002, p. 8.
7. Marc Gunther, “The transformation of network news,” Nieman Reports, Summer 1999, p. 28 and p. 29.
8. See, for example, “American Cable Association Files FCC Petition for Inquiry Into Retransmission Consent Practices,”press release, American Cable Association, October 1, 2002. Available at: http://www.americancable.org/press18.htm.
OwnershipOwnershipThe story of cable news ownership is clear: It is the province now of big media, and that is a far cry from where itstarted and the days when network critics derided Ted Turner as the Mouth of the South and CNN as Chicken NoodleNews.
But the aspirations of cable may actually have been more serious then. Its profile is far more corporate – and financial –now.
All three cable news channels today are owned in whole or in part by three big media companies – Time Warner, NewsCorp. and G.E./NBC (in part).
CNN
Time Warner is the world’s largest media company, and CNN, while a major player journalistically, is a relativelyinsignificant part of the company financially. CNN’s $798 million in 2002 revenue represents 2 percent of Time Warner’soverall revenue that year. 1
Time Warner purchased the company when it bought Turner Broadcasting in 1996, making CNN part of the Time Inc.family. The company attempted a variety of synergistic opportunities between the magazines and the cable network, butfor the most part found them financially and journalistically unsatisfying. 2 After the merger between Time Warner andAOL, a battle emerged inside the new company over just what synergy should mean. How much did it involve activemerging of content? How much was it a matter of selling advertising across platforms? How much did it involve usingsome platforms, such as CNN, to promote other parts of the company? Or was AOLTime Warner better off as aconfederation of parts that operated largely independently, looking mostly for economies of scale.
To some the merger of CNN and Time Inc. was empirical proof that synergy, as opposed to simple economies of scalein business, would not work. For others, it was not a repudiation of synergy, but a sign that AOLTime Warner did notunderstand how the concept really worked. The first visible effort was the “Newsstand” magazine show, which sufferedfrom the illfated opening show fiasco over the “Tailwind” investigation. Time Warner saw synergy as a poisonous viperafter that.
The AOLTime Warner merger, which came later, may have suffered from a lack of understanding of two differentcorporate cultures and the inflated value of AOL, and perhaps, as was the case in the CNNTime Warner merger,different definitions of what synergy should mean. Similar questions emerged. Did it mean operating different unitsseparately but looking for economies of scale? Or did it mean using media platforms to market other AOL products? Ordid it mean looking for ways to sell advertising across multiple platforms. Or did it mean looking for special areas wherecross platform cooperation was possible in content and marketing? Whether these failures suggest a lack of corporateunderstanding and planning, or a sign that synergy at least in media may be overblown, and should be more limited, isopen to debate. A full treatment of this issue is beyond the scope of this report, but the issues deserve mention.
Fox News
Fox News’s founder, Rupert Murdoch, likes to contend that his corporation, News Corp., is not really a major mediacompany. 3 In one sense, his statement appears valid. In terms of total revenue, News Corp.’s was a little less than halfof Time Warner’s in 2002 and oneeighth of all General Electric’s revenue.
Yet looked at more closely, Murdoch’s contention is hard to accept. In terms of media revenue alone, NBC gets only alittle bit more than what Fox News does ($7.4 vs. $6.5 billion). Time Warner is bigger than both (with $29 billion inmedia revenue), yet that definition of media includes a lot of entertainment media that are apples and oranges.
If one looks at the world of journalism, News Corp. is perhaps more a behemoth than its cable rivals. Where G.E. has aTV network and Time Warner magazines, cable and online, Murdoch, in magazines like The Weekly Standard,newspapers as diverse as The New York Post and The Times of London, and television outlets as broadly placed asSky News overseas and Fox News here, has influence that reaches much farther into the halls of government andopinion making in many more countries and has influenced the trend toward tabloidization in media globally more thananyone else.
The sibling Fox broadcast network and Fox News on cable are not nearly as integrated as NBC and MSNBC, althoughsome Fox News programs occasionally air on the broadcast stations. Fox executives have expressed interest inextending the Fox News brand into such new areas as business or entertainment news. 4 This would allow Fox News tocopy the CNN and NBC models of spreading newsgathering costs across multiple television networks.
MSNBC
MSNBC has two owners. General Electric, through its NBC subsidiary, owns half of MSNBC. Microsoft owns the otherhalf. The network is managed by people who report to executives at NBC.
In 2001 Microsoft’s CEO, Steve Ballmer, told Reuters that if he had to do it over again he would not have invested inMSNBC. 5 The terms of the deal were never fully disclosed, but it is generally believed to be a binding arrangementthat will be in place for some years to come. In other words, although Microsoft may regret its investment in MSNBC, itis probably unable to pull out of the deal without significant financial penalties.
While it may not have turned into a great gain for Microsoft, the deal has been a boon to the financial health andvisibility of NBC. For example, NBC’s news gathering can be distributed through multiple outlets and a 1998 article saidthat some onair correspondents were feeling overworked: “They are asked to file for MSNBC regularly, for CNBCsometimes, and for MSNBC.com, the Web site the network operates jointly with Microsoft.” 6
Indeed, having a cable sibling may now be a key to success in television news. Unfortunately for ABC and CBS,however, the window may have closed. They have likely missed their chance at an independent cable operation. CBS’s1997 attempt, “CBS Eye on People,” flopped and was sold to the Discovery Channel in 1999. ABC had plans to build acable network when it was the dominant No. 1 network in news. But after Disney bought the network, it pulled the plugon the idea. Since then, ABC News and CNN had talks about some kind of joint venture or even merger, most recentlyin the fall of 2002, according to published reports. But the idea seems for now to have fallen apart.
The landscape for cable could change perhaps if the Londonbased BBC moves forward with plans it has reportedlyconsidered to move seriously into the American market with its 24hour cable channel, BBC World. Currently, itproduces a U.S.focused program called “World Update” which is aired on PBS stations throughout the country.Meanwhile, former Vice President Al Gore has been involved in negotiations to purchase a Canadian allnews networkand possibly adapt it for American viewers. But for now, at least, the cable world is the province of three major mediaplayers.
Footnotes
1. Kagan World Media unpublished data, http://www.kagan.com (CNN revenue), AdAge, “100 Leading MediaCompanies, 2003 edition” (total revenue), available at: http://www.adage.com.
2. See, for example, Matt Kempner, “Timing flawed on AOL spinoffs,” Atlanta JournalConstitution, May 26, 2002, p.1E.
3. Testifying before a House of Representatives committee regarding News Corp.’s plan to acquire the satellite serviceDirectTV, Murdoch said, “In any event, neither News Corp. nor Hughes is among the top five media companies, byexpenditure, in the United States. As you can see in the chart attached to my testimony, News Corp. is sixth with 2.8percent of total industry expenditures, and Hughes [DirectTV’s parent company] is eighth with 2.2 percent. Evencombining the expenditures of News Corp. and Hughes would place the company fifth in expenditures behind AOL TimeWarner with 10.1 percent, Viacom with 6.4 percent, Comcast with 6.3 percent, and Sony at 5.3 percent.” Testimony ofRupert Murdoch before the Committee on the Judiciary, May 8, 2003, available athttp://www.newscorp.com/news/Murdoch_testimony_5_8_03.pdf.
4. Michael Starr, “Two new Fox channels,” New York Post, October 2, 2003.
5. Stefanie Olsen, “Ballmer: Would not launch MSNBC again,” CNET News, June 7, 2001. Available at:http://news.com.com/21001023268073.html.
6. Lawrie Mifflin, “Big 3 networks forced to revise newsgathering methods,” New York Times, October 12, 1998, p. C1.
Cable News InvestmentNews InvestmentWhile there are few hard facts available on the newsroom investment in cable, the trend is clear. The success of FoxNews has transformed the model of how cable is put together and has transformed the kind of news people receive fromcable news in ways that most viewers only sense but may not quite put their finger on.
Fox News has transformed cable from a medium that tries to cover the world with a broad network of bureaus andcorrespondents to a medium that relies on a handful of hosts and just a few correspondents who are doing live talk ratherthan taped and edited pieces. In a recent interview, Fox News chairman Roger Ailes acknowledged that Fox News coulddo more enterprise work: “We keep looking at how to do more longform [journalism], which is very expensive.” 1
The impetus behind the Foxinspired transformation has been the desire to reduce costs.
When AOL purchased Time Warner in 2001, one early move of the new company’s executives, according to sources whospoke to the authors of this study on background, was to institute a cost per minute analysis of the network. How muchdid it cost Fox News to produce a minute of its news versus CNN to produce a minute of its programming?
The result of the AOL analysis was this: CNN was spending too much. It needed to rid itself of people and bureaus – asit turned out including many of its more senior journalists. The network announced a plan to eliminate 400 jobs, or 10percent of its workforce, only two weeks after the AOLTime Warner merger became official. 2
In quick succession, some of CNN’s most familiar oncamera faces were gone, as well as many behindthescenes staff. 3Over the next year or so, a good deal more familiar names decided to take buyouts or not renegotiate their contracts,including CNN’s Washington bureau chief, Frank Sesno; its Supreme Court correspondent and former senior WhiteHouse correspondent, Charles Bierbauer; a Washington correspondent, Brooks Jackson, and a leading businesscorrespondent, Allan Dodds Frank.
Even with the cuts, by June 2000, CNN’s staff was still four times that of Fox News – 4,000 at CNN, 1,000 at Fox Newsand 500 at MSNBC, according to an article in American Journalism Review. 4 According to a New Yorker piece on FoxNews, Fox News had roughly 1,250 employees when the Iraq war began in 2003, including both fulltime staff andfreelancers, while CNN had about 4,000. Fox News also has fewer bureaus, 17, compared to CNN’s 42. 5 MSNBC has 11bureaus, all of them shared with NBC.
Cable News Programming Costs
1997 to 2002
Design Your Own ChartSource: Kagan World Media unpublished data, www.kagan.com
The three channels’ programming costs reflect their histories. In 1997, for instance, CNN’s budget was as much as FoxNews and MSNBC combined. Today CNN’s budget is 83 percent of Fox News’s and MSNBC’s combined.
Fox News initially ran on a shoestring, with a budget in 1997 that was $30 million less than MSNBC’s. As it gainedviewers it has ramped up its size. Now Fox News and MSNBC each spend about $130 million to $140 million a year onprogramming costs. CNN, by contrast, spends $222 million.
The cuts also hit what was once a bastion of CNN, its vast foreign bureau system. CNN had been expanding its foreignbureaus every year since its inception in 1980, but it has now cut back there as well, closing four of them. Nevertheless, itstill maintains four times as many as Fox News, 28 versus 6. 6
Fox News is not at all shy about its lack of spending on news. “We don’t put more crews out than we need,” Ailes said inan interview with Broadcasting & Cable. “We try not to spend money we don’t have. We just pulled back on a story in thePhilippines that, when you looked at it, just wasn’t costeffective…. It may become critical, and I may end up having tospend a lot of money to cover it, but it’s not there yet.” 7
The result of all this, however, is a sweeping and only vaguely understood transformation of cable along the Fox Newsmodel away from packages and toward live, away from dozens of stories a day to a handful. The model of cable news, insome ways, is more today like local news than it is like network. (See Content Analysis)
There was a time when cable was aiming for something quite different. MSNBC, for example, tried seven years ago tobuild a highminded, hourlong program in prime time around the anchor Brian Williams that had echoes of PBS’s“NewsHour,” only more modern. That experiment ended abruptly, however, when the network grew impatient with slowratings growth, particularly with programs that were then more popular such as “Geraldo Live” on CNBC, and saw quickratings spikes in walltowall coverage of tabloid stories like the death of Princess Diana. In the late 1990s, before theAOL merger, CNN tried to build magazine programs in prime time. They were built as concept shows on the model ofbroadcast network prime time magazine shows, particularly the “appointmentstyle” magazines of the 1980s, like “2020”and “Prime Time Live,” and were designed to take advantage of supposed synergy between CNN and Time Inc.magazines. Both network efforts foundered and have given way to anchorcentered talk shows, more on the order of thesuccess of Fox News’s talk radiostyle television programs.
Footnotes
1. “Roger’s balancing act,” Broadcasting & Cable, October 27, 2003, p. 28.
2. “CNN downsizing,” The NewsHour with Jim Lehrer, January 29, 2001. The FCC had approved the AOLTime Warnermerger on January 12, 2001. Available at: http://www.pbs.org/newshour/bb/media/janjune01/cnn_129.html.
3. See Phyllis Furman, “CNN sacks big names,” New York Daily News, January 3, 2003. Available at:http://www.nydailynews.com/01032003/business/story/48274p45419c.html.
4. Kelly Heyboer, “Cable clash,” American Journalism Review, June 2000. Available at: http://www.ajr.org/Article.asp?id=410.
5. Ken Auletta, “Vox Fox,” The New Yorker, May 26, 2003. Available at: http://www.kenauletta.com/voxfox.html.
6. Lucinda Fleeson, “Bureau of missing bureaus,” American Journalism Review, October/November 2003. Available at:http://www.ajr.org/Article.asp?id=3409.
7. “Roger’s balancing act,” Broadcasting & Cable, October 27, 2003.
Public AttitudesPublic AttitudesMore people are watching cable these days, but how do they rate it?
According to Pew Research data, the signs suggest a positive future for cable news. In general, people tend to think ofcable news more highly than they do other forms of television.
When asked in early 2002 “Who has been doing the best job of covering news lately,” 38 percent of respondents saidcable, more than twice that of network (16 percent) and nearly three times that of local television (13 percent). Thatnumber is also almost four times that of newspapers (10 percent).
Cable is the only medium that saw this confidence index grow in recent years, rising from 31 percent in 1999. Networknews, by contrast, declined from 21 percent in 1999 and a full 50 percent in 1996. 1
Looking at the particular cable channels, CNN again stands out in the surveys. The Pew Research Center, for instance,asks people to rate each network on a scale of how “believable” they are. Roughly a third (32 percent) of those surveyedgave CNN the highest possible ranking for believability in May of 2002, 13 percentage points higher than Fox News (at19 percent), and 11 points higher than MSNBC (at 21 percent). 2
CNN’s believability score has dropped. That 32 percent is less than the 37 percent who considered the network highlyreliable in 1998. Still, it enjoys an advantage over its rivals, which may explain why surveys suggest that somewhatmore people sample CNN than its rivals, despite its lower ratings program by program.
Some might suggest that this believability gap is simply due to the fact more people recognize the CNN name as amore established source of news. If that were the case, one might think the broadcast networks, which are much older,should score even higher. Not so. All three broadcast networks scored lower than CNN, receiving the highest rating fromabout 23 percent of respondents.
Footnotes
1. Pew Research Center, “January 2002 News Interest Index,” Final Topline, Question 9. While confidence in onlinesources also grew slightly (from 3 to 5 percent), the difference is too small to be sure this represents an actual shift inpublic attitudes.
2. Pew Research Center, “News media’s improved image proves short lived,” 2002 Believability Survey, Final Topline,Question 9. (Released August 2002; poll conducted May 2002.)
Cable ConclusionConclusionWhere is cable headed? Will it, like national broadcast news, become a universe of three networks largelyindistinguishable in style and ethos? Or will some other structure emerge?
The old broadcast model seems fairly unlikely, given the direction in which Fox News has moved.
In the future, it may be that each cable channel will try to lay claim to a particular audience.
Some critics, such as James Fallows writing in the Atlantic Monthly, have suggested that this niche targeting will beideological, with Fox News getting conservative viewers and CNN and MSNBC having to decide which would go liberaland which might choose another road.
But a closer look suggests that the targeting may be more subtle than that, and much more within the traditional normsof more modern, and less ideological, journalism.
Fox News may boast the largest numbers, at least in terms of traditional ratings, particularly with a prime time lineupthat, like “The O’Reilly Factor,” is heavily styled toward talk radio on television. That audience may be in some waysmore conservative, but in many other ways it may just be more populist. And the network will not abandon its marketingclaim to fairness.
CNN may try to stake out the position that it is the choice of upscale news viewers who are uncomfortable with theangry, disenfranchised talk radio tone of Fox News, particularly in the evening. While the numbers may not be reflectedin the ratings, CNN will stress its audience of business travelers in hotels and airports and even those in governmentcapitals and newsrooms, where opinion shaping supposedly occurs.
MSNBC could try to position itself as the choice for younger viewers.
Indeed, some signs of these trends emerged in the months following the war in Iraq. With Fox News pulling ahead, ithas been able to turn its larger audience into higher prices for its commercials. One report suggested that in the 2003“upfront,” the yearly conference where channels sell their available commercial time to advertisers, Fox News may havegotten more ad revenue than CNN for the first time. CNN disputes that contention. 1
CNN, meanwhile, has shifted toward arguing that its value lies in presenting higherquality journalism. One executiveused a watchmaking analogy in a July press conference, declaring, “I don’t think Rolex cares how many watches Timexsells… because it’s a quality product.” 2 At the same time, CNN began airing a television campaign positioning itself asthe “most trusted” news source while noting in trade publication advertisements that surveys of corporate managers andhighincome consumers have found that CNN is one of their most popular news sources. 3
And though MSNBC is trailing in the ratings and has had difficulty establishing a firm prime time schedule, the silverlining for the channel is that its average viewer is years younger than viewers of either Fox News or CNN, whichenhances the channel’s appeal to advertisers.
For this shaking out to happen more clearly, however, the two more uncertain of the cable networks, CNN and MSNBC,would have to embark on programming that is more clearly committed to a strategy. Their recent history would suggestsomething more tentative and not singleminded.
MSNBC, for instance, at one point toyed with being a liberal alternative to Fox News when it hired Phil Donahue. Butwhen Donahue’s numbers were below the celebrityoriented programming of Connie Chung, his prime time rival onCNN, MSNBC surrendered and hired Michael Savage, a conservative radio talk show host, and Joe Scarborough, aformer Republican Congressman, to replace him.
Donahue’s ratings are actually higher than those of the hosts who replaced him. But Donahue may not have fit with theyounger demographic that MSNBC once imagined it could attract during the day, or that it likes to trumpet as a core ofits Web audience at MSNBC.com.
CNN, meanwhile, has been all over the place since the Time Warner merger with AOL, engaging in experimentation onthe air and seemingly wanting to please many audiences. The shift in gears, for instance, between the celebrity,
infotainment style of Connie Chung’s nowcanceled program and the more contemplative style of Aaron Brown’s wasquite a contrast.
Most likely, any niche targeting will require these networks to do two things they heretofore have found difficult.
First, they will have decide on a complete strategy and pursue it long and seriously enough to find out if it can besuccessful.
Second, they will have to resist the temptation to assimilate qualities that work for Fox News’s audience but wouldundermine their own strategy.
For MSNBC, that might mean really trying to pursue a younger audience by changing the tone, programming andsubstance of the network. For CNN, that might mean really going upscale by attempting more serious, indepthreporting and story selection. Nothing in their records to date suggests they are ready for that to happen.
For CNN, they might even be challenged in their goal, if the BBC becomes more serious about launching an Americanservice and gets enough clearances on cable channels to fill the more serious niche for news.
Footnotes
1. See Phyllis Furman, “CNN in big ad shakeout,” New York Daily News, June 25, 2003. Available at:http://www.nydailynews.com/business/vpfriendly/story/95241p86328c.html.
2. See David Bianculli, “CNN exec knocks Fox News,” New York Daily News, July 11, 2003. Available at:http://www.nydailynews.com/entertainment/vpfriendly/story/99688p90188c.html.
3. The message to consumers, in other words, focuses on getting upscale viewers (who, according to this philosophy,are more concerned about credibility than downscale viewers) to choose CNN over its rivals. The message to advertisersis to choose CNN over its rivals because of its relatively wealthier audience. For example, see Cable TV AdvertisingBureau (a trade group focused on advertisers and ad buyers), “CNN Profile,” which gave as one of the “Top Reasons toAdvertise on CNN” the fact that it is “The #1 cable choice for reaching affluent American consumers for the sixth year ina row.” Available at: http://www.cabletvadbureau.com/02Profiles/CNNProf.htm.
Local TV – IntroIntroBy the Project for Excellence in Journalism
In nearly every aspect of local television – from viewership to economics to ownership structure – there are mixed signalsof health and challenge. The next few years may determine whether the industry ultimately heads up or down. But atleast one survey shows more people who work in local television news are pessimistic than optimistic about the industry’sfuture.
Viewership of local news has begun to decline, much as it did years earlier in network news. Since 1997, the share ofavailable viewers commanded by local early evening newscasts around the country has dropped 18 percent. The sharecommanded by late news, which is broadcast after prime time is over, has dropped 16 percent. 1
Weather in most markets is the primary reason to tune in, and it is becoming more available from cable and the Web.The decline in viewership, in turn, is furthering straining the flow of revenue. To pick up the slack, newsrooms are beingasked to do more with less, expanding the number of hours of news they produce, often with the same or even lowerbudgets. According to one survey, the average workload demanded of reporters increased from 1.5 stories a day in 1998to 1.8 in 2002, an increase of 20 percent. 2
While some of the criticisms of local news are overblown – crime dominates but it is not allcrimeallthetime nor is it allhomogenized news from nowhere – content studies suggest there are some serious shortcomings in what local newsprovides. Among them, according to one body of data, 60 percent of stories that involve disputes mostly present onlyone side of the story.
Commercial and academic surveys suggest at least a portion of the viewers who have stopped watching local televisionnews have done so because they find it repetitive, formulaic, sensationalized or insipid. Brand loyalty is weakening andmore viewers, research suggests, are likely to sample stations and churn through them. 3 Other surveys have found that30 percent of the public is generally convinced that what they see on local television news is improperly influenced bypowerful outsiders like advertisers and the political elite. 4
While technology advances are opening up new possibilities for producing the news, the cost of these advances is also aburden. Stations have to convert to digital technology and build Web sites, and much of that investment is coming at theexpense of expanding newsrooms.
These are all the challenges, but there are also numerous reasons for local news professionals to be confident. Thedecline in viewership is not as steep as in network news. The audience for local television news is still relatively large.Local news remains an enormously profitable business, still able to draw big audiences and still able to amass hugeadvertising revenues. 5
It is still a healthier business than most and is considered, at least for now, much better off than network news. This isone of the major motives behind big networks’ current push for deregulation. They want the ability to own more localstations.
Advertisers still rely on local television and the authority that the public ascribes to it to sell their products. Localadvertisers still often demand that their commercials air during news programs and political campaigns still work toensure that their ads appear during or around newscasts.
These changes do not seem to have had much effect on how people perceive local television news. The public trusts thelocal news, although it is ambivalent about certain practices, and relies on it for information. In a 2002 survey, 65% ratedlocal TV news a 3 or a 4 on a fourpoint scale of believability, about the same as network news and cable, and ahead ofnewspapers. 6 Local television stations also engage in a number of community service activities that enhance their profileand their reputation, and provide commercial time free of charge for charitable organizations. Onair reporters oftenparticipate in various volunteer initiatives and serve as de facto “ambassadors” for their stations. News, weather andsports anchors remain, in many ways, the public faces of their community.
The question for the future of local television news is which way it turns. The biggest threat it faces now is the paradox ofan undernourished product that is in oversupply. The market is saturated with news shows. In trying to differentiate oneproduct from another, stations have tended to emphasize branding over content.
The issue is whether the industry, before it reaches the dangerous level of audience decline that has befallen networknews, decides to invest in its product to reach out to new audiences, or decides it is a mature industry that should focuson efficiency and profit instead.
What’s the Difference Between Local and Network Television?
Local television became prevalent in the late 1940s and early 50s. Originally, there were only a few stations in large citiesthat offered a few local shows mixed in with network programming provided by broadcasting companies based in NewYork. Over time, the relationship was formalized into a system of O&O and affiliate stations. O&O stations are thoseowned and operated by networks, while affiliate stations are owned by nonnetwork companies but have a contractualagreement to air the programming of a network.
The country is divided into 210 television markets and a networkaffiliate contract basically assumes that an affiliatestation has the sole authority to broadcast that network’s program within the bounds of its particular market. 7 Broadlyspeaking, the networks own stations only in the biggest markets, and they rely on affiliates to ensure that their programsare seen in the parts of the country where they do not own stations. 8
There are now six Englishlanguage broadcast networks, which can be put in three groups: ABC, CBS and NBC, thelongestestablished; UPN and WB, the newest, and Fox, which was established before UPN and WB but after the BigThree, and shares aspects of each group. In particular, when it comes to news, affiliates of the Big Three are the mostlikely to have longestablished newsrooms that air multiple newscasts, while UPN and WB stations are least likely tohave newsrooms (except in the biggest markets), though they may occasionally air newscasts provided by a station undercommon ownership affiliated with one of the Big Three networks. Fox stations generally have newsrooms but air lessnews than Big Three affiliates.
The contracts in most cases require that the networks pay the stations compensation for airing their programs. In recentyears, however, the networks have done a number of things to try to end this arrangement, such as demanding thataffiliates contribute to the cost of paying the multimilliondollar contracts to broadcast sports events and reducing oreliminating compensation altogether.
Given that there are few viable alternative strategies for affiliate stations to program their entire day without the network(especially with the availability of cable and the high cost of syndicated shows), the affiliates have generally been forcedto accept whatever terms the networks are willing to offer. (There have been a few notable exceptions: KRONTV in SanFrancisco, the market’s longtime NBC affiliate, went independent when a San Jose station offered to pay $25 million ayear for 10 years in return for the NBC contract; KTVKTV in Phoenix, a former ABC station, became independent in1995 after a series of affiliation changes in the 1990s left it without a network; and WJXTTV in Jacksonville, Fla.,became independent in 2002 after CBS and PostNewsweek were unable to agree on a new affiliation contract.)
Many companies that own network affiliates fear that the FCC’s decision to allow higher ownership limits may increasethe networks’ leverage in negotiating compensation contracts. As of January 2004, negotiators from the White Houseand Congress had modified the FCC’s initial proposal to allow Viacom and Foxthe two largest companiesto keep thestations they own but expand no further. The other networks, ABC and NBC, still have room to add stations regardless ofthe FCC’s rules.
On the other hand, the networks resent the fact that they are paying affiliates 4 percent (in big markets) to 20 percent (insmaller ones) of a station’s total revenue, while the networks alone shoulder the costs of developing programming. 9What is not in dispute is that local stations give the networks a presence in the community that would be almostimpossible to recreate from a New York or Los Angeles headquarters.
Footnotes
1. These statistics are based on PEJ analysis of ratings data supplied by BIA Financial Network for 529 local televisionstations staffed with news directors and affiliated with ABC, CBS or NBC. Stations affiliated with other networks wereexcluded because they either do not air news or air news in nontraditional timeslots.
2. See Marya Jones, “Does quality cost?” Columbia Journalism Review, January/February 1999(http://www.journalism.org/resources/research/reports/localTV/1998/cost.asp), and Deborah Potter, “Pessimism rules inTV newsrooms,” Columbia Journalism Review, November/December 2002(http://www.journalism.org/resources/research/reports/localTV/2002/pessimism.asp).
3. See Deborah Potter and Walter Gantz, “Bringing viewers back to local TV: What could reverse the ratings slide?”Newslab.org. (http://www.newslab.org/research/bringback.htm), and Insite Research, “Television Audience Survey: LocalTelevision News,” October 1999, discussed more fully in the section on Audience.
4. RadioTelevision News Directors Foundation, “2003 Local Television News Study of News Directors and the AmericanPublic.” General Public Questionnaire, questions 3442.
5. The Jack Myers Report, a media newsletter, estimates that in 2002 broadcast stations brought in some $24 billion inad revenue, more than any other advertisersupported outlet except newspapers. All told, broadcast stations garneredsome 14.6% of all advertising spending in that year. See Jack Myers Report, “Advertising Expenditures History andForecast, 19982006,” p. 3.
6. Pew Research Center for the People and the Press, “2002 Believability Survey,” May 616, 2002 question 9. Onlineat: http://peoplepress.org/reports/print.php3?PageID=631.
7. The market bounds at times depend on the strength of the broadcaster’s signal; for example, the Washington marketincludes two NBC stations, WRC and WHAG in Hagerstown, Md., because WRC’s signal does not penetrate far enoughto cover western Maryland.
8. Of the broadcast networks that own broadcast stations, Fox and CBS have the highest penetration, with stations thatreach 39% of all TV households; NBC’s stations reach 34%, and ABC reaches 24%.
9. See John M. Higgins, “Big four look small in the margin column,” Broadcasting & Cable, June 30, 2003, p. 1.
Content AnalysisContent AnalysisWhat does the typical local television newscast look like? For some chapters of this report, the Project did a specialcontent analysis of media sectors in 2003. No such content study was done for local television news. From 1998through 2002, however, the Project undertook an exhaustive examination of the content of local news in 15 to 20markets a year – randomly selected with controls for station size and geographic diversity. In all, 154 stations werestudied, some multiple times. Based on that research, the largest single study of local news we know of, the Projecthas a fairly detailed sense of what Americans generally get from local television news. 1
This detailed analysis suggests that local television news is, indeed, very local. It does a good job of covering manyeveryday events in most communities, especially incidents from the police scanner and events on the news daybook.Local television news is, also, not the same everywhere.
Yet the data also reveal that the medium is dominated by the ethos of “live, local and latebreaking” coverage,particularly of crime. Many of the stories are formulaic, reactive and, above all, short.
Here are some findings:
Threequarters of all stories are local.
Roughly 70 percent of the stories are under one minute long.
The most common topic is crime – by more than 2 to 1 over anything else.
Four in ten stories are about fairly typical, everyday incidents.
Six out of ten stories that involved controversy gave only or mostly one point of view.
What Gets Covered
The Project’s study found a remarkable consistency in terms of what got covered, a surprising range in terms of quality,an alarming tendency toward onesidedness and a steady disappearance of enterprise.
In every year of the study, the No. 1 topic on local television news was crime. Over the five years, 24 percent of allstories were about crime – the number ranging from a high of 26 percent in 2002 to a low of 19 percent in 2000. (Somestations clearly go the other way. In 2002, the last year of the study, there were stations where crime represented aslittle as 5 percent of stories. But these were unusual.)
If crime was the No. 1 topic on local news by more than 2 to 1, what came next? Over the five years, stories aboutaccidents, bizarre events, fires and catastrophes accounted for 12 percent. Taken together, crime, fire accidents anddisasters made up 36 percent of all stories.
The next most popular topics were humaninterest stories and politics, which each accounted for 10 percent of stories.This was followed by social issues – a category that includes a wide swath of topics such as education andtransportation – at 8 percent, and then by business and economic news at 7 percent, although most of these storieswere brief updates on Wall Street rather than larger pieces on economic issues. (The study did not attempt to trackweather and sports coverage.)
Thus the notion that it has to bleed to lead in local television news is an exaggeration, but it is grounded in some reality.We looked just at lead stories on the 2,400 newscasts studied to test this idea. We found that 39 percent were crimestories, while 13 percent were about disasters or severe weather and 9 percent were about a fairly routine fire oraccident, for a total of 61 percent. Local TV news is not dominated by these topics, but it does tend somewhat to leadwith them.
Source: PEJ Local TV News Project.Weather and sports coverage not counted towards total. Totals may not equal 100 due to rounding.
Story Focus
The study also looked at what aspect of an event a story focused on regardless of topic. To what extent did the story tryto extract an underlying idea or trend? To what extent was it focused on just the incident itself? Was it that there wascrash at North and Main Streets? Or did the story note that this was the fifth crash in a month at that corner? Or did thestory go so far as to explain why the problem corner had not been fixed with a traffic light? 2
Here, the reactive and somewhat superficial nature of so many stories becomes apparent. In all, 41 percent of storiesfocused on everyday incidents, such as relatively common car accidents or crimes. Just 15 percent dealt with ideas byfinding the trend or larger problem suggested by whatever the incident was. Eleven percent concerned unusual events,things that were not typical or happened every day. Only 8 percent focused on the health of local institutions.
Story Focus of Local TV News Stories
Story Focus Percent of StoriesEveryday incidents/crimes 41%Human interest/pop culture/scandal 15Ideas, issues, or trends 15Unusual/monumental events 11Local institutions 8Political strategy 6Breaking events 2Public malfeasance 1Other 1
Source: PEJ Local TV News ProjectTotals may not equal 100 due to rounding.
Actors in the News
Who do we see, and not see, on local television news?
Here again, the orientation toward live local and latebreaking news, especially of crime, has an impact. Suspects,lawyers, police officers and victims of crime made up 26 percent of all the people seen in the local news study over fiveyears. Firefighters and emergency medical personnel add 3 percent more.
Who was not seen on local news also stands out. Seniors, for instance, were an asterisk, not even 1 percent. The poorand immigrants also did not even register a single percentage point as oncamera subjects in stories.
Government officials of all sorts, from the president to city council members, made up 14 percent, the secondlargestgroup – after people involved in crime.
P eople involved in crime (e.g., victims, criminals, law enforcement, judges) 26%
Elected officials (e.g., Congress, mayors, school boards) 14Business/corporations 8Natural events (floods, severe weather, etc.) 5Celebrities and athletes 5Participant in unique events 5Person in the street 4Other 33 Source: PEJ Local TV News ProjectTotals may not equal 100 due to rounding.
Story Length
Another characteristic of local television news is that the stories are short. In the study:
Four in ten stories (42 percent) were under 30 seconds.
Only three in ten (31 percent) were more than a minute long.
This brevity may help stations cover a lot of news, but it tends to reinforce the sense of superficiality and lack of realconnection to people. Faced with competition from allnews cable and the need to “grab the eyeballs” of people whohave been watching leadin entertainment programming, local newsrooms often appear to opt for immediacy overstorytelling. Stations tend to emphasize this approach somewhat more in late news, following prime time, than in earlynews, at 5:30 or 6 p.m. When correlated with viewership trends, the findings suggest that airing more short stories maybe unwise for stations trying to build viewer loyalty. In each year of the study, stations with better measures ofcommercial success (defined as their ability to attract or retain audience) tended to do fewer very short stories and morelong stories. The problem is, of course, finding the right mix. A station that did only long stories, in a 22minutenewscast that includes sports and weather, would not cover much of the community.
Local vs. National
Local television news is also predominantly local. Three quarters of the stories (76 percent) were local and the balancewere national or international.
One might think that this is, in part, because the charge of local television news is to be local. And it is. But thatmandate is often tossed aside for reasons that belie local values. For instance, wildfires in California, which are highlyvisual, tended to lead local newscasts in Washington, D.C., even though they were far away. But other major nationalstories, such as economic news or politics, might never lead local newscasts.
Enterprise in Local News
The other characteristic of local television news is that it tends to react to events rather than seek out the news,increasingly so. The study also coded every story studied according to a hierarchy of enterprise. At the top were thosestories labeled by the station as investigative, followed by noninvestigative series, followed by tough oncamerainterviews. At the bottom were video press releases put on the air. Sending an oncamera reporter to an event wasscored higher on the enterprise ladder than just sending a camera. The data showed a growing reliance on stories thatdid not involve having a correspondent cover a story.
In the first year of the PEJ study, for instance, 14 percent of stories were feeds from somewhere else. In 2002, the fifthyear of the study, the use of feed material had risen to 23 percent. Similarly, in the first year of the study, 9 percent ofstories were prearranged events, such as press conferences, in which the station sent a camera but had no oncameracorrespondent. By the fifth year, that, too, had risen, to 29 percent of all stories.
Also:
One in five stories (21 percent) involved stations responding to events such as traffic accidents or robberies.
And fewer than one in ten stories (7 percent) were investigative stories, noninvestigative series or includedsubstantive oncamera interviews.
abecker
Typewritten Text
abecker
Typewritten Text
Main Subjects of Local TV News Stories Main Subject Percent of Stories
abecker
Typewritten Text
abecker
Typewritten Text
Why is this the case? One reason, interviews in newsrooms suggest, is the sense that yellow police tape and flashinglights make for good television. But, to the contrary, studies correlating viewership trends to story lineup choices suggestthat leading newscasts with such stories does not build viewership.
Enterprise in Local TV News Stories
Form of Enterprise Percent of StoriesCoverage of “daybook” events with reporter present 26%Coverage of “daybook” events with no reporter on camera 22Wire/feed stories and stories attributed to another news source 22Coverage of spontaneous events 21Highlevel enterprise (e.g., investigations, news series, and tough interviews) 7Other 3
Source: PEJ Local TV News Project.Totals may not equal 100 due to rounding.
OneSidedness in Local News
The study also examined the balance of sourcing by first asking whether the story involved a controversy or dispute.“The school board approved a new bond issue today,” may be presented as fact. Whether or not all the citizens whosetax bills may be affected by the decision agree with the new bond is a matter that is probably in dispute. In storiesinvolving such disputes, did the reporting involve a mix of viewpoints, tell mostly just one side, or exclusively one side? 3
The study consistently found a distinct onesidedness to controversial stories. Indeed, in stories that involved somecontroversy, 60 percent of the stories told mostly or only one side. Another 40 percent contained a clear mix of opinions.This was true every year of the study, and though there were differences each year, no pattern emerged to suggest thatthis was an issue of resources or people being increasingly pressed for time.
Balance of Viewpoints in Controversial Local TV News Stories
Story Viewpoint 1998 1999 2000 2001 2002 TotalAll one opinion 43% 55% 46% 50% 43% 47%Mostly one opinion 12 16 9 13 11 13Mix of opinions 45 29 44 38 45 40
Source: PEJ Local TV News ProjectTotals may not equal 100 due to rounding.
Is Local News the Same Everywhere?
Some critics have suggested that local news has been so homogenized that it is the same everywhere – that the newsin one town looks just like the news in every other with no real connection to the local community. One reason,observers have argued, is that a handful of three or four television news consulting firms dominated the industry fromthe 1970s through the 1990s and impressed the same small set of conventional ideas on virtually every station in thecountry. As a consequence, local television news has no sense of place.
Is that critique fair?
The data in the PEJ content study suggest that the complaint about homogenization appears to be partly true butexaggerated. For instance, crime was the most popular topic almost everywhere (at 191 out of 242 stations studied).Still, that leaves more than 50 stations at which crime was not No. 1. (At some stations, as noted above, crime was aslow as 5 percent of stories.) The nextmost popular topic varied – from human interest at some stations to politics atothers.
There were some other differences that stood out as well. The most obvious was the variation in the number of storiesaired in a typical newscast. The average number is 14 stories, but there were stations which ran as few as 7 per nightto, in one case, a station that typically aired 27 stories.
The size of a station’s market had an effect on some aspects of local television news: stations in the smallest marketswere less likely to air sensational footage and more likely to cover social issues.
What may be more true is that the style – the look and feel of local news – rather than the substance, seemshomogenized. Local anchors tend to look alike and dress similarly. Almost all stations have adopted the “family model”– two anchors, usually a man and a woman, plus an amusing weathercaster and a jock newscaster. Older women arehard to find on newscasts, though older men are not. The graphics and sets are similar. So is the emphasis on live,local and late breaking. At least one reporter package starts with a live lead in, even if the event is hours old, and thestory unfolds according to format. And many gimmicks – “The News at Six starts now” intones the anchor breathlessly –are so common that they are clichés. But the charge that the news is the same on every station everywhere is, beyondthe style, unfair.
Footnotes
1. The content analysis in this section is based on a database of 33,911 stories from the 154 stations studied. Twoweeks of halfhour news programs were studied at each station: one sweeps week, and one nonsweeps week. Thetimeslot selected for study was the halfhour when the most people in the market were watching local news. For moreinformation, see Project for Excellence in Journalism, “Local TV News Project,” available online:http://www.journalism.org/resources/research/reports/localTV/default.asp.
2. The focus of the story was scored on a scale: for example, issues of public malfeasance were considered moreimportant than stories about celebrities.
3. The study counted how many sources were used in each story, and how many points of view were presented. Storiespresented as undisputed (a fire, the weather) were noted separately. In all other stories that involved some element ofcontroversy, the study counted how many points of view were included – just one, mostly one, or a mix of more thanone point of view.
See end of document for content analysis methodology.
abecker
Typewritten Text
abecker
Typewritten Text
AudienceAudienceWhen it comes to viewership of local television news, two trends stand out.
The decline in viewers that began in network news in the 1980s is now at play in local news as well, and this is puttingpressure on all facets of what people see.
The losses appear to be not as steep as at the networks, but in the six years of 1997 through 2002, the last yearavailable, network and local news broadcasts have lost at about the same rate, a little more than one share point ayear.
Collecting viewer data for local news is not as easy as for network news. It involves gathering statistics from 750 stationsthat produce local television news in 210 markets. But the evidence of the audience decline is consistent enough to beclear.
From 1998 to 2002, the Project collected Nielsen Media Research audience data for each station included in its contentstudy. In every year of that research, the vast majority of stations studied were losing audiences. In the year of thegreatest decline, more than 88 percent of stations studied were losing audience. In the best year, 72 percent of stationsstudied were losing audience.
Percent of Local TV News Project StationsLosing Audience, 19982002
Year Percent of Stations Losing Audience1998 82.0%1999 78.02000 88.52001 72.12002 84.9
Source: PEJ analysis of Nielsen Media Research data
Not only were most stations losing audience every year, but many of them also were losing people every ratings period,roughly the same rate each year. Over the course of the five years from 1998 through 2002, the average ratings loss wasabout 0.4 ratings points per year, or about 2 ratings points over five years. In a big market, like Chicago, this would beequivalent to losing 35,000 viewers a year. In a smaller market, like Wichita, it would mean losing 4,300 viewers a year.
This trend becomes even clearer looking at another audience measurement, the share of all television sets turned on at aparticular point in time. BIA Financial Network, or BIAfn, a media investment research company, collects data fromNielsen Media Research on every television station in the country. It found that from May 1997 to May 2003, thecumulative share of television sets turned to early evening local news had dropped 18 percent. The share of sets tuned tothe late news, after prime time, dropped by 16 percent.
Design Your Own ChartSource: BIAfn MediaAccess Pro
Average Late News Share
May 1997 to May 2003
Design Your Own ChartSource: BIAfn MediaAccess Pro
If one tries to imagine what this means for a mythical average local television station, the results become easier to grasp.The average early evening local television news station in the country in 1997 had a 19.4 share. Today, it has a 16.1share.
The average late local newscast (after prime time) in 1997 had a 22.3 share. Today that has dropped to 18.7 share. 1
What is the difference between ratings versus share? Ratings show the percentage of all television sets in the markettuned to a given program. Share tells us the percentage of just the television sets in use at a given time tuned to eachprogram – or something akin to market share. Thus the decline in share tells us fewer people who are watching televisionare choosing local news. But that might not tell the full scope of audience loss of local news since 1997. It does notmeasure those people who have turned off the television set altogether. That total audience loss could be greater than 18percent in early evening news, or it could be less. What the decline in share does tell us, however, is that more and morepeople who are still watching television are now watching things other than local news.
The issue, in other words, is not just that people have turned off the television set. They have turned off the news inparticular.
Average Early Evening News Share May 1997 to May 2003
Why? Here the research is varied and hard to pin down. Some of the reason for declining viewership is almost certainlydue to technology. There are more channels to choose from. Some sets that might have been tuned to local news arenow tuned to Nickelodeon, ESPN or the Game Show channel.
Some evidence suggests people are also less satisfied with what they see on local television news. A study conducted byNewsLab, an organization that helps television news operations with research and training, and executed at IndianaUniversity found that many people are deliberately avoiding local television news and getting their local news from othersources.
People who choose not to watch local television news offered specific reasons to explain why they had stopped watching.The most frequent responses that addressed local television content identified three problems: too much crime, too muchfluff and too much repetition.
Reasons Given for Not Watching Local TV News
Reason Given Percentage (More than oneanswer accepted)
You are not home when the news comes on 38.6%You are asleep when the late news comes on 36.6You get local news elsewhere 35.2You are too busy to watch when home 34.4There is too much crime on local TV news 32.0You are watching something else when the news is on 27.0Local news is always the same stuff 25.0There are too many fluff stories 24.6
Source: NewsLab
The NewsLab research is reinforced by a survey from a commercial concern called Insite Research, which found thatviewers felt there were fewer distinctions between newscasts and thus felt less loyalty to any one station. 2 [See alsoPublic Atittudes.]
Some of the decline in viewership, however, has nothing to do with channel preference but probably has to do withchanges in the way people live. Americans wake up earlier and commute longer. Indeed, as the chart above shows,roughly onethird of the news audience is no longer available to watch news because they are either commuting duringthe evening newscast or asleep by the time the late news begins. 3 One sign of this is the fact that, according to newsprofessionals, the most likely growth area for local news in most markets has been early morning news, before 7 a.m.This is why many stations now produce more hours of news, starting as early as 5 a.m. in larger markets. The trend hasincluded stations in large markets pushing the start of their morning news programs earlier and earlier, while midsizemarkets are adding morning news where they once aired syndicated shows. 4
Footnotes
1. Because share varies depending on the time of day and the number of viewers watching, it cannot be translated intoan exact quanitification of viewer loss.
2. Insite Research, “Television Audience Survey: Local Television News,” October, 1999.
3. Deborah Potter and Walter Gantz, “Bringing viewers back to local TV: What could reverse the ratings slide?”NewsLab.org. Online: http://www.newslab.org/research/bringback.htm.
4. For example, see Todd Bishop, “TV’s morning wars,” Philadelphia Business Journal, March 27, 2000, online athttp://www.bizjournals.com/philadelphia/stories/2000/03/27/story1.html; and Rich Kirchen, “Local news is getting up prettyearly in the morning,” The Business Journal of Milwaukee, August 2, 1999, online athttp://milwaukee.bizjournals.com/milwaukee/stories/1999/08/02/newscolumn2.html.
EconomicsEconomicsEven with the economy in the doldrums, the local television business is remarkably and consistently profitable. Onaverage, local television stations earn more than double the return of what newspapers earn, and the newspaper industryis among the most profitable in the country.
Just how profitable is local television? The evidence, much of it based on surveys, suggests that profit margins of around40 percent is not a bad estimate. For four years, the Project surveyed news directors on newsroom profit targets.Responses to this question were low, but the range of profit targets that news directors reported varied between a littleless than 30 percent and a little more than 40 percent.
Privately, however, news directors have told us, and other evidence supports the idea, that in larger cities the profitmargins could well be much higher. According to TV Week, for instance, Hearst Argyle, a company with largermarketstations and a reputation for high quality, earned profit margins in 2002 of 51 percent at its NBC affiliates and 42 percentat its ABC affiliates, “even though the ABC Television Network ratings declined 20 percent.” 1
The major issue facing local television news in the future is how to maintain these high profit margins when viewership isdeclining. Without increasing its audience, local television news has only limited ways to sustain profit margins, all ofwhich hurt the franchise: raise advertising rates despite a smaller viewership, shrink the news content to increase theamount of advertisements that can be shown, sell off news content with sponsorship logos and segments, or cut costs.
Local stations, though, still have some things going for them. At most stations, much of the physical plant is already paidfor. The licenses to run the stations are free. The only original programming most local stations do anymore is news –and their staffs are relatively small (an average of 31 people, according to surveys of the RadioTelevision News DirectorsAssociation, or RTNDA). On top of that, most local stations still receive payments from the networks for airing their newsand entertainment programs, although these payment structures are beginning to change. In addition, local stations getto use a portion of network programs to sell their own advertising.
Stations are being required to invest heavily in making their signals ready to be broadcast digitally while thecompensation they get from their networks is likely to come down. Many local stations also increasingly feel they are at afinancial disadvantage compared with cable, which is supported by both advertising and portions of the monthly fees paidby subscribers.
Over the last several years, local television revenue has bumped up and down but remained basically flat, according toBIAfn data.
Average Local TV Station Revenue
Nominal and inflationadjusted, 19952002
Design Your Own Chart
abecker
Typewritten Text
abecker
Typewritten Text
Source: BIAfn MediaAccess Pro* Only commercial Englishlanguage stations broadcasting news programs are included. Inflation adjustment is based on 2002 dollars
Average Revenue and Revenue Growth for All Stations
News Program Advertising as a Percentage of Revenue
Inside local television stations, news is particularly important because it is responsible for a disproportionate amount of astation’s income. According to RTNDA surveys, news accounts for 16 percent of a typical station’s programming each day(slightly more than three hours), but news programs represent roughly 40 percent of station revenue. The evidencesuggests that the percentage of revenue from news may not be affected much by hard times. Data from the RTNDAsurveys, for instance, show that the share of revenue from news was slightly higher in 2001 than it had been in 1999,even though 2001 was a down year in the economy and 1999 was near the end of the 1990s boom. 2
Percentage of TV Station Revenue Produced by News Programs, by Market SizeAverage of All Respondents
There are signs, however, that the local television news business is getting harder or maybe that there is getting to be aseparation between the winners and losers. Surveys conducted by the Radio Television News Directors Association showthat in 1996, 62 percent of news directors reported that their newscasts had made a profit. That percentage begandropping in 1998, and has steadily trended slightly downward since, to 55 percent of news directors in 2001 reporting aprofit. Eleven percent reported losing money. The rest were either breaking even or didn’t know. It is difficult to knowwhether the declining number of news directors reporting profits is due to rising expenses, declining viewership oreconomic cycles, but likely some mix of all three is at play.
abecker
Typewritten Text
abecker
Typewritten Text
Source: “RTNDA/Ball State Annual Survey,” survey of local television news directors
abecker
Typewritten Text
abecker
Typewritten Text
abecker
Typewritten Text
Source: BIAfn MediaAccess Pro; Dollar figures are in millions of dollars
abecker
Typewritten Text
Percentage of respondents in each market grouping reporting profit or loss
Design Your Own ChartSource: “RTNDA/Ball State University Annual Survey”
Market Size And Profitability
Market size makes a difference in local television. The biggest markets – and, thus, the biggest stations – capture thelion’s share of revenue in good times or bad. As the chart below indicates, stations in bigger markets make higherrevenue disproportionately to the number of households in their viewing area. Not only do stations in big cities makebigger revenues, but they also make a higher percentage of revenue per household: the 25 biggest markets contain 49percent of the country’s television households, but they receive 60 percent of local television revenue.
One thing that could make matters even harder for stations in smaller markets is that the cost of converting to digital isnearly as much for a station in the 150thlargest market in the country as it is for the station in the fifthbiggest marketsince the equipment is the same.
TV Station Revenue Compared to U.S. Population, 2002
By market size
Design Your Own ChartSource: BIAfn MediaAccess Pro* Chart compares percentage of all TV station revenue to percentage of all TV households.
In the end, broadcast stations have been able to keep their revenues healthy despite declining viewership for a simple butsignificant reason: In a fragmented media market, their audiences are still large and diverse enough to approximate theclosest thing TV advertisers can still get to a mass audience. But as indicated above, stations have protected the bottomline through a variety of meansfrom cutting costs to adding more commercials to creating sponsored segments, puttingsponsor logos inside programming on weather maps or sports scores to looking for other revenue opportunities. All ofthese weaken the product, making it more cluttered, smaller and mixing news and sponsorship. The question is how longtelevision stations can keep up these alternative ways of building revenue amid declining viewership.
Footnotes
1. See Diane Mermigas, “HearstArgyle aims for new biz opps,” TV Week, September 15, 2003. Available at:http://www.craini2i.com/em/archive.mv?count=3&story=em516732287025518840.
2. The sources for this information were the “RTNDA/Ball State Annual Survey,” a survey of local television newsdirectors, and the financial data gathered by BIA/fn. A breakdown by market size suggests this was true across the board,but in 2002, differentsized markets seemed to rebound at different paces.
OwnershipOwnershipThe main trend in television station ownership has been that of a few of companies growing bigger, with the gap inrevenue between the biggest and smallest companies growing larger.
While the status of the latest FCC regulation remains unresolved, the changes in television ownership debated in 2003have their roots in deregulation that began in earnest in the 1980s during the Reagan administration, when the advent ofcable persuaded a new generation of regulators that federal requirements on programming of the public airwaves were nolonger necessary. The shift, however, is by no means a Republican move. The real change in ownership trends began in1996, when the Clinton administration won passage of a law that loosened regulations so that, for the first time, a singlecompany could own more than 12 stations. It also allowed companies to own stations that reach as much as 35 percentof American television viewers. It maintained rules banning ownership of more than one television station in all but thelargest markets and, with some exceptions, banning ownership of a television station and a newspaper in the samemarket (also known as crossownership).
The next six years saw a rash of mergers and acquisitions of local television stations. The ChrisCraft station group waspurchased by News Corp., creating FoxUPN combinations in some of the country’s biggest markets. HearstArgyleTelevision purchased the broadcast stations owned by the Pulitzer Company. Lee Enterprises, a newspaper publisherheadquartered in Davenport, Iowa, sold its television stations to Emmis Communications in 2000.
Many companies have added assets in anticipation of the FCC further relaxing ownership rules and have received waiversfrom the FCC when their new acquisitions violated the existing rules. Several companies were in technical violation of therules as they stood in 2003, including Viacom and News Corp., each of which owned stations covering more of thecountry than the ownership rules allowed. The Chicagobased Tribune Co. purchase of the Los Angeles based TimesMirror Company in 2000 required multiple FCC waivers because the merged company owns televisionnewspapercombinations in New York (WPIX and Newsday) and Los Angeles (KTLA and The Los Angeles Times).
Many smaller television companies, meanwhile, are eager to see relaxation of the ownership rules, particularly thoseinvolving crossownership and duopolies (owning more than one station in a single market). But they are also wary of theimpact of bigger companies gaining more power. In particular, they worry that if the networks own more stations they willhave too strong a hand when it comes to negotiating things like the number of commercials local stations are allowed tosell during primetime programming.
By 2003, the local television landscape had broken down into four levels. The four major networks together owned 126stations, mostly in the biggest cities and in all areas of the country. All four companies, for example, own stations in thefour biggest television markets.
Average Station Revenue for HighestRevenue Station Groups
Design Your Own Chart Source: BIAfn MediaAccess Pro
They were followed in size by a group of major chains that were more regional, such as Belo (concentrated in Texas andthe Northwest) and Gannett (which owns stations in most of the Southeast’s biggest markets). Most of these stationgroups are owned by companies with substantial investment in other media sectors, including the Hearst and Tribunecompanies, and they are often involved in business relationships with the four major networks.
Next came mediumsized chains. Some of these groups have investments in other areas of the media, but they aregenerally too small to attract deals with the networks and their involvement in the television business is limited to whatthey receive from local station revenue.
Lastly, there are small chains clustered in midsize and small markets, many of them formed by investors who acquire andswap stations and eventually sell them to larger companies.
Vanishing were the local owners with one or maybe two stations.
Consider just the top 10 biggest local television companies, which include the four networks and most of the majorchains. 1 In 1995, these 10 local television station owners had $5.9 billion in revenue and owned 104 stations. By 2002,those companies had doubled that revenue total and owned nearly three times as many stations.
For now, the deregulation trend may have been suspended anyway. The FCC’s vote relaxing ownership rules wasthwarted by Congress, and even the FCC came up short of eliminating the federal limit on what percentage of the U.S.population one company could reach with its stations. The limit going into 2003 was 35 percent and the FCC consideredeliminating caps altogether. Instead, it chose to raise it to 45 percent. In all but the smallest markets it also loosenedrestrictions on crossownership, permitting newspapers to purchase television stations, and also permitting companiesthat already own one station in a market to purchase others, dependent on the total number of stations in the market. Insome markets coownership of three stations is possible.
But even that proved too much for Congress. The House of Representatives inserted a provision in an appropriations billthat essentially forbids the FCC from taking any steps to enact the lifting of the ownership cap. The Senate passed a“resolution of disapproval” that would invalidate the FCC regulations. President Bush signaled that he would veto a billthat stopped the implementation of the new ownership regulations; in late November the White House and Congressnegotiated a deal that would raise the ownership cap to 39 percent, thereby keeping Fox and Viacom within the limits ofthe law. Under the omnibus spending bill signed into law by President Bush in January 2004, the 39 percent cap becamefederal law and no longer subject to biennial FCC review, making it difficult to overturn.
Meanwhile, in September 2003 a federal appeals court in Philadelphia ordered a stay of all the new ownership rules inresponse to a suit from a small radio company, declaring that “if it had not delayed the order, the challengers would lose‘an adequate remedy should the new ownership rules be declared invalid in whole or in part.'” 2 Arguments on the casebegan in February 2004. This has essentially frozen action on crossownership and duopolyrelated transactions until thelaw is clarified.
There are various reasons why the FCC ran into trouble. Depending on your point of view, it may have been overreachingon the part of the FCC, poor political management by Powell, the FCC chairman, public opposition to concentration, or arare bipartisan coalition against concentration that includes everyone from the usually antiregulatory National RifleAssociation to liberal groups who favor strong government regulation like the Media Access Project.
Regardless of where the regulatory battle ends, two points seem clear for now:
Consolidation and deregulation have already transformed the media landscape and are not likely to go away.
The public and politicians from both parties have, for the first time, sent signals that they are concerned about thepossible consequences of further deregulation and consolidation: a decline in the quality of the local television news.
Current trends suggest that the corporate ownership group model, with everything it implies – more centralized profittargets, sometimes added debt, outoftown management, the opportunities for and sometimes the demands of synergy,potentially superior management and resources mixed with the risk of viewing local news as a commodity in a portfolio –is the biggest influence affecting the future of local television news.
One thing to watch will be whether – and how – ownership groups try to integrate their assets, using centralcasting andother technologies.
There has been a lull in the industry in the past year as stations have tried to recover from the recession and the FCC hasbeen in the process of drawing up new ownership rules. This may well continue until a final resolution to that processappears. How that resolution will come about – whether in the courts, the Congress, or the White House – remains up inthe air.
On the one hand, it seems more than likely that local television news will see a continuing slow decline in viewers, just asnetwork programs are experiencing. It is hard to imagine anything happening that will sharply improve the content of localtelevision news. But it is possible to imagine that the digitaltransition could lead to an entirely different kind of televisionthat would essentially eliminate local stations in much of the country. This would seem particularly plausible with higherownership limits.
As it is now, affiliates generally have the same interests visàvis the networks, whether they are owned by Fortune 500corporations or a group of family members. But if the networks are able to own more stations in the biggest markets, theycould pose a major challenge either to small owners or perhaps even more to regional heavyweights like Hearst and Belo.These midsized companies might have to grow bigger or be bought. In the past, the big broadcast networks have shownless interest in owning stations in smaller markets. The WB network, however, provides a template for what could happennext. In 109 markets (basically, the smallest markets), WB network programming is distributed via cable exclusively. A“station in a box,” or SIB, is placed with a local partner in each market, usually a cable provider or a station affiliated withanother network. The WB network transmits programs via satellite to the SIBs, complete with national ads. The SIB doesmost of the work, automating the order in which programs are played and inserting localized bits of information (like thestation’s call letters) where necessary. 3 Is it possible that the networks could one day decide to cut loose their affiliatesand instead deploy SIBs throughout the country in spots where they do not already own television stations? In that case,the networks would become something not very different than the cable channels.
Footnotes
1. Including Tribune, Gannett, Hearst, Sinclair, Belo and Cox.
2. See Lyle Denniston, “Court delays FCC rules on media,” Boston Globe, September 4, 2003, p. C1.
3. See Kathleen O’Steen, “Tech wizardry controls network,” TV Week, September 22, 2003, p. 18.
News InvestmentNews InvestmentThe story in newsrooms is that once again technology is revolutionizing how television professionals prepare local news.There are several clear trends:
Many newsrooms are being asked to produce more hours of news without adding people to do the work, and in somecases with fewer people.
This is changing the product people get – in some cases thinning and hollowing out the kind of news that is aired, inother cases creating local news that is less local and more based on “feed” material from other places.
A few companies are moving toward what is being called “centralcasting,” in which some of the people on localnewscasts are not local at all. The weather and some anchors are actually in other cities, though viewers may neverbe told.
Many stations also take advantage of “hubbing,” in which they purchase specialized news content from a local providerfor things like metro traffic reports, helicopters and other material. A few stations are now experimenting with gettingthings like sports reporting, including the anchor, from these outside firms, which send out teams of people to shootlocal sports events for multiple clients.
A few companies now own more than one station in a city and sometimes produce news for two stations from onenewsroom.
Television stations do not tend to have that much newsgathering muscle, at least when compared with the newspapers intheir communities. In 2001, for instance, the last year for which there are data, the average local television newsroom inthe country had 30.7 fulltime people on the “news staff,” according to survey work from RTNDA. 1
Moreover, the number of television news staff members per station has changed little over recent years, despite the factthat most television stations are producing more hours of news.
According to PEJ’s 2002 survey of news directors, threequarters of local newsrooms have assigned beats. Among thosebeats, medicine/health reporters were most common (42 percent) followed by crime or court beats (38 percent), education(37 percent), investigative (25 percent), consumer news (24 percent) and government/politics (24 percent). However,many of these positions are not fulltime beats, and instead reporters may have responsibility for covering news in aparticular field in addition to their “general assignment” coverage of everyday news.
Each year that the Project analyzed television station content, it also surveyed the news directors at those stations aboutworkload. Put together, those surveys show that the average workload per local television reporter is rising rapidly. From1998 to 2002, the average workload that news directors reported demanding of reporters increased from 1.5 stories a dayto 1.8, an increase of 20 percent.
These pressures are hitting news professionals hard. In the Project’s 2002 survey of local television news directors, theywere most likely to cite “Not enough staff” as the chief obstacle to producing better newscasts. 2
In addition to fewer people, the Project’s news director surveys show that budget cuts have had a substantial effect ontelevision newsrooms as well. The most severe cuts came in 2001, when 49 percent of all news directors reported eitherbudget or staff cuts over the year before, and 60 percent reported unscheduled midyear budget cuts. In 2002 things weremuch the same: 59 percent of news directors reported either budget cuts or staff cuts.
Design Your Own ChartSource: “RTNDA/Ball State University Annual Survey,” 1998 through 2001
Pessimism hangs over newsrooms. As one news director put it in 2001, “People come to work every day wondering ifthey’re going to be fired.” In our 2002 survey, 45 percent of all news directors felt that local television news was headedon the “wrong track,” while less than a third (31 percent) were optimistic.
Changes in newsgathering technology are also changing the kinds of stories that get on the air. The Project’s contentstudy of local news over five years shows that stations appear to be using more of this outoftown feed material in theirnewscasts. In 1998, such feeds accounted for 14 percent of all stories. In 2002, that percentage had grown to 23 percent.
Is the gap simply a result of the Project examining different stations in different years? The answer appears to be no.When we looked at specific stations studied in both 1998 and 2002, the use of feeds had nearly doubled, from 12 to 23percent.
New technology is also creating tapeless newsrooms, which reduce the need for certain kinds of technical staff. Intapeless newsrooms, all stories are recorded using digital cameras, producing footage that can be stored on computerservers rather than bulky videotape archives. Cameras that are easier and less cumbersome to operate make it possiblefor reporters to shoot their own stories as they are reporting them rather than using a camera operator. Digitized archivesmake it easy for stations to call up footage from any story they choose, whether it is from a monthsold newscast or theday’s satellite feed. An additional advantage is decreasing the likelihood of technical difficulties during a newscast, sincea digitized system allows for better backup and reduces the chance of technical error. 3
All this is leading some companies to experiment with the different forms of sharing engineering, synergy and“centralcasting.” By whatever name, they all refer to some version of producing newscasts for more than one station outof a single facility.
In some markets, companies have bought more than one station and are producing two stations’ newscasts from onenewsroom. In one such case, in Boston, Viacom owns both the UPN affiliate, WSBK, which produces a onehournewscast at 10 o’clock, and the CBS station, WBZ, which airs a halfhour news program at 11 o’clock. There, as in manyother markets, a great deal of thought was put into how to differentiate the newscasts from each other in hopes ofappealing to each station’s desired audience. The solution in Boston was to create a rotating anchor desk that can beshifted in front of two different backgrounds. 4
In some other cities, companies are trying to achieve similar cost cutting by producing newscasts that air in more thanone city from a single location. This is what is more commonly thought of as centralcasting. Bahakel Communications, forexample, owner of WOLO in Columbia, S.C., now produces WOLO’s newscasts from its Charlotte station, WCCB, 90miles away. Emmis Communications, a television and radio station owner headquartered in Indianapolis, programs itsSoutheastern stations from a hub in Orlando, Fla.; at those stations, the newscasts are the only locally producedelements. 5 In a presentation to investors in August 2003, NBC announced that it had gone from having master control
Average Full-Time Staff Levels Survey of news directors, 1998-2001
abecker
Typewritten Text
abecker
Typewritten Text
and graphics operations at each of the 29 NBC and Telemundo stations to a system of four hubs scattered around thecountry doing the same functions, with a resulting $30 million in savings. 6
Dallasbased A.H. Belo Co. is using technology to create a slightly different kind of regional news synergy. Belo ownsstations in the four biggest markets in Texas and operates a 24hour Texas news channel, which relies on material fromits various properties.
The Sinclair Broadcast Group, outside Baltimore, is trying the bestknown example of such integration. The Sinclairgroup’s “News Central” beams “localized” weather and sports segments from its Maryland headquarters to stations aroundthe country, along with national and international news reports and even editorials. According to a company executiveinterviewed by the trade magazine TV Week, full implementation of “News Central,” it is hoped, will halve the company’slocal news costs. 7 At the same time, Sinclair’s technology is also bringing news to some stations that were not producingit before.
TV Newsrooms Outsourcing Content, by Affiliation, 2001
Survey of news directors
Design Your Own ChartSource: “RTNDA/Ball State University Annual Survey,” 2001.* Multiple responses accepted; totals do not equal 100.
A station continues to have incentives to keep local newscasts as part of a station’s offerings. Station managers believethat providing a news program boosts a station’s prestige and makes it more attractive to advertisers.
Companies will surely make arguments about the journalistic benefit of these moves, but the immediate costeffectiveness is the driving incentive. In the current climate, there are companies that believe quality will win out, andthere are companies that do not. But the financial markets are not rewarding risky investments that do not promise costsavings.
Meanwhile, news directors are trying to figure out how to move forward. According to PEJ’s 2002 survey of localtelevision news directors, most believe that the cutbacks have stopped, but they are not sure what the future holds.
Footnotes
1. RadioTelevision News Directors Association, “RTNDA/Ball State University Annual Survey,” 2001, chart “TV StaffSize,” available at http://www.rtnda.org/research/staff.shtml. The RTNDA surveys define news staff as all individuals whoreport to the news director (usually including reporters, assignment editors, producers, photographers, camera operators,etc.).
RTNDA is the world’s largest professional organization devoted exclusively to electronic journalism. RTNDA representslocal and network news executives in broadcasting, cable and other electronic media in more than 30 countries. RTNDFpromotes excellence in electronic journalism through research, education and training for news professionals andjournalism students. The Foundation’s work is supported by contributions from foundations, corporations, members of theRadioTelevision News Directors Association, and other individuals. Its code of ethics can be found here:http://www.rtnda.org/ethics/coe.shtml.
2. “On the road to irrelevance,” Columbia Journalism Review, November/December 2002, online athttp://www.journalism.org/resources/research/reports/localTV/2002/irrelevance.asp.
3. See Kal Hassan, “WLSTV’s tapeless news upgrade,” Broadcast Engineering, April 1, 2003, which describes theprocess of digitizing the newsroom of WLS in Chicago, available athttp://broadcastengineering.com/ar/broadcasting_wlstvs_tapeless_news/.
4. See James Careless, “News sets on a budget,” Digital TV, January 2003, online athttp://digitaltelevision.com/articles/article_145.shtml.
5. See Dwight Crumb, “Centralcasting at WALATV,” Broadcast Engineering, March 1, 2003. The changes at WALA, inMobile, Ala., have included the installation of robotic cameras on the station’s news set in order to eliminate the need forhuman camera operators. Available at: http://broadcastengineering.com/ar/broadcasting_centralcasting_walatv/.
6. Randy Falco, group president, NBC television network, “NBC overview,” presentation, September 19, 2003. Online:http://www.ge.com/files/usa/company/investor/downloads/091903_nbc_handout.pdf.
7. See Daisy Whitney, “Centralcasting on the move,” Electronic Media, January 27, 2003, available athttp://www.tvweek.com/newspro/012703centralcasting.html.
8. Digital television is not the same thing as highdefinition television. Highdefinition television sets have the ability todisplay digitalquality content (such as DVDs), but they require special tuners in order to receive digital broadcast signals.According to industry estimates only 1 in 4 highdefinition television sets is being sold with a digital tuner.
9. See Brad Schultz, “Digital TV conversion still mired in uncertainty,” RTNDA Communicator, April 2003, online athttp://www.rtndf.org/technology/dtcsmiu.pdf.
10. For example, see John Heilemann, “The digital TV giveaway,” Wired, April 25, 1997, online athttp://www.wired.com/news/politics/0,1283,3399,00.html.
11. The plan to auction analog spectrum, drawn up in 1997, was intended to be one of the ways in which Congressbalanced the budget. See Brad King, “If DTV’s busted, so is the budget,” Wired, August 6, 2002, online athttp://www.wired.com/news/digiwood/0,1412,54332,00.html.
12. See Stephen Chiger, “FCC throws its weight behind DTV,” Medill News Service, August 8, 2002.
13. See Paul Davidson, “Local stations multicast multishows,” USA Today, January 28, 2004, online athttp://www.usatoday.com/money/media/20040128multicast_x.htm.
14. Cable boxes have the technological capacity to block subscribers from seeing more than one local newscast, which isimpossible with overtheair signals.
15. See GAO Reports, “Additional Federal Efforts Could Help Advance Digital Television Transition,” November 8, 2002,p. 15, online at http://www.gao.gov/new.items/d037.pdf.
Public AttitudesPublic AttitudesAmid everything one can say about local television news, the most striking public attitude toward local television is trust.Over the years survey after survey have shown a consistent pattern: when asked to rate different news mediums, peoplegenerally trust local television more than any other type of news. (When it comes to individual channels, CNN has cometo be considered more credible, according to surveys.)
Believability of News Media
Percent of public rating medium highly believable, 1985 to 2002
Design Your Own ChartSource: Pew Research Center for the People and the Press, ‘‘News Media’s Improved Image Proves ShortLived,’’August 4, 2002* Survey question: “How would you rate the believability of (item) on [a] scale of 4 to 1?”
While local television news still outpolls the broadcast news divisions and local newspapers for believability, the public’strust is diminishing. In 1985, a third of the public (34 percent) said they could believe “all or most” of what they saw onlocal television news. In 2002, that had declined to onefourth of the public (26 percent). 1
The surveys also support what was indicated by the Nielsen ratings data. The public continues to turn to local televisionnews more than any other television news source, but its influence is waning. In 1993, 76 percent of the public said they“regularly” turned to local television news for information. By 2002, that figure had fallen to 57 percent. Nonetheless, localtelevision holds a large lead over its closest competitor, network television news. In 1993, 58 percent of the public turnedto network news “regularly,” but that fell to 32 percent by 2002. 2
Design Your Own ChartSource: Pew Research Center for the People and the Press, ‘‘Public’s News Habits Little Changed by September 11,’’June 9, 2002* Survey question: “Now I’d like to know how often you watch or listen to certain TV and radio programs. For each thatI read, tell me if you watch or listen to it regularly, sometimes, hardly ever, or never.” There are some other reasons, perhaps, for local news professionals to be wary when public attitudes toward the mediumare examined. There is a big gap – and a potential problem for journalists – between what the public thinks of localtelevision journalism and what the people who produce it think.
A large portion of the public, for instance, thinks think powerful outside forces – such as advertisers – “improperlyinfluence” what news professionals present on broadcasts. Large numbers also do not feel that television news addressestheir concerns. The television news people do not think there is any problem.
In some cases, the gap in perception between viewers and journalists about local television news is so large that,regardless of which group is right, the gap itself is a problem that needs to be addressed. Yet the fact that journalistsseem so selfsatisfied raises questions about whether they are ready to deal with it.
The gap is probably most noticeable when it comes to the question of outside forces improperly influencing newscasts.Fully 42 percent of the public think advertisers improperly influence the news, according to surveys from Bob Papper atBall State University. And 40 percent think station owners do. 3
Yet only 6 percent of news directors perceive improper influence by advertisers and only 7 percent by owners. Do thenews directors think there is no influence, or only that that influence is not improper? It isn’t clear.
There are gaps in perception between the two groups of 36 and 33 percentage points. Even if one assumes the newsdirectors are right and the public is wrong, this represents a serious perception problem for local television news.
Percent of General Public and News Directors Saying Local TV News Is “Often” Influenced by Specific Groups/Individuals
General Public News Directors MarginAdvertisers 42% 6% 36%Station Owners 40 7 33Big Business 37 7 30Elected Officials 30 7 23Federal Government 28 5 23Interest Groups 27 8 19
Percent of People Regularly Using Specific News Media 1993 to 2002
abecker
Typewritten Text
Source: Radio-Television News Directors Foundation, “2003 Local Television News Study of News Directors and the American Public”
There is a similar perception gap over the question of whether local television news responds to viewer concerns. Fullyfour out of ten viewers (41 percent) think it does not or are unsure. Yet a whopping 95 percent of news directors think theindustry does. When survey researchers asked people who had contacted a local television news station about having aconcern addressed, respondents said by a 3to1 margin that the station had failed to do so.
The public is also much more likely than news directors to believe that television reporters allow their personal opinions toaffect how they cover the news: Nearly a quarter of the people (22 percent) say they think the local television newsreporters are “often” biased in their reporting, and 42 percent think it “sometimes” happens.
Yet only 8 percent of news directors see bias as a frequent problem and 46 percent see it as an occasional problem.
Finally, part of the perception gap concerns the ability of local news to handle complex issues. A majority of the public(52%) tend to think (“strongly or mildly agree”) local television news shies away from the complex, compared with 30% ofnews directors.
There is consensus in the research about what people want from local television. When asked what one quality theywould like their local television newscast to emphasize, both the public and news directors put “thorough and complete”coverage of important local stories as their No. 1 priority, with 53 percent of the public putting this first and 71 percent ofnews directors putting it first. But the public is more likely than news directors to say that they wish their local newsbroadcast would emphasize investigations and be unafraid “to take on powerful people and business.” Twentyninepercent of the public said that would be their first choice in a newscast, while only 16 percent of news directors wouldmake that their first priority.
Factors Often Influencing Local TV News
General public opinion vs. news director opinion
Design Your Own ChartSource: RadioTelevision News Directors Foundation, “2003 Local Television News Study of News Directors and theAmerican Public”
Footnotes
1. Pew Research Center, “News media’s improved image proves shortlived,” August 4, 2002, 2002 Believability SurveyFinal Topline, question 9, online at http://peoplepress.org/reports/print.php3?PageID=631.
2. Pew Research Center, “Public’s news habits little changed by September 11,” June 9, 2002, 2002 Biennial MediaConsumption Survey, question 20, online at http://peoplepress.org/reports/print.php3?PageID=618.
3. All references in this section are to RadioTelevision News Directors Foundation (RTNDF), “2003 Local Television NewsStudy of News Directors and the American Public,” online at http://www.rtndf.org/ethics/2003survey.pdf
ConclusionConclusionIn the end, the issue for local television is similar to that for newspapers. It is such a robust business that decliningviewership has not hurt revenues. Yet even more than newspapers, local television news invests little in improving theproduct. Most of the investment going on is technological and has been mandated by the government in exchange forbandwidth.
Yet the product is getting thinner, and newsrooms are clearly being stretched. Now that local television news is losingviewers as fast as the networks, that basic business approach seems questionable. Television, moreover, appears to behurt more by the Internet than print, and clearly the potential of local news Internet sites raises that threat even more.The Internet will allow a print outlet in a town to challenge the greatest assets of the local television station immediacy,availability and the ability to update.
The answer would seem to be convergence and improving the product. The industry seems disposed to do theconvergence, but there is too little evidence that it is committed to improvements. Indeed, most of the evidence wouldseem to suggest the opposite.
IntroMagazines often are harbingers of change. When large social, economic or technological shifts begin to reshape theculture, magazines frequently are the first media to move, and the structure of the industry is one reason. Unlikenewspapers, most magazines are not so tied to a specific geographic area, but are instead centered on interests orniches. Writers are looking for trends. Publishers can more quickly than in other media add and subtract titles aimed atspecific audience segments or interests. Advertisers, in turn, can take their dollars to hot titles of the moment aimed atparticular demographics.
One can, if careful, look at what is happening in the magazine industry and get a reasonably good idea of what theculture at large is interested in and where it may be heading. Magazines 40 years ago, for instance, signaled early signsof the social fragmentation so commonly understood today with the decline of general interest magazines like Look andthe rise of specialty magazines like Psychology Today.
What do magazines tell us about the culture today and the future of magazine journalism, particularly news?
First, the news agenda has gotten softer and more oriented to lifestyle rather than traditional hard news.
Second, the audience for news in magazines is fragmenting. The large, wellknown general interest news weekliescontinue on their mission of reaching a mass audience with fair to moderate success. But a small group of newsmagazines with a very different approach to the coverage, such as The Atlantic, is seeing gains. These magazines haveeschewed the conventional wisdom about the need for more pictures and lighter stories. Instead they rely on fewerphotos and deal with serious topics. Aimed at a more educated audience, they seem less concerned with getting asmany readers as possible and are more focused on getting the right readers. They come out just once a month andcharge more per subscription, yet their circulation is growing. Their ad revenues are not near the massmarketcompetitors, but they are growing.
Beyond these overarching shifts, other magazine trends emerge in the data:
The overall number of magazines is growing, but much of that is occurring in niche service magazines such as childcare, travel or bicycling.
The largest and most powerful magazine owners are largely not involved in the service niche. Instead, they areheavily invested in pop culture and entertainment magazines, which have also seen large growth in the last decade.
There is less interest at the corporate level in traditional news. With a few relatively minor exceptions, publishers arenot launching new titles. Among the magazines that exist the audience is flat even as the population grows.
Perhaps as a result, coverage in the general interest news weeklies (Time, Newsweek and U.S. News & WorldReport) is edging into lighter areas such as pop culture, health and service. To survive, they are becoming lessspecialized experts in anything and more a lighter version on every topic.
The vast majority of the highprofile opinionmaking magazines – everything from Time to Esquire to Vanity Fair –are owned by one of three big media companies.
Overall, the magazine industry is healthy, but its landscape is very different than it was even 10 years ago, let alone 20.
Content AnaylsisContent AnalysisWhat are Americans getting from news magazines going into 2004?
The short answer:
News magazines have bucked the trend toward specialization by becoming softer in content and specializing in little,not even hard news.
The big three magazines have split into more distinct personalities.
Newsweek has become the least traditional or serious while U.S. News sits at the other end of the spectrum and Timelies in between.
To get a sense of how magazine journalism has changed, we looked at the content of the three longstanding weeklynews magazines. First, we examined 20year data from Hall’s Reports, a Stamford, Conn.based research firm whichmeasures the number of editorial pages in the magazines by category – national affairs, culture and business. The dataindicate that these magazines are very different publications from each other and very different than they used to be. At atime when the industry trend overall has been toward niche publications, news magazines have actually become moregeneral. No longer summaries of the week’s hard news – a chronicling of the significant events in the nation and world,they now do a bit of everything, and do very little as in depth as they once did. The expansion of coverage has come inparticular at the expense of what is considered more traditional news of government, public policy and the economy. Insome ways, the news magazines might be analogous to the morning news shows on television, a hybrid assimilating alittle of all styles in one place.
First, there are more pages of editorial content. Editorial pages have increased 9 percent since 1980, even as ad pageshave declined, according to data from Hall’s Reports. 1
Number of Pages in News Magazines
Advertising and editorial in Time, Newsweek and U.S. News
Design Your Own ChartHall’s Media Research unpublished data* 2003 data is January to July
What is in those pages has also changed. Pages devoted to national affairs, for instance, dropped by 25 percent from1980 to the first half of 2003, according to Hall’s. There is less news on high culture such as museum reviews (13 percent
in 1980 versus 10 percent in 2003), and, perhaps surprisingly, a smaller percent of pages devoted to business (11 percentversus 9 percent). 2
The number of pages devoted to international news dropped off significantly after the collapse of communism but in 2003has risen back up, due in large part to September 11th and the war in Iraq, to roughly the same level as in 1980. 3
What subjects now take up the pages? The space devoted to entertainment and celebrity stories have roughly doubledsince 1980 (and now account for 7 percent of the pages). 4 Lifestyle coverage has grown from a scant 1 percent in 1980to 4 percent in 2003 . Health news, which often translates to news you can use rather than medical science, has morethan quadrupled (from 2 percent in 1980 to 9 percent in 2003). 5 The three news magazines, particularly Time andNewsweek, have added pages directly from the genres that have seen the largest rise in circulation. 6 (See MagazineAudience)
News Magazine Pages by Topic, 1980
Time, Newsweek and U.S. News, total pages
Design Your Own ChartHall’s Media Research unpublished data
News Magazine Pages by Topic, 2003
Time, Newsweek and U.S. News, total pages
Design Your Own ChartHall’s Media Research unpublished data* 2003 data is January – July
Select years 1980 – 2003, Time, Newsweek and U.S. News
Design Your Own ChartHall’s Media Research unpublished data* 2003 figures January – July
A Closer Look At 2003
In addition to the longitudinal data from Hall’s about what topics got the most space, we wanted to take a closer look atthe news magazine genre in 2003.
To do so, the Project did two analyses. First, it analyzed the cover stories of all three magazines for the year – Januarythrough the first of December. Next, it analyzed in greater detail every story in each of the magazines for four weeks ofthe year, corresponding to the weeks studied for other media in this report.
What we found on one level reaffirmed Hall’s research: today news magazines offer a little of everything and none of themagazines anymore can be described as a summary of the week’s news. 7
But there are three distinct personalities now between the three magazines, perhaps more than there once was.
U.S. News & World Report, the smallest of the three in circulation and in ad revenue (See Magazine Audience andEconomics), is the most informationladen, the most likely to highlight traditional hard news topics and the most likely toreport in a neutral manner – a more straightforward accounting of the facts of events with less of a writer’s “take” oropinion on what those events mean.
Newsweek is lighter, more oriented toward lifestyle and celebrity coverage, and more likely to publish stories that containan emotional component.
Time magazine is something of a hybrid between the two. Its content is more like U.S. News’ – neutral and informationdriven. Its covers, on the other hand, look a good deal more like Newsweek’s – highlighting lifestyle and entertainment.
The Year in Covers
These distinct personalities are particularly evident in the 2003 covers. The situation in Iraq was the most common coverstory of the year at all three magazines. Time put the war on the cover 15 times (out of 48 issues studied), Newsweek 14times, and U.S. News 12.
But after that, differences emerge. Aside from Iraq, for instance, Time and Newsweek were most likely to go with alifestyle cover, such as health, dieting, or the outbreak of severe acute respiratory syndrome, or SARS. Newsweek had 11
such covers, Time 10. U.S. News, by contrast, had half as many, 5.
The lifestyle topics in Time and Newsweek, moreover, often were about how Americans behave: “She works, he doesn’t”(Newsweek) or “The Secrets of Eating Smarter.” When U.S. News did a lifestyle cover, it often tended toward a referenceissue one might keep, such as an annual career guide or a consumer survival guide.
At U.S. News, rather than lifestyle, the second most common cover topic was a domestic social issue or historical matter,such as a cover package of stories about antiSemitism in America, oceanic pollution, architecture or the history of flight.It had 10 such covers. Time had just one domestic issue cover (about health care). Newsweek had five.
Add in the economy, and the differences between the three are more pronounced. U.S. News did two covers on theeconomy. Neither Time nor Newsweek did any during the 48 weeks.
U.S. News also stands out in its treatment of popular culture and celebrity. Time and Newsweek each had fourentertainment covers. U.S. News had none.
The covers, too, show a marked shift over time. In an earlier study, PEJ compared the cover stories of Time andNewsweek in 1977 and 1997. Over those twenty years, there was a clear decline in government and domestic affairscovers as well as foreign affairs. Softer news areas like entertainment, personal health and science received more coverplay. 8 In 2003, the war in Iraq dominated magazine covers throughout the year. Foreign and military coverage togetherrepresented 31% of cover stories in 2003 (compared to less than 10% of stories in 1997). Otherwise, trends toward softernews continued as the percent of covers about health rose to 18% at both Time and Newsweek (from 6% and 2% in1997) and covers devoted to domestic issues like affirmative action and gay marriage fell slightly (from 10% to 8% ofcover stories at Newsweek, and from 8% to 4% at Newsweek).
News Magazine Covers by Topic
Time and Newsweek 1977 & 1997
Design Your Own ChartProject for Excellence in Journalism, ’’Changing Definitions of News,’’ March 6, 1998
Topic
Looking more in depth at four issues of each magazine rather than a year of covers, we see other differences among thethree magazines. What topics got the most space in the magazines during the weeks studied?
U.S. News, by far, was the most traditional, devoting nearly half of its space, 49 percent, to U.S. government anddomestic affairs. These topics took up 26 percent of the space in Newsweek during the weeks studied, and 13 percent inTime.
Newsweek, on the other hand, was the most oriented to entertainment and lifestyle. A full 37 percent of its space wasconsumed with lifestyle and celebrity stories (versus 31 percent at Time and a mere 6 percent at U.S. News).
What were the lifestyle stories? Newsweek covered the range of lifestyle activities — health trends, sports, travel,religion, cooking, the arts and popular culture. At Time, the bulk of it was popcultural trends and it also had more highculture arts stories.
Time stood out for the space devoted to science and technology, but that is largely due to a cover issue on DNA.
The three publications were virtually identical in their coverage of military and foreign affairs and the situation in Iraq,averaging 29 percent of the space (and 18 percent of stories).
If one looks at the topics in these four issues by number of stories rather than space, the findings are quite similar. Theonly significant difference is a lower percentage when it comes to the number of domestic and foreign affairs stories anda higher percentage when it comes to the number of lifestyle stories. In other words, there are fewer domestic andforeign affairs stories, but they are longer. There are more lifestyle stories but they are shorter. All other categories arevirtually identical in volume and stories.
Story Length
One area where the differences between the magazines may not be quite so predictable was story length. Here, the indepth fourweek study showed that the three magazines had a similar overall space or news hole (averaging 27,000 to28,000 words per issue). And at all the magazines short stories dominated, more than half being less than 500 words.
In the examination of the data for length, there were no statistically significant differences in the three magazines.
Protagonist
The Project also looked at whether stories were built around a single character or an institution, as opposed to no centralprotagonist. Who or what, in other words, were the stories emphasizing, if anyone or anything? As a group, the newsmagazines built 27% of their stories around a single personality, 5% less than newspapers.
Here U.S. News again stood out. It was the least likely to make its stories characterfocused, doing so just 19 percent ofthe time, versus 35 percent for Time and 27 percent for Newsweek.
The news magazines were even less likely to focus their stories around institutions (only 9 percent of stories).
Similar to the findings in other news media, President Bush was not the main protagonist much of the time in the newsmagazines. Indeed, Time and Newsweek were both more than twice as likely to be focused on an entertainment celebrityas on the president as a main protagonist. This was not the case at U.S. News, where one was about as likely as theother. Bush did not even dominate political coverage at any of the news magazines. The three publications were twice aslikely to build their political stories around some other federal official or politician as they were around the president.Apparently, while popular and highly effective politically, Bush is not the kind of character who makes for compellingmagazine copy.
Sourcing
In general, readers of the news magazines are told who the sources are. Only 20 percent of all the stories studiedcontained anonymous sourcing, and many of those were the shorter pieces.
In contrast, more than a quarter of stories (28 percent) contained the highest level of transparent sourcing we counted —four or more sources where the reporter not only identified them by name but also attempted to explain the source’s biasor relationship to the subject.
There are some differences among the magazines in sourcing, but only some. Again, reflecting its more traditional orfactheavy character, U.S. News was the most likely to run stories with four or more fully identified sources (36 percent).Newsweek was the least likely (21 percent).
Iraq Coverage
How did the news magazines cover the situation in Iraq during the weeks studied in depth? None of the issues studiedwere during combat operations, though two fell in the weeks surrounding battle, February 17 and April 7. (The other two
weeks studied were June 16 and October 6.) In these four issues, the war in Iraq accounted for more than a fifth (22percent) of all stories and roughly a third (32 percent) of all the space.
These stories were also more likely than others to be long and in depth. Fourteen percent of the Iraq stories were longerthan 2,000 words, compared with 6 percent of stories overall. Only a third (34 percent) were 500 words or fewer (versushalf overall).
As with the coverage overall, these stories were not generally framed around an institution or a person. Only 3 percent ofthe Iraq stories in each magazine cast President Bush in the role as protagonist in the story and only 5 percent cast hisadministration generally as the protagonist. The most likely protagonist was some other federal politician or governmentofficial (9 percent).
There were also differences in the way that the three magazines covered the situation. Time devoted the most space tothe war, 37 percent, compared to 34 percent for Newsweek and 24 percent for U.S. News. And again, Time had morelong stories (seven stories in the four issues studied were more than 2,000 words). Newsweek ran six long stories in thefour issues studied and U.S. News ran two long stories.
7. “Changing Definitions of News,” The Project for Excellence in Journalism, March 6, 1998.http://www.journalism.org/resources/research/reports/definitions/default.asp
8. Changing Definitions of News, Chart “Subject of Front Page and Cover Stories”http://www.journalism.org/resources/research/reports/definitions/frontpage.asp
See end of document for content analysis methodology.
abecker
Typewritten Text
AudienceAudienceThree trends in news magazine circulation and readership stand out.
First, readership surveys indicate that the audience for news magazines is holding steady, while the audience for popculture, entertainment and lifestyle magazines is growing. This fits with the trends in ad pages and revenues andsuggests one of two things: Either the market for news magazines is more or less at its capacity or the genre needs to bereinvented.
Second, despite changes in content designed to grab younger readers, the audience for news magazines is aging – morethan for most other magazine genres. News magazine readers are also more affluent than magazine readers overall, butthat is not a big consolation financially. Advertisers are often looking for youth more than money, particularly in generalinterest magazines like the news weeklies.
Third, while the big three news magazines are finding it hard to increase their circulation, a few smaller circulation booksthat focus on news and public affairs have found steady growth over the past 15 years. This may suggest that the genreis ripe for change and indeed that the news magazine audience, or at least part of it, is looking for a new approach.
Who is Gaining and Who is Not
Over the past 10 years, there has been a clear division among magazine genres – those that are rising and those that aresitting still. Readership figures from Mediamark Research, the leading U.S. provider of syndicated consumer magazineaudience data, indicate that since 1995 the entertainment and pop culture genre has gained popularity. 1 Interest in thenews and business genres has remained flat.
Both news and entertainment magazines trended down in readership from 1995 until 2000. Then both categories beganto rise again. But the increase in entertainment magazines was much more substantial, increasing 14 percent from 2000to 2003. 2 News rose only 9 percent in the same period. 3
Business magazines followed an opposite course. These magazines grew in readership from 1995, peaked in 2000 andthen began to fall off.
Part of this is explained by the dying off of some magazines that were riding the success of the stock market and thetechnology boom. But other losses may have more to do with the fact that, when the market dipped, people stoppedlooking at their copies of Forbes and Fortune. For many readers, no news on their 401(k) was better than the bad news.
The figures also may suggest some shifting going on from genre to genre. Readers have only a certain amount of time todevote to magazines. If that time is not going to one genre, it’s going to another. News and entertainment benefited fromreaders turning away from business publications.
But the uptick in entertainment readership is too sharp to be the result of falling business readership alone. It also followslogically another basic theory about media. If more of the media agenda is focused on lifestyle and entertainment, itincreases interest in those areas. The media is both reflecting and reinforcing a broader cultural shift toward celebrity,entertainment and infotainment.
Design Your Own ChartMediaMark Research, ”Magazine Audience Estimates”* Number of people who have read magazines of each genre in that year
Number of Magazines by Select Genres
1980 – 2002
Design Your Own ChartPublisher’s Information Bureau annual reports
Newsmagazine Demographics: A Graying Market
Other key trends in news magazine readership, according to the Mediamark data, are affluence and age. Newsmagazines are a graying habit. Despite the occasional hiccup in the data, the age gap is quite noticeable. And with fewor no new titles entering the news genre, the hopes of significantly lowering the average age will probably go unmet. 4
Design Your Own ChartMediaMark Research, ’’Magazine Audience Estimates’’
Average Age of Readership by Magazine
Time, Newsweek, U.S. News
Design Your Own ChartMediaMark Research, ’’Magazine Audience Estimates’’
Why does age matter? Advertising. Over the long term the aging of the news audience suggests fewer dollars will likelybe flowing to news magazines, which have a higher average age than pop culture magazines. Advertisers, who seemever interested in younger demographics, will likely be more interested in spending their money on entertainment andpop titles that reach those target age groups.
Offsetting the “age problem” is that along with age often comes wealth. News readers have much higher income then theU.S. adult population overall and have for some time. In 1995 news magazine readers were 28 percent more affluentthan the U.S. adult population, and in 2003 that gap was about the same, 29 percent. 5
The advantage has allowed magazines like Time and Newsweek to charge more for the ads they run. Given that thesemagazines have had smaller increases in the number of ad pages they run than other magazine categories, this is someconsolation.
Average Income of News Magazine Readers
Compared to U.S. population, 1995 – 2003
Design Your Own ChartMediaMark Research, ’’Magazine Audience Estimates’’
Average Income of Readership by Magazine
1995 – 2003
Design Your Own ChartMediaMark Research, ’’Magazine Audience Estimates’’
More Demographics: The Affluent Boys Club
The readership data on the newsmagazines are not extensive. But combining what we know about the age, sex andincome of the readers, one can draw very rough sketches of the audiences here. Among the big three news magazines,readership tends to be male. Time and Newsweek each have about two million more male readers than female, and U.S.News has three million more men than women thumbing through its pages.
Time, the oldest magazine of the three, has the youngest readership, an average age of 43.1 Newsweek is a bit olderwith an average age of 44.4. And U.S. News is the highest, with an average reader age of 45. 6
Newsweek’s readers are slightly more affluent than Time’s – average annual incomes of $66,739 and $65,697,respectively. U.S. News readers, while still above the industry average as a whole have a slightly lower average income at$63,603. This finding is surprising because it is generally true that older readers have higher incomes. U.S. News seemsto be an exception in this regard. Up until 2001, U.S. News actually had a higher average reader income, but in the pastfew years its figures have been surpassed by both Time and Newsweek. 7
Outside the Big Three: Younger, Richer, More Female
Move beyond the traditional three news magazines, however, and one can see more differences. Of all those listed in thenews magazine category, Jet magazine, a magazine with a predominantly black audience, has by far the youngestreadership. In the past decade the average reader age never got above 38.7 years old and some years its average agewas in the early 30s. Its readership was also always more female than male, in 2003 it had two million more femalereaders than males. Among the news magazines examined, Jet also had the lowest median income. In 2003 the medianincome was $35,536 – below not only the news magazine average but also below the U.S. adult population average of$50,760. 8
The New Yorker and The Atlantic have the oldest readerships of any of the news magazines examined – 45.4 years and50.0 years respectively. But they also had the readers with the highest incomes, by a large margin. Readers of The NewYorker have a median income of $78,538, about $12,000 higher than the next nearest news publication, Newsweek. TheAtlantic readers’ incomes were higher still, an average of $82,983. That pushes The Atlantic nearly up into the range ofreaders of business magazines. In terms of gender, The Atlantic’s readership tends to be more male than female –774,000 versus 615,000 in 2003. The opposite is true of the New Yorker, which has a few more women readers – 2.1million females compared to 1.9 million males. 9
Getting Subscribers
The differences with more specialized news magazines raise another question. While the news magazine category is flatoverall, some of these more specialized publications are faring better in keeping readers. An even worse picture ispainted, however, for two of the big three news magazines – Time and U.S. News.
Time’s circulation has fallen by 13 percent from 1988 to 2002. U.S. News has lost as well, also 13 percent from 1988 to2003. 10
Newsweek has been the most stable of the three, experiencing a smaller drop of 3 percent in circulation since 1988. Thisdisparity has significantly closed the gap between Newsweek, the historic No. 2, and Time, the longtime genre leader.The gap, 1.4 million in 1988, narrowed to 928,000 in 2001 and may have narrowed even more in 2002. 11 Yet financially,this has not helped Newsweek – or hurt Time — as much as it once might have.
Design Your Own ChartAudit Bureau of Circulations, annual audit reports* Circulation figures are averages for the second quarter annually
The circulation losses have occurred despite the fact that these magazines have changed format and content to try tohold on to readers and to attract the much valued youth demographic. Pictures are larger and stories are often shorter inan attempt to lure the MTV generation and its more visual sensibility. Graphics have also become a larger part of all ofthe big three.
Circulations of Other News Magazines
1988 – 2002
Design Your Own ChartAudit Bureau of Circulations, annual audit reports* The Atlantic is a monthly magazine
At the same time, however, the circulation trends among the smaller, more specialized news magazines are all up, someslightly, some more sharply, and these among publications that have not lightened their fare as much. Again, of particularnote are The Economist and The New Yorker.
Circulation Among the Big Three News Magazines 1988 – 2002
abecker
Typewritten Text
While there may be some question as to whether The New Yorker publishes a product that is similar in format to atraditional news weekly, the same argument cannot be made about The Economist, which has seen its subscriber basemore than double in the past 15 years. 12 And it has done it with a decidedly different approach than the big three..
The circulation numbers are particularly telling, considering the fact that magazines often “buy” circulation. Publicationssometimes make their subscription prices so low that many readers simply find them too low to resist. On top of thediscounts, publications can do enough promotions, mailings and gift giveaways that they can pretty much control theamount of circulation they will gain and, to some extent, where they will gain it. The idea is to attract readers – andcertain kinds of readers – in order to get higher circulation numbers that command higher ad rates. All of the big threemagazines employ this technique. Subscription cards in Newsweek, for instance, offer a year of the magazine homedelivered for $42, a savings of $209 or 80 percent off the cover price. The question is whether it is worth the money. Thatdepends in part on whether the new readership is converted into more ad revenue. It also depends on how much amagazine has to spend to maintain its circulation base. How many existing readers is it retaining, versus new readers ithas to attract, to hold its overall numbers?
On the other hand, The Economist has had its circulation rise although its subscription prices far outstrip the big three.According to subscription cards, a 51 percent discounted annual subscription rate of The Economist still comes to $129, abit more than triple the discount card of Newsweek.
The Opinion News Magazines
The other end of the news magazine universe is a group of magazines whose importance may have more to do withinfluence than economics. These are the nation’s major opinion news journals, from The Nation on the left to NationalReview on the right. Looking at the circulation of these sorts of journals over the past 15 years, one trend is particularlynotable. There seems to be an inverse relationship between which party controls the political dialogue in Washington andthe circulation of opposition magazines. The last few years have been very good to the liberal Nation. Its 2002 circulationwas up to more than 135,000, and increase of 40,000 (42 percent) since the election of George W. Bush in 2000. At thesame time, the conservative National Review has seen its circulation fall almost 40 percent (to 114,082) since its highpoint in 1994, when anger over the presidency of Bill Clinton led to the elections in which the Republicans took control ofthe House of Representatives.
Circulations of Leading Opinion Magazines
1988 – 2002
Design Your Own ChartAudit Bureau of Circulation, annual audit reports
The New Republic has been relatively immune from this roller coaster effect. Its circulation is relatively unchanged overthe past 15 years. It has experienced a slight drop in circulation, perhaps in part because of a string of problems it hasfaced ranging from the changes in the magazine’s editorial staff (the loss of bigname writing talent), to its lessthan
celebrated redesign, to the problems it faced with Stephen Glass, a reporter who made up articles out of whole cloth, tofluctuating changes in its overt political ideology. But as The New Republic has become less overtly partisan, it may alsohave less appeal to any particular political constituency and for that reason it may be missing out on the circulationincrease it could have as a voice for the loyal opposition to the Bush Administration. (The country’s other influentialconservative newsopinion magazine, The Weekly Standard, is not included in these figures because it has chosen to optout of the ABC audits).
The circulation gains that seem to come with being the loyal opposition put the news/opinion journals in an odd position.They get the most readers when the views they espouse are out of fashion in the town that matters to them most,Washington. It makes some sense. When one party loses control of the political scene, it is standard practice that itsmembers wander the wilds of policyjournals and hash out what exactly they believe, why they lost control and how to getit back. The opposition opinion journals are, in effect, needed more when their side of the political spectrum is in a funk.
These journals’ successes are probably best measured not in economic terms but in the pull they have inside theBeltway. That is quite difficult to measure numerically. Circulation is only one proxy.
Conclusions
The circulation numbers for the magazine industry make one thing clear: The news genre may not be dead, but growthand energy is outside the traditional big three news magazines. Whether that is a permanent condition, or a reflection oftheir current hybrid format, is a question that cannot be answered here. But the attempts by these magazines to becomeyounger by becoming lighter do not, according to the numbers, seem to be working. Magazines that have a little ofeverything but specialize in little are not where the growth in readership seems to be. Magazines that are more serious,like The New Yorker, or more strictly entertainmentoriented, like In Style, are hotter. And magazines of ideas – and ofopposition – seem to endure in having a place at the table. One question is whether bloggers, those littleread butinfluential writers of opinion on the Internet, will chew away at magazine audiences. So far, there is no measurable signof that.
Footnotes
1. The figures are based on an annual “Magazine Audience Estimate” of 20,000 readers done by Mediamark Researchoff a list of magazines the research firm selects. Their list included six magazines that fell into our news magazinecategory: Time, Newsweek, U.S. News and World Report, The New Yorker, The Atlantic and Jet. Thus, The Economistand National Journal are not included in the data. www.mediamark.com
4. There are two outlier magazines when it comes to age. One is The Atlantic, whose audience skews older, and wasadded to the genre in 1997. And the audience for Jet, on the other hand, is significantly younger than other newsmagazines and has been included in the genre for as far back as we have data. An immediate spike in age occurs in1997 with the addition of The Atlantic, but overall the two balance each other out. In fact, if we remove the two outliers,the average age for news magazines gets even older and the gap wider.
EconomicsEconomicsData on the economics of news magazines reveal three notable trends.
First, while other genres have improved financially, news magazines have remained stagnant in terms of the ad pagesthey sell. In part this may be due to the fact that the news genre, unlike others, has not added any wildly successfulbooks in the last decade.
Second, among the big three news magazines, there has been something of a shaking out. While the three werebunched together in ad page sales in the mid90s, Time has now established itself as the clear leader, with Newsweek astrong second. U.S. News & World Report is third and losing ground. Some of Time’s growth may be due to its ability tosell ad packages to several books as part of the Time Warner empire.
Third, The Economist and to a lesser extent, The New Yorker, are the two news magazines enjoying growth in ad pagesand revenue. In the past 15 years, their revenues have more than doubled and their ad pages are neckandneck withgenre leader Time – though The New Yorker has long been an ad page leader, this is a new development for TheEconomist. 1
The Industry as a Whole
Overall, the economic figures for the magazine industry look relatively stable. But looking deeper, there are somenoticeable trends over the past 20 years and, more particularly the last decade, which bear notice.
Operating Profit for the ’Average Magazine’
Design Your Own ChartMagazine Publishers of America, Financial Review of Consumer Magazines 2001* ’’Average Magazine’’ is an MPA composite of 65 different publications
Design Your Own ChartMagazine Publishers of America, Financial Review of Consumer Magazines 2001* ’’Average Magazine’’ is an MPA composite of 65 different publications
Profit Margin of the ’Average Magazine’
1997 – 2001
Design Your Own ChartMagazine Publishers of America, Financial Review of Consumer Magazines 2001* ’’Average Magazine’’ is an MPA composite of 65 different publications
abecker
Typewritten Text
abecker
Typewritten Text
abecker
Typewritten Text
abecker
Typewritten Text
Ratio of Ad to Editorial Pages in the ’Average Magazine’ 1997 – 2001
Design Your Own ChartMagazine Publishers of America, Financial Review of Consumer Magazines 2001* ’’Average Magazine’’ is an MPA composite of 65 different publications
A look at the “average magazine,” a Magazine Publishers of America composite of 65 publications, shows a healthyindustry as of 2001.
While revenues and profits took a hit with the recession of 200001, profit margins stayed above 15 percent. Averageprofits never fell below $13 million. 2
Even more encouraging for journalists, publishers during the recession did not allow a smaller volume of ad pages to digtoo hard into editorial pages. The “average magazine” was thinner in 2001 than in 2000 – 158 pages versus 174 pagesthe previous year – but considering the drop in ad pages due to the weak economy, it could have been worse. 3 As adpages fell in 2001, publishers allowed editorial pages to increase as a percentage of total pages. Some analysts alsosuggested that magazines might have benefited economically after September 11 through more newsstand sales, whichbring in more profit than subscriptions. The terrorist attacks also may have led editors and publishers to publish morenews pages, since events were so momentous.
The Numbers by Genre
Some genres, however, are much healthier than others and over the last decade the differences have become evenclearer. The Publishers Information Bureau collects ad page and dollar figures for companies representing 85 percent ofconsumer magazine advertising volume in the United States. 4 To examine their data, we organized the magazines bygenre along the same lines as Mediamark. 5
A clear picture quickly emerges, and news magazines are the big loser. Ad dollars and pages are increasingly going toplaces other than news magazines. Some of the reasons for the shift are fairly obvious. The segmentation that hittelevision with cable and grew with the Internet hit the magazine industry earlier. Many of the new books that appearedfrom 1980 forward were niche service magazines aimed at specific groups, like Bicycling, PC Magazine or Lucky, the lasta magazine aimed at shoppers.
The numbers show the explosion and fragmentation. In 1980 there were 103 magazines listed with the PublishersInformation Bureau. By 2003 there were nearly 250, with most falling into the service magazine niche. 6
At first glance it may seem unfair to compare news magazines with the other genres here. News magazines, after all, arejust one segment of a large industry and was.
Average Magazine’ Revenues and Expenditures 1997 – 2001
Design Your Own ChartPublisher’s Information Bureau, 1980 annual report
Magazine Ad Pages, 2002
Design Your Own ChartPublisher’s Information Bureau, 2002 annual report
bound to take a hit with the explosion of other genres and niches. (See Usage) But despite the explosion of magazines,the entertainment/pop culture genre still managed to increase its overall share of the ad pages.
Design Your Own ChartPublisher’s Information Bureau annual reports
Magazine Ad Pages by Select Genres
1980 – 2002
Design Your Own ChartPublisher’s Information Bureau annual reports
Even with a steady number of publications, however, news magazines should not have seen ad pages decrease the waythey did. The growth simply was not there for many of the big news magazines. Compare ad pages in some of the biggermagazines in 1992 and 2000, for example. In 1992 Newsweek had 2,109 ad pages and U.S. News had 2,170 pages,while People had 3,281 pages. In 2000, Newsweek had 2,415 pages (an increase 15 percent) and U.S News had 1,857(a decrease 14 percent), but People had 4,227 pages (an increase of 29 percent). 7
The growth in entertainment and lifestyle magazines is striking, especially since 1995. The number of ad pages hasgrown by nearly a third since then and ad dollars have grown by more than 80 percent. Since 1980, ad revenues haveincreased 500 percent for that segment, compared with just 300 percent for news magazines. 8
The rise of entertainment and lifestyle has been stable and consistent. And though there have been some notableflameouts, such as George and Talk, the genre overall has not only grown, it has produced spinoffs as well. Time
Warner’s People magazine alone has led to the creation of Teen People, In Style and People En Español.
In fact, while Time Warner has launched five entertainment titles listed on the PIB list in the last 15 years (the abovetitles and Entertainment Weekly), it has not begun a single new news magazine.
Business Magazines
Business magazine ad dollars grew more as well, rising from $262 million 1980 to $1.5 billion in 2002, a nearly sixfoldgrowth. Nevertheless, as was evident in the hit these magazines took in 2001, this genre’s fate seems more closely tiedto the overall health of the economy and the stock market. Case in point is the unreal spike in pages and dollars thatbusiness publications enjoyed in 2000. It can be best understood by looking at the flash and crash of a single magazine,The Industry Standard. In 2000 it had more ad pages than any magazine listed with the PIB. 9 By 2001 it had folded. Inother words, good business is good business for these magazines. When the bulls are running and stocks are rising,investors want to know the value of their portfolios. When the bears are playing, people would probably rather read aboutanything else.
For the magazine industry as a whole, however, the changes over the past 20 years can be understood simply, the adgrowth the industry as a whole experienced has the least effect on news magazines. In 1980 news led the three genres inad dollars, with pop culture/entertainment close behind and business a distant third. In 2002, news was in third, fairlyclose to secondplace business and many lengths behind the leader, pop culture/entertainment.
Changes in the newsmagazines
Advertising pages and ad dollar figures show changes in the big three news magazines over the past 15 years. Since thelate 1990s, there has been a trend playing out among them, a consistent and welldefined first, second and third placefinish among them. Time is on top, followed by Newsweek, with U.S. News & World Report bringing up the rear. Asrecently as 1994, the three magazines were bunched up closely in ad pages, with U.S. News actually leading, but in thelast 10 years more separation has occurred. 10 U.S. News’s slip downward seems to have gained momentum as Timeand Newsweek, while riding the ups and down of the economy in general, have done relatively well. If the trends continueit could be that at some point in the near future the big three could become the big two.
Time, which has had the most success with ad pages in recent years, is also part of the giant of the magazine industry,Time Warner. And within this industry, the “synergy” created by the number of magazines owned by this media giant hasbeen beneficial. Being able to sell advertisers pages in all its highprofile, highcirculation books at one time (and at adiscount) has led to an unquestionable advantage for the megamedia company. And Time Warner has had a good runrecently for all its magazines in terms of ad pages and revenues. From 1990 (its first year listed with the PublishersInformation Bureau) to 2002, Entertainment Weekly’s ad pages climbed from 906 to 1,864. InStyle, which was launchedas a special issue in 1994 before gaining a regular publication schedule, saw its ad pages climb from 196 to 3,030 in2002. 11 And People, too, had large growth over the period. Perhaps, then, while the AOL Time Warner merger may nothave provided the publisher with added advantage over its competitors, the strength of the publishing arm of thecompany may have helped buoy its bottom line.
Design Your Own ChartPublisher’s Information Bureau annual reports
Elite Newsmagazines
Also noteworthy is the success of smallercirculation news magazines, particularly The Economist and The New Yorker. Interms of ad pages, these two magazines have done very well over the past decade, and as of 2002 sit ahead of all butTime. The New Yorker is part of the Advance Publications group, which includes all Condé Nast titles; The Economist ispart of the smaller Londonbased Economist Group.
Ad Pages in the Other News Magazines
1988 – 2002
Design Your Own ChartPublisher’s Information Bureau annual reports
When ad dollars are figured in, however, the big three still hold a sizable lead, with U.S. News’s declining positionbecomes clearer.
Ad Pages in the Big Three News Magazines 1988 – 2002
News Magazine Ad Dollars, by Magazine1988 – 2002
Design Your Own ChartPublisher’s Information Bureau annual reports
Economic Conclusions
The longterm financial outlook for magazines in general seems strong. There has been growth in ad pages and addollars across the board. But within the news genre, things are more stagnant. The number of magazines is flat and,while ad revenues grew between 1988 and 2002, ad pages declined. 12 What does this mean? The news genre is at leastin need of reinvention and may, indeed, be saturated. There is also a note of caution for the magazine industry ingeneral. The rising cost of circulation through the mail makes that branch of the revenue stream very weak and couldthreaten the longterm health of the industry.
Footnotes
1. Magazine Publishers Association, Publisher’s Information Bureau statements 1980 – 2002.http://www.magazine.org/Advertising_and_PIB/PIB_Revenue_and_Pages/
2. Magazine Publishers Association, “Financial Review of Consumer Magazines 2001.” p. 12
3. Magazine Publishers Association, “Financial Review of Consumer Magazines 2001.” p. 22
4. Magazine Publishers Association, Publisher’s Information Bureau statements 1980 – 2002.http://www.magazine.org/Advertising_and_PIB/PIB_Revenue_and_Pages/
5. We started by using categories created by Mediamark Research, a firm that collects data on magazine readership. Insome situations, where magazines were listed in several categories or listed in questionable categories, we assigned it toa different group. The Economist, for instance, is listed as a “Business & Finance” publication. But the magazine callsitself a weekly news and business publication and much of its content is related to general news – certainly more than astandard business publication. And the New Yorker, which is listed as “General Interest” with Mediamark, regularly dealswith the news, not just in newsmaker profiles, but also in longer think pieces on important news topics. People magazine,on the other hand, is listed under “Entertainment, Lifestyle and Pop Culture,” but also under “News.” We put it underEntertainment, Lifestyle and Pop Culture as that is its primary coverage mission.
6. Magazine Publishers Association, Publisher’s Information Bureau statements 1980 – 2002.http://www.magazine.org/Advertising_and_PIB/PIB_Revenue_and_Pages/
OwnershipOwnershipAs the news media have gone through wave after wave of consolidation the magazine industry is consolidating as well. Ahandful of companies now controls the industry, at least in terms of revenues and in terms of owning the powerfulagendasetting titles.
But, the consolidation here looks different than it does elsewhere. The top companies are different than the companiesthat rule in newspapers or television. While they are still large, they are not all part of media behemoths, with the obviousexception of Time Warner and, to a lesser extent, Advance. This is especially true for two of the three news magazines –Newsweek and U.S. News & World Report.
There are several potential reasons for the news magazines’ ownership situation. It may be due to the age of thesemagazines – they are so old and wellestablished other players from other companies cannot jump into the market tocompete. Or it may be that because the real growth in the magazine industry is in the niche and service areas, the newsoriented mission of these magazines simply does not jibe with the strengths of most of the major magazine players.
A Few Big Players
In some ways, the same rush all media felt to consolidate in the 1980s and 1990s hit the magazine industry as well.Indeed, it may be fair to say that the magazine industry in the United States is dominated by four companies: TimeWarner (which is by far the largest), Hearst, Advance and Primedia. Together those four companies get about 50 percentof all the magazine revenue that comes from the top 100 media companies. 1
And when one broadens the list to look at the top 10 magazine companies in 2002, they collect almost threequarters ofthe revenues in the industry. 1
But the biggest players in the magazine industry in terms of revenue are not necessarily the biggest players in the largermedia world. For instance News Corp., Washington Post and Tribune, three giants of the media world – Nos. 7, 21 and12 of the top 100 media companies, respectively – are only bit players in the magazine sector.
Magazine Revenue of TopTen Companies, 2002
Design Your Own ChartAdvertising Age, Chart: 100 Leading Companies
In fact, only four of the top 10 magazine companies – Time Warner, Hearst, Advance and Primedia – are among the 25largest media companies overall. That is quite contrary to other media. Nine of the top 10 newspaper companies areamong the 25 media giants as are all of the top 10 cable television companies. 1
Why does the magazine ownership landscape look so different than other media segments? It is because there are reallytwo tracks available to magazine publishers. There is the route of highimpact, massmarket, agendasetting magazines –the magazine names everyone knows – largely the province of the three largest companies. And there is the route ofsmaller niche, newsyoucanuse titles. Much of the growth in magazines over the past 20 years has come in these nicheservice magazines (See Economics). And many of the big magazine companies publish almost only these titles.International Data Group, the sixth largest magazine company, publishes only computer magazines such as PC World,Macworld and GamePro. Reader’s Digest, the fifth largest, besides its famous main title, publishes Family Handymanand American Woodworker. Even Primedia, the fourth largest company, is, despite its high profile New York Magazine,really based on service titles like Wards Auto World, Home Theater and Shutterbug. 1
The difference in magazine economics creates very different worlds among the 10 companies in the medium. The top 10companies publish most of the magazine titles seen on newsstands. But it is the top three companies that hold the bestknown books. Time Warner is home, of course, to Time, People, Sports Illustrated and Entertainment Weekly. Hearstpublishes Cosmopolitan, Esquire and the hugely successful O, the Oprah Magazine. Advance owns all the Condé Nasttitles – including Vogue, CQ, Vanity Fair and The New Yorker – plus Parade.
And, one could argue, that means that the magazine market in terms of content is even more concentrated than it firstappears. Those top three companies control 45 percent of the revenues in the magazine market and also control whatmight be called the agendasetting magazines in the areas of pop culture and business. They play important roles inshaping the national dialogue in these areas, which are the areas readers and advertisers are most interested in. Theyare the magazines cited by other media in the critical game of buzz.
Who Owns the News?
Only one of the top 10 magazine companies, Time Warner, publishes one of the big three news magazines, Time.Newsweek is owned by The Washington Post, a big media company that is only a bit player in the magazine world. AndU.S. News is owned by real estate mogul Mort Zuckerman, who also owns a hodgepodge of magazines and newspapers.Why are the big news magazines so underrepresented in the big magazine companies? In part it may be that they arenot sexy or new. They are among the longest continuously published magazines in the country. They got in, establishedtheir names and made competition difficult.
Lack of profit potential should not be overlooked as cause as well.
Even as magazine startups grow, the news magazine category remains largely unchanged, particularly at the massmarketed, highcirculation end of the spectrum. 1 Does this mean that three big news magazines is the limit? Possibly.But the fact that there are, and long have been, only three big news magazines despite continuous growth in othersegments (such as entertainment) suggests that many publishers simply do not think there is money to be made here. Itis true that the magazine companies that have thrived in the past 20 years are more focused on niches other than newsand might have a hard time starting a news magazine from scratch. But there is nothing preventing companies withstrong editorial backgrounds, such as Hearst or Advance, from launching new news magazines. Even Time Warner mightbe interested in the idea if it looked profitable. The company did not fear cannibalizing People’s readership when itlaunched Entertainment Weekly or Teen People. It assumed there were niches in which it could move without harming itsfranchise and it was right.
Why this did not occur in news magazines is a question. Perhaps the field was considered too crowded. Now, absent aremaking of the genre’s format, it seems, it certainly is.
Footnotes
1. “100 Leading Media Companies,” AdAge.com, August 2003. Companies are ranked by their total media revenuescollected in the United States in 2002. The list is available at http://www.adage.com/page.cms?pageId=1018.
2.Ibid
3. Ibid
4. In December of 2003, Primedia announced the sale of New York Magazine to Bruce Wasserstein, an investmentbanker. The deal moved Primedia out of the mainstream consumer magazine market and put it more squarely in theniche magazine camp.
5. In 2001, Dennis Publishing, publisher of Maxim, launched an American version of its British news magazine, TheWeek. The magazine, made up of a collection of stories from other publications, has 150,000 subscribers. It still survivesbut is losing money. Its longterm prognosis is unknown.
News InvestmentNews InvestmentData on how much news magazines are spending in the newsroom are hard to come by. These expenditures are privateand figures gathered by the Magazine Publishers Association are proprietary and reserved only for members of theorganization. There is, though, information available through news coverage of the industry, particularly the layoffs thatcame with the recent recession as well as bureau closings and reduced research departments.
The most direct way of analyzing what’s going on in magazine newsrooms may be simply looking at the staff boxes of theindividual magazines that list the employees from the editor in chief, to correspondents to copy editors to operations staff.Looking at the staffs of Time and Newsweek, the two more popular magazines out of the big three, there are somenoticeable trends:
The overall staffing of Time and Newsweek has fallen, sharply in the case of Newsweek, with the biggest hits in thelower ranks of the editorial staff.
The number of foreign and domestic bureaus has fallen, with Newsweek again experiencing the larger decline.
The number of contributors and contributing editors has increased at both magazines.
Shrinking Staffs
The push for smaller staffs has impacted all sectors of the media, not only magazines. Since 1983 there have beentechnological changes in the editorial and production departments that allow similar results with a smaller staff.Pagination and layout are markedly different now than they were even 10 years ago. Those processes are morestreamlined and require fewer people. And the Internet has made monitoring of what’s happening in remote parts of thecountry or the world easier, with local news outlets available on a daily basis by simply typing in a Web address.
Even taking all those changes into account, however, the staffs of the two biggest news magazines have declinedsignificantly in the past 20 years. Time’s staff has been reduced15 percent, according to its own staff box. Newsweek,meanwhile, has had a whopping 50 percent cut, according to its box. There has without question been some shuffling ofnames and job titles in these staff boxes. Nevertheless, overall declines are clearly evident.
News Magazine Staff Size Over Time
Time and Newsweek select years 1983 – 2003
Design Your Own ChartProject for Excellence in Journalism from magazine staff boxes
Where have the changes come? The staff boxes are more topheavy than they were in 1983, with the biggest cutscoming in midtolowerrange positions. In those 20 years, Time dissolved its “reporterresearcher” position, an entrylevelpost involving factchecking. Research now sits at the bottom of the masthead under the title “research center.” Instead,Time has created new titles such as “reporters,” and “writerreporters.”
Research is the area that has taken the biggest hit at Newsweek as well, where their version of reporterresearchers,“editorial assistants,” has been sharply scaled back. In 1983 there were 76 editorial assistants and senior editorialassistants in Newsweek’s staff box. In 2003 there were 18. More midlevel positions have also been trimmed atNewsweek. In 1983 there were 62 people who fell into the categories of associate or general editor in the staff box. In2003 there were 22.
In part, the move away from research was due to the advent of the Internet and the ease of doing research from eachreporter’s computer terminal. In the mid90s, for instance, as the Internet became more accessible and Web browsersmade it easier to use, Newsweek used buyouts to essentially scrap its research department.
Another change is in the way bylines now read. In 1983 stories in Time and Newsweek generally had no byline and,instead, a string of contributing names on the end of each piece. By 1993, topofthestory bylines appeared on mostpieces and in 2003 even Newsweek’s sidebar boxes have bylines. This suggests a couple of things. First, as newsmagazines became less focused on telling readers what happened and more concerned with providing a “take” on theevents of the week, they also wanted to give more prominence to the “voice” of the correspondents. One way of doingthis is to draw attention with topofthe story bylines. It also suggests that there is less reporting from individuals in thefield, though this seems less true of Time than Newsweek. Most of Time’s news stories still have “reported by” tags at theend. Newsweek’s are more often the work of a single writer who one assumes also did the reporting.
Fewer Bureaus
Another manifestation of the change in how Time and Newsweek operate is the reduction in bureaus around the countryand the world. The number of bureaus has dropped for each, though again more in the case of Newsweek than Time.But even more significant is the drop in the number of correspondents in those bureaus.
Number of Correspondents in Bureaus Over Time
Time and Newsweek select years 1983 – 2003
Design Your Own ChartProject for Excellence in Journalism from magazine staff boxes
Design Your Own ChartProject for Excellence in Journalism from magazine staff boxes
Together, the drops show again how newsgathering and original reporting have become less and less of the newsmagazine mission. Newsweek’s bureaus have fallen from 29 in 1983 to 20 today. 1 Time’s have declined from 33 to 24. 2Bureau staffs have seen even steeper cuts. Time’s national and international bureau correspondents have decreasedfrom 86 in 1983 to 55 in 2003. Newsweek’s have gone from 85 to 47 over the same period.
Contributors
The one section of the staff box that has seen growth over the past 20 years is the area devoted to contributors.Contributors are appealing for a couple of reasons. One is that it can be a less expensive way to employ journalists, ascontributors do not normally receive the same benefit packages as fulltime employees. In addition, people can bebrought in when need arises. Contributors allow magazines to staff up when issues arise and yet be relatively leanoverall. Another appeal is that contributors often bring instant name recognition – and perhaps more authority – to thenarrative.
In the magazine industry as a whole, working with freelancers or contributors is commonplace. In fact, many magazinesin other genres don’t have any staff writers. Editors simply have a stable of contributors they turn to when they need anassignment filled.
But news magazines for many years were the exception. Quick turnaround times that were set by breaking news madethe freelance model largely unworkable for the Time or Newsweek. Today, however, news magazines have found a way toadapt this structure and use a mix of contributors and staff.
News Magazine Bureaus Over Time Time and Newsweek select years 1983 – 2003
Design Your Own ChartProject for Excellence in Journalism
Time’s “contributors” are a hodgepodge of people, but many are specialists who work for other media organizations –wellknown names, some from other Time Warner companies. Some of the names on Time’s list include CNN’s medicaleditor, Dr. Sanjay Gupta; a CNN senior analyst, Jeff Greenfield, cartoonist Gary Trudeau and newspaper columnist MollyIvins. Newsweek’s approach is different. Its smaller group of “contributing editors” is largely a mix of the magazine’scolumnists and former staffers who have been moved into the contributors category. Some of the names on Newsweek’slist include columnists George Will and Jane Bryant Quinn as well as a former religion writer, Ken Woodward, andWashington correspondent Eleanor Clift.
As staff cuts, specialization and planned issues increase at the big news magazines, the contributors lists are likely toincrease as well. They are easier to add financially than staffers and their instant expertise and name recognition theybring fits in with the news magazines’ continuing move away from being heavily reported and anonymously written.
In fact, it is likely that all three trends will continue in the coming years as computers and the Internet make people powerless needed in the publication of the news magazines – particularly in their current form. News magazines may never belike other types of books, where freelancers and contributors dominate. But as time goes by, they will likely move moreand more in that direction
Footnotes
1. Newsweek staff boxes October 3, 1983 and July 14, 2003
2.Time staff boxes October 3, 1983 and April 28, 2003
Number of Contributors in Staff Boxes Over Time Time and Newsweek select years 1983 – 2003
abecker
Typewritten Text
Public AttitudesPublic AttitudesNews magazines occupy a valued place in the life of most of their readers. They are a mass medium. But they are rarelythe primary source for information about the events that shape the world, according to surveys by the Pew ResearchCenter. Television, radio, newspapers and the Internet are more likely to be the places where individuals learn about thenews. News magazines have always been a more analytical forum, a synthesis of news, analysis and opinion. Theirreaders tend to be a more select group of people who are interested in news. Readers’ opinions, then, may matter moreto these magazines than to other media. Since they are not the primary source of news and they revolve around analysis,they are also arguably more easily dropped by readers who feel they don’t need them. Among the survey findings:
Only a small numbers of readers say they are turning to magazines more often for news.
Magazines increasingly are seen as less valuable when news breaks.
Without question, the number of news sources has multiplied in the past decade. And the rise of the Internet combinedwith the proliferation of 24hour cable television networks has changed the way people get news. Not only is instantinformation available, but so are instant analysis and instant opinion as well. Magazines have borne some of the toughesthits in this information revolution, according to a survey by the Pew Research Center.
News Sources People Use Most Often
Survey Question: Which (news) sources are you using more often?
Design Your Own ChartPew Research Center for the People and the Press, ’’Media Attitudes/ Youth Engagement/ Religion After 9/11’’ Nov.13 – 19, 2001
The survey measured what news sources respondents were using more often. Magazines, which were the choice of 23percent of poll respondents in 1995, fell all the way to 4 percent in 2001, a drop of 83 percent. 1 Other media took hits aswell, but readers seem to find magazines most expendable.
The shift at the big news magazines was in a way meant to counter this. The diminishing focus on actual news reportagemade way for more analysis and opinion. But these figures suggest that effort was not wholly successful.
A Pew Research Center question asked where respondents got most of their news. While news magazines have neverbeen seen as a primary news source, particularly during breaking events, it seems to be even less so since theSeptember 11 terrorist attacks. From 1991 to just before the 2001 attacks, an average of 6.5 percent of respondents saidthey got their international news from magazines. From immediately after the attacks until October 2003, that numberhad dropped to 2.9 percent. 2
It could be that during this time readers had come to believe that the speed at which news moves had changed and thatmagazines were less relevant to them. But it also could be that this is a shortlived phenomenon that dissipates overtime.
The bright spot for magazines may come from what readers think of their work. In a Pew Research survey done inSeptember 2001, shortly before the terrorist attacks, 51 percent of respondents gave Time, Newsweek and U.S. News &World Report an “A” or a “B” grade in overall coverage. That number is at least competitive with most of the majormedia. 1.
Grading News Coverage, 2001
Percentage giving each medium an A or B grade
Design Your Own ChartPew Research Center for the People and the Press, ’’America’s Place in the World III,’’ Aug. 21 – Sept. 5, 2001*Survey question: What grade, A, B, C, D or F, would you give [media name] for its/their overall news coverage thesedays?
Local television news scored and A or a B with 57 percent, network news and local newspapers 56 percent, and cabletelevision news 67 percent. Magazines came in ahead of the category of large, nationally influential newspapers, at 40percent. 4
The good news for magazines then, is that readers think the news magazines are doing a relatively good job ofpresenting information. The bad news is that this doesn’t seem to be keeping readers. And that bad news is moretroubling. It suggests that people are less interested in magazines largely because of personal time constraints or thespeed at which news is moving or both.
Footnotes
1. Pew Research Center for the People and the Press, Media Attitudes, Youth Engagement, Religion After 9/1. Question57.
2. Pew Research Center for the People and the Press, October 2003 News Interest Index. Question 8.
3. Pew Research Center for the People and the Press, America’s Place in the World, III. Question 11.
ConclusionConclusionFor the past several years, even decades, it has become popular to speculate on the demise of the general interestnews weeklies. It has been argued that in a world of 24hour news, niche magazines and the Internet, the newsweeklies are dinosaurs. Unable to react quickly enough to break real news and now dealing with a world where instantanalysis and spin follows quickly on the news’s heels, the weeklies don’t really have a mission anymore, the argumentgoes. On top of that, their audience is getting older.
The weeklies, well aware of this analysis and witnessing declines in circulation or steady circulation numbers in agrowing population, have tried to respond. They have changed what they cover, reaching more and more into areasoutside of hard news. They have changed their look, adding more and more photos, trying to get slicker and glossier toattract a younger audience. The changes have seemed to stem the tide somewhat, but stagnant or falling subscriptionnumbers don’t look likely to suddenly climb.
It’s easy to blame those losses on a changing culture that simply doesn’t value news anymore. But what has happenedto the general news weekly may be more complicated.
The changes in the magazine industry over the last 20 years have been mirrored by cable television. The rise of “niche”ing and delivering specific audiences to advertisers took place in magazines well before cable had evolved. Before therewas the “Animal Planet” cable channel, if you will, there was “Cat Fancy” magazine. Yet somehow, news magazineslargely missed the trend. Paradoxically, as the magazine industry (and communications in general) got more and moreconcerned with targeted specific content, the news magazines actually got broader and more general. They cover moretopics now than they did 20 years ago. They reach farther afield for cover stories. In a world that has become more andmore like cable television, broken into interest groups and subsets, the news weeklies have become more like thenetworks, a onestop catchall with something for everyone.
Indeed, the news weeklies may have found a way to survive with this formula, although this is less certain of U.S.News. Their oftpredicted demise seems to be again on hold. Subscription losses seem to have slowed to the pointwhere the weeklies may now have a steady and reliable, though graying, audience.
The question is what have they become in the process. As the amount of hard news in their pages declines, the “news”part of their “news weekly” tag seems less and less relevant. The magazines are, more than anything, broad generalinterest weeklies. A little bit of People, a little bit of Forbes, a little bit of National Journal and little bit of EntertainmentWeekly. And there may be an audience for this product, but the product is not what it once was. And as the trendtoward “niches continues to grow, one has to wonder about the longterm wisdom of this strategy.
Looking at the circulation and advertising figures though, one could argue there is an alternative model of newsmagazine journalism that is thriving. The Economist and, to a lesser extent, The New Yorker have flourished over thelast 15 years by doing the opposite of what the big news weeklies have. The Economist, in particular, has essentiallythe same mission as big three news weeklies but takes a sharply different approach. It has few pictures, keeps lightcoverage relatively low and covers the entire world. And yet its circulation has grown despite a relatively highsubscription price. The New Yorker has moved more closely and more successfully to this formula under its currenteditor, David Remnick, than under his predecessor, Tina Brown.
The rise of The Economist and the success of The New Yorker may suggest that there is a separation of audiencesgoing on in the magazine industry. A small group of upperincome and perhaps more highly educated readers ischoosing to get its news and analysis from smaller, more select, more focused sources outside the mainstream. Thepublications, while clearly smaller in readership, have had steady growth in circulation and ad pages. This may presagechanges coming to the news media at large.
The steady growth among more expensive, more textheavy, more serious news magazines suggests there is anotherniche growing. If one looks around at all the news media, one can see signs of this shift happening on a larger scale.The circulation of The New York Times is based less and less on geography and is increasingly scattered through thecountry in areas based on cultural and income factors. In radio, the audience for National Public Radio has doubled in10 years.
It is too early to know exactly what all these changes will mean. But it is possible that in future years the big three newsweeklies will no longer dominate the news rack. It is possible that the news part of the magazine rack will look like therest of the rack. Perhaps there will be one or two big titles, followed by a group of targeted niche news books, all with adifferent view of what happened last week.
Radio – Intro
By the Project for Excellence in Journalism
IntroRadio might be called journalism’s forgotten but stable middle child.
The medium that came after newspapers and before television remains one that virtually every American continues touse, and one whose audience isn’t declining. While the medium spans as many as 47 different formats, many radiostations include some hourly news briefs in the course of the day, and the number of news stations that are mostly newsand public affairs remains robust. 1 Some outlets, such as National Public Radio’s affiliate stations, are a reminder thatthere is a growing audience for indepth radio news coverage from around the world.
But there are also signs of concern, as in other media. Though the evidence is hard to pin down, the amount andcharacter of locally produced news on radio appears to have seriously eroded in recent years. Consolidation has madeoriginal local public affairs content more of an afterthought. Hourly updates are often not more than headline reads. Andthe data available suggest a growing number of stations are not local at all, despite a high desire among audiences forlocal information. The people who work in radio news are not well paid. Their ranks are shrinking and those who remainare being stretched thinner.
Despite radio’s durability, when the subject of the news media comes up, radio often sits ignored. The conversationusually centers on newspapers, the oldest medium; television, the most visual, or the Internet, the newest. There is littleacademic research into radio, either as journalism or the medium as a whole, and what research is done is oftenconducted to persuade advertisers about the medium’s continued vitality, usually by gathering proprietary data for specificneeds.
Thus, much of what people know about radio is rather like blind men touching an elephant. Each comprehends theelephant in a different way. The man grasping the trunk thinks the elephant is like a snake. The man holding the tailthinks it is like a paintbrush.
This is quickly illustrated in trying to answer even the most basic questions: How many radio stations are there?
As of September 30, 2003, the FCC listed 13,450 licensed broadcast radio stations in the United States. This countincludes every station with a set of call letters and a frequency, even those that are silent, or currently not broadcasting. 2
Number Of Licensed Broadcast Radio Stations, 1990 to 2003
Design Your Own ChartFCC quarterly report* Numbers as of September 30th of each year
Arbitron, on the other hand, an international media and marketing research firm, counts 13,685 in its 2002 Radio TodayAnnual Report. 3 BIAfn, a media investment research company, includes Canadian and Mexican stations (stations thatbegin their call letters with a C or an X, respectively, instead of the W or K used in the United States) as well as radiostations located in American territories. It lists a slightly lower total: 13,215 domestic radio stations. To try to sort this out,we can contrast data sets against each other. Doing so reveals 13,400 to 13,700 radio stations in operation in the UnitedStates. 4
This is approximately a 99 percent increase since 1970, due almost solely to the growth of FM (rather than AM). 5
Footnotes
1. Arbitron’s Web site lists 47 major formats which are used in their listening surveys.
2. Federal Communications Commission, www.fcc.gov
3. “Radio Today: How America Listens to Radio, 2003” Arbitron Inc., p. 4, www.arbitron.com
4. As a kind of experiment, to judge how closely the various counts relate, we extracted the number of radio stationslisted with Arbitron under the format heading of News/Talk. For Arbitron this includes news, talk, information, businessnews and sports. We then took the data from BIAfn and individually counted stations providing news, talk, information,business news or sports. We came up with a number of 1,812just 187 stations fewer than Arbitron’s listing in its 2002Radio Today report of 1,999 stations.
5. AM radio occupies a frequency band of 535 kilohertz (1 kilohertz equals 1,000 cycles per second) to 1.7 megahertz (1megahertz equals 1 million cycles per second). The FM radio band spans 88 megahertz to 108 megahertz.
Content AnalysisContent AnalysisWhat is the state of content in radio news?
The project did not make a separate study of the content on radio this year, as it did in broadcast television, cable, theInternet, newspapers and magazines. The number of stations and the difficulty of monitoring locally make such anundertaking difficult.
But some generalizations and some anecdotal information are possible. And they suggest reason for concern.
Lawrence Grossman, the former head of PBS and NBC News, said in a recent address at Louisiana State University:“Commercial radio … has by now totally abandoned serious journalism, except some might argue, in a handful of bigcities whose allnews radio stations typically offer little more than a 24hour headline service. Radio network news is arelic of the past. Instead, commercial radio is flooded with syndicated talkers (talk is cheap), whose opinionated, mostlyarchconservative onair personalities take strong positions on major public issues. What once was an industry dominatedby locally owned and operated stations and three national radio networks is now an industry dominated by three giantcorporations, each of which owns multiple stations in a number of markets, and owns and programs hundreds of radiostations throughout the nation.” 1
The Future of Music Coalition, an advocacy group made up of members of the music, technology, public policy andintellectual property law communities, which has been critical of radio consolidation, issued a report entitled “RadioDeregulation: Has It Served Citizens and Musicians?” It states that four companies control twothirds of the domesticnews audience. 2 Data from the most recent newsroom survey by the RadioTelevision News Directors Association, orRTNDA, show that an increasing number of radio stations in other formats are receiving information from a central newsdepartment. On average, a single newsroom provides content to three stations. What does this mean?
According to some critics, it means that radio news may be running the same risk of other commercial radio content, asdescribed by William Powers, the media columnist for National Journal, into “a horror show of packaged homogeneityand cynical, demographic button pushing.” 3
Is this dire critique fair? Since comprehensive information about content is difficult to come by, the more detailed senseof things comes from anecdotes, but these often paint a worrisome picture, too.
Alan G. Stavitsky, the associate dean of the school of journalism and communications at the University of Oregon andone of the country’s few scholars who specializes in studying radio journalism, often offers his own experience as anillustration of radio’s changing picture. Stavitsky started his career in radio broadcasting working for a small radio stationin Wisconsin. The station he worked for was one of many stations dotting the state that were programmed locally and,in addition to whatever music or information, provided things like coverage of schoolboard and village meetings, schoollunch menus and lostdog announcements. These were news items that, obviously, were vital and important only toindividuals in the station’s “backyard.” Now, that same area is served not by a system of hyperlocal stations but bystations that mostly broadcast network and syndicated programming produced outside the state, with announcers inplaces like New York and Dallas. This transformation, while it does not change the outward appearance of that area’sradio landscape, does eliminate the nuances that made the local radio station a familiar part of the community.
The factors in all this are harder to pin down. Some would argue that this is simply the marketplace at work, a reflectionof what audiences want. Others contend it has less to do with demand than supply – the minimum that owners arewilling to spend to get by.
Certainly a major factor is regulatory. Critics date the start of much of the change to the 1980s, when the FCC beganloosening the rules on radio content and ownership.
So is there any good news about radio news content?
Advocates of consolidation make a case for its potential benefits. Data from the RTNDA show that, even if they areproviding news to multiple stations, the staff numbers in radio newsrooms are growing. This situation is allowingstations that might not have offered any news programming before to add such content to their daily schedule. Thenumbers also show a climb (though changes in methodology from previous years makes exact comparison impossible)in the minutes of locally produced news content.
And listeners can easily migrate where they want. At NPR, where most agree listeners can find highquality radiojournalism, the audience has doubled in the last decade, and grown by 60 percent in the last five years. This doesinclude some content, but often not very much, that is local. 4
For all the worries about the decline in local content, Arbitron information tells us that more than 94 percent of theAmerican public tunes into the radio each week and that virtually all of them get some news there. It also tells us thatNews/Talk/Information stations enjoy the largest percentage of listeners of any other format. What’s more, radio leapsover such obstacles as the digital divide, economic status and even the language barriers. The boundaries of the audiotown square are broad and inclusive. 5
Footnotes
1. “Should The Government Subsidize the Press?” Speech delivered at Louisiana State University, 2004 BreauxSymposium: News in the Public Interest: A Free and Subsidized Press, March 19 20, 2004.
2. “Radio Deregulation: Has It Served Citizens and Musicians? A Report on the Effects of Radio OwnershipConsolidation following the 1996 Telecommunications Act,” Future of Music Coalition, p. 38, www.futureofmusic.org,based on data from BIAfn MediaAccess Pro, www.biafn.com (data as of May 16, 2002)
3. William Powers, “Radio Rich,” National Journal, November 15, 2003.
AudienceAudienceThe growth in stations, and the possible erosion in local journalistic content, has not materially transformed how manypeople listen to radio. The 94 percent figure calculated by Arbitron has stayed virtually unchanged for the last five years,the time from which data are available.
Radio Reach
Percent of the population 12 and older, 1998 – 2002
Design Your Own ChartArbitron ’Radio Today’ annual report
Similar to what is occurring in the magazine industry, the growth in stations, instead, appears to be fragmenting the radioaudience into finer and finer niche groups. The 47 recognized radio formats include such things as Adult Contemporary,Alternative, Country, Classical, Beautiful Music and Farm/Agriculture. And even these 47 formats are prone to splittingand changing to create new niche markets. What was once Contemporary Hit Radio, or CHR, now includes CHRPop,CHR80s and CHRDance. 1
This represents a remarkable shift. When commercial radio was begun, stations were broadly programmed channels,much like the later television networks. The same channel, depending on time of day, offered serials, then soaps, musicand news. Today, the strategies behind formating radio are even more targeted than cable television. This narrowcasting,as it is termed, adds to cultural fragmentation. It also tends to minimize accidental learning – people becoming morefamiliar with news, information or even music that they were not seeking out.
This targeting in recent years has most likely played a part in the stability of radio’s overall audience. The stability mightalso be attributed to the fact that radio is a medium built on habit. With preset stations on the car radio, the clock radioand even on streaming audio, people’s radio tendencies tend to vary little day to day. Think about your own radiolistening. Have your habits changed significantly? Do you listen in the car on weekdays? In the kitchen on Saturdaymorning when you have your coffee? Only to Dr. Laura?
Tied to listening to the same stations for the most part, data gathered over the last five years reveal little change inwhere people listen to the radio. The lone shift here has been a steady climb in car listening over the past five years.Why? The most likely explanation is cultural. People are driving more. Data from the Department of Transportation’sBureau of Transportation Statistics indicate that the average driver spends 55 minutes behind the wheel every day. 2
What has intrigued radio professionals is that there has been no apparent change in listening due to technology. Therewere theories that Internet radio streaming, which makes it possible to listen to radio on the computer, at work or athome, and to pick from among many more stations than just those in the listener’s own city, would radically transform
radio. The Internet has led to a surge in news consumption of textbased Web sites. People check out news Web sitessuch as MSNBC.com at work throughout the day, creating a whole new class of news consumers.
But no analogous surge in daytime listening has happened on the radio. Research suggests that while people may bewilling to dip their feet in the water they may not necessarily dive in. According to a 2003 study by Arbitron/Edison MediaResearch the number of individuals who had ever listened to radio stations on the Internet increased from 6 percent in1998 to 33 percent in 2003. 3 But when asked about more regular online listening, only 10 percent had listened to a radiostation online in the past month. Only 5 percent had listened in the past week.
Where People Listen, 2002
Design Your Own ChartArbitron ’Radio Today’ annual report
Where People Listen
19982002
Design Your Own ChartArbitron ’Radio Today’ annual reports
What is the cause of this apparent disconnection between radio and the revolutions occurring in broadcast technology?One contributing factor is the decision made by some organizations to limit or prohibit alternative forms of broadcastsuchas Internet streaming of audio and video–for their socalled overtheair radio stations (those stations also availablethrough traditional radio outlets and not Internet or satelliteonly stations). As a result, the information and programmingthat attracted a listener to the station is simply not available online.
Another might be the attitude cited by some researchers that many listeners view their computer as simply anotherreceiver, no different than the traditional radio that might already be sitting in their kitchen or on their desk. The listenerwith this mindset would most likely choose whichever mode of listening is most convenient to their location. Add to thisthe reality of the digital divide and the weight online streaming can put on computers and computer networks. Someorganizations and corporations have instituted rules limiting or prohibiting the use of streaming websites in office settingswhile some athome computer users are simply not sufficiently equipped to enjoy streamed audio in as clean a fashion asthe traditional radio on their desk.
The newest evolution of radio is the advent of satellite networks like Sirius Satellite Radio and XM Satellite Radio. Whilethis report is primarily concerned with the state of radio journalism on overtheair stations these satellite networks areenabling radio listeners an increasing amount of control over the content they listen to thanks to a finely delineatedformatting scheme. Moreover, satellite technology allows listeners the kind of universal access offered by the Internet (anindividual abroad can access radio stations from back home) while specially designed receivers for car and home preservethe mobility that is radio’s personal strength as a medium.
Radio News Listnership
So how much of radio listening is listening to news?
The answer is not as simple as one might think.
BIAfn data indicate that 3 percent of the nation’s 13,000 radio stations (or 348) list Talk as their primary format. Some1,000 have chosen to list their primary format as News (8 percent). We cannot ignore the effect on the findings of selfdeclared formats and the lack of overall format guidelines. Anecdotal information suggests that many of these Newsstations might more properly be considered Talk or Information stations. 4
In addition, many stations mix news and talk or news and classical music. Others listed as Spanishlanguage stations donews in Spanish. These format designations just indicate what represents the majority of the broadcast day, but do notaccount for what may make up some or even a large minority of the broadcast day.
According to information in Arbitron’s 2002 Radio Today Annual Report, 15 percent of radio listeners say their primaryradio station is a News/Talk station, the largest single category of radio listeners. 5
What Radio Formats People Listen To, 2002
Design Your Own ChartArbitron ’Radio Today’ annual report
News/Talk formats have enjoyed a minor increase in audience since 1999 and there have been some – but not huge –shifts in the audience size of other formats. The greatest increases have taken place in Country and Religious audiences(about 3 percentage points each over the last five years), while various other formats, Urban, Oldies and AdultContemporary, have all declined marginally. 6
Cultural cues may provide some answer. There was the expansion of country music into the mainstream with thepopularity of singers and bands like Shania Twain, Garth Brooks and Lonestar.
The September 11 terrorist attacks may provide further explanation. Country music prides itself on its unashamedlypatriotic nature, and a turn toward more religious messages might be a logical response to the terrorism followed by war.This would also reflect the rise in religious syndication, particularly in the AM band. One example is American FamilyRadio, a Christian radio group that is part of the American Family Association. According to BIAfn, the American FamilyAssociation owns 107 stations in 36 markets and is the fifthlargest owner in radio today. 7
But turning back to News, who are these people who choose News or Talk as their favorite format to listen to? They are aremarkably diverse mix, more diverse, indeed, than most other news mediums. The Arbitron study, for instance, shows awide educational and economic range among those who listen to News and Talk. While the largest percentage oflisteners (40 percent) leans slightly toward college graduates and those making more than $75,000 annually (35 percent),13 percent of listeners earn less than $25,000 annually and list their highest level of education as a high schooldiploma. 8
This demonstrates another strength of radio: its lack of cost to the consumer. A house may have one or two televisionsets costing a few hundred dollars each. A newspaper may cost little for the value, but still 50 cents a day. A radio cancost a few dollars to buy and last for years, affordable enough for one in every room, the car and work.
The age of the news audience is also surprisingly diverse. As is the case in other news media (newspapers and networkTV), the largest group is people 65 and over (30 percent). Individuals 35 to 44 make up about 17 percent of listeners, asdo those 55 to 64. 9
Listeners to NewsTalkInformation Stations, by Age
1998 – 2002
Design Your Own ChartArbitron ’’Radio Today’’ annual reports* 1998 data includes children’s formats.
The news radio audience is more male than female, and it is becoming even more so. Males now account for 60 percentof news listeners, up from 57 percent in 1998.
There is most likely no one reason for the decline in female listenership. It is possible that female listeners have anegative reaction to the aggressive nature of the male talk radio host. Another influence might be traced back to the car.While it is a statistic that soccer moms across the country might want to debate, Bureau of Transportation Statistics datashow that women actually spend roughly half as much time on in the car each day than men. The average female driver
tends to spend about 44 minutes per day in the car and drives approximately 21 miles. Male drivers, in contrast, spend anaverage of 67 minutes behind the wheel and drive 38 miles daily. As noted above, the average overall is 55 minutes. 10
What are we missing by looking only at the News/Talk format to get an idea of the use of radio for news? Namely, thehourly newscast that happens on many music stations, from Country to Hit Radio. To assess the impact of these newssegments, we must turn to survey data.
A 2000 survey of radio listeners conducted by the RadioTelevision News Directors Foundation (RTNDF) suggests this isan important part of radio news. The vast majority (98 percent) of listeners interviewed indicated that they did not changethe dial when news came on and did pay attention during those hourly updates. Fully 41 percent of selfdeclared heavylisteners indicated that they got news content while listening to a music format station. And 47 percent said that theychose their radio station based on the news it provided. Looking more broadly at all respondents, 88 percent said theylistened to news on music stations during the week. Only 2 percent reported changing the station when the news cameon. Even when choosing a radio station with an alternative format, the news content available still informed the listener’sdecision. 11
This may mean that even though radio is perhaps the most narrowly targeted communications medium, it could stillinvolve one component of news consumption that has been unique to broadcasting, the idea that listeners might comeacross information they did not know they would or should be interested in. The onceanhour news brief offers thepossibility that the teenage Hispanic female who listens only to Urban format stations, the middleaged White male wholistens primarily to talk radio and the older AfricanAmerican female whose car radio is set to classical programming willall receive information on issues regarding health care, taxes or immigration issues. This socalled incidental knowledge isa critical element in building public opinion about issues of the day.
Nevertheless, this possibility is severely limited by the extreme brevity of these newscasts. One or two minutes once anhour is not uncommon, which leaves room for little more than headlines. A listener might learn that Congress is voting ona new Medicare bill but not understand the impact of the measure. With the growth of media consolidation and suchtechniques as voicetracking, any local aspect to this news is even more limited.
Footnotes
1. Arbitron, website data, www.arbitron.org
2. The statistics bureau does not have trend data on this figure. But its data do indicate that that 87 percent of peopleuse their personal vehicle, as opposed to public transportation or some other mode of travel, when making daily travel.Daily travel, as the bureau defines it, includes commuting, shopping and errands and social or recreational trips (visitingfriends, relatives, etc.).
3. Arbitron/Edison Media Research, Internet and Multimedia 11: New Media Enters the Mainstream, 2003
4. 2002 data from Arbitron list 1,999 stations as News/Talk formats. As noted earlier, there are some discrepanciesbetween numbers cited by Arbitron and those included in BIAfn’s data.
5. Arbitron, Radio Today, 2003
6. The category “other” is actually higher, but it is a miscellaneous catchall. This percentage has not changed appreciablyover the years, even as the radio dial has become more fragmented.
EconomicsEconomicsAll the evidence suggests that news remains a vital and profitable component of radio. Some owners appear moresuccessful economically at producing news than others. And it appears to be more important to some companies thanothers. But outside of one broadcast organization, news is an integral part of the mix for every major company, even ifless and less of the news on that station is original local programming. 1
Overall, stations listing news as their primary format (not including Talk stations) brought in revenues of $1.37 billion in2002, out of total radio revenue of $12.72 billion. If we look at just the topfive radio companies for which information isreadily broken down, news stations on average account for 11 percent of all revenues, though that ranges from as little as4 percent at one company to as much as 18 percent of revenues at another. 2
Number of Stations Owned by Top Companies*, 2002
News vs. all
Design Your Own ChartBIAfn Media Access Pro, unpublished data* Topfive companies that own news format stations
News station holdings by some companies appear to do much better than others.
At Infinity Broadcasting, which is owned by Viacom (CBS), 12 percent of its stations are News/Talk, but they provide 18percent of the revenue. At Clear Channel, on the other hand, 11 percent of the stations are News/Talk but provide 8percent of revenue. At Entercom, a company that owns stations in a variety of formats and is the exclusive radiobroadcaster of the Boston Red Sox and the Kansas City Royals baseball teams, news is also more important, providing15 percent of its revenue (coming from 13 percent of its 105 stations). These percentages may well be a reflection of thesize of the market in which the owners are running news stations. 3.
Design Your Own ChartBIAfn Media Access Pro, unpublished data*Topfive companies that own news format stations
Revenues from News Stations for Top Companies*
1995 – 2002
Design Your Own ChartBIAfn Media Access Pro, unpublished data*Topfive companies that own news format stations
Beyond these broad figures, getting a handle on the economics of news broadcasting is difficult. Again, most of theavailable data is through surveys. The best source we have found is the annual survey of radio news directors and generalmanagers originally conducted for the RadioTelevision News Directors Association (RTNDA), by Professor Robert Papperand Associate Professor Michael Gerhard, who teach telecommunications at Ball State University in Indiana.
The evidence here suggests some confusion over profits, at least at the station management level. In 2003, 25 percent ofthe news directors and general managers surveyed said that their stations made profits on news, up 10 points from 2002.The majority, 58 percent, reported that they did not know whether their stations made money on news, a figure that has
Revenues of Top Companies, 2002 News stations vs. other stations
moved around in recent years but has remained above 50 percent since 1996, when the respondents were first given theoption to say that they did not know. 4
Why such uncertainty? Part of it is likely traced to the administrative structure of radio stations. News is no longernecessarily a local product in radio. It may be no surprise that general managers at Urban music stations would not knowwhether the hourly news briefs presented on their stations actually made money, especially if the station in question doesnot have a news director on staff, but instead runs a report generated by a central organization. Furthermore, a stationwhose primary format is Tejano or Album Oriented Rock simply might not be concerned enough with the money made bynews briefs to do the accounting. They are, after all, selling advertising time based on the audience captured by theirmusic, not their news.
But this should not discount the higher percent reporting profits, and the data suggest that half of that increase camefrom station executives who reported losing money on news the year before and the other half from those who said theydid not know.
Radio News Profitability
Survey of news directors, 1997 – 2003
Design Your Own ChartSource: “RTNDA/Ball State University Annual Survey,” 1997 through 2003
Footnotes
1. BIAfn Media Access Pro, unpublished data. Every station in the American Family Association, the fifthlargest radiogroup in the country, lists religious as its primary format. The stations do air news, but it is not their primary format.
2. Ibid
3. Ibid
4. RadioTelevision News Directors Association (RTNDA), “RTNDA/Ball State Univeristy Annual Survey,” 1999 through2003, www.rtnda.org
OwnershipOwnershipNo area of the media landscape has been untouched by consolidation. With radio, this movement creates an interestingdichotomy. The general public probably understands that network anchors like Dan Rather or Katie Couric do not work attheir local television station even though they appear on the same channel as their local anchors. There is even a certaincachet to clearly demonstrating the difference: local television stations market the fact that they are part of the ABC orCBS News family.
Radio, on the other hand, is moving away from such distinctions. Technology has made it ever easier to seamlessly splicepieces of local information into a generic broadcast to give the appearance that the programming is local. Radio listenersmay not give a second thought to what company might stand behind their local radio station. They may be aware of thepresence of corporations like Clear Channel or Infinity Broadcasting, but they might not understand how large theirpresence is. More than that, they might not know what impact the ownership question has on what they listen to.
But the level of consolidation in radio exceeds that of most media, particularly in the case of one company, ClearChannel. Because it has become so large, it is viewed, particularly by critics, as a kind of canary in the mineshaft, aharbinger of some of the possible consequences of consolidation. The phenomenon has even taken on a name, “ClearChannelization,” so dubbed by Thomas C. Green, a writer for the UKbased IT News Service The Register. 1
Understanding the current ownership structure first requires some examination of the level of consolidation that hasoccurred.
If we look at the top three owners over the last several years we see that, in 1999, Clear Channel, Cumulus Broadcastingand Citadel Communication Corporation, combined, owned fewer than 1,000 stations. Today they own just over 1,600,with Clear Channel owning 1,207 of them. Much of this gain can be attributed to a change in the TelecommunicationsAct of 1996, which eliminated the rule that capped the number of stations one company could own at 40. That changeallowed Clear Channel to acquire the 460station AMFM Inc. in June 2000. Before that change, Clear Channel owned amere 43 stations. As of 2002, 21 companies own more than 40 stations each. 2
Number of Stations Owned by Top Broadcasting Companies
Combined, the top 20 companies own more than 20 percent of all domestic radio stations. The topfive companies ownmore than 14 percent of the total number of stations. Clear Channel has stations in 191 of the 289 Arbitronratedmarkets. The secondlargest organization, Cumulus, only operates in 55. Compare this with the fifthlargest owner, theAmerican Family Association, which owns the Christian radio station group American Family Radio in 36 markets.
Number of Markets Reached by Top Companies, 2002
Design Your Own ChartBIAfn Media Access Pro, unpublished data*Topfive companies that own news format stations
While all this represents significant consolidation, Clear Channel stands apart. It is the only company, for instance, tooperate at least one station in each of the 25 top radio markets. ABC Radio and Infinity (Viacom) are the next twocompanies with the greatest reach, but they each have stations only in the top 10 markets. 3 According to the Future ofMusic Coalition report, Clear Channel enjoyed a nationwide share of 27 percent share of radio listeners (103.4 million) inwinter of 2002. By means of comparison, this would mean that Clear Channel reached roughly onethird of the estimatedpopulation of the United States. Only Infinity (Viacom) came close to that with a 15 percent share (59.1 million listeners).From there, percentages drop down below 4 percent share (15.3 million listeners) to include such companies as CoxCommunications (3.5 percent share), Entercom (3.4 percent share), ABC Radio (3.3 percent share) and Citadel (2.7percent share). 4
Design Your Own ChartBIAfn Media Access Pro, unpublished data*Topfive companies that own news format stations What difference does this make? Critics like the Future of Music Coalition contend it is creating homogenization ofculture, making it difficult for new artists and real innovation in music. Groups on the other side, such as the NationalAssociation of Broadcasters, contend the superior resources and expanded formatting of modern radio companies hasmeant more music choices for listeners, not fewer. Those issues are beyond the scope of this report, which is focused onjournalism. But one aspect of socalled Clear Channelization, and voicetracking, the technology of producing the contentfor radio stations from far away, does have to do with journalism. What is the impact on local cities if there are fewerpeople, and certainly fewer people working as journalists, at the local radio station?
Critics are quick to point to an incident that occurred in January of 2002. Of the 80 commercial radio stations in the stateof North Dakota at that time, 23 of them were owned by Clear Channel. In the city of Minot, N.D., Clear Channel ownedall six of the city’s commercial radio stations, leaving only a public radio station and a Christian station as alternatives.The situation proved to be critical when a train derailment caused a cloud of anhydrous ammonia that killed one man andsent hundreds to the hospital. 5
What happened next has been debated. The police said that they were unable to contact anyone at KCJB, a ClearChannel station that was the designated emergency broadcast station. The station was utilizing voicetracking technology.Voicetracking allows a single host to record programming, which can then be distributed in multiple cities. The content isoften punctuated with details specifically related to the listening area to give the illusion that the radio host is local. ClearChannel has said that there were staff members on the station’s premises and that the police simply did not know how toutilize the system. It is unclear who was at fault ultimately, but clearly something went wrong.
What other impact has there been on news? According to a Future of Music Coalition analysis of BIAfn data, fourcompaniesViacom, Clear Channel, ABC Radio and Entercomnow command 67 percent of news radio listeners, some38 million people, as of May 16, 2003. 6
The National Association of Broadcasters has said there has been no negative impact from this consolidation. The NABsaid that a survey of listeners had found that Americans were happy with their radio news and that there were a greaternumber of formats and availability for listeners than ever before. A December 2002 survey by The Mellman Group forNAB reported that 78 percent of Americans felt that their radio stations played an important role in providing news andinformation to their communities (37 percent very important and 41 percent somewhat important). In addition, 66 percentsaid that they were satisfied with the job their local stations were doing in providing them news, information andentertainment programming (37 percent very satisfied and 29 percent somewhat satisfied). 7
The question of consolidation impact is not easily resolved and is more complex than individuals on either side of thedebate might want the public to believe. Trying to get an objective, datacentered perspective on the situation is further
Change in Stations Owned by the Top Companies* 1999 – 2003
complicated by the fact that consolidation has required the readjustment of many of the academic instruments thatsought to keep track of the state of news on the radio. For example, while it is true that the number of people innewsrooms is growing, it is also true that those newsrooms are serving multiple news stations and that a good portion ofthose stations are not even in the same market as the newsroom. By extension, data from the RTNDA suggest that theaverage radio station is locally producing 44 minutes of news per weekday. But, again, this is now a measurement ofwhat is being produced by news departments, not individual stations. Because these departments are now serving agreater number of stations, it might be extrapolated that there is actually, overall, less news being produced. 8 Thenecessary change in the survey methodology limits any ability to make a precise determination about this.
But we do know some things of importance. Technologies like voicetracking and the FCC’s elimination of requirementsthat stations produce news and public affairs programming are transforming what used to be a hyperlocal medium thatoffered school lunch menus into a network of hubs, run by central locations where programming decisions are made. Inspite of this, statistics on radio listenership and levels of audience satisfaction do not demonstrate either a remarkablelevel of decline or a level of dissatisfaction out of line with other media sources. Is it that the news being produced underthese new situations is not significantly different than the news being produced before? Or is this an impact of thehabitual nature of radio usage?
Radio is virtually everywhere — in the gym, at the grocery store, in the car. Are people expressing satisfaction becausethey believe they are getting the information they need to participate in their community? Or is it that they are satisfiedwith the news they are getting on their radio station of choice because they tune in for the music and the news content issecondary? When responding to surveys do listeners remember hearing news once an hour and feel that the merepresence (or even lack of presence) of news on their radio station is satisfactory and disregard the content of thosereports?
These questions seem to beg increased attention as those who concern themselves with studying radio news reorienttheir work in this age of massive consolidation.
Click here to view footnotes for this section.
abecker
Typewritten Text
News InvestmentNews InvestmentThe story inside radio newsrooms is not good.
According to survey data, people are not well paid and their numbers are dwindling rapidly. More news directors are beingasked to manage multiple stations. Budgets are shrinking.
The main source of information for this are the annual surveys conducted by Bob Papper and Michael Gerhard for theRadioTelevision News Directors Association (RTNDA).
Staffing
The RTNDA data through 2001 revealed a steady and sizable drop in radio news staffing over the past decade. In 2001,the average radio newsroom had roughly two people – fulltime and parttime combined – on staff (1.95 on average),down from closer to three people a year earlier (2.60 on average). Compare this to 1994, when the average radio newsoperation had 2.4 fulltime people and 2.1 parttime, for a total of 4.5 people. So, in seven years, radio newsroomstaffing dropped 57 percent. Fulltime employees were down 44 percent. Parttime employees were down 71 percent. 1
In 2003, consolidation issues required the RTNDA to change its survey methodology. The new figures measure thenumber of individuals staffing a news department, though not necessarily the news department of a single station. Inother words, while the numbers show stations in major markets have an average of six fulltime staffers, those six peoplemight be responsible for producing news content for a number of stations. According to data provided by Papper, “Theaverage news department runs news on 3.16 stations… and… more than four in 10 radio news departments (41.9percent) say they do news for one or more stations outside their own market.” 2 Thus, the increase in staffing figures mayactually indicate that overall there are fewer staffers per station.
Changes in Radio News Staff and Budget
2001 compared to 2000 Increase Same Decrease Not SureTotal Staff 25% 66 6 3Amount of News 29% 67 4 0Change in News Budget 22% 47 3 28Plan to Change Amount of News NextYear
18% 71 1 10
Source: “RTNDA/Ball State University Annual Survey”
Management
The trends we see in radio news staffing are made further evident as we look at the climb in the number of stations beingoverseen by a single news director. In 1999, just 3 percent of news directors were managing five or more stations. In2000, that total jumped to 12 percent and, according to the RTNDA’s data, that number has leaped to more than 18percent in 2003. Just onequarter of all news directors surveyed were managing news at a single station.
Design Your Own ChartSource: “RTNDA/Ball State University Annual Survey,” 2003 These news directors also increasingly do more than news. More than 75 percent of news directors said they hadresponsibilities beyond the news, including programming, announcing and operations (the technical side of radio), anincrease of 9 percentage points in just a year ago. This is true even in the major markets, where more than half say theyhave multiple responsibilities. The number of news directors who said they also handled sales appears to be continuing aslow climb from 6 percent in 1999 to 9 percent in 2003. 3
Other Radio News Director Responsibilities, 2003
Survey of news directors
Design Your Own ChartSource: “RTNDA/Ball State University Annual Survey,” 2003
Budget
When it comes to budgeting, there are signs of growing uncertainty. Nearly half of all stations (46 percent) had the samenews budget in 2001 as the year before, a figure that has remained stable for 2002 and 2003. Ten percent either had oranticipated budget cuts according to 2003 figures, compared to just 3 percent in 2001. Roughly than 18 percentanticipated an increase in the news budget, which is down from 22 percent in 2001. Certainly some of this, however, waslikely influenced by the recession of 2001. 4
With the consolidation in radio that has occurred since 1998, pay has improved substantially according to the Pappersurvey. Between 1998 and 2003, news directors’ salaries have risen 24 percent, anchors’ salaries 23 percent andreporters’ salaries 15 percent.
But these percentage increases do not tell the whole story. Consider, for instance, that the salary for a radio sportsreporter has increased almost 60 percent since 1998 but still sits at less than $18,000 a year. Radio journalists are nothighly paid. The median, or midpoint, salary for a news director in 2003, according to the RTNDA data, was $31,000 ayear, or roughly $15 an hour, assuming a 40hour workweek.
The typical salary for radio anchors was $29,500, about $14 an hour. And the median salary for news reporters was$23,000 a year, less than $11 an hour.
What’s more, as the RTNDA data would seem to indicate, consolidation has meant fewer people doing the news, andthose who are left frequently have multiple responsibilities. But the 2003 data shows that there is just barely an 8 percentdifference in the salaries of news directors who handle one station ($31,000) and those who handle three or more stations($33,500). For news anchors that jump is almost 15 percent. For news reporters, however, the salary drops as they covermore and more stations. It is possible that these lower salaries lead reporters to work with more than one outlet. Or itcould be that, in this age of media consolidation, the importance of the news reporter declines as the number of stationsserved by a single news outlet grows. In other words, if one reporter can provide reporting for nine stations thanks to acentral feed, what impetus do large radio corporations have for increasing, or even maintaining, reporter pay? 5
Radio Newsroom Salaries
Survey of news directors, 1998 & 2003
Design Your Own ChartSource: “RTNDA/Ball State University Annual Survey”* Median salaries
Footnotes
1. RadioTelevision News Director Association (RTNDA), “RTNDA/Ball State University Annual Survey.” Web site:www.rtnda.org
RTNDA is the world’s largest professional organization devoted exclusively to electronic journalism. RTNDA representslocal and network news executives in broadcasting, cable and other electronic media in more than 30 countries. RTNDFpromotes excellence in electronic journalism through research, education and training for news professionals andjournalism students. The Foundation’s work is supported by contributions from foundations, corporations, members of theRadioTelevision News Directors Association, and other individuals. Its code of ethics can be found here:http://www.rtnda.org/ethics/coe.shtml.
Public AttitudesPublic AttitudesAudience numbers show that people turn to radio on a regular basis and their listening patterns demonstrate that radio isa solid and stable medium. But, are people listening out of habit or loyalty, or do they feel they are getting somethingunique from radio? Do they tune into news radio because they are trapped in the car or because they are looking forinformation they can trust?
If we look at radio in comparison to its sister mediums, survey data from the Pew Research Center for People and thePress indicate that radio falls below newspapers, television and the Internet as the public’s primary source for nationaland international news. This is not surprising. With the exception of such programming entities like NPR, the BBC andthe ABC Radio Network, listeners tend to identify radio as a local medium and rely on it accordingly. When the RadioTelevision News Directors Foundation (RTNDF) surveyed individuals about their interest in news content on the radio, thetop answers were items that were immediate and local: weather, news and traffic. 1 These are areas where the nature ofradio becomes its strength. The weather box on the front page is set the moment the newspaper leaves the press and,while local television news and online editions of local newspapers are able to provide uptotheminute traffic reports, fewindividuals (currently at least) have televisions or online capabilities in their vehicles.
But again, are we seeing examples of radio as a vital medium or a default medium? What do people think about radio?
What Kind of News Interests Listeners by Age, 2000
Percent ’’very interested’’ in each type by age group
Design Your Own ChartSource: RadioTelevision News Directors Foundation, “The American Radio News Audience Survey.”
A September 2003 survey conducted by Zogby International on behalf of the National Association of Broadcastersreported that 84 percent of the people responded that radio played an important role in providing news and information totheir community (53 percent said very important and 31 percent said somewhat important). The same survey suggestedthat 49 percent of Americans turn to radio on a daily basis for news, weather, traffic, sports and community activities.Findings from the Pew Research Center survey mirror the Zogby results, with 48 percent of respondents saying theylistened to news on the radio regularly. 2
It seems impossible to predict, given the data available, whether further conglomeration of radio stations will affect publicperception of radio as a reliable, local medium. While it may not be the top moneymaker of an organization, evidenceshows that it enjoys a constant, consistent and loyal audience..
If local TV news has its more sensationalized stations, radio has its “shock jocks.” But the highly specialized orcompartmentalized nature of radio formatting allows more precise selection by listeners. There is rarely confusion oroverlap between the more radically opinionated talk radio station and, say, an NPR news station. When asked what theyconsidered to be news, respondents to the RTNDF survey were very clear. Of individuals who considered themselves tobe “news followers,” 80 percent said they felt that both reporting on the stock exchanges and traffic updates were newsand 89 percent thought daily weather reports were news, but only 24 percent said that felt that shows like RushLimbaugh’s or Dr. Laura Schlessinger’s were news reporting. 3
This would seem to fall in line with a January 2003 Gallup Poll that found that 22 percent of Americans relied on TalkRadio as their primary news source, double from four years ago. 4 While the percentage was viewed by some mediaorganizations, and even some hosts of talk radio shows, as troubling, it is not surprising when the broader outline of radioas an information medium is considered. Radio is a medium that has evolved into one with an eye toward very specificformats. Because of its segmentation, despite the fact that formats are not always clearly and consistently delineated, itfosters a situation where listeners will go to the outlet of their own choosing. Many talk radio stations present themselveswith a clear and welldefined position and philosophy that their programming holds closely to. It allows listeners, whomight be interested only in a particular mindset or the opinions of a particular host, to select the portion of the dial thatthey feel best suits their needs or may, in fact, be filling a void they feel is left open in other media sources.
Where advances in television and in technology have worked to give viewers and Web surfers increasing amounts ofinformation (think of the now ubiquitous cable television news channel “crawl” or even the less welcome Internet popupad), radio advances seem to open more options for paring things away. The evolution of radio has given listenersincreasing control over the kind of content they want to receive. Satellite radio entities like XM radio and Sirius, due to anenormous number of niche station types, allow listeners an almost surgical control over what type of music or talk theylisten to. Thus, the Rush Limbaugh listeners can go to their spot on the dial, the Pacifica radio listeners to their spot andthe NPR listeners to another. According to the same Gallup Poll survey, 22 percent of the respondents said that they gottheir daily news from an NPR affiliate station. 5
All spots on the dial offer listeners another element that seems important to the strength of radio. Radio, to a greaterdegree than the newspaper and even local television, has the ability to provide citizens with the opportunity forparticipation in the public forum. The letter to the editor or online submission to an Internet site seems to be a far morepassive and less personal interaction than hearing one’s voice on the radio. Even more importantly, the radio callin showinvolves response from either the host or program guests. While some might debate the “news” value of suchprogramming, the level of audience engagement is indisputable. There is a great value to responsible, considereddialogue on critical issues between experts and the general public.
When Listeners Choose Radio First
Survey of radio news listeners, 1995 vs. 2000
Design Your Own ChartSource: RadioTelevision News Directors Foundation,”The American Radio News Audience Survey.”* Question: Please tell me which one — TV, radio, online sources, newspapers, etc. — you are most likely to turn to
Radio also has a certain advantage as a broadcast medium because it is audio. Radio has the ability to be instantaneous,to break in with important news without concern for having a crew on the location of the event or having to get goodpictures. This is not to say that getting reporters to a location for segments is never an issue, but it is less critical thantelevision. One radio personality, remembering a live event he broadcast from the front gates one of Martha Stewart’ssummer house in Maine after Stewart purportedly blocked a tour group from her property, said that some people listeningto his show later asked him if he had really been on location. It’s a question a television reporter would generally not haveto answer.
Freedom of location might be part of the reason why 84 percent of those responding to Zogby International’s NAB 2003survey said that radio would be very important in “the event of a terrorism attack, mass power outage, inclement weatheror other catastrophe.” 6 Another likely reason is practical. Radios can run on batteries, it is an available outlet forindividuals traveling by car, allowing constant contact with an event, and it is local, allowing listeners to feel as thoughthey are receiving information specific to their own safety as defined by their community’s situation.
Footnotes
1. RadioTelevision News Directors Foundation (RTNDF), “The American Radio News Audience Survey,” 2002.
2. NAB/Zogby International Survey, “Americans Love Their Radio,” Oct. 6, 2003.
3. RTNDF, “The American Radio News Audience Survey,” 2002.
4. Information taken from Steve Carney, “Radio: Around the Dial: 22% of Americans get news from talk jocks”, LosAngeles Times, Friday, January 10, 2003.
5. Ibid.
6. NAB/Zogby International Survey, “Americans Love Their Radio,” Oct. 6, 2003.
ConclusionConclusionWhen we look at the state of radio, we find a medium that is stable though often overlooked. The stability is atestament to the fact that each technology has its own enduring strengths. In the case of radio, its resilience istraceable in part to the fact that listening to it has become so much a part the daily routine of most Americans that ithas faded into the background. The radio is something that comes on when the bedside alarm goes off, when the car isstarted, when you walk into the gym.
At the same time, it is hard to calculate the full impact of the changes the medium has undergone, especially the lossof localness in news. There is merit to the argument that it is beneficial for more stations to broadcast news. It meansthat people going to the radio for music, talk or religious guidance are also getting information about public life. On theother hand, the evidence clearly suggests that news on the radio, particularly in small towns, smaller cities or evenregions, is increasingly something from far away — national headlines, CBS News, NPR. The distribution of news fromcentral newsrooms, as opposed to newsrooms in the stations themselves, might seem to argue against socialfragmentation. People getting the same news are brought together. But radio once stood out as a local news medium,like newspapers, and that, in a growing number of communities in America, is no longer the case. While there are moreoutlets, or more spots on the dial, the diversity of sources actually producing the news has shriveled. Even moreimportant, the events in one’s town, knowledge of local institutions, the ability to rally around local crises, evenawareness of local people, charities and problems, are all eroded.
The implications are subtle but farreaching. The political culture, like the music, becomes homogenized. The adagethat all politics is local becomes less true. The ability to deal with local problems becomes more difficult as an importantmediating institution in town, local radio, disappears.
The anecdotal evidence that the content of radio news has diminished, even if the quantity has expanded, is a reminderthat quantity and quality are different.
IntroductionOf all the sectors of the news media, the Ethnic and Alternative media in America are still in many ways the most fluid.Even defining terms is complex. There are not one or two ethnic media, but dozens. The elements of the Spanishlanguage media in the United States do not have one ethnicity, but they do have one language. Some sectors of ethnicmedia are big business. Others are more political and less commercial. What once was called the alternative press,weekly newspapers in many cities, really in some ways represents an entertainment and longform print weekly ratherthan a political alternative press. Beyond this, there is something some scholars refer to as the “dissident” press, whichis separate from this alternative.
Indeed, ethnic and alternative media, though usually lumped together, are two distinct categories, and they will be dealtwith here separately. Hence generalizations and conclusions are necessarily difficult. In some parts of the ethnic media,owners of small regional outlets are still important players. Ethnic populations change rapidly. And the markets varywidely by ethnicity. Meanwhile, in the socalled “alternative” press, while the companies are hardly household names,consolidation is rapidly changing the medium.
Nonetheless, these media are important to consider. Many of them are growing fast, in contrast to the contraction ofthe mainstream media. Just as important, in many ways, they are closer to their audiences and less focused on profitdemands, which makes them more flexible and more a leading indicator of cultural change.
This chapter will look at these two media using the following structure:
An Overview of the Ethnic Media and the nation’s ethnic makeup.
Ethnic Media OverviewEthnic Media OverviewThe ethnic media are growing rapidly in the United States.
This can be particularly said of ethnic newspapers, the media for which there are the most data. Yet anecdotal evidencesuggests the trend is also true for radio and television.
Even with this growth, large chains have yet to take over ownership beyond some of the Spanishlanguage media. Infact, ethnic media are among of the few areas left where the focus tends to be local. Even national associations linkingthese media are rare.
Because of limited available data, this chapter will focus on only a few areas in the ethnic media. It will first look atOverall Trends, examining a broad range of ethnic media. Then it will focus specifically on the SpanishLanguage Media– newspaper and television. (Data on Spanishlanguage radio is even harder to come by, as is radio data in general, andis not included in this year’s analysis.) Finally, it will briefly discuss Other Ethnic Newspapers.
While this is far from a comprehensive look at the ethnic media in the United States, it is a beginning. There areindications that the ethnic media in the United States are beginning to merge, and more data are likely to becomeavailable in the coming years. In the future, with more data, we hope to give this growing segment of the news mediamore thorough examination.
General Trends
Looking simply at the demographic shifts over the past years, it would stand to reason that the nation’s ethnic mediawould grow. Between the 1980 and 2000 censuses, the number of people identifying themselves as White fell from 83percent to just over 75 percent of the U.S. population. 1 At the same time, other demographic groups increased. TheAsian/Pacific Islander population, for example, grew in real numbers and as a percentage of the whole. People in thatgroup constituted 1.5 percent of the population in 1980 and 3.6 percent in 2000. 2
The biggest growth came in people who identified themselves in the U.S. Census as Hispanic or Latino. In 1980, thispopulation of 14.6 million was 6.4 percent of the U.S. population. By 2000, there were 35.3 million selfdescribedHispanic and Latinos representing 12.5 percent of the U.S. population, surpassing blacks 3 as the largest minority groupin the country. 4
Minorities as a Percentage of U.S. Population
Design Your Own ChartU.S. Census Bureau Charts – Race and Hispanic or Latino: 2000, Race and Hispanic Origin 1790 to 1900
Beyond simple ethnicity, and perhaps more to the point, there has been a large rise in the nonEnglish speakingpopulation. Between 1990 and 2000, the number of people not speaking English at home grew from 31.8 million to 47million – an increase of 48 percent. Spanish speakers led the growth, going from 17.3 million in 1990 to 28.1 million in2000 – an increase of 62 percent. It should be noted that more than half of those Spanish speakers reported that theycould speak English “very well.” Chinese was second in growth, climbing from 1.3 million in 1990 to 2 million in 2000, anincrease of 54 percent. 5
How do those ethnic groups use their nativelanguage media? In summer of 2002, New California Media polled 1,000adult Californians of various ethnicities – 300 Asians, 300 Middle Easterners, 200 Hispanics and 200 African Americans.The data, among the most extensive gathered in this area, provide an interesting look at which media various ethnicgroups trust most and which have the biggest reach within each group.
The findings are twofold. First, all of the four ethnic groups examined here – African Americans, Asians, Hispanics andMiddle Easterners – tend to trust Englishlanguage media outlets more than nativelanguage ones. Hispanics are themost likely to find their nativetongue outlets trustworthier than Englishlanguage, though that is still the minority. AmongHispanics, 39 percent find the Englishlanguage media most credible while 23 percent say this of the Spanishlanguagemedia (38 percent did not answer). Among Asians and Middle Easterners, the gap is wider. Nearly 60 percent of Asianssay Englishlanguage media are the most credible, while only 15 percent say this of the Asian. Similarly, more than fourinten Middle Easterners say they trust the Englishlanguage media the most, compared with just 15 percent who say thisof news outlets in their own language. 6 For all three ethnic categories, the number of those not answering is unusuallyhigh.
Which Media Are Most Credible, by Ethnic Group, 2002
Survey of 1,000 Californians*
Design Your Own ChartNew California Media/Bendixen & Associates, ’’Justice and Journalism,’’ survey, July/August 2002*Question: Who do you think holds more credibility?
The higher trust among Hispanics may have something to do with the size and scale of Hispanic outlets. Farthest alongof the nativelanguage media in terms of development and size, these outlets may have more of a professional look andfeel.
The second main finding concerned how much different ethnic groups turned to their nativelanguage media. In everycategory Hispanics relied more heavily on their nativelanguage media than the other groups. For instance, 41 percent ofHispanics read mostly the Spanishlanguage newspapers, compared with 30 percent of Asians who read newspapersmostly in their languages and 15 percent of Middle Easterners. A mere 5 percent of African Americans relied mostly onnewspapers targeted at American blacks. 7
Types of Newspapers Various Ethnic Groups Primarily Read, 2002Survey of 1,000 Californians*
Design Your Own ChartNew California Media/Bendixen & Associates, ’’Justice and Journalism’’ survey July/August 2002* Question: Which newspapers do you mostly read…?
It is also important to note that the other ethnicities are more likely than Hispanics to read both their nativelanguage andan Englishlanguage newspaper. If the percent who read in their native tongue and those who read in both their nativetongue and English are combined, the other ethnicities are closer in line with Hispanics – and Asians actually report aslightly higher percentage. Fully 56 percent of Asians read a newspaper in their native language or read both nativelanguage and English newspapers. That is true for 53 percent of Spanish speakers. 8
This reliance on ethnic media, however, varies by technology. In television and radio, Spanishspeaking audiences are byfar the most likely to use nativelanguage outlets, even when one adds in respondents who say they use both nativelanguage and English outlets.
Language in Which Various Ethnic Groups Mostly Watch TV
Design Your Own Chart New California Media/Bendixen & Associates, ’’Justice and Journalism’’ survey July/August 2002* Question: Do you mostly watch television in …?
abecker
Typewritten Text
Radio Stations Various Ethnic Groups Mostly Listen To, 2002
Survey of 1,000 Californians*
Design Your Own ChartNew California Media/Bendixen & Associates, ’’Justice and Journalism’’ survey July/August 2002* Question: Do you mostly listen to English radio or native radio?
There are, of course, many possible reasons for this disparity. Hispanic audiences have more media aimed directly atthem. 9 In many areas, they have more than one newspaper to read in Spanish and two networks that broadcast only inSpanish. There is also the possibility that, particularly in border states, many of the respondents to the poll spent time inboth the United States and Mexico and, without the need to learn English, they simply rely on Spanish media.
Whatever the reason though, one thing is clear: the Spanishlanguage media market is large and growing.
Click here to view footnotes for this section.
Spanish Language PressSpanish Language PressAmong the various ethnicities, the Spanishlanguage media stand out for their remarkable growth and for having solidnational figures that are measurable. Numbers from recent years show a newspaper market that is quickly maturing and atelevision market that is booming.
Some trends among the Spanishlanguage media are particularly worth highlighting:
Circulation of Spanishlanguage dailies has more than tripled since 1990.
Ad revenues of Spanishlanguage dailies have grown more than sevenfold since 1990.
Ownership of Spanishlanguage television and radio has seen serious consolidation over the past decade to the pointwhere there may soon be only two real players in the market.
Beyond simple population growth numbers, the Spanishlanguage media have one important element helping theirexplosive growth. Unlike other ethnicities, these news outlets benefit from the fact that language, in addition to culture,define their target demographic group. Hispanics who trace their origins to many different countries all share Spanish as acommon language (other than the relatively few who speak Portuguese, mainly those whose backgrounds are Brazilian).This is a huge advantage over, say, the Asian media, in which the target readership comes from different nationalitiesand ethnicities that speak different languages. Spanishlanguage publications can be read by people from Mexico, PuertoRico, Cuba and the countries of Central America, South America and the Caribbean. In fact, the ethnic backgrounds andexperiences of readers can be quite different even as they all read the same “ethnic” newspaper. It is not ethnicity thatdetermines audience; it is language. That is why, for instance, Telemundo and Univision can be national networks, eventhough they are broadcasting to an audience with varied national backgrounds – a heavily Cuban community in Miami, amore Puerto Rican community in New York, and a predominantly Mexican community in Los Angeles.
But that defining characteristic also means the Spanishlanguage media can vary greatly from city to city depending onthe ethnic background, income and education of the audience. The Project for Excellence in Journalism’s Local TV NewsStudy in 2002 found different news depending on location. In Miami, for instance, the news had a Caribbean flavor, witha distinct focus on Cuba. In New York, with a very diverse Hispanic population, the news was more cosmopolitan inattitude, with a focus on Puerto Rican and Dominican issues. Stations in the southern United States and Los Angeleshad a particular interest in Mexican border issues. 1
What this means for the future of national Spanishlanguage media is unclear. While advertisers have an interest in tryingto reach the entire population (that large block of samelanguage consumers is, in fact, its primary appeal), there may bequestions around programming. What is “news” is guided by more than the language. The issues of the day for a PuertoRican in New York might be very different than the issues for a Mexican in Texas. How those gaps will be bridgedremains to be seen.
SPANISHLANGUAGE NEWSPAPERS
Circulation
One area that has seen sharp growth is Spanishlanguage newspapers. Overall, the combined circulation of Spanishlanguage daily newspapers in the United States has gone from less than 140,000 in 1970 to more than 1.7 million in2002 and is still climbing, according to the National Association of Hispanic Publishers. Particularly noticeable is thesharp increase in circulation from 1990 to 2000, which coincides with the Hispanic population growing to become thenation’s largest minority group. 2 The figures for circulation are even more stunning when contrasted to declines amongEnglishlanguage newspapers in this country. Since 1970, the number of Englishlanguage newspapers has beendeclining, as has the percentage of Americans who buy such a newspaper. Since 1990, Englishlanguage newspapercirculation has dropped nearly one percentage point a year. 3
Design Your Own ChartKirk Whisler/WPR, Carlsbad, CA
EnglishLanguage U.S. Daily Newspaper Circulation
Select years 1970 – 2002
Design Your Own ChartEditor and Publisher Yearbook Online data
In addition to a rising Hispanic population, the growth in Spanishlanguage newspaper circulation is spurred on by a sharpincrease in the number of daily newspapers available. The number more than doubled from 1990 to 2000. 4 These trendssuggest that sometime in the last decade, the Hispanic population reached a critical mass that allowed this exponentialgrowth.
Spanish-Language U.S. Daily Newspaper Circulation Select years 1970 – 2002
abecker
Typewritten Text
Design Your Own ChartKirk Whisler/WPR, Carlsbad, CA
Ownership
In general, a big wave of consolidation has yet to really hit the print side of the Spanishlanguage media, but that isbeginning to change. It is still largely rooted in community papers that sprang up as the immigrant populations arrived.The owners are local and the papers are unique to that community. Take for example El Mañana, an independent20,000circulation daily in Cicero, Illinois, or La Voz Hispana de Connecticut, a 15,000circulation newspaper in NewHaven owned by the local La Voz Hispana Newsprint that publishes twice a month. 5
But as the Hispanic population has grown in size and buying power a trend seems to be developing wherein large nonHispanic companies are looking to tap into the Spanishspeaking market. The Tribune Company is setting out to create anational chain of Spanishlanguage papers that can negotiate national advertising contracts. The company hasannounced an expanded Sunday version of Hoy in Chicago. And Tribune has sold off its share of the Los Angeles dailyLa Opinion to the paper’s founders, the Lorenzo family, with whom Tribune coowned La Opinion. Tribune is nowexpected to launch a Los Angeles version of Hoy to compete with La Opinion. The battle between these two papers, onea venerable Hispanicowned outlet and the other a part of Tribune’s growing Spanishlanguage presence, will be a criticalone in the coming years. Meanwhile, the A.H. Belo Co., publisher of The Dallas Morning News, is launching a Spanishlanguage daily in Dallas. And KnightRidder looks ready to expand. Its El Nuevo Herald in Miami is one of the fastestgrowing newspapers in the country and the paper’s success has led the company to expand its Fort Worth Spanishlanguage daily, La Estrella.
In the beginning of 2004, a second trend emerged in Spanishlanguage newspaper ownership. The owners of La Opinionand New York’s El Diario/La Prensa merged to create a new Hispanicowned media company, Impremedia. The companywas created to serve as a counterbalance to the buyouts and expansions by Englishlanguage companies in the Spanishspeaking newspaper market. Impremedia made clear from its inception that it plans to buy other Spanishlanguagenewspapers and become a force that might be able to take on behemoths like KnightRidder and Tribune.
Economics
The last dozen years have seen ad revenues skyrocket at Spanishlanguage daily newspapers. Since 1990 the figureshave grown more than sevenfold, from $111 million in 1990 to $786 million in 2002, according to figures from the LatinoPrint Network, an organization designed to help find advertisers for Spanishlanguage papers. 6
Number of Spanish-Language Daily Newspapers in the U.S. Select years 1970 – 2002
Design Your Own ChartKirk Whisler/WPR, Carlsabd, CA* U.S.based newspapers
Beyond the simple demographic changes and increase in the number of outlets, Spanishlanguage newspapers have hadanother benefit to aid their growth. Unlike other ethnic presses, the growth of the Spanishlanguage press and Hispanicreadership has led to a kind of nationalization of advertising resources in the form of the Latino Print Network. The spreadof the Hispanic population has helped make this market national. The Latino Print Network sells ads to newspapers thatare part of the National Association of Hispanic Publishers group, consisting of papers in 27 states.
This wide reach is important. Even though the Spanishlanguage newspapers are more developed than some of theirother ethnicmedia counterparts, their numbers are still small compared to the circulation of the major Englishlanguagemetro dailies. Even La Opinion, the Los Angeles daily with the largest paid circulation of any Spanish language paper inthe country, has a circulation of only about 126,000. 7 By creating a national Spanishlanguage market, the Latino PrintNetwork has created an easy way for national advertisers to reach “over 200 publications and 10 million subscribers withone phone call,” as the group says on its site. This onestop shopping can only aid the growth of the Spanish languagepress particularly as the number of large chain stores grows.
SPANISHLANGUAGE TELEVISION
In television, among the ethnic media it is really only the Spanishlanguage channels that have a sizeable and significantpresence. There is not one, but two networks aimed at the Hispanic audience – Telemundo and Univision. Telemundo,the smaller of the two, was launched in 1986 by Saul Steinberg and Henry Silverman of Reliance Capital Group, whobelieved mainstream outlets were not paying enough attention to the nation’s growing Spanishspeaking population. Thenetwork was cobbled together out of stations in Miami, Los Angeles and New York and sold to Sony in 1998 for $539million. Then the network was purchased by NBC in 2002 for $2.7 billion.
Univision, which has roots that trace back to 1961 and a small station in San Antonio, came into existence in its currentform in 1992, when the network was purchased from Hallmark by a consortium of buyers. Today Univision is the giant ofSpanishlanguage television. At the time of the Telemundo/NBC deal in 2001, some estimated Univision’s overall valueto be at least $8 billion – and that doesn’t take into account the company’s deals since then, such as the 2003 purchaseof the Hispanic Broadcasting Company radio group for $3 billion. Univision owns 50 stations and has 43 affiliates.Telemundo owns 15 stations and has 32 affiliates. 8
abecker
Typewritten Text
abecker
Typewritten Text
abecker
Typewritten Text
Spanish-Language Newspaper Ad Revenues Selected years, 1970 – 2002
Design Your Own ChartSabrina Jones, ’’Hispanics Surpass Blacks as a Growth Market for Ads,’’ Washington Post
News Operations
For a long time Univision was the leader in the Spanish language TV news race because it was alone. Five years ago,Telemundo didn’t even have a news operation. But the battle is now joined and Telemundo has some specialadvantages. Since NBC purchased Telemundo the Englishlanguage network has pumped more than $70 million intoTelemundo’s news gathering operations, doing things like buying cameras, building sets and adding newscasts inimportant markets. And NBC offers a unique advantage to Telemundo over Univision, the extensive newsgatheringoperations it already has in place with its news division and MSNBC. While the work of NBC’s correspondents isobviously of limited value because reports are done in English, Telemundo can tap into the network’s satellite feeds andair its news footage.
In 2003, the changes in Telemundo’s news operations were readily apparent. It, not Univision, was the first Spanishlanguage network to announce the War in Iraq had begun. And while Univision started its coverage with one small newsteam in Kuwait, Telemundo had five journalists in the Middle East – one in Baghdad itself. As a result the network sawits viewership shoot up 27 percent in the first two days of the war. Univision quickly played catchup, sending its mostpopular anchor to the region and nailing down a series of exclusive interviews. But without Telemundo’s spurring, it’sdifficult to say what Univision’s coverage would have looked like.
Overall, though, Univision still has the bigger news operation and still offers more news programming throughout the day.Schedules, counting local news, vary from station to station, but Univision’s television schedule shows seven hours ofnews programming on an average weekday – counting news magazine and morning shows. In Washington DC, theUnivision affiliate airs 6 ½ hours. Telemundo airs news programming 3 to 4 hours a day depending on how loosely onestretches the definition to include news/talk. In Washington, the Telemundo station follows the national schedule.
Usage and Economics
If there was any question about the growth potential of these networks, it was answered when NBC purchasedTelemundo. While the 1990s were a time of big growth among the Spanishlanguage media, analysts believe there is stilla lot of room for more. Ad spending in Spanishlanguage radio and television has not kept up with population growth.Hispanics make up about 13 percent of the United States population, but attract only about 2 percent of the annualadvertising dollars here. 9 When NBC purchased Telemundo, it estimated that Hispanic/Latino buying power would growfrom $400 billion to $1 trillion a year by 2010. 10
A look at the 2003 revenue for Univision suggests there is indeed still a lot of room for growth in the market. The networkranks as No. 24 in Broadcasting & Cable’s top25 television networks with revenues of $568 million, an increase of 7.4
abecker
Typewritten Text
Spanish-Language TV Stations by Network
abecker
Typewritten Text
abecker
Typewritten Text
percent over 2002. But revenues could be higher. The network’s viewership, 3.1 million, is higher than all but fournetworks on the list. 11
The Spanishlanguage audience offers other advantages to advertisers. The audience has more of the desirable youthdemographic than other audiences. Nielsen data for 2003 estimate that 65 percent of the Hispanic population is under35, compared to 45 percent for nonHispanics. Every Hispanic household reached by advertisers has more people livingthere – 3.6 members versus 2.4 members per nonHispanic household. 12 Furthermore, Nielsen data from 2000 showthat Hispanics also watch much more television than the nation, an average of 17 hours and 28 minutes per week, whilethe nation on average watches for 13 hours and 15 minutes. In fact, across every age demographic, Hispanics outwatchthe nation. The biggest gap is in the 211 age group where Hispanic children watch 6 hours and 52 minutes of televisiona week, compared with 4 hours and 57 minutes for the nation at large. 13
Prime Time Television Viewing per Week, 2000
In hours
Design Your Own ChartNielsen Research, ’’Hispanic Weekly Television Usage: Primetime
And the Spanishonly audience is growing. According to Liz CastellsHeard, president of Castells & Asociados, a LosAngeles ad agency, about 55 percent of Hispanics tuned in to Englishlanguage television in the early 1990s. In 2003 thatnumber fell to 30 to 35 percent. 14 That trend could mean several things. In part, it is probably due to the growingHispanic population through immigration. As the number of new Spanishspeaking Americans climbs, it only makes sensethat they would turn to Spanishlanguage broadcasts. It could also mean that the rise of Spanishlanguage outlets hascreated a media environment that does not require immigrants to learn English. Even when people learn a secondlanguage as adults, they often prefer to do certain things in their first language, such as getting their news. Moreover,much of the English acquisition is limited and functional rather than fluent. Ethnic media provide a certain kind of newsthat is not available from the mainstream media, most importantly news of home countries, and also more detailed localcoverage of geographically discrete ethnic communities. If foreignborn Spanish speakers want to know what is happeningtoday in a Dominican economic crisis, a governor’s election in Puerto Rico or a Nicaraguan corruption scandal, Univisionor Telemundo is the only practical choice. The trend has a lot to do with the media being centered on a language ratherthan an ethnicity. If all the Spanishspeaking immigrants that entered the United States spoke languages based on theirindividual nationalities, the growth of the Hispanic media would probably not be as rapid. Slower growth would meanfewer Hispanic outlets and fewer outlets likely mean fewer listeners. The other possibility, as mentioned earlier, is thatmuch of Hispanic population in the United States is migratory, spending months on both sides of the United StatesMexican border. It would stand to reason that the Spanishlanguage media would be their first choice, and their onlychoice if there were enough of it. However, some experts contend that the Hispanic foreignborn population is now lessmigratory than it ever has been.
Ownership
When Telemundo was purchased by NBC in 2002, the Spanishlanguage network immediately grew in stature and wentfrom being a kind of alsoran to a serious secondplace network with a lot of potential for growth. The buy meant aHispanic network was essentially being taken over by an Englishlanguage conglomerate, since NBC’s parent company isGeneral Electric. It meant that big money and resources were behind the network, maybe even enough to take onUnivision.
Meanwhile, Univision, the solid firstplace Spanishlanguage network, has secured its place differently. Owned by thebillionaire A. Jerrold Perenchio and a group of Hispanic investors, it is relatively insulated from outside pressures.Perenchio is an ItalianAmerican producer who has been involved in such projects as the television series “All in theFamily” and the movie “Driving Miss Daisy.” The other parts of Univision’s ownership team are Mexico’s largestcommercial broadcaster, Televisa, and the Cisneros Group, a large privately held media company based in Venezuela.
In 2003, Univision purchased the radio giant Hispanic Broadcasting Corporation. HBC owned 63 radio stationsconcentrated heavily in California, Texas and Florida. The combined assets give Univision a strong position in both areasof broadcasting and have helped make it the giant of the Hispanic media community.
A third company, TV Azteca, a Mexican broadcaster, is in the beginning stages of putting together an Americanoperation.
Click here to view footnotes for this section.
abecker
Typewritten Text
Black PressBlack PressFor well more than a century the black press has played an integral role in the political and cultural growth of the UnitedStates. It was among the first ethnic presses in America. From the abolitionist era through the civil rights movementand to today, it has called attention to issues the mainstream media has ignored. It survives today in part through theNational Newspaper Publishers Association, or NNPA, a federation of more than 200 periodicals aimed at AfricanAmericans around the country.
While African Americans are very likely to read mainstream publications – they are the secondlargest group ofmainstream daily newspaper readers behind whites – they nonetheless have a vibrant “ethnic” press at their disposal.And many African Americans do read these papers, publications such as The Amsterdam News in New York, ThePhiladelphia New Observer, The Michigan Citizen in Detroit. The NNPA estimates its members have a total of 15million readers with $572 billion in annual buying power. 1 And the black press is increasing its online presence as well.From 2001 to 2003, the number of black newspapers with an online presence grew from 40 to more than 90. 2
Asian PressAsian PressFor a variety of reasons the Asian press is difficult to measure as a group, and the word Asian is more complicated thanHispanic. Not only does Asian not speak of a single culture or nationality, it also does not define a particular language.Even within Asian nationalities, there are language differences that make it difficult to group media. China alone hasseven distinctly different dialect groups.
That said, it is clear that some Asian language newspapers have large readerships. The World Journal, a Chineselanguage daily based in New York, reports it has 250,000 in paid circulation. The Korea Times, in Los Angeles says ithas more than 43,000. 1
But without one common language, a single owner is unlikely as is a concentrated advertising push. And without thatinfusion of advertising cash, it is difficult for these outlets to grow beyond their current state. We hope to look more indepth at this area in the future.
Alternative PressAlternative PressIn terms of growth, the only sector that may match the explosive numbers of the ethnic media is the alternative press. Inthe booming economy of the 1990s, the number of alternative weeklies grew rapidly, drawing national advertising. Inrecent years the sector’s growth has slowed, but not stopped.
The scattered data available on the alternative presses suggest a handful of broad trends:Circulation and revenues skyrocketed for alternative weeklies in the 1990s.
While they are often thought of as newspapers for the young, these outlets usually have readership with median agesin the 30s and sometimes 40s, with high incomes and with relatively high education levels.
Though they are usually thought of as local, smallscale outlets, they are increasingly owned by one of a few bignational companies that collect alternative newspapers.
The label alternative weekly, while convenient, does not give due respect to the variances of the publications here. Fromcity to city and even within cities they can look very different.
Is it Still an Alternative Press?
To be clear, the alternative press as defined here has little to do with what many might describe as “alternative.” The termis mostly a catchall phrase used by the mainstream media, but these publications are not what some call the “dissident”press in America (see sidebar). Rather, while they may share some traits with the dissident press, a political mission isnot their defining characteristic. There are dissenting views in these papers, but they are not necessarily grounded inpolitics. Many are not particularly interested in politics at all.
In fact, scanning the realm of what a usually called alternative weeklies across the country, it sometimes seems there arefew things that hold them together as a genre beyond their tabloid format (an almost universal trait) and their advertisingdriven revenue model (they are usually given away free). Often, again depending on the publication, they are mostlytreasured by their readers for their ads. Editorial content can be quite thin in some, particularly when compared to theads. But, as in the ethnic media, there is much variety from city to city.
Alternative Press Audiences
Perhaps the biggest myth about the alternative press is that it is read by and focused on young, pierced and tattooed 20somethings. In fact in many of the nation’s larger cities, alternative weeklies have an audience primarily in their 30s andeven their 40s, according to surveys by media research companies. 1 Their readers are relatively well educated and manyhave high incomes. In Texas, The Austin Chronicle’s readership has a median age of 38. More than 67 percent of thereaders have graduated from college and the median annual household income is $55,000, the data show. The MiamiNew Times’ readership has a median age of 41 and a median household income of more than $47,000. 2 Below, the 10largest cities in America and demographic statistics on their alternative weeklies:
Alternative Weeklies and Demographics for Select U.S. Cities
City Publication Median Age Median Income College Graduate RateNew York Village Voice 35 $50,000 57%
New York Press 37 64,079 51Los Angeles LA Weekly 38 66,000 31
OC Weekly 37 73,000 35Chicago Chicago Reader N/A 57,000 71
Chicago Newcity N/A 51,241 57Houston Houston Press 39 72,000 41Philadelphia Philadelphia Weekly 35 61,444 42
Philadelphia City Paper 36 52,000 46Phoenix Phoenix New Times 37 56,375 35San Diego San Diego City Beat 42 53,725 27
DallasDallas Observer 41 45,090 32 San AntonioSan Antonio Current 37 55,858 30 DetroitMetro Times 36 55,964 38
abecker
Typewritten Text
abecker
Typewritten Text
abecker
Typewritten Text
abecker
Typewritten Text
abecker
Typewritten Text
abecker
Typewritten Text
abecker
Typewritten Text
abecker
Typewritten Text
Source: Association of Alternative Newsweeklies, directory pages, www.aan.org
abecker
Typewritten Text
abecker
Typewritten Text
abecker
Typewritten Text
abecker
Typewritten Text
Why are these readers attracted to alternative weeklies, other than their being free? First, the publications generally offera more comprehensive section of event listings than their mainstream competitors. And the advertising in the alternativeweeklies often serves as a second type of events listing. Local clubs, theaters and galleries advertise in the weekliesabout events because the alternative weeklies offer a cheaper advertising medium than metro dailies. Not to mention thepersonal listings that appear in these publications, which are often more eccentric than those that appear in themainstream press.
Second, the content of the weeklies often delves into areas that the mainstream dailies avoid or do not cover extensively– from city politics to government to entertainment. In Washington, for example, the City Paper devotes a lengthy weeklycolumn, “Loose Lips,” to the city’s vibrant local political scene. A column in December looked at a behindthescenesbattle over a city smoking ban, a dispute between the mayor and a former City Council member over waterfrontdevelopment and the amount a fired city employee received in a settlement.
But why specific readers pick up their weekly alternative paper varies with the style of the tabloid. And there are manystyles.
Economics
The 1990s were very good to the nation’s alternative weeklies. Circulation grew rapidly, as did revenues. The memberpublications in the Association of Alternative Newsweeklies nearly doubled in the 1990s to 123 today. 3 Circulation morethan doubled, rising from 3 million in 1990 to 7.5 million in 2002. 4
Growth in Alternative News Weeklies
Association of Alternative Newsweelies Member Publications, 1990 – 2002
Design Your Own ChartAssociation of Alternative Newsweeklies unpublished data
While the recession of 20012002 hit the papers, it was moderate compared to the economy as whole and was felt in theform of reduction in ad revenues. Circulation was not effected as seriously because these publications are free.
Revenues, which had increased every year since 1992, took a dip in 2001, but began to climb back up in 2002. In 1992,alternative weeklies took in $174 million in revenues. By 1997, that number had more than doubled to $383 million. Itpeaked in 2000, with revenues of $511 million. Though the numbers dropped sharply in 2001, back to $483 million, theybounced back up to $501 million in 2002. 5
Design Your Own ChartAssociation of Alternative Newsweeklies unpublished data* Based on AAN member figures
Still the weeklies took a big hit in the form of falling national advertising. At the height of this segment’s success andgrowth, national ads – for things like cigarettes and alcohol, accounted for $35 million to $50 million per year. 6 When theeconomy fell into recession, those ads dried up almost completely, taking a huge bite from the industry. And that loss inrevenue led some of the papers launched during the economic boom to close their doors. In 2002, for example, NewTimes Inc. folded its Los Angeles New Times. At the same time Village Voice Media closed its Free Times inCleveland. 7 But by 2002 the revenue trend was going up again.
Change in Revenue at Alternative Weeklies
Design Your Own ChartAssociation of Alternative Newsweeklies unpublished data* Based on AAN member figures
In terms of economics, the alternative weeklies are arguably the most dynamic of all the media we study. Because of itslocal nature, grassroots readership and reliance on advertising for most if not all of its revenues, the alternative press ishighly flexible. This media sector can more easily add and subtract publications as the market will bear them. But it is
also the most likely to lose publications in market dips. As of 2002, circulation was sitting stable as the economyremained sluggish, but if it improves one might expect new alternative papers will again be founded.
Alternative Press Ownership
Alternative weeklies were not spared from the largescale consolidation that hit the media in general in the 1990s. Whilethe alternative press has historically been among the most local of media, a series of smalltime publications aimed atgetting dollars from local advertisers and covering local stories the big media miss, this image has changed. Todayalternative weeklies, particularly in the big cities are controlled by a small group of companies. The biggest owners areNew Times (which owns papers in Phoenix, Houston, Dallas, San Francisco, Miami and Denver) and Village Voice Media(which owns The Village Voice in New York City and papers in Los Angeles, Seattle, Minneapolis/St. Paul, Nashville andOrange County).Newsweeklies Owned by New Times and Village Voice
New Times Village Voice MediaCleveland SceneDallas ObserverEast Bay Express (Oakland, Calif.)Houston PressMiami New Times New Times BrowardPalm Beach Phoenix New Times The Pitch (Kansas City)Riverfront Times (St. Louis) SF Weekly Westword (Denver)
City Pages (Twin Cities) LA Weekly Nashville SceneOC Weekly (Orange County, Calif.) Seattle Weekly The Village Voice
Source: Association of Alternative Newsweeklies, directory pages, www.aan.org
How Alternative Are They?
In fact, increasingly there are concerns that the alternative weeklies are becoming more like their daily newspapercounterparts than some would like. Case in point was the deal in 2002 between New Times and Village Voice Media, inwhich the two agreed to close papers in markets where the other company has the stronger paper. New Times closed itsLos Angeles News Times to save money from competing with Village Voice Media’s LA Weekly. At the same time VillageVoice closed the Cleveland Free Times, ceding the city to the New Times’ Cleveland Scene. 8
In five of the nation’s 10 largest cities, New Times or Village Voice controls the main alternative weekly. If one adds in athird company, Times Shamrock, then three companies control the primary alternative weekly in seven of the 10 largestcities. These numbers belie the old image of the ideadriven small alternative weekly and instead create an image of anincreasingly corporatized world of moneymaking free tabloids. But, as mentioned above, if there is a medium that seemsto have the ability to change with the economic times, it is this one. If and when the economy improves and theadvertising environment booms again, the question is whether smaller, more independent weeklies will appear. Thispossibility bears watching in the coming years.
Other EthnicOther EthnicData on the much of the rest of the nation’s ethnic media are, by nature, scattered and usually not measured incomparable ways. Each group’s studies are generally highly localized geographically or highly segmented by ethnicity.Not surprising, New York and California, which have large ethnic populations, have the most data.
These data indicate there has been noticeable growth in the media for many ethnicities, particularly in major metroareas. The figures below, gathered in New York City in 1976, 1990 and 2000, are sketchy. They are drawn from differentsurveys. And some of the figures, provided by the publishers themselves, are probably overstated. Still there are somenotable shifts, particularly among Bangladeshi, Caribbean, Chinese, Indian, Korean and Russian newspapers. Even ifthe figures are overstated, the changes and growth speak to a vibrant immigrant press in New York and to a lesserextent the growth of the ethnic press in smaller cities.
NEW YORK ETHNIC PRESS CIRCULATION BY ETHNICITY
In addition, the Editor and Publisher 2003 Yearbook lists 143 weekly ethnic newspapers nationally covering a widevariety of nationalities. These papers are a mixed bag. Circulation is as low as a few hundred for some, such as theNasinec, a Czech newspaper in Granger, Texas, with a paid circulation of 420, and Russian Life, a San Franciscoweekly with a circulation of 750. For others it ranges up to near 100,000. Haiti Proges in Brooklyn boasts a paidcirculation of more than 70,000. And African Times in Los Angeles has a paid circulation of more than 85,000. 1 Infuture years, this report plans more indepth study of all these ethnic media.
Other Ethnic Media Ownership
Beyond the Spanishlanguage media, the rest of the ethnic media are at an earlier stage of development. In Californiaalone there are more than 1,000 media outlets for the growing ethnic populations, according to Pacific News Service.Many, if not most, of them are small and independently owned. That trend may continue so long as the populationsrepresented remain too small to represent large buying power. Big, diverse media companies are unlikely to make theinvestment in buying a cadre of outlets aimed at different populations in different languages. If there is a possibility ofpulling together ethnic media outside of the Hispanic outlets, it will likely center on small companies specializing inspecific ethnicities (a Korean media company, for example, or an Indian one). At this point, it seems that large nationalethnic news companies are years away.
Beyond all the facts and figures concerning the American news media, there are the attitudes and opinions journaliststhemselves have about their industry and profession. This section of the State of the News Media 2004 report detailsthe results of a survey of more than 500 national and local reporters, editors and executives. The survey was conductedby the Pew Research Center for the People and the Press in collaboration with the Project for Excellence in Journalismand the Committee of Concerned Journalists.
Contents:
Commentary on the Survey FindingsBy the Project for Excellence in Journalism
Press Going Too Easy on Bush: BottomLine Pressures Now Hurting Coverage, Say Journalists By the Pew Research Center for the People and the Press
Survey Methodology
Survey Questionaire and Topline
1999 Report: Striking the Balance, Audience Interests, Business Pressures and Journalists’ Values
Commentary
Commentary on the Survey Findings
By Bill Kovach, Tom Rosenstiel and Amy Mitchell
IntroductionWhat Journalists Are Worried About A NewsroomExecutive Divide Specific Areas of ConcernThe Internet as a Place of Confidence and CutsConfidence in the PublicPolitics & Ideology Crossing from Concern to Frustration
Introduction
While their worries are changing, the problems that journalists see with their profession in many ways seem moreintractable than they did a few years ago.
News people feel better about some elements of their work. But they fear more than ever that the economic behavior oftheir companies is eroding the quality of journalism.
In particular, they think business pressures are making the news they produce thinner and shallower. And they reportmore cases of advertisers and owners breaching the independence of the newsroom.
These worries, in turn, seem to have widened the divide between the people who cover the news and the businessexecutives they work for.
The changes in attitude have come after a period in which news companies, faced with declining audiences andpressure on revenues, have in many cases made further cuts in newsgathering resources.
There are also alarming signs that the news industry is continuing the shortterm mentality that some critics contend hasundermined journalism in the past. Online news is one of the few areas seeing general audience growth today, yetonline journalists more often than any others report their newsrooms have suffered staff cuts.
Only five years earlier, news people were much more likely to see failures of their own making as more of an issue.Since then, they have come to feel more in touch with audiences, less cynical and more embracing of new technology.In other words, journalists feel they have made progress on the areas that they can control in the newsroom.
While feeling closer to audiences, however, news people also have less confidence in the American public to make wiseelectoral decisions, a finding that raises questions about the kind of journalism they may produce in the future.
There are also signs that the people who staff newsrooms, at least at the national level, tend to describe themselves asmore liberal than in the past.
These findings, which build on work by the Pew Research Center for the People and the Press and the Committee ofConcerned Journalists five years ago, mark the beginning of an annual collaboration between the Pew Center and theProject for Excellence in Journalism to monitor the feelings of journalists.
In addition to assessing the change from 1999, this survey puts down some new baselines for further studymatterssuch as whether the press is too timid, the impact of cable, the Internet and political ideology.
[top]
What Journalists Are Worried About
News people are not confident about the future of journalism. Overall, they appear split over whether journalism isheaded in the right or wrong direction. At the national level a slim majority are pessimistic. At the local level a slimmajority are optimistic. Broadcasters are more pessimistic. Print people are more optimistic. Internet journalists are themost optimistic of all.
Yet eliminate certain job descriptions and things look bleaker. Nationally, remove business executives and a majority ofjournalists think things are moving in the wrong direction. At the local level, it is only senior news managers who areconfident. Business executives are split.
More important, the source of their concern is different than five years ago. Increasingly, journalists worry that theeconomics of journalism are eroding quality.
Sizable majorities of journalists (66% nationally and 57% locally) think “increased bottom line pressure is seriouslyhurting the quality of news coverage.” That is a dramatic increase from five years ago, when fewer than half in the newsbusiness felt this way.
And their concerns may be justified. The State of the News Media 2004 report produced by the Project for Excellence inJournalism in March found that most sectors of the news media have seen clear cutbacks in newsgathering resources.The number of newspaper newsroom staffers shrunk by 2,000 between 2000 and 2004, a drop of 4% overall. Somemajor online news sites saw much deeper cuts, such as MSNBC, which cut around a quarter of its staff between 2001and 2003. Radio newsroom staffing declined by 57% from 1994 to 2001. After an uptick in 1999, network staffing beganto drop again in 2000. Since 1985 the number of network news correspondents has declined by 35 percent while thenumber of stories per reporter increased by 30 percent.
Nationally, quality is still the problem news people worry about most but they are worried about it less than five yearsago. Locally, as many journalists now cite economic pressure as journalism’s biggest problem as point to a lack ofquality.
And those who have felt the economic pressure more acutely are the most worried of all. Among those who reportedstaff cuts in the last three years, threequarters feel increased bottom line pressure is “seriously hurting” news quality.They also were more likely than average to name economic and business pressures as journalism’s biggest problem.
There are also signs that the economic influences on the news business have become more pernicious. Five years agowe found that financial pressure in the newsroom was “not a matter of executives or advertisers pressuring journalistsabout what to write or broadcast.” It was more subtle than that.
Unfortunately, that is less true today. Now a third of local journalists say they have felt such pressure, most notably fromeither advertisers or from corporate owners. In other words, one of the most dearly held principles of journalismtheindependence of the newsroom about editorial decisionmakingincreasingly is being breached.
There is also alarming news here for the Internet. Advertiser and corporate interference with the news content aresimilarly high among those who work in online news, where the line between independently produced content andadvertising may be harder to detect.
All of this may be at the root of another problem that has intensified over the last five years. There is a manifest andwidening gulf between journalists and the people they work for.
The survey broke news people down into three separate groups. Executives were those who have chief financialresponsibility for the news companypublishers, CEOs, chief financial officers. Senior news executives included editorsinchief, executive editors, managing editors and executive producers, down to assistant managing editors. Newsroomstaff included everyone from bureau chiefs down to cub reporters.
In general, journalists have less confidence in their bosses than they did a few years ago.
Less than a third of national journalists rate their leadership as “excellent,” down six points from five years ago. Lessthan a quarter of local journalists feel that way, also down slightly from five years ago.
It may be no surprise that the level of confidence in the bosses declines as you move down the ranks. Yet now evensenior news managers are not confident in the people above them.
It is here, at the level of senior news executives, where the rating of the leadership has dropped most precipitously. Fiveyears ago, 42% of senior news executives nationally had high confidence in their bosses. Today, just 30% do. Locally,the number is 18%.
What is behind the widening morale problem in newsrooms?
The survey results offer two possible explanations. One is that executives and journalists cannot even agree on thebasic situation in their newsrooms. Nationally, journalists are twice as likely to report that their staffs have decreased asare business executives who run news companies.
A second divide between executives and newsroom staffers is over the question of the impact of economics. Nationally,journalists are more than twice as likely as executives to say bottom line pressure is eroding journalistic quality. Thedivide exists at the local level as well but not as drastically.
Whatever the reasons for this, unless staffers and bosses can agree on first describing what is going on in the companyand then agree on its impact, it seems doubtful they could agree on how to deal with it.
Specific Areas of Concern
Beyond cutbacks and pressure to help advertisers or corporate siblings, journalists have other worries as well. Five yearsago, people in the news business shared two overriding concerns. As we said back then, “They believe that the newsmedia have blurred the lines between news and entertainment and that the culture of argument is overwhelming theculture of reporting…Concerns about punditry overwhelming reporting, for instance, have swelled dramatically in onlyfour years.”
Today, the concerns are more varied and less easy to categorize. The worries about punditry are still there but they havediminished both nationally and especially locally. A bigger issue now is a sense of shallowness. Roughly eightinten in the news business feel the news media pay “toolittle attention … to complex issues,” up from five years ago to levels seen in the mid1990s, at the peak of thefascination with tabloid crime stories like O.J. and JonBenet Ramsey.
On the issue of accuracy, journalists seem divided. Nationally, the number of journalists who feel that news reports areincreasingly sloppy and inaccurate is rising. Locally, it is dropping.
And about some matters people in the news businessacross all levelsare clearly less worried than they were five yearsago.
Fewer journalists today see the press as too cynical. And, compared with five years ago, fewer also see journalists asout of touch with their audiences.
Both of these are areas that reform movements such as public journalismwhich was concerned with trying to reconnectjournalists and the publicfocused on.
The Internet as a Place of Confidence and Cuts
In such a landscape, the Internet should be a glimmer of hope, and in many ways it is. The State of the News Media2004 report found that the Internet was one of the few places where news audiences were growing. Just as importantly,young people sought out news online in the same percentages as older people. Privately, some of the country’s topnewspaper executives report that they now have more readers on the web than they do in print. Financially the picture isalso promising, if embryonic. Revenues from the Internet, according to the State of the News Media report, are growingexponentially, though for now they remain small.
Generally, the Internet journalists surveyed, most of whom work for websites of major news organizations, reflect thatbooming sense of the future. They rate their product highly: fully 85% give the websites of national news organizationsa grade of A or B.
Journalists also seem less fearful of technology. While majorities feel the Internet has too much unvetted and unfilteredmaterial, most news people also now see the 24hour news cycle as not harming journalism. More journalists than fiveyears ago think the Internet is making journalism better.
Yet the survey points to something troubling here that online journalists are privately frustrated by. The Internet is themost likely place in journalism to be suffering staff cuts (62%).
Given the growth in Internet news audiences and the growing confidence of journalists about the content, one mighthave expected that companies planning on the future would be moving resources into this growth area.
The fact that this is not happening has two possible implications. First, it suggests that the news industry is managingfor the shortterm to such a degree that it is leaving malnourished the one area that could grow the business out of itscurrent dilemma of declining audience. To maintain profits, it is penny wise and pound foolish. If this is the case, itwould be an old storyand a familiar mistakerepeated again.
The other possibility is that the news business has lost confidence in the basic economic principle that had fueled itsdevelopment for much of the last 200 years:
Namely, that if you can aggregate a largeenough audience in one place, the revenue stream will work itself outeventually. Yet the companies who produce online news apparently do not have confidence that will happen here. If they are notwilling to invest in the newsroom now, when audience and revenues look promising, what will ever convince them to?
Confidence in the Public
Ultimately journalism is predicated on faith in the public. Here, journalists’ views have become dramatically morepessimistic.
The percentage of national journalists who have a great deal of confidence in the ability of the American public to makegood decisions has declined by more than 20 points since 1999. Confidence among local journalists has fallen as well.
What is going on? Does this suggest that as news people get closer to their audiences they conclude people are lesswise than they once believed? Is it possible that market research data is persuading journalists today that theyunderstand their audiences better and also that those audiences are dumber than they thought?
Or, is the loss of confidence in the public more tied to journalists’ views about the content of news? They see newsdoing a poorer job of covering complex issues and conclude that this will leave Americans unprepared for making gooddecisions.
It is also possible that journalists are leaping to another conclusion: They see the content of the news becomingshallower and conclude that this must be what the public wants or why else would their organizations be providing it?
There is also a fourth possibility: liberal journalists unhappy with President George W. Bush’s policies could bedismayed that the public chose Bush in 2000 and until recently have largely approved of his performance.
In the end, whatever the cause of declining faith in the public, the implications are troubling. Even if the economics ofjournalism work themselves out, how can journalists work on behalf of a public they are coming to see as less wise andless able? A cynical view of the public becomes a selffulfilling prophecy that leads journalists to produce a shallowerproduct because they think the public cannot handle anything else.
Politics & Ideology
The findings on politics also point to trends worth watching. Journalists tend to be split over whether the press hasbecome too timid and also too easy on Bushand the split is between national journalists and local. The nationaljournalists tend to feel the press has been insufficiently critical of Bush. National journalists also are the more likely todescribe themselves as personally liberal.
But this does not mean that journalists want to abandon the model of the independent press. Across the board, newspeople disapprove of news organizations having a decidedly ideologically point of view. Even among Internet journalists,often thought of as writing with more edge, threequarters do not favor moving toward this more ideological, moreEuropean model of journalism.
The fact that journalists are more likely to see a conservative tilt in the news than a liberal one invites variousexplanations. It could be a sign of liberal bias. It also could be a natural response by journalists tired of peopleproducing partisan journalism on the right positioning themselves as the counterbalance to a mainstream press theycharacterize as left wing. There will be no settling of that.On the other hand, the fact that the New York Times is the organization most often cited as liberal may embarrass theTimes. The fact that large majorities of journalists cite Fox as conservative may not embarrass that cable network.
Journalists’ own politics are also harder to analyze than people might think. The fact that journalistsespecially nationaljournalistsare more likely than in the past to describe themselves as liberal reinforces the findings of the majoracademic study on this question, namely that of David H. Weaver and G. Cleveland Wilhoit, in their series of books“The American Journalist.”
But what does liberal mean to journalists? We would be reluctant to infer too much here. The survey includes just fourquestions probing journalists’ political attitudes, yet the answers to these questions suggest journalists have in mindsomething other than a classic big government liberalism and something more along the lines of libertarianism. Morejournalists said they think it is more important for people to be free to pursue their goals without governmentinterference than it is for government to ensure that no one is in need.
This libertarian strain is particularly strong among local journalists, who are also more likely to describe themselves asmoderate.
More research here is probably useful. The debate over press ideology is fraught with difficulty. Some of the researchdone in the past has been, frankly, poor, and on the other side, some journalists would rather not face the question atall. Neither of these approaches is satisfactory.
But there is something here for journalists to be concerned about.
Crossing from Concern to Frustration
Five years ago we found a profession that had become more concerned about its performance and more willing toadapt. The findings back then, we said, paint “a picture of an industry aware it is at a cross roads. Journalists havecome to agree with their critics and are embarking on self examination that is a likely first step to change.”
Today, some of that change has happened, but what remains are problems that seem more structural and protracted.
While journalists feel they have gotten closer to their audiences and more willing to innovate, they also are morepessimistic about the public. It is possible that journalists feel they have done much of what they can do themselves to
address journalism’s problems. What they are left with are issues they cannot contend with alone. And they believe thecompanies they work for in the last five years have moved in ways that have only made things worse.
On top of that, there are signs that the growth areas in journalism are not seeing the kind of investment of resources tobuild for the future.
If five years ago we saw the seeds of change, today we see a trend toward fragmentation among all players involved –journalists, executives and the public.
Not only do they disagree on solutions, they seem further apart on identifying the problems
Bill Kovach is chairman of the Committee of Concerned Journalists. Tom Rosenstiel is director of the Project forExcellence in Journalism. Amy Mitchell is associate director.
Survey Findings
Press Going Too Easy on Bush BottomLine Pressures Now Hurting Coverage, Say Journalists
by the Pew Research Center for the People and the Press
OverviewSection I: Views on Performance Section II: Covering the President and the CampaignSection III: Today’s Changing Newsroom Section IV: Values and the Press
NOTE: This report is also available on the Pew Research Center Web site.
Overview
Journalists are unhappy with the way things are going in their profession these days. Many give poor grades to thecoverage offered by the types of media that serve most Americans: daily newspapers, local TV, network TV news andcable news outlets. In fact, despite recent scandals at the New York Times and USA Today, only national newspapers –and the websites of national news organizations – receive good performance grades from the journalistic ranks.
Roughly half of journalists at national media outlets (51%), and about as many from local media (46%), believe thatjournalism is going in the wrong direction, as significant majorities of journalists have come to believe that increasedbottom line pressure is “seriously hurting” the quality of news coverage. This is the view of 66% of national news peopleand 57% of the local journalists questioned in this survey.
Journalists at national news organizations generally take a dimmer view of state of the profession than do localjournalists. But both groups express considerably more concern over the deleterious impact of bottomline pressuresthan they did in polls taken by the Center in 1995 and 1999. Further, both print and broadcast journalists voice highlevels of concern about this problem, as do majorities working at nearly all levels of news organizations.
The notable dissent from this opinion comes from those at the top of national news organizations. Most executives atnational news organizations (57%) feel increased business pressures are “mostly just changing the way newsorganizations do things” rather than seriously undermining quality.
The survey of journalists – conducted March 10April 20 among 547 national and local reporters, editors and executivesby the Pew Research Center for the People and the Press in collaboration with the Project for Excellence in Journalismand the Committee of Concerned Journalists – also finds increased worries about economic pressures in the responsesto an openended question about the biggest problem facing journalism today. As was the case in the 1999 survey,problems with the quality of coverage were cited most frequently. Underscoring these worries, the polling finds acontinuing rise in the percentage of journalists believing that news reports are full of factual errors. In the nationalmedia, this view increased from 30% in 1995 to 40% in 1999 to 45% in the current survey.
When asked about what is going well in journalism these days, print and broadcast journalists have strikingly differentthings to say. TV and radio journalists most often mention the speed of coverage – the ability to respond quickly tobreaking news stories – while print journalists emphasize the quality of coverage and the watchdog role the press playsas the profession’s best features.
Journalists whose own newsrooms have undergone staff reductions are among the most worried that bottomlinepressures are undermining quality. Fully threequarters of national and local journalists who have experienced staff cutsat their workplace say bottomline pressures are seriously hurting the quality of news coverage. Those not reporting staffreductions are far more likely to say business pressures are just changing newsgathering techniques.
Beyond the stress of shrinking workplaces, there are a number of specific criticisms of the news media that are closelyassociated with the view that bottomline pressure is hurting the quality of news coverage. First, there is almostuniversal agreement among those who worry about growing financial pressure that the media is paying too littleattention to complex stories. In addition, the belief that the 24hour news cycle is weakening journalism is much moreprevalent among this group than among news people who do not view financial pressure as a big problem, and a
majority says news reports are increasingly full of factual errors and sloppy reporting. And most journalists who worryabout declining quality due to bottomline pressures say that the press is “too timid” these days.
In that regard, the poll finds that many journalists – especially those in the national media – believe that the press hasnot been critical enough of President Bush. Majorities of print and broadcast journalists at national news organizationsbelieve the press has been insufficiently critical of the administration. Many local print journalists concur. This is aminority opinion only among local news executives and broadcast journalists. While the press gives itself about thesame overall grade for its coverage of George W. Bush as it did nine years ago for its coverage of Bill Clinton (Bamong national journalists, C+ from local journalists), the criticism in 1995 was that the press was focusing too much onClinton’s problems, and too little on his achievements.
There are significant ideological differences among news people in attitudes toward coverage of Bush, with many moreselfdescribed liberals than moderates or conservatives faulting the press for being insufficiently critical. In terms of theiroverall ideological outlook, majorities of national (54%) and local journalists (61%) continue to describe themselves asmoderates. The percentage identifying themselves as liberal has increased from 1995: 34% of national journalistsdescribe themselves as liberals, compared with 22% nine years ago. The trend among local journalists has been similar– 23% say they are liberals, up from 14% in 1995. More striking is the relatively small minority of journalists who think ofthemselves as politically conservative (7% national, 12% local). As was the case a decade ago, the journalists as agroup are much less conservative than the general public (33% conservative).
The strong sentiment in favor of a more critical view of White House coverage is just one way the climate of opinionamong journalists has changed since the 1990s. More generally, there has been a steep decline in the percentage ofnational and local news people who think the traditional criticism of the press as too cynical still holds up. If anything,more national news people today fault the press for being too timid, not too cynical.
Not only do many national news people believe the press has gone too soft in its coverage of President Bush, theyexpress considerably less confidence in the political judgment of the American public than they did five years ago. Since1999, the percentage saying they have a great deal of confidence in the public’s election choices has fallen from 52% to31% in the national sample of journalists.
Nonetheless, journalists have at least as much confidence in the public’s electoral judgments as does the public itself.In addition, the growing distrust in the public’s electoral decisions is not being driven by negative feelings aboutPresident Bush. Journalists who think the press is not critical enough of Bush are no more likely than others to expressskepticism about the public’s judgments.
By more than threetoone, national and local journalists believe it is a bad thing if some news organizations have a“decidedly ideological point of view” in their news coverage. And more than fourinten in both groups say journalists toooften let their ideological views show in their reporting. This view is held more by selfdescribed conservative journaliststhan moderates or liberals.
At the same time, the single news outlet that strikes most journalists as taking a particular ideological stance – eitherliberal or conservative – is Fox News Channel. Among national journalists, more than twice as many could identify adaily news organization that they think is “especially conservative in its coverage” than one they believe is “especiallyliberal” (82% vs. 38%). And Fox has by far the highest profile as a conservative news organization; it was citedunprompted by 69% of national journalists. The New York Times was most often mentioned as the national daily newsorganization that takes a decidedly liberal point of view, but only by 20% of the national sample.
The survey shows that journalists continue to have a positive opinion of the Internet’s impact on journalism. Not only domajorities of national (60%) and local journalists (51%) believe the Internet has made journalism better, but they giverelatively high grades for the websites of national news organizations.
News people also acknowledge a downside to the Internet – solid majorities of both national and local journalists thinkthe Internet allows too much posting of links to unfiltered material. In addition, sizable numbers in the national (42%)and local samples (35%) say the Internet has intensified the deadline pressure they face. The changing mediaenvironment is generally having an impact on journalists’ workloads – pluralities of national and local news people saythey are increasingly rewriting and repackaging stories for multiple uses.
While journalists voice increasing concern over sloppy and errorfilled news reports, there is no evidence that recentscandals like those at USA Today and the New York Times are having a significant impact on the way journalists viewthe profession. The number of journalists who cite “ethics and standards” as the biggest problem facing journalism hasnot grown since 1999. And most say that while plagiarism may be getting more attention these days, it is actually nomore prevalent today than in the past.
Section I: Views on Performance
Press Going Too Easy on Bush BottomLine Pressures Now Hurting Coverage, Say Journalists
by the Pew Research Center for the People and the Press
OverviewSection I: Views on Performance Section II: Covering the President and the CampaignSection III: Today’s Changing Newsroom Section IV: Values and the Press
NOTE: This report is also available on the Pew Research Center Web site.
Section I: Views on Performance
Journalists are divided over whether their profession is advancing or regressing. Only about half of local journalists – andeven fewer national journalists – feel their profession is moving in the right direction. In particular, national TV and radiojournalists are the most negative, with 61% saying the field is headed in the wrong direction, compared with just 33%who say the opposite.
There also is a significant divide between executives and reporters in these national organizations, with executivesseeing the profession headed in the right direction (by a 57% to 38% margin) while reporters say things are declining (by54% to 39%).
Continuing Concerns Over Quality
Problems with the quality of coverage remains a major concern of journalists, but an increasing percentage mentionbusiness and financial factors. A plurality of national journalists (41%) cite quality concerns such as sensationalisticcoverage; the need for accuracy; and a lack of depth, relevance and objectivity as the most important problems facingtheir profession. Collectively, these were also the top concerns volunteered by national journalists in 1999, and in asimilar survey a decade earlier.
Among local journalists, however, business and financial problems are now mentioned as frequently as concerns overthe quality of coverage. More than a third of local news people (35%) cite business and financial factors as the biggestproblem facing journalism, up from 25% five years ago.
There are significant differences among journalists in different media, as well as those working at local and nationalnews organizations, over the biggest problem confronting journalism. Broadcast journalists, especially at the nationallevel, cite issues relating to quality much more often than do their print counterparts. Roughly half of national broadcastjournalists (51%) cite quality concerns, compared with 32% of national print journalists.
By comparison, declining readership is cited by 15% of print journalists at both national and local news organizations,but no more than 2% of broadcast journalists view loss of audience as the most important concern. Instead, broadcastjournalists view limits on resources – and the pressure to make profits and get bigger ratings – as the biggest financialproblems.
Despite the growing concern over business and financial issues, fewer journalists mention an overly competitive mediaenvironment as the biggest problem. In 1999, 17% of national and 15% of local journalists specifically mentionedincreasing competition as a problem; just 5% of national and 2% of local journalists say this today.
While the quality of coverage and business concerns are seen as the leading problems facing journalism, the singleword mentioned more frequently than any other by journalists assessing their profession is “credibility.” Roughly aquarter of both national and local journalists mentioned problems with public trust and confidence in some form, andoneinfive specifically mentioned credibility as the biggest concern for the profession.
Print journalists are far more likely than those in broadcast to see credibility as the biggest problem facing journalismtoday. Fourinten (39%) journalists working at national newspapers, magazines and wire services say credibility is thebiggest problem, compared with just 15% at national TV and radio outlets. And this gap exists at the local level as well,with local print journalists nearly threetimes as likely as local broadcast journalists (33% vs. 12%) to cite credibility astheir greatest concern.
There is also a sizeable difference between younger and older journalists in perceptions of the credibility problem. Justoneinten journalists under age 35 cite concerns about credibility and public trust as the biggest problem facing theprofession, compared with about quarter of those age 35 to 54 (26%), and a third of those age 55 and older.
Though a number of journalists specifically mentioned recent scandals involving New York Times reporter Jayson Blairand USA Today’s Jack Kelley in describing why the profession has lost credibility with the public, relatively fewexpressed concerns with any broader ethical problems in their field. In fact, just 5% of national journalists (and 6% oflocal news people) cite ethics or a lack of standards as the biggest problem in journalism, about half as many as in the1999 survey.
The vast majority of journalists of all backgrounds and at all workplaces say that plagiarism is no more prevalent todaythan it has been in the past, just more of a focus on the problem. More than seveninten national (77%) and local(72%) journalists agree with the statement “We are hearing more about plagiarism but its prevalence has not increased.”About oneinfive at both the national and local level (21% of national journalists, 23% local) say there is moreplagiarism today than in the past.
There is virtually no difference across different groups of journalists in this perception. Broadcast and print journalists, aswell as executives, senior editors, and reporters all predominantly say that recent incidents of plagiarism do not signify awider problem in the field. There is similarly no difference in this view between young and old, those who are more andless experienced, or those who are more and less educated.
What the Press is Doing Well
Print and broadcast journalists also differ over what journalism is doing well these days. Print journalists most oftenpoint to the quality and depth of coverage that is provided. They describe the volume of topics covered, coverage withcontext and insight, and an ability to make the news interesting and relevant. Fully 42% of local print journalists and31% of their national counterparts cited some aspect of the quality of coverage as journalism’s best performance trait,compared with just 18% of local broadcast journalists and 19% of national broadcast journalists.
Those working in television and radio are more likely to cite the timeliness and speed of reporting as what journalism isdoing best today. Among local journalists, broadcast journalists are more than twice as likely as those working in print(33% vs. 14%) to cite the immediate coverage of live and breaking news as journalism’s greatest strength. This gap iseven wider within the national press, with 37% of national broadcast journalists – and just 11% of national printjournalists – citing timeliness and speed as the best aspect of today’s news.
The watchdog role of the press is cited as journalism’s strength by fewer in the field. Print journalists are about twice aslikely as those in broadcasting to say investigative reporting and watchdog journalism is what the press is doing wellthese days. By contrast, those in TV and radio make far more mention of the value of news websites and the use ofproduction technology to better deliver news to the public.
As was the case five years ago, roughly half of journalists say the profession does a good job of striking a balancebetween what audiences want to know and what’s important for them to know. This opinion is held by comparablenumbers of national and local journalists, as well as among those working in both print, broadcast, and Internet media.
Criticisms of the Press
Nearly eightinten in both national and local news organizations believe the criticism that the press pays too littleattention to complex issues is valid (78% national, 77% local). This is comparable to findings in previous press surveysconducted in 1995 and 1999. Roughly twothirds also agree that there are too many talk shows on cable televisiontoday, and this view is shared equally by both print and broadcast journalists.
Most journalists also accept as valid the criticism that the distinction between reporting and commentary has seriouslyeroded, although the percentage who cite this as a valid criticism has, if anything, declined since 1999. However, farmore national and local journalists regard this as a legitimate critique than did so in 1995.
A growing number of national journalists, in particular, say news reports are increasingly full of factual errors and sloppyreporting. The number of national journalists who view this as a valid criticism has increased steadily from 30% in 1995to 40% in 1999 to 45% today. A comparable percentage of local journalists say this is a valid criticism (47%). Thatrepresents a decline from 1999 (55%), but is higher than the 1995 level (40%).
In both 1995 and 1999, slim majorities agreed with the criticism that the press was too cynical, but this perception hasebbed among both national (37%) and local (40%) journalists today. In fact, more national journalists say the press istoo timid (47%) than too cynical. In addition, the proportion who feel the press can be criticized for becoming out oftouch with their audience has dropped slightly within both groups of journalists.
Grading the Media
Journalists give the highest ratings to major national newspapers – 92% of national journalists and 80% of localjournalists give national newspapers a grade of A or B. By contrast, local TV news receives the lowest grades; just 32%
of local journalists say local TV news outlets deserve a grade of A or B and national journalists’ grades are even lower(21% A or B).
Grades for other news media – network TV news, cable TV news, and local newspapers – fall somewhere in betweennational newspapers and local TV news. In that regard, little has changed from nine years ago, when journalists gavevery similar grades to these media organizations.
Most journalists give their own news organization middling grades. Just 22% of national journalists, and 14% of localjournalists, gave their organization an A, though roughly sixinten of both groups gave their own organization a grade inthe B range. These grades also are similar to the grades journalists assigned in 1995.
Print journalists are particularly critical of network and local TV news. Just 32% of national print journalists givefavorable grades (A or B) to network TV news, while twice as many (65%) assign grades of C or D. Journalists at localnewspapers are, at most, only slightly more favorable. By comparison, a majority of journalists working at both nationaland local TV and radio outlets give favorable grades to network news programs.
Nearly half (47%) of local TV journalists give favorable grades to their own field’s performance, compared with only 18%of local print journalists. The print/broadcast gap is slightly narrower among journalists at national outlets, but onlybecause ratings of local TV news are low among all national reporters whether in print or broadcasting. Amongbroadcast media, cable TV news channels are the exception to the media divide, as they are graded similarly by bothprint and TV/radio journalists.
Journalists were also asked to give a grade to national news organizations for their websites, and the marks were fairlystrong. Sizable majorities of both national (70%) and local (57%) journalists gave grades of A or B to major mediawebsites. And the grades among local journalists are lower only because more said they were unable to rate thesewebsites – very few in either group gave poor marks to the websites.
In the general evaluation of whether their profession is headed in the right direction or the wrong direction, journalistswere almost evenly divided in their view. While those taking a pessimistic view were not asked directly what they had inmind, an analysis of their responses to other questions provides some indication of the factors behind this opinion.
In particular, journalists who say things are going badly are significantly more likely to take their profession andemployers to task for the quality of the news product. They believe the press has become too timid, and almostunanimously say the press pays too little attention to complex issues. Nearly threequarters of journalists who say theprofession is headed in the wrong direction say the distinction between reporting and commentary has seriously eroded,compared with only half of those who think things are on the right track.
Concerns about the impact of bottomline pressures also are far more prevalent among those saying the profession ison the wrong track, which is closely related to concerns about sloppy reporting and the increasing commercialization ofthe news. Many say the emergence of the 24hour news cycle has weakened journalism and that news reports areincreasingly full of factual errors. And those critical of the overall direction of journalism more frequently citesensationalistic reporting and an emphasis on ratings as the biggest problems facing the profession.
Within the newsroom, those who are unhappy with the leadership of their own news organization are far more negativeabout the profession as a whole compared with those who are satisfied with their bosses. In addition, those who haveparticipated in training or professional development over the past 12 months are significantly more optimistic about theprofession as a whole than those who have had no such training.
But overall cynicism about journalism is not simply an expression of sour grapes on the part of those who have facedeconomic pressures or staffing cuts at their own place of work. Those who have seen their newsrooms shrink, or whosay that resource and staffing limitations are the biggest problem facing the profession, are no more or less likely to benegative about the direction of journalism than those who have not faced resource limitations.
Similarly, there are no generational or ideological divides on this general evaluation of the state of the profession.Journalists young and old, liberal, moderate and conservative are all about evenly divided in terms of whether they areoptimistic or pessimistic about the field.
Section II: Covering the President and the Campaign
Press Going Too Easy on Bush BottomLine Pressures Now Hurting Coverage, Say Journalists
by the Pew Research Center for the People and the Press
OverviewSection I: Views on Performance Section II: Covering the President and the CampaignSection III: Today’s Changing Newsroom Section IV: Values and the Press
NOTE: This report is also available on the Pew Research Center Web site.
Section II: Covering the President and the Campaign
Many journalists today feel that news media has lost its critical edge – especially when it comes to coverage of theBush administration. Reporters and editors in national news organizations, in particular, feel the press has gone too
easy on the Bush administration. Moreover, the perception that news organizations have gone soft is not confined toattitudes about coverage of Bush. An increasing number of both national and local journalists feel the traditionalcriticism of the press as too cynical is no longer valid. Indeed, on both the national and local level, more fault the pressfor being too timid than too cynical.
The journalists surveyed give middling ratings to national news coverage of Bush’s presidency. A narrow majority ofnational journalists (53%) give the coverage a grade of A or B; local journalists are far less generous in their grading ofhow their colleagues in national news organizations have covered Bush (43% A or B). In a similar survey in 1995,national journalists, in particular, offered more positive opinions of coverage of the Clinton administration (65% A or B).
The journalists are somewhat more positive in their assessments of the presidential campaign. A majority of nationaljournalists (56%) say coverage of the campaign has been better than coverage of the 2000 campaign. Local journalistsare more divided: 46% say coverage of the current campaign is better than in 2000, while 34% say it is worse.
Differences Over Bush Coverage
Solid majorities of national print and TV journalists, as well as Internet journalists, say the media has not been criticalenough in its coverage of the administration. A smaller plurality of local print journalists agree (46%).
But local television journalists, on balance, feel the coverage of the Bush administration has been fair. A plurality of thisgroup (44%) believes the coverage has been fair; moreover, nearly as many say coverage has been too critical of theadministration (25%) as say it has been not critical enough (28%).
Ideological Divisions
Much has been made of the public’s ideological divisions in this election year, but journalists also are divided alongideological lines over several issues, including press coverage of the Bush administration. Liberals who work in nationaland local news organizations overwhelmingly feel the press has not been critical enough of the Bush administration.Roughly twothirds of liberal journalists (68%) express that view, compared with 28% who say coverage has been fairand 3% who believe the press has been too critical of the administration.
Selfdescribed moderates offer a mixed judgment of the Bush coverage – about the same percentages say it has notbeen critical enough (44%) and fair (43%). But most conservatives (53%) think the press has been too critical of theadministration, compared with 30% who view it as fair and 17% who think it has been too critical.
Beyond Bush: Cynicism Concerns Decline
In the 1999 survey, narrow majorities of both national (53%) and local (51%) journalists agreed that the statement, “thepress is too cynical,” represented a valid criticism of news organizations.
But there has been a dramatic decline in the percentage of national and local journalists who feel the press can belegitimately criticized for excessive cynicism. Just 37% of national journalists and only slightly more local journalists(40%) view the press as too cynical. This pattern is even more apparent among Internet journalists: 24% view the pressas too cynical, compared with 48% five years ago.
Internet journalists, in particular, believe that the press can be faulted for being too timid rather than too cynical (56%too timid vs. 24% too cynical). Journalists working at national news organizations agree (47% vs. 37%). But localjournalists are split: 42% view the press as too timid, 40% too cynical.
Ideological Coverage – Valid Criticism?
Overall, news people are divided over whether journalists today too often let their own ideological views show in theirreporting. Similar percentages of national (45%) and local (43%) journalists view this as a valid criticism.
But local executives, in particular, approach this issue very differently. Roughly seveninten local news executives (73%)say coverage too often reflects a journalist’s ideology; roughly sixinten national news executives (62%) agree that thisis not a valid criticism of the press.
By comparison, there is broad agreement across the spectrum of reporters, managers and executives that is a bad thingif news organizations take a “decidedly” ideological point of view in their coverage of the news. Fully 72% of nationaljournalists and 74% of local journalists have a negative view of news organizations taking a strongly ideological stancein their coverage.
Most national and local journalists do not believe any national daily news organization is “especially liberal” in its newscoverage. Roughly sixinten in both groups (62% national/59% local) say no national daily news organization strikesthem as particularly liberal in its coverage. Among the minority that names a specific news organization as beingespecially liberal, the New York Times was mentioned most frequently (20% national/17% local).
By contrast, solid majorities of both national and local journalists say there is an organization that they think isespecially conservative – and for most the organization that comes to mind is Fox News Channel. Fully 69% of nationaljournalists cited Fox News Channel as especially conservative in its coverage. Fewer local journalists (42%) mentionedFox; still, a much higher percentage of local journalists named Fox than any other single news organization,conservative or liberal.
Roughly twothirds of selfdescribed conservatives (68%) could identify a specific news organization that is especiallyliberal, and the same number (68%) could name a news organization that is “especially conservative.” But moderatesand liberals could identify conservative news organizations far more often than liberal ones. Roughly threequarters ofliberals (74%) and a majority of moderates (56%) say they couldn’t think of any news organization that is especiallyliberal.
Press Going Too Easy on Bush BottomLine Pressures Now Hurting Coverage, Say Journalists
by the Pew Research Center for the People and the Press
OverviewSection I: Views on Performance Section II: Covering the President and the CampaignSection III: Today’s Changing Newsroom Section IV: Values and the Press
NOTE: This report is also available on the Pew Research Center Web site.
Section III: Today’s Changing Newsroom
Newsroom staff cutbacks are hitting print journalism at both the national and local level. About half of respondentsworking at newspapers or magazines (48% nationally, 54% locally) say the size of their newsroom staff has decreased inthe past three years. Relatively few in the print sector are seeing growth in the number of staff.
The picture is more mixed in television and radio, with about equal numbers saying their newsrooms are growing asshrinking. About half (47%) of those in national broadcast media say there has been no change in staffing comparedwith three years ago.
One significant change in the news business is growth in the practice of repackaging and repurposing news stories formultiple uses. About half of both national and local respondents (48% each) say they are doing this more now than inthe past; print and broadcast journalists at each level are similar in this respect.
At the same time, relatively few voice unhappiness with this trend, with the notable exception of local broadcastreporters. Threeinten local TV reporters (29%) say they are unhappy over repackaging stories for multiple purposes.That compares with only about oneinten national radio and TV news people, and similar percentages of national andlocal print journalists.
Most journalists today give good ratings to the quality of leadership in their own organizations, a view that has changedlittle since 1999. At the national level, 30% of news professionals say their management is doing an excellent job, and41% say they are doing a good job. There is relatively little difference between national print and broadcast media inleadership ratings. But over half of executives at the national level say the quality of leadership is excellent (and 38%rate it as good). Senior newsroom staff and line journalists are less positive.
At the local level, 22% overall rate leadership as excellent, and nearly half (47%) say the quality is good. Ratings arehigher among local newspaper journalists than among those in television and executives rate leadership more positivelythan reporters and producers.
Training and professional development programs are fairly common in newsrooms today. About half (47%) of nationaljournalists and 56% of local journalists say they have participated in such activities provided by their news organizationin the past twelve months. Among those who have taken part in training, close to half say they participated in such aprogram for five days or more over the past year.
Executives and senior editors and producers are more likely than line staff to report having taken part in professionaldevelopment activity. Respondents who have participated in training rate their own news organization’s managementmore highly than those who have not participated, and this is especially true of reporters.
In a related area, large majorities of respondents (76% nationally and 77% locally) say there are ongoing managementefforts to address ethical issues in their newsroom, about the same as in 1999. As with training and professionaldevelopment, those who report that their organizations are engaged in this activity rate their management morefavorably.
Internet’s Impact Mostly Positive
Most news professionals (60% at the national level, 51% locally) say the emergence of the Internet has madejournalism better; very few say it has hurt journalism. These views are fairly similar to those expressed by journalists in1999. More local journalists say the Internet has had either a positive or negative impact, with higher percentage todaysaying it has made journalism worse (18% compared with 8% in 1999). Only local news executives are divided over theInternet’s impact: 31% say it has been good for journalism; 27% view it negatively.
Not surprisingly, enthusiasm about the Internet is greatest among younger respondents in the survey. More than seveninten (72%) of those under 35 years of age think the Internet has been good for the profession; just 13% view it
negatively. Journalists age 35 and older also have a generally positive view of the Internet’s impact, though by a muchsmaller margin (54% better, 15% worse).
Changes for the Better
Those who believe the Internet has helped journalism most frequently cite its power as a research tool. Nearly half ofthose who see a positive impact of the Internet mention some aspect of the Internet as a convenient place to findtimely information, to get data at any hour of the day, and to do factchecking on deadline. Those who work for localnews organizations are especially likely to mention this benefit of the Internet (61% of local vs. 47% of national and16% of Internet journalists).
Another widely noted positive impact of the Internet is its ability to deliver information to the public more quickly and topromote greater competition among news organizations. This view is much more prevalent among print journalists thanamong those working in TV and radio. A frequent comment within this theme is that print journalism now has the abilityto compete with television and radio for breaking news. Also, the speed of the Internet in delivering information was thesingle most cited benefit among journalists who work primarily on their organization’s websites.
About oneinfive say the Internet has helped journalism by making far more information available to the public, and byhelping to improve the accuracy of the information. A related notion, mentioned about as often, is that the Internet hasbroadened the range of outlets and voices available to the public. This includes more points of view, deeper stories, andcoverage of topics and stories that otherwise would not have fit into existing time and space available. These changeshave forced journalism to be more innovative and responsive to the public; one respondent said the Internet has“democratized the press.”
A less common argument for why the web has made journalism better is that the Internet has made journalism moreaccountable by enabling the public – and other journalists – to more easily verify the accuracy of information andcommunicate these concerns directly to those who produced a report. Only around oneintwenty who see the web ashaving had a positive influence make this case.
Changes for the Worse
Those who think the Internet has been bad for journalism most often cite the fact that it promotes the spread ofunvetted and unfiltered information to the public; nearly half (53% national, 45% local) cite this concern. Others expressa related concern about the speed and pressure of the Internet leading to too many factual errors in news coverage(17% national, 29% local).
Another concern raised by some is that the Internet has promoted the rise of pseudojournalism, “junk” sites, and lowbrow news. One negative consequence cited by several respondents is that “news” reported on these sites forcemainstream journalists to waste time chasing down baseless rumors and innuendo. In a similar vein, a smaller grouprefers specifically to the Internet having damaged the credibility of journalism in the mind of the public.
Around oneinten who see the Internet as having a bad influence on journalism say the web has made journalists lazyby allowing them to do research at their desks rather than going out into the field, with some specifically stating that theInternet has made plagiarism too easy.
Internet’s Downside
The survey’s respondents were asked specifically about two issues related to the growth of the Internet: increaseddeadline pressures, and the potential spread of misinformation and rumors into the news. Majorities of both print andbroadcast journalists say that the Internet has increased the amount of bad information that finds its way into newsstories. Overall, 65% of national journalists and 57% of local journalists agree; smaller numbers think there has been nochange (31% nationally, 38% locally). Hardly anyone thinks the Internet has reduced the amount of misinformation incirculation, though only 38% of those working with websites think the problem is worse because of the Internet.
But there is a considerable difference of opinion on the Internet’s impact on deadline pressures. Majorities overallbelieve the Internet has neither increased nor decreased such pressures (55% of national respondents, 60% of localrespondents feel this way). Hardly anyone thinks deadline pressures have declined, and 42% at the national level and35% at the local level say the pressure is greater.
Within these averages there is a great deal of variation by type of medium and by job title. At both the national andlocal level, print journalists are far more likely than TV and radio journalists to say deadline pressure has been increasedby the Internet. National media executives are more likely than their editors or line journalists to feel this way. And,perhaps not surprisingly, those whose principal job responsibility is Internetbased journalism are the most likely to feelgreater deadline pressures (78%).
Journalists in the Online Sector
The poll included a separate sample of 68 journalists whose job responsibilities include managing, editing, or writing forthe online outlets of national and local news organizations. Job titles for this group of respondents included “onlinecontent manager,” “online editor,” “website manager,” and the like.
For the most part, online journalists are not significantly different from others demographically with the exception ofage. The average age of respondents in the Internet group is 42, compared with 46 among the rest of the sample.Similarly, those working in online jobs had an average of 18 years experience, compared with 22 years for the rest ofthe respondents. More say they have undergone training or professional development activities provided by theirorganization (66% vs. 52%). And far more say the Internet has increased their deadline pressures.
Given the evolving nature of news organizations’ websites, it is no surprise that those in the online sector say they aredoing more repackaging of stories than in the past: 71%, versus 48% for other journalists. But more are happy aboutthe change than unhappy by a margin of fivetoone (44% vs. 9%).
In most cases, the opinions of online journalists track closely with nonInternet journalists regarding the state of theprofession, the reasons for declining audiences, the validity of criticisms about journalism, the quality of their own newsorganization, and their own personal and political
values. They are somewhat more likely than their counterparts who work in broadcasting to say journalists have becomeout of touch with their audiences, and to offer that a boring and static news product is one reason some media arefacing declining audiences, but many print journalists share this concern. In that vein, more online journalists thanothers in both print and broadcasting see the changing media environment as the biggest problem facing journalism.
Not surprisingly, most of the key differences between the views of online journalists and others pertain to the role of theInternet itself. One of the biggest differences is that majorities (57%) of those whose principal job is not in onlinejournalism say the Internet allows too much posting of links to material that is unfiltered or unvetted; just 28% of those
working in the sector agree that this is a valid criticism. Similarly, far more of those who do not primarily work on theirnews organization’s website say the Internet has allowed more misinformation to find its way into news stories (61%,compared with just 38% among online journalists). And fewer Internet than nonInternet journalists say the Internet hashurt journalism (3% versus 16%).
Section IV: Values and the Press
Press Going Too Easy on Bush BottomLine Pressures Now Hurting Coverage, Say Journalists
by the Pew Research Center for the People and the Press
OverviewSection I: Views on Performance Section II: Covering the President and the CampaignSection III: Today’s Changing Newsroom Section IV: Values and the Press
NOTE: This report is also available on the Pew Research Center Web site.
Section IV: Values and the Press
Journalists at national and local news organizations are notably different from the general public in their ideology andattitudes toward political and social issues. Most national and local journalists, as well as a plurality of Americans (41%),describe themselves as political moderates. But news people – especially national journalists – are more liberal, and farless conservative, than the general public.
About a third of national journalists (34%) and somewhat fewer local journalists (23%) describe themselves as liberals;that compares with 19% of the public in a May survey conducted by the Pew Research Center. Moreover, there is arelatively small number of conservatives at national and local news organizations. Just 7% of national news people and12% of local journalists describe themselves as conservatives, compared with a third of all Americans.
In this regard, Internet journalists are similar ideologically to local journalists: 57% describe themselves as moderates,while 27% say they are liberals and 13% conservatives. Local TV and radio journalists include the lowest percentage ofliberals of any of the journalist groups surveyed (15%). Even among local TV and radio journalists, however, just 13%describe themselves as conservatives.
Major Differences: God and Morality, Homosexuality
The 1995 survey of journalists found particularly sharp differences between journalists and the public when it came toattitudes toward morality and homosexuality. A solid majority of Americans consistently have expressed the opinion thatit is necessary to believe in God to be a moral person. Nearly sixinten (58%) expressed that view in a 2002 PewResearch Center survey, while 40% said that belief in God is not a prerequisite for morality. Journalists, regardless oftheir organization and position, take a decidedly different view. Fully 91% of those who work at national newsorganizations say it is not necessary to believe in God to be moral; 78% of local journalists agree.
As was the case in 1995, journalists are much more accepting of homosexuality than is the general public.Overwhelming majorities of national (88%) and local (74%) say homosexuality should be accepted by society. Onlyabout half of the public agrees (51%).
Since the mid1990s, however, public support has increased for societal acceptance of homosexuality, while journalists’attitudes have been more stable. In a 1993 TimesMirror survey, most Americans (53%) said homosexuality should bediscouraged; today a narrow majority (51%) believes homosexuality should be accepted. National journalists also havebecome slightly more accepting of homosexuality since 1995 (83% then, 88% today), while local journalists’ views havebeen stable (75% then, 74% today).
More Agreement on Safety Net
There is more common ground between news professionals and the public in attitudes toward individual freedom andgovernment assistance for needy people. Identical majorities of local journalists (58%) and the public (58%) say it ismore important that Americans be free to pursue their goals without government interference, than that governmentguarantee that no one is in need.
National journalists are divided over this question – 49% place higher priority on freedom from government interferencewhile 42% say it is more important that the government play an active role to guarantee aid to the needy. Opinionamong Internet journalists divides along similar lines: 51% believe freedom from government interference is moreimportant; 43% say a government guarantee of aid for the needy is more important.
Conservative Journalists Secular Too
There is a broad consensus among news professionals, regardless of their ideology, that it is not necessary to believe inGod to be moral. But other issues – homosexuality and the government’s role in aiding the needy – produce widerfissures along ideological lines.
Journalists who identify themselves as liberals are virtually unanimous in their view that homosexuality should beaccepted by society (95% agree). More than eightinten moderates (84%) agree. But only about half of conservatives(49%) say homosexuality should be accepted.
The news people surveyed also are deeply divided over the question of whether individual freedom, or government aidto the needy, is more important. Liberals by a wide margin (61%33%) place greater priority on government guaranteesof aid for the needy. By contrast, conservatives overwhelmingly say it is more important that everyone be free to pursuelife’s goals (88%); just 9% feel it is more important for government to guarantee that no one is in need.
Methodology
Survey Methodology
This survey is based on interviews with 547 journalists and news media executives by telephone and online. The samequestionnaire was used for both modes. The interviews were completed from March 10, 2004 through April 20, 2004.
Design of the Media Samples
Three samples were drawn for this survey: a national news media sample, a local news media sample and an Internetnews sample. Both the national and local samples were divided into two groups: print and broadcast (which includestelevision and radio).
For the national sample, the print category includes newspapers, magazines, wire services, and news services; thetelevision category encompasses cable, television and radio networks.
For the local sample, the print category includes newspapers from a listing of the top 100 newspapers ranked bycirculation, excluding those selected for the national sample. The television category includes local television stationsfrom the top 100 media markets.
Within each of these market/medium strata (national and local, print and television), specific organizational positions(i.e., managing editor, correspondent) were selected.
The Internet sample was selected from onlineonly news outlets, as well as the online news outlets of traditional printand television news organizations. The specific sampling procedures are outlined below.
To obtain a sample that represented a crosssection of news organizations and of the people working at all levels ofthose organizations, the news media were divided into the following groupings:
(1) Importance of medium in terms of size of audience, market or influence.a) National audienceb) Local audiencec) Internet audience(2) Type of media a) Newspapersb) News magazinesc) Wire servicesd) News servicese) Television stations and networks f) Radio stations and networks(3) Organizational responsibility of the individual respondenta) Executiveb) Senior editors and producersc) Working editors and journalists
Identifying the Samples
National newspapers were identified using 2002 circulation numbers in 2003 Editor & Publisher International Year Book.
National television news organizations included the three national networks, major national cable networks, publictelevision, and radio chains with Washington, D.C. bureaus. Particularly for the national sample, every attempt wasmade to replicate the selection of news organizations used for an earlier Center survey conducted in 1995.
The news media executives and journalists in each position within these organizations were drawn from the News MediaYellow Book database online, with the exception of national radio organizations, which were drawn from Bacon’sMediaSource, and national newspapers, which were drawn from Editor & Publisher International Year Book. A completelisting of the selected national news organizations is below.
Local newspapers were also identified using 2002 circulation numbers in 2003 Editor & Publisher International YearBook. They include the 84 (out of the top 100) papers that were not pulled for the national sample.
Local television stations were selected from the top 100 media markets, as defined by Nielsen Media Research for2003. After the local sample was selected, Bacon’s MediaSource was used to identify the news media executives andjournalists in each organization.
Respondents were selected using a twostage sampling procedure. In the first stage, news media organizations wereselected and in the second stage individuals were chosen from those organizations. The criteria for selecting nationaland local news organizations are outlined below.
Media Organizations Sampled
National MediaTelevision Networks ABC, CBS, NBC, PBS,CNN, CSPAN, CNBC, MSNBC, FOX Cable News,Telemundo, Univision Chains with Washington, D.C. Bureaus Gannett, Cox, HearstRadioAssociated Press RadioABC Radio NetworksCBS Radio NetworksWestwood One Black Radio NetworkNational Public RadioNewspapersArizona RepublicAtlanta JournalConstitution
Boston GlobeChicago Tribune Detroit Free PressHouston ChronicleLong Island NewsdayLos Angeles Times Miami HeraldNew York Daily News New York Times Philadelphia InquirerSan Francisco ChronicleUSA TODAY Wall Street Journal Washington Post MagazinesNewsweekTime U.S. News & World Report Wire Services Associated PressBloomberg News ServiceReutersNews ServicesCopleyCox NewspapersGannettHearstKnightRidderNewhouseScrippsHoward
Local Media
Television A random sample was selected from all stations listed in the top 100 media markets.
PrintThe top 100 newspapers ranked by circulation were selected, excluding those newspapers selected for the nationalsample.
Respondents Selected at each Organization (By Title)
National Sample
Executive Level
TV & Radio: President/CEO, Vice President, General Manager, Station Manager
Print: Publisher, President/CEO, Vice President
Senior Editors and Producers
TV & Radio: News Division Executive, Executive Producer
Television: President/CEO, Vice President, General Manager, Station Manager
Print: Publisher, President/CEO, Vice President
Senior Editors and Producers
Print: Assistant Managing Editor, Managing Editor, Executive Editor, Business, Metro and Editorial Section Editors
Television: News Director
Working Journalists and Editors
Television: Producer, Correspondent
Print: National Editor, Editor, Reporter, Senior Editor, National and Foreign Editors, Associate Editors, Columnist
Internet Sample
Online Producer, Online Vice President, Online Content Manager, General Manager of Website, Online Editor
The national and local news media samples were each divided into subgroups, defined by the type of news organizationand the respondent’s position within that organization. Each subgroup was randomly split into replicates. Quotas wereset for the number of interviews to be completed in each subgroup. The Internet sample was also assigned a quota.These quotas were set to ensure adequate representation of the smaller subgroups in the final sample of completedinterviews. The subgroups, quotas, and number of completed interviews for each are listed below.
Component Quota CompletedNational Print 110 130National NewspapersExecutives 12 12Senior Editors and Producers 21 28Working Journalists and Editors 34 40National MagazinesExecutives 4 2Senior Editors and Producers 7 7Working Journalists and Editors 11 12National News ServicesExecutives 2 3Senior Editors and Producers 4 7Working Journalists and Editors 7 10Wire ServicesExecutives 2 1Senior Editors and Producers 3 3Working Journalists and Editors 3 5
National Broadcast 110 117National TV and RadioExecutives 20 19Senior Editors and Producers 35 38Working Journalists and Editors 55 60
Local Print 115 118Local NewspapersExecutives 30 28Senior Editors and Producers 35 39
Senior Editors and Producers 35 39Working Journalists and Editors 50 51
Local Broadcast 115 114Local TV NewsExecutives 30 27Senior Editors and Producers 35 33Working Journalists and Editors 50 54
Internet 50 68
Each person sampled for this survey was mailed an advance letter. The letters were intended to introduce the survey toprospective respondents, describe the nature and purpose of the survey and encourage participation. The letter wassent from the Pew Research Center; the Project for Excellence in Journalism; and the Committee of ConcernedJournalists was involved. It contained a URL and a password to complete the survey online as well as notification thatinterviewers would be calling as well.
As soon as the letters were mailed, a website was available for respondents to complete the interview online.
Approximately one week after the letter was mailed, trained interviewers began calling the sampled individuals toremind them of the letter, discuss doing the survey online or conducting the interview on the telephone. In all cases, afollowup email was sent after three days of initial calls, repeating the substance of the letter and providing the URLagain.
If a respondent refused an interview, in most cases an email appeal was sent, asking the individual to reconsider. Thiswas followed approximately one week later by another telephone call.
If a member of the sample had not completed the interview online or by telephone within two weeks of mailing the firstletter, followup telephone calls were made to complete the interview or to schedule an appointment to do so.
The interviewers were experienced, executive specialists trained to ensure their familiarity with the questionnaire andtheir professionalism in dealing with news media professionals. The interviews were completed from March 10, 2004through April 20, 2004.
Interviews were completed with 67% of the selected news media respondents who still held their position; 12% couldnot be reached in order to complete an interview, despite repeated calls; and 21% refused to participate in the survey.
Profile of News Professionals
Journalists and managers in major national and local news organizations tend to be well educated, middleaged, withsubstantial experience in the field. The median age of those surveyed is 47 years, with nearly fourinten (38%) fallingbetween 45 and 54 years of age. Only 13% are under the age of 35. The median experience of the respondents is 22years.
Most of the journalists surveyed have a college degree; less than 10% have not completed college. Significant numbershave a graduate degree or at least some graduate school experience. About half of print journalists have a degree injournalism; communications degrees are more common among broadcast professionals at the local level.
About The Story – IntroAbout the StudyThe State of the News Media report was written by the Project for Excellence in Journalism, with the aid of manycollaborators. Funding was provided by the Pew Charitable Trusts.
Click here for information about printing pages from the report.
MethodologyDetails on how we put together study together, including background on the content analysis sections.
Authors and CollaboratorsA list of people who worked on the report.
Source BibliographyAn alphabetical listing of all the sources referenced in the report, including Web addresses.
Contact UsHow to reach the Project for Excellence in Journalism.
PermissionsDetails on using information found in the report.
Privacy PolicyInformation about your privacy. We do not collect any user information.
N e w s p a p e r s O n l i n e N e t w o r k T V M a g a z i n e s
C a b l e T V L o c a l T V R a d i o E t h n i c / A l t e r n a t i v e N e w s p a p e r s O n l i n e N e t w o r k T V M a g a z i n e s
C a b l e T V L o c a l T V R a d i o E t h n i c / A l t e r n a t i v e
By the Project for Excel lence in Journal ism
abecker
Typewritten Text
Letter From the Director
his report, The State of the News Media 2004,is an inaugural effort to provide people with anew resource—a comprehensive look each year atthe state of American journalism.
Our goal is to put in one place as much original and aggregated data as possible abouteach of the major sectors of journalism in theUnited States. Previously, these data were eitherunavailable or scattered among disparate sourcesacross many organizations.
The full study is available online at www.Journalism.org. What you are reading here is anexecutive summary, in which we have highlightedkey findings in bullet form to offer a quick sketchof each media sector.
In both reports, eight media are covered: network television, cable television, newspapers,magazines, the Internet, radio, local TV and theethnic and alternative news media.
For each area, we have produced originalresearch and aggregated existing data into acomprehensive look at six different issues:
A sense of the editorial content Audience trends Economic trends Ownership trends Newsroom investment trends Data on public attitudes about that sectorOnline, there is another feature: we have col-
lected all the data and presented it in a formatthat users can explore on their own, making theirown charts and graphs.
Our goal with this study is to take stock ofAmerican journalism and to answer essentialquestions about its trends and direction, synthe-sizing all available information in an independentand dispassionate manner. It is not designed asan argument. We hope, instead, it becomes a dis-tinctive and reliable resource, a one-stop-shop for
information on the state of journalism.The study is the work of the Project for
Excellence in Journalism, an institute affiliatedwith Columbia University Graduate School ofJournalism. The study is funded by the PewCharitable Trusts.
Many partners contributed to the work. The chapters on television and cable were pro-duced and jointly written in collaboration withAndrew Tyndall of ADT Research. The report onnewspapers is co-authored by Rick Edmonds ofthe Poynter Institute. The content analysis wasexecuted by Princeton Survey Research Associatesand Tyndall under the direction of the Project.The methodology and statistical work weresupervised by Esther Thorson, associate dean forgraduate studies and research at the University of Missouri School of Journalism. Irvin Molotsky,former reporter and editor at the New YorkTimes, was the copy editor.
Each chapter was read by a group of expertsin each field. We owe a significant debt, as well,to our sister group, the Committee of ConcernedJournalists and its chairman, Bill Kovach. Moredetails on their contributions and all the method-ology are available online.
Later this spring, we will add another compo-nent: a survey of journalists about the state ofjournalism. The survey, which also will be annual,will be produced in partnership with the PewResearch Center for the People and the Press.
If this executive summary interests you, findthe full report online and share your thoughtswith us as we begin to prepare the 2005 report.
Tom Rosenstiel
T
What we are witnessing are
the dichotomous trends of
fragmentation and convergence
simultaneously, and they
sometimes lead in opposite
directions.
4 Overview
8 Newspapers
11 Online
14 Network TV
17 Cable TV
20 Local TV
23 Magazines
26 Radio
29 Ethnic /Alternative
Contents
The State of the News Media 2004
www.Journalism.org
4 The State of the News Media 2004
lance at some items in the news of late andit seems many long-held ideas about journalismare unraveling.
President George Bush told ABC’s DianeSawyer in December that he prefers to get hisnews not from journalists but from people hetrusts, who “give me the actual news” and “whodon’t editorialize.” After spending time withWhite House senior staff, New Yorker writer KenAuletta concluded they saw the news media asjust another special interest group with anagenda—and that is making money, not servingthe public.
Some argue that as Americans move online,the notion of news consumers is giving way tosomething called “pro-sumers,” in which citizenssimultaneously function as consumers, editors,and producers of a new kind of news in whichjournalistic accounts are but one element.
With audiences now fragmented across hundreds of outlets with varying standards andagendas, others say the notions of a commonpublic understanding, a common language and acommon public square are disappearing.
For some, these are all healthy signals of theend of oligarchical control over news. For others,these are harbingers of chaos, of unchecked spinand innuendo replacing the role of journalists as
gatekeepers over what is fact, what is false andwhat is propaganda. Whichever view one prefers,it seems everything is changing.
Or is it?The answer we arrive at in 2004 is that jour-
nalism is in the middle of an epochal transforma-tion, as momentous probably as the invention ofthe telegraph or television.
Journalism, however, is not becoming irrele-vant. It is becoming more complex. What we arewitnessing are the dichotomous trends of frag-mentation and convergence simultaneously, andthey sometimes lead in opposite directions.
While audiences are fragmenting, we havegreater capacity than ever to come together as anation in an instant—for September 11th, theSuper Bowl or watching soldiers live on the battle-field in Iraq. While Americans are turning to moreand varied sources for news, the media they’reconsuming increasingly tend to be owned by afew giant conglomerates competing to coverwhat seem to be at any moment only a handful of major stories.
Quality news and information are more avail-able than ever before. Yet so in greater amountsare the trivial, the one-sided and the false. Somepeople will likely become better informed thanthey once could have been as they drill down to
Overview
G
The State of the News Media 2004
www. Journalism.org 5
original sources. Other consumers may becomesteeped in the sensational and diverting. Still others may move toward an older form of mediaconsumption—a journalism of affirmation—inwhich they seek news largely to confirm their preconceived view of the world.
The journalists’ role as intermediary, editor,verifier and synthesizer is weakening, and citizensdo have more power to be proactive with thenews. But most people will likely do so onlyepisodically. And the proliferation of the false andmisleading makes the demand for the journalistas referee, watchdog, and interpreter all thegreater.
These conflicting movements toward frag-mentation and convergence are not new to theculture in general or media in particular, but theyhave different consequences when they come tonews. Journalism is how people learn about theworld beyond their direct experiences. As ourjournalism fragments, it has consequences forwhat we know, how we are connected and ourability to solve problems.
Eight Major TrendsFor now, the year 2004, the transformation is
shaped by eight overarching trends: A growing number of news outlets are chasing
a relatively static or even shrinking audience fornews. One result of this is that most sectors ofthe news media today are losing audience. Thataudience decline, in turn, is putting pressureson revenues and profits, which leads to a cas-cade of other implications. The only sectors seeing general audience growth today areonline, ethnic and alternative media. WhileEnglish-language newspapers have seen circula-tion decline steadily since 1990, for instance,Spanish-language newspapers have seen circula-
tion more than triple to 1.7 million papers aday. All three of these growing sectors sharethe same strength—the opportunity for audi-ences to select tailored content, and in the caseof the Internet, to do so on demand.
Much of the new investment in journalismtoday—much of the information revolutiongenerally—is in disseminating the news, not in collecting it. Most sectors of the media arecutting back in the newsroom, both in terms of staff and the time they have to gather andreport the news. While there are exceptions, in general journalists face real pressures tryingto maintain quality.
In many parts of the news media, we areincreasingly getting the raw elements of newsas the end product. This is particularly true inthe newer, 24-hour media. In cable and online,there is a tendency toward a jumbled, chaotic,partial quality in some reports, without muchsynthesis or even the ordering of the informa-tion. There is also a great deal of effort, partic-ularly on cable news, put into delivering essen-tially the same news repetitively without anymeaningful updating.
Journalistic standards now vary even inside asingle news organization. Companies are tryingto reassemble and deliver to advertisers a massaudience for news not in one place, but acrossdifferent programs, products, and platforms. To do so, some are varying their news agenda,their rules on separating advertising from news,and even their ethical standards. What will airon an MSNBC talk show on cable might notmeet the standards of NBC News on broadcast,and the way that advertising intermingles withnews stories on many newspaper web siteswould never be allowed in print. Even the way
6 The State of the News Media 2004
a TV network treats news on a prime time magazine versus a morning show or eveningnewscast can vary widely. This makes projectinga consistent sense of identity and brand moredifficult. It also may reinforce the public percep-tion evident in various polls that the newsmedia lack professionalism and are motivatedby financial and self-aggrandizing motivesrather than the public interest.
Without investing in building new audiences,the long-term scenario for many traditionalnews outlets seems problematic. Many tradi-tional media are maintaining their profitabilityby focusing on costs, including cutting back ontheir newsrooms. Our study shows generalincreases in journalist workload, declines innumbers of reporters, shrinking space in news-casts to make more room for ads and promo-tions, and in various ways that are measurable,thinning product. This raises questions aboutthe long term. How long can news organiza-tions keep increasing what they charge adver-tisers to reach a smaller audience? If they maintain profits by cutting costs, social scienceresearch on media suggests they will acceleratetheir audience loss.
Convergence seems more inevitable and poten-tially less threatening to journalists than it may
have seemed a few years ago. At least for now,online journalism appears to be leading moreto convergence with older media rather thanreplacement of it. When you look closely ataudience trends, one cannot escape the sensethat we are heading toward a situation, espe-cially at the national level, in which institutionsthat were once in different media, such as CBSand the Washington Post, will be direct com-petitors on a single primary field of battle—online. The idea that the medium is the mes-sage increasingly will be passé. This is an excit-ing possibility that offers the potential of newaudiences, new ways of storytelling, moreimmediacy, and more citizen involvement.
The biggest question mark may not be techno-logical but economic. While journalisticallyonline appears to represent opportunity for oldmedia rather than simply cannibalization, thebigger issue may be financial. If online provesto be a less useful medium for subscription feesor advertising, will it provide as strong an eco-nomic foundation for newsgathering as TV andnewspapers have? If not, the move to the webmay lead to a general decline in the scope andquality of American journalism, not because themedium isn’t suited for news, but because itisn’t suited to the kind of profits that under-write newsgathering.
Those who would manipulate the press andpublic appear to be gaining leverage over thejournalists who cover them. Several factorspoint in this direction. One is simple supply anddemand. As more outlets compete for theirinformation, it becomes a seller’s market forinformation. Another is workload. The contentanalysis of the 24-hour-news outlets suggeststheir stories contain fewer sources. The
Overview
Many traditional media are maintaining their
profitability by focusing on costs, including cuttingback on their newsrooms.
www. Journalism.org 7
increased leverage enjoyed by news sourcesalready encouraged a new kind of checkbookjournalism in 2003, as seen in the controversiesover TV networks trying to secure interviewswith singer Michael Jackson and soldier JessicaLynch.
Background on This ReportThese are some of the conclusions from what
we hope is an unprecedented, comprehensivenew study of the state of American journalism.
For each of the media sectors, we examinedsix different areas—content, audience trends, eco-nomics, ownership, newsroom investment andpublic attitudes. We aggregated as much publiclyavailable data as is possible in one place and forsix of the sectors, the Project also conducted anoriginal content analysis. (For local televisionnews, we relied on five years of content analysisthe Project had previously conducted. For radio,ethnic and alternative media, no special contentanalysis was conducted.)
This approach of trying to look for cross-media trends, we believe, differs from the conven-tional way in which American journalism is ana-lyzed. It is designed to gather in one place datausually scattered across different venues from dif-ferent sources. Our hope is that this will allow usand others to develop insights not usually possibleand make comparisons that are usually difficult.
For this executive summary, we have distilledthe findings into highlights. The goal is to providea quick scan of key trends.
If people go online for the full report, theywill find something much more substantial. Thefull study contains a complete introductoryoverview about the news media and detailed nar-ratives on each major media sector. The complete
report runs more than 500 pages in print andincludes extensive tabular appendices. There aremore than 400 detailed, footnoted source cita-tions to help guide users to original sources.
People can approach the material in that fullreport several ways. Users can go directly to themedia about which they are most concerned—saylocal TV news—and drive vertically through it. Orthey can focus on a particular issue—audiencetrends for example—and move horizontally acrossdifferent media sectors to see where Americansare going for news. Or they can move across theoverviews of each sector. They can flip back andforth between our narrative and the interactivechart and tabular material. Or they can workthrough the statistics for themselves, making theirown charts, answering their own questions, ineffect creating their own reports.
Our desire in this study is to answer questionswe imagine any reader would find important, tohelp clarify the strengths and weaknesses of theavailable data, and to identify what is not yetanswerable.
We have tried to be as transparent as possibleabout sources and methods, and to make it clearwhen we are laying out data versus when we havemoved into analysis of that data.
We have attempted, to the best of our abilityand the limits of time, to seek out multiplesources of information for comparison where theyexist. Each year we hope to gather more sources,improve our understanding and refine ourmethodology.
This annual report was designed with variousaudiences in mind—citizens, journalists, mediaexecutives, financial analysts, scholars, studentsand most important, citizens. We hope it provesuseful now and throughout the year for anyoneinterested in American journalism.
8 The State of the News Media 2004
he percentage of Americans reading newspapers has
been shrinking for two generations. In the last decade
the situation has worsened.
Now the industry faces an important question.
Do newspaper executives believe that if they invest in
creating new content and even new papers they can
attract new readers? Or do they believe this is a mature
and declining industry and that it would only make
things worse financially by throwing away money?
TNewspapers
www. Journalism.org 9
Audience Newspaper circulation has declined 11% since
1990, about 1% a year. In 2003, slightly morethan half of Americans (54%) read a newspa-per each week (62% on Sundays), according to surveys from Scarborough Research. Overall,55 million newspapers are sold each day, 59million on Sunday.
Readership is lowest among the country’s twofastest-growing minority populations, Asians(46%) and Hispanics (35%). When it comes toage, 41% of people under 35 read a newspa-per, 54% of people age 35 to 54, and 68% ofpeople 55 and older.
There are 1,457 daily newspapers in the UnitedStates, 154 fewer than in 1990.
Economics After a difficult 2001, finances improved in
2002, thanks to a decline in newsprint costs.Newspapers took in $44 billion in ad revenueand were expected to match that in 2003,according to data from the Newspaper Asso-ciation of America. The 13 publicly ownednewspaper companies were on track in 2003 toearn an average pre-tax profit margin of 19%,according to analyst John Morton.
SOURCE: EDITOR AND PUBLISHER YEARBOOK
Newspaper classified revenues dropped 18% in2001 and 5% in 2002. To combat this, newspapercompanies are looking to compete online.
Ownership The age of the patriarchal local newspaper
owner is over. Today 22 companies own 39% ofthe newspapers in the country and represent70% of the daily circulation (73% on Sunday),according to data from Editor and Publisher.
The top-10 companies alone own 20% of thepapers and 51% of the circulation (56% onSunday). Of these, four companies stand outfor their size and profitability: Gannett,Tribune, New York Times and Knight Ridder,which, according to Morton, averaged a pre-tax profit margin in 2002 of 23%.
Content The mix of topics on newspaper front pages
has changed less over the years than in othermedia, studies by the Project have found. Ingeneral, newspapers offer more institutionalcoverage, more news of domestic affairs andgovernment. Newspapers also rely more onanonymous sources than other media. Roughly30% of stories contained anonymous sourcing.
10 The State of the News Media 2004
Newspapers tend to become more local andless international as the circulation categorydecreases. Wire copy becomes more prevalent.Anonymous sourcing decreases. Articles becomeshorter. The average length of section-frontstories in large papers was 1,200 words, in mid-sized papers 800 words, and in small papers600 words.
Newsroom Investment During hard times, many newspapers have
made sharp cutbacks in newsroom staffing andexpenditures. During good times, while thereare modest expansions, many have not madeup for what was lost, particularly in staffing.Today, the American Society of NewspaperEditors (ASNE) data indicate, newspapers haveabout 2,200 fewer employees than in 1990.
To put this in perspective, between 1991 and2000 (going out of one newspaper recession
and before entering another) newspaper adrevenues rose 60%, according to estimates by Merrill Lynch. Profits increased 207%. Yetnewsroom jobs increased only 3%.
Some argue these staffing cuts are not assevere as they appear. There are 154 fewernewspapers than in 1990 and the drop inemployees (4%) is not as great as the drop incirculation (11%). Others argue the cuts aregreater because composing room tasks now inthe newsroom have increased the workload.
Public Attitudes Fifteen years of research reveals declining trust
in newspapers. The percentage of people whobelieve what they read in their daily newspaperhas declined from 80% in 1985 to 59% in 2003,according to surveys by the Pew ResearchCenter for the People and the Press. That is alower number than for other media.
Subjects of Front Page Newspaper Articles Over TimeLarge-Circulation Papers, Percent of All Stories*
1977 1987 1997 2003
Government 33% 33% 30% 27%
Foreign Affairs 27 27 21 21
Military 1 3 * 3
Domestic Affairs 9 9 14 22
Entertainment/Celebrities * 2 2 1
Lifestyle 2 2 4 6
Personal Health 1 0 1 1
Crime 9 6 10 4
Business/Commerce 8 6 5 5
Science 1 4 5 5
Religion 1 3 1 1
Accidents/Disasters 7 3 2 3
Other 2 3 4 1
*Totals may not equal 100 due to rounding.
Newspapers
www. Journalism.org 11
Onlinelthough the economics are still evolving, the
Internet has now become a major source of news in
America.
In September 2003, over half of the people in
the United States—150 million—went online. Various
surveys indicate that half to two-thirds of those who
go online use the Internet at least some of the time to
get news. The Internet is also having success attracting
young people to news, something older media were
having trouble with even before the Internet existed.
A
12 The State of the News Media 2004
Audience The Web is the only news media, aside from
the ethnic and alternative sectors, seeing audi-ence grow, especially among young people.More than 55% of Internet users aged 18 to 34obtain news online in a typical week, accordingto a UCLA Internet study.
Traffic to the 26 most popular news sites in2003 grew by 70% from May 2002 to October2003, according to Nielsen/NetRatings.
It is not so clear that the Internet is cannibalizingthe old media. In 2002, 72% of Internet userssaid they spent the same amount of time readingnewspapers as they did before. Televisionappears to be suffering more from the moveonline.
During the war in Iraq, the web sites thatpeople gravitated to most were those of established institutions—first TV news sites,
then newspaper sites, followed by the U.S. government site and then foreign news sites,according to surveys by the Pew Project on the Internet and American Life.
Economics While many Web sites are now at the point
where they can claim profitability, it will still beyears before the Internet becomes a major eco-nomic engine that is paying for the journalismit contains, rather than piggybacking on itsmedia predecessors. According to BorrellAssociates, online revenues of the 11 largestpublicly-traded newspaper companiesaccounted for, on average, only 2% of the companies’ total revenues.
Still, the rate of revenue growth is impressive.Aside from Dow Jones Co., each of these 11companies reported a double-digit increase inrevenue for their online operations in 2002.
Online
MonthSOURCE: NIELSEN/NETRATINGS, EDITOR AND PUBLISHER ONLINE
www. Journalism.org 13
The economic model for the web is still unclear.There are three basic models at the moment:subscription based (online.wsj.com), those thatregister users but offer the content free andrely solely on advertising (Washingtonpost.com),and those that use a mix of some paid contentand some free (NYTimes.com)
Ownership A handful of media giants have come to domi-
nate Internet journalism. Nearly 69% of the 20most popular news web sites are owned by oneof the 20 biggest media companies.
At the same time, individual “blogs” havebecome a strong movement with the potentialto operate much the same way as influentialsmall-circulation journals of opinion do inprint. For now, though, while the number ofblogs is in the millions, an Internet softwarecompany, Perseus Development Corp., esti-mates that roughly two-thirds are abandonedand a quarter are only used once.
Content Internet journalism still largely consists of
material from old media rather than originalcontent. And much of the content does not
originate in-house. Among the eight siteswhose content was studied for this report,only about a third (32%) of the lead storieswere original reports.
There is a mixed message when it comes toimmediacy. Roughly half of the lead storiesstudied for this report were new. Yet, theamount of updating of continuing stories ismore limited (14%).
Web sites do a strong job of linking users to past stories about breaking news events. They do much less in the way of offering users multimedia opportunities such as linksto video, still photos or chances for user comment or feedback.
Public Attitudes When the Pew Internet and American Life
Project asked, during the war in Iraq, whatpeople liked about getting their news online,two-thirds of survey respondents cited theability to get news from a variety of sources,followed closely by the ability to get break-ing news. More than 50% of respondents valued being able to get different points ofview from those of traditional news and government sources.
Freshness of Lead Stories on Major Web SitesPercent of All Stories*
All Stories
Exact Repeat 21%
Repeat: No New Substance 14
Repeat: New Angle 2
Repeat: New Substance 14
New Story 49
*Total may not equal 100 due to rounding.
14 The State of the News Media 2004
Network TVhe story of network television news in 2004 is one of
an industry trying to find its place in the changed world
of 21st-Century journalism. It was once the most trusted
source of information in America and had a monopoly
over pictures and TV reporting from around the country
and the world. Neither of these things is true anymore.
Amid declining viewership and newsroom cutbacks,
news represents only a tiny fraction of the revenues of
the companies that now own the networks. What place,
then, does covering the major events of the day or
serving as an important public institution play in a
network’s identity? In the age of 100-plus channels,
how important is producing news at all?
T
www. Journalism.org 15
Content Having experimented with tabloid, sensational,
lifestyle and celebrity coverage in the mid-1990s, nightly network newscasts have becomemore traditional—and serious—in their topicagenda since September 11th. The eveningnews, however, has not fully returned to thenews agenda of 15 years ago, according tostudies by the Project.
Morning shows are more focused around “truecrime,” lifestyle and entertainment. When gov-ernment and foreign affairs are covered, it isoften around a human-interest angle.
With the exception of 60 Minutes andNightline, content studies show prime timemagazines do not address the significantevents of the day.
Audience The three nightly newscasts have seen Nielsen
ratings decline by 34% in the last decade, andnearly 44% since 1980. Despite the drop, 29
million people still watch network evening news.
The best evidence suggests it is availability,rather than the nature of the content, that ishurting evening news, but there seems littleopportunity to change that.
NBC is No.1 in nightly news, though it hasearned that spot more because of the losses ofits rivals than any gains of its own. Its ratingsare 11% lower than in 1994, when it was inthird place.
Morning news is the one relative bright spot for the networks. Audiences held steady overmost of the past 10 years and increased in 2003, to 14.6 million viewers.
Economics Network news remains a robust generator of
revenues. Revenue from nightly news was up in2003 (based on projections), the first up-ticksince 1999, data from TNS Media Intelligence/CMR indicate. According to one network source,the three commercial nightly newscasts (NBC,
Topics in Network Nightly News, 2003Percent of All Time*
Financially, morning news now greatly out-shines nightly news on the networks. Despitehaving half as many viewers as nightly news-casts, morning news shows took twice as muchin revenues—more than a billion dollars in2002—thanks to being on more than four timesas many hours and having younger demographics.
Between 1999 and 2002, prime time magazineshow revenues fell 48%, largely because theseprograms were replaced with reality shows.
According to some network sources, the cost ofcovering the war in Iraq greatly reduced net-work evening news profits in 2003.
Newsroom Investment With declining audiences, network newsrooms
have seen significant cutbacks. On-air corre-spondents for evening newscasts are down bymore than a third since 1985 to an average of50 people in 2002, according to Professor Joe
Foote at Arizona State University. The numberof overseas bureaus has been cut in half,according to our accounting.
The staff reductions have increased workload30%, Foote found.
The newshole of nightly news has shrunk 11%since 1991 to make room for more ads, promo-tions and teases, according to researcherAndrew Tyndall.
Public Attitudes There is a contradiction in the public’s views of
network news. The number of people whogave each of the three networks high gradesfor believability dropped from roughly 74% in1996 to 65% by 2002, according to PewResearch Center surveys.
When it comes to overall quality, from 1995 to2002, the number of people who gave networknews A or B grades remained relatively steady(just over half). The number giving a D or F,however, increased (to 14%).
Network TV
SOURCE: PROFESSOR JOE FOOTE, ARIZONA STATE UNIVERSITY
17 The State of the News Media 2004 www. Journalism.org 17
www. Journalism.org 17
www. Journalism.org 17
Cable TVith its 24 /7 format, cable television news enjoys
an enormous competitive advantage over broadcast
television. Surveys now show people generally cite cable
news ahead of broadcast as their primary source for
information about national and international events.
Yet all is not so rosy for cable news. A close look
at the content, economics and even audience data
contradicts many of the conventional ideas about the
medium.
W
18 The State of the News Media 2004
Content The traditional method of storytelling on
television—the written, edited and taped pack-age—is vanishing on cable. Only 11% of thetime on cable (8% of stories) consisted of suchstory packages, according to a 2003 study bythe Project. Fully 62% of the time, on the otherhand, was “live” (interviews and live reporterstandups). This emphasis on live deemphasizesthe role of correspondents and means thatcable is something closer to a first draft,newsgathering in the raw.
Most of what is on cable is repetition—68% of segments were repetitious accounts of previously reported stories without any newinformation. Only 5% of revistited stories couldbe called “follow-ups” with new facts.
Even with 24 hours to fill, cable covers a fairlynarrow range of topics, mostly focused aroundgovernment, the war in Iraq, “true crime,”lifestyle/celebrity and disasters.
Much of the day, Fox, CNN, and MSNBC aremore similar in content and story selectionthan they are different. The analysis did not try to assess ideology.
Audience Contrary to how the cable networks usually
explain the numbers, the typical audience forcable has not grown since late 2001, stabilizingat about 2.4 million viewers in prime time andabout 1.6 million during the day, according toNielsen data.
The cable networks have lost all of the audiencethey gained during the war in Iraq, the datashow, in contrast to past major news events.
Although Fox is generally described as theaudience leader—Fox’s ratings are 60% higherthan CNN’s—surveys consistently show morepeople cite CNN as their primary news source.The contradiction suggests a greater number ofdifferent people watch CNN overall, but theyare spread out over time.
At first glance, cable ratings are tiny comparedwith those of network news—2.4 million inprime time, compared with 29 million for thethree commercial network evening newscasts in November 2003. Yet this may be misleading.In surveys, more people now report turning tocable news than network for most of theirnational and international news. Since ratingsonly measure people watching at a given
Cable TV
Story Types on Cable News*
% of All Minutes
Edited Package 11%
Interviews 41
Standups 21
Anchor Reads 15
Live Events 8
Banter 3
External Source 1
* Total may not equal 100 due to rounding.
www. Journalism.org 19
moment, knowing how many different viewersrely on cable overall is difficult.
Economics While some ambiguity hovers over which cable
news audience has the most viewers, there is noquestion about the financial leader—it is CNN.
Kagan World Media estimated that CNN earned$351 million in 2003, while Fox earned $96 mil-lion. MSNBC was projected to earn $3.1 million.
Fox is closing the gap in profits and revenues,but in the future it will have a harder timeexpanding at the same rate—nearly 50% ayear. Much of that increase was due to signingon to new cable systems. Now there are fewnew systems left to join.
Newsroom Investment Ideology aside, the real “Fox Effect” in cable
is a new approach to newsgathering, one thatrelies more on anchors and talk shows and lesson correspondents. Other cable networks haveimitated that approach.
CNN has nearly triple the newsgathering staffof Fox (about 4,000 people versus 1,500 for Foxand 500 for MSNBC, though MSNBC can alsoturn to NBC News staff). Fox, however, is build-ing its staff up from a small base, reflecting itsgeneral growth in audience. CNN and MSNBCare not.
Public Attitudes People tend to think more highly of cable than
other news media. When the Pew ResearchCenter asked, in early 2002, which media hadbeen “doing the best job of covering newslately,” cable was cited by 38%, more thantwice that of network, nearly three times thatof local TV and nearly four times that of news-papers. Cable is the only medium that saw thisconfidence index grow in recent years.
CNN stands out in viewer estimation. Forinstance, roughly a third (32%) of those sur-veyed by Pew gave CNN the highest possibleranking for “believability” in May of 2002, 13percentage points higher than Fox News and 11 points higher than MSNBC.
SOURCE: KAGAN WORLD MEDIA
20 The State of the News Media 2004
Local TVn nearly every aspect of local television—from viewer-
ship to economics to ownership to structure—there are
mixed signals of health and challenge. For now, it is still
healthier than most news industries and is considered
better off than network news. But signs of decline are
worrisome to the industry. The major issue over the
next few years will be how to maintain the traditionally
high profit margins when viewership is on the decline.
It is up to management now whether the industry heads
up or down.
I
www. Journalism.org 21
Audience Since 1997, Nielsen data indicate, the share of
available viewers commanded by local earlyevening newscasts around the country hasdropped 18%. The share commanded by latenews, which is broadcast after prime time isover, has dropped by 16%. In other words, localTV is now losing audience as fast as network TV.
This fact presents the medium with profoundproblems. To grow revenues, stations have lim-ited but difficult options. They can try to makeadvertisers pay more for smaller audiences;they can increase the amount of commercialtime versus news; they can add sponsorshipopportunities inside the newscast such as spon-sored segments, or sponsored logos on mapsand graphics; they can add more news pro-grams; they can cut costs.
Economics The local television business is remarkably prof-
itable, earning more than double the return ofnewspapers. Survey data suggest profit marginsof around 40% are a good estimate, and higherthan that in bigger markets.
The news division is responsible for a dispro-portionate amount of a station’s income.According to surveys by the Radio TelevisionNews Directors Association (RTNDA), news
accounts for 16% of programming each daybut roughly 40% of station revenue.
Newsroom Investment Many newsrooms are being asked to produce
more hours of news without more people, andin some cases with fewer people. From 1998 to2002 the average workload increased 20%,from 1.5 stories per day to 1.8, according tosurveys by the Project. Fully 59% of news direc-tors reported either budget cuts or staff cuts in2002.
Obligatory conversions to digital technologyopen up new possibilities, but the cost is bur-densome and often comes at the expense ofnewsroom investments. According to RTNDA,most stations expect to spend at least $1 mil-lion on this transition.
Content The content of local news is indeed local—
three-quarters of all stories—but there arequestions about how substantive that reportingis. Five years of content studies by the Projectfound that 4 in 10 stories were about fairly typical, everyday incidents. And 60% of storiesthat involved some controversy told mostly oronly one side of the story.
SOURCE: BIAfn
22 The State of the News Media 2004
The idea that it has to “bleed to lead” is anoversimplification. Crime was the most populartopic—by two to one over any other—but itonly accounted for 24% of the stories. Add inaccidents, catastrophes, fires and bizarre inci-dents and it still adds up to only about a thirdof stories.
However, when looking at lead stories, 61%were about crime or relatively routine fires and accidents.
There is distinct evidence the product is thin-ning. Over a five-year span (1998 to 2002), the Project found a drop in such things asinvestigative reporting and a growing relianceon stories that did not have a correspondentcovering them. The use of feed material fromelsewhere, for instance, rose from 14% to 23%of stories studied.
Ownership In 1995, the top ten biggest television station
owners had $5.9 billion in revenue and owned104 stations, according to BIAfn. By 2002, thosecompanies had doubled that revenue total andowned nearly three times as many stations.
By 2003, the four major networks owned 126stations (12%), mostly in the biggest cities.Declining are local owners with one or maybetwo stations.
A 2003 ruling by the Federal CommunicationsCommission that lifted many of the remainingcaps on concentration of ownership is nowbeing challenged in Congress.
Public Attitudes Over the years, surveys have shown consistently
that people generally trust local televisionnews more than any other type except cable.That trust, while still higher than for networknews or local newspapers, is beginning towane. In 1985, 34% said they could believe “allor most” of what they saw on local televisionnews. In 2002, that had declined to 26%,according to Pew Research Center surveys.
A large proportion of the public thinks localnews broadcasts are “improperly influenced”by powerful outside forces such as advertisers(42%), station owners (40%) and big business(37%), according to surveys from scholarRobert Papper.
Public Ratings of Media Believability
1985 1998 2000 2002
Local TV 34% 32% 30% 26%
Newspaper 28 27 23 20
ABC 32 28 26 22
CBS 33 26 26 23
NBC 32 28 26 23
CNN 20 37 33 32
SOURCE: PEW RESEARCH CENTER FOR THE PEOPLE AND THE PRESS
Local TV
www. Journalism.org 23
Magazineshen large social, economic or technological shifts
begin to reshape the culture, magazines frequently are
the first media to signal the change. The structure
of the industry is one reason. Publishers can add and
subtract titles aimed at specific audience segments or
interests more quickly than in other media. Advertisers,
in turn, can take their dollars to hot titles of the moment
aimed at particular demographics.
What do current trends in the magazine industry tell
us about the future of magazine journalism, particularly
news?
W
24 The State of the News Media 2004
Content The overall trend in magazines is toward spe-
cialization, magazines tightly focused on a setof interests. The big three traditional newsmagazines (Time, Newsweek, and U.S. News &World Report) have bucked that trend. Theyhave become less news magazines and moregeneral interest magazines.
The number of editorial pages in the threenews magazines has increased 9% since 1980.The content in those pages, meanwhile, hasgotten softer and more oriented to lifestylerather than traditional hard news, according todata from Hall’s Reports. The number of pagesdevoted to national affairs has dropped 25%since 1980, while those devoted to entertain-ment and celebrity stories have more than dou-bled. Health news has more than quadrupled.
Audience Overall, readership of the three big news week-
lies have declined. Time’s circulation fell 13%
from 1988 to 2002. U.S. News’ fell 13% as wellthrough 2003 (an early audit schedule made2003 data available). Newsweek has experi-enced a smaller decline of 3%, according to theAudit Bureau of Circulations.
A small group of news magazines with a verydifferent approach, such as The Atlantic andThe Economist, are seeing gains. The Economisthas seen its subscriber base more than doublein the past 15 years. These magazines have notmeasurably lightened their content.
Outside of news magazines, the number ofmagazine titles overall has grown dramatically.Most of that growth is occurring in niche serv-ice magazines such as those focused on childcare, travel or hobbies such as bicycling.
Among opinion journals such as The Nationand the National Journal, there seems to be aninverse relationship between readership andwhich party is in power. A Republican adminis-tration boosts a liberal magazine. Clinton wasgood for the conservative titles.
Magazines
SOURCE: HALLS MEDIA RESEARCH, 2003 FIGURES THROUGH JULY
www. Journalism.org 25
Economics While ad pages are growing in niche and enter-
tainment genres, they have remained stagnantfor news magazines. Since 1995, ad pages forentertainment and lifestyle magazines havegrown by a third and ad dollars have grownmore than 80%, according to data compiled bythe Publishers Information Bureau. Ad pagesfor news magazines, declined 1%.
There has been more separation economicallyamong the three major news magazines. In themid-1990s, the big three news magazines werebunched together in ad page sales. Time hasnow established itself as the clear leader, withNewsweek a strong second. U.S. News andWorld Report is third and losing ground.
Ownership Consolidation has occurred in the magazine
industry, and a handful of companies nowdominate the industry.
But the top companies are not the same asthose that dominate TV, cable, or newspapers.
Only four of the top ten magazine companies—Time Warner, Hearst, Advance and Primedia,are among the 25 largest media companies.
Newsroom Investment In the past 20 years, Time has reduced its staff
by 15% and Newsweek by a full 50%, accord-ing to staff boxes published in the magazines.The biggest hits have come in the lower ranksof the editorial staff, while the number of con-tributors and contributing editors hasincreased.
Research and fact checking have been targetedmost. Time has eliminated the “reporter-researcher” job title from its staff box andadded “reporters” and “writer-reporters.”Newsweek has done the same. In 1983, it listed76 “editorial assistants,” its equivalent ofreporter-researcher. By 2003 there were 18.
Bureau staffing, domestic and international,has seen even steeper cuts. The number ofbureau staff at Time has fallen from 86 to 55 inthe last 20 years. Newsweek’s has fallen from85 to 47.
SOURCE: PUBLISHER’S INFORMATION BUREAU
26 The State of the News Media 2004
Radioadio might be called journalism’s forgotten but
stable middle child. The medium that came after news-
papers and before television remains one that virtually
every American continues to use daily. While the medium
is segmented into as many as 47 different formats, many
radio stations include hourly news briefs in the course
of the day, and the number of news stations that are
mostly news and public affairs remains stable.
But there are also signs that cause concern, especially
when it comes to content. The data available suggest a
growing number of stations are not local at all.
R
www. Journalism.org 27
Audience More than 90% of Americans listen to the
radio, and nearly all of them get some newsthere, according to data from Arbitron.Moreover, unlike other media, that numberisn’t falling. The radio audience, and the radionews audience, appears stable.
Radio now formally lists 47 different formats,from Adult Contemporary to Alternative toFarm/Agriculture. While the exact number ishard to pin down, the best accounting suggeststhe number of broadcast radio stations hasdoubled since 1970, and is around 13,500. Ofthese, 1,000 (8%) list their format as primarilynews. Another 348 (3%) self report their for-mat as primarily talk show.
National Public Radio has seen its audiencedouble in the last 10 years. The majority of itsaudience, according to NPR figures, fallsbetween 25 and 54 years of age, has collegedegrees, and votes, and half have householdincomes over $75,000. This has created a situa-tion in which NPR is a media resource used by ayoung, culturally elite group.
There is little change to where and when peo-ple listen to the radio. The lone shift has beena steady climb in people listening in their cars.A key reason is people drive more, an averagetoday of 55 minutes a day, according to datafrom the Department of Transportation’sBureau of Transportation Statistics.
Economics News remains a major component of the radio
business. For the biggest radio companies forwhich data is available from BIAfn, newsaccounts for an average of 11% of total rev-enues—as much as 18% for one company, as little as 4% for another. This does not includestations who list their format as primarily talk.
Revenue from stations who cite news as theirprimary format (not including those who areprimarily talk) amounts to some $1.37 billionannually.
The total revenue from radio in the UnitedStates in all formats was some 12.7 billion in2002, the last year for which data were available.
At NPR, radio news’ big winner in recent years,the economics are different. It is a non-com-mercial format. Instead, 46% of the revenuecomes from member stations, which includesmember contributions and public funding. Theremaining 54% of funding comes from corpo-rate underwriting and grants from foundationssuch as the Pew Charitable Trusts or theMacArthur Foundation.
Ownership In radio, the level of consolidation exceeds that
of most other media, largely because of onecompany. In 1999, BIAfn figures indicate, thethree largest radio companies together owned
SOURCE: BIAfn
28 The State of the News Media 2004
fewer than 1,000 stations. Today they ownmore than 1,600. A single company, ClearChannel, owns 1,207 of them.
The top 20 owners combined operate morethan 20% of all the radio stations in the coun-try. Clear Channel alone operates stations in191 of the 289 Arbitron-rated markets. To get a sense of Clear Channel’s dominance, the sec-ond-largest company, Cumulus, operates in 55markets.
According to calculations from the Future ofMusic Coalition, a group critical of consolida-tion, 103 million Americans, or one-third of theU.S. population, are regular listeners to ClearChannel stations. The next closest is Infinity(Viacom), which has 59 million listeners (15% ofthe U.S. population). From there, the percent-ages drop to below 4% for the next-biggestcompany.
Newsroom Investment The ranks of local radio newsrooms are thin-
ning. From 1994 through 2001, the number offull-time radio newsroom employees declined
44%, and part-time 71%, according to surveydata compiled by Ball State University ProfessorRobert Papper.
In 2003, Papper found a trend toward news-room consolidation. More than 4 in 10 newsdepartments do news for one or more stationsoutside their market. And more than 75% ofnews directors now have responsibilities otherthan news.
The money isn’t good either. While salaries arerising, the median salary for a news director in2003 was $31,000 a year, for an anchor $29,500and for a reporter $23,000.
Public Attitudes Although many people listen to radio for other
things, they tend not to turn the channel whennews comes on. (According to one survey, 98%of listeners say they keep listening when thenews comes on and do not switch to a new station.) Thus, radio remains a place whereAmericans still get incidental news, or learnabout things they didn’t know they would care about.
SOURCE: BIAfn
Radio
www. Journalism.org 29www. Journalism.org 29
Ethnic/Alternative
f all the sectors of the news media, the ethnic and
alternative media in America are still in many ways the
most fluid. Even defining terms is complex. There are not
one or two ethnic media, but dozens. The ethnic media
are also often described in combination with the alterna-
tive media, but in fact they are distinct from each other.
Yet both sectors, the ethnic press and to a lesser
degree the alternative press, appear to be among the
few growth sectors in journalism.
O
Ethnic Population Trends Between 1990 and 2000, the number of people
not speaking English at home grew from 31.8million to 47 million—an increase of 48%,according to U.S. Census data. Spanish speakersled the growth, going from 17.3 million in 1990 to 28.1 million in 2000—up 62%. Chinesespeakers were second, up from 1.3 million in1990 to 2 million in 2000, an increase of 54%.
Unlike European immigration a century ago,many of these new Americans do not want tocut their cultural and national ties with thepast, and thus seem more inclined to continueto use ethnic media. For instance, more thanhalf of those Spanish speakers reported thatthey could speak English “very well,” but theychoose not to speak it at home.
Although these populations increasingly rely onethnic media, it is not that they trust it more.Hispanics, Asians, and people of Middle Easterndescent say, rather, that they tend to trustEnglish-language media more than their ethnicpress, according to a poll from New CaliforniaMedia.
Spanish-language Media The growth in ethnic media is impressive. Since
1990, while English-language newspapers havelost circulation by 11%, the circulation ofSpanish-language dailies in the United Stateshas more than tripled from 440,000 copies soldeach day to 1.7 million, according to theNational Association of Hispanic Publishers.
With more readers has come more advertising.Ad revenues of Spanish-language newspapershave grown more than sevenfold since 1990,from $111 million to $786 million, according tofigures from the Latino Print Network.
The number of Spanish-language dailies hasalso grown since 1990, by more than double(from 14 to 35). Consider, too, that during thesame period the number of English-languagedailies has dropped by more than 10%.
Among Hispanics, 41% say they mostly readSpanish-language papers, compared with 30%for Asians and 15% of Middle Easterners whoread mostly in their native languages.
Spanish-language TV has seen serious consolida-tion over the past decade to the point wheretwo players dominate the market.
SOURCE: NATIONAL ASSOCIATION OF HISPANIC PUBLISHERS
Ethnic/Alternative
30 The State of the News Media 2004
www. Journalism.org 31
Other Ethnic News Media The Black or African American press has played
an integral role in America for more than a cen-tury, and although African Americans are nowsecond only to Whites in the percentage whoread the mainstream press, there are still morethan 200 periodicals in the United States aimedat African Americans, according to the NationalNewspaper Publishers Association.
The Asian media seems less likely to assume theinfluence of Spanish-language media becauseof the number of languages and ethnicitiesthey encompass. This will discourage consolida-tion in ownership or ad sales.
In addition to the explosive growth in Spanish-language media, a study of ethnic newspapercirculation in New York shows that most nation-alities or ethnic groups for which there are datahave seen growth, particularly Chinese, Irish,Japanese, Korean, Caribbean, and Arab.
Alternative Press The Alternative press is also growing impres-
sively, though perhaps not as much as the ethnic.The circulation and revenues of alternative
weeklies skyrocketed in the 1990s. Circulationmore than doubled, rising from 3 million in1990 to 7.5 million in 2002, according to datafrom the Association of Alternative News-weeklies. Revenues rose from 1992 to 2000,took a dip in 2001 and were on the way backup in 2002, the Association reports.
The number of newsweeklies also appears to begrowing. The membership of the Association ofAlternative Newsweeklies has nearly doubledsince 1990, to 123 in 2002.
While often thought of as papers for theyoung, these outlets usually have readershipwith median ages in the 30s and sometimes 40s,with fairly high incomes and relatively higheducation levels.
These weeklies are increasingly owned by oneof a few national chains that collect alternativeweeklies. These are not, however, the same vastnational chains that own dailies.
Some scholars now talk instead about a “dissi-dent press” in addition, to denote other publi-cations and media, which are distinct from thesemore established and commercially orientedalternative papers.
SOURCE: ASSOCIATION OF ALTERNATIVE NEWS WEEKLIES
32 The State of the News Media 2004
Project for Excellence in Journalism
1850 K Street, NW, Suite 850
Washington, DC 20006
Phone: 202.293.7394
Fax: 202.293.6946
www.Journalism.org
Executive Summary
For the full report, log onto www.Journalism.org
N e w s p a p e r s O n l i n e N e t w o r k T V M a g a z i n e s
C a b l e T V L o c a l T V R a d i o E t h n i c / A l t e r n a t i v e N e w s p a p e r s O n l i n e N e t w o r k T V M a g a z i n e s
C a b l e T V L o c a l T V R a d i o E t h n i c / A l t e r n a t i v e
By the Project for Excel lence in Journal ism
About The Story – IntroAbout the StudyThe State of the News Media report was written by the Project for Excellence in Journalism, with the aid of manycollaborators. Funding was provided by the Pew Charitable Trusts.
Click here for information about printing pages from the report.
MethodologyDetails on how we put together study together, including background on the content analysis sections.
Authors and CollaboratorsA list of people who worked on the report.
Source BibliographyAn alphabetical listing of all the sources referenced in the report, including Web addresses.
Contact UsHow to reach the Project for Excellence in Journalism.
PermissionsDetails on using information found in the report.
Privacy PolicyInformation about your privacy. We do not collect any user information.
Site Map
MethodologyMethodologyThe data for this study were collected in two parts. Much of the study is based on research conducted originally by otherpeople or organizations. Other research, particularly in the content analysis, is original work conducted specifically for thisreport.
For the data that was aggregated from other researchers, the Project took several steps. First, we tried to determine whatdata had been collected and by whom for the eight media sectors studied. We organized the data into the six primaryareas of interest we wanted to examine: content, audience, economics, ownership, newsroom investment and publicattitudes. For all data ultimately used, the Project sought and gained permission for its use. Next, the Project studied thedata closely to determine where data reinforced each other and where there were apparent contradictions or gaps. Indoing so, the Project endeavored to determine the value and validity of each data set. This in many cases involved goingback to the sources who collected the research in the first place. Where data conflicted, we have included all relevantsources and tried to explain their differences, either in footnotes or in the narratives. For instance, the differences inonline news usage are likely explained by how survey questions were phrased. For example, there are substantial gaps
depending on whether a survey asks whether one ever goes online for news, has done so in the last month or in the lastweek.
In analyzing the data for each media sector, we sought insight from experts by having at least three outside readers foreach sector chapter. These readers raised questions, offered arguments and questioned data where they saw fit. In a fewcases, we sought the advice of our statistical research team at the University of Missouri School of Journalism.
All sources are cited in footnotes or within the narrative, and listed alphabetically in a source bibliography. The data usedin the report are also available in more complete tabular form to any users online, where they can view the raw data, sortit on their own and make their own charts and graphs. Our goal was not only to organize the available material into aclear narrative, but to also collect all the public data on journalism in one usable place. In many cases, this involved theProject having to purchase the use of the data.
For the original content analysis research conducted by the Project, the methodology follows.
Content Analysis Methodology
Sampling and Inclusion
There are two distinct categories of media that were studied as part of the Project’s 2004 Annual Report on the State ofthe News Media.
The first, TextBased Media, included Newspapers, News Magazines, and Internet News Sites. Princeton SurveyResearch Associates International conducted coding for these media.
The second, Electronic Media, included both Broadcast Network and Cable Network News. ADT Research, publisher ofthe Tyndall Report, conducted coding for these media.
Each subcategory of media was subject to a specific methodological approach re: sampling and selection.
TextBased Media
Newspapers
Newspaper Selection
Individual newspapers were selected to present a meaningful assessment of content widely available to the public.Selections were made on both a geographic and a demographic basis, as well as diversity of ownership.
First, Newspapers were divided into four quartiles based on daily circulation size: More than 750,000; 300,001 to750,000; 100,001 to 300,000, and 100,000 and under.
For newspapers over 750,000, we selected four papers: USA Today, The Los Angeles Times, The New York Times andThe Washington Post. (The Wall Street Journal, which also falls in this circulation category, was excluded as a specialtypublication.)
Four newspapers were chosen in each of the remaining three categories. To ensure geographical diversity, each of thefour newspapers within a circulation category was selected from a different geographic region of the United States.Regions were defined according to the parameters established by the U.S. Census Bureau. 1
The newspapers in circulation groups 2, 3 and 4 were selected through the following process: First, using the Editor andPublisher Yearbook, a list of every daily newspaper in the United States was created. Each newspaper was assigned arandom number. After resorting the list by the random number, newspapers were chosen by going down the list until allslots were filled. To be eligible for selection, a newspaper (a) must have a Sunday section, (b) must have its storiesindexed in a news database in order to be available to coders and (c) must not be a tabloid. Newspapers not meetingthese criteria were skipped over. In addition, an effort was made to ensure a range of owners was included. Thoseselected were:
Circulation Group 1 The Los Angeles Times The New York Times USA Today The Washington Post
Circulation Group 2The Arizona Republic (Phoenix)The Boston GlobeThe Detroit Free Press 2The St. Petersburg Times
Circulation Group 3The Hartford CourantThe Kansas City StarThe Knoxville (Tenn.) News Sentinel The Las Vegas ReviewJournal
Circulation Group 4The Albany (N.Y.) Times Union The Corpus Christi (Texas) CallerTimes The Modesto (Calif.) BeeThe Rockford (Ill.) Register
Newspaper Study – Operative Dates 2003Random sampling was used to select a sample of individual days for the study. By choosing individual days rather thanactual weeks, we hoped to provide a broader look at news coverage that more accurately represents the entire year. Inorder to account for variations related to the different days of the week, the 28 days that were sampled included 4 of eachday of the week. Dates were chosen from January 1 to October 7, a span of 280 days. October 7 was the last eligible dayin order to allow time for coding.
Using these procedures, the following dates were generated and make up the 2003 sample:
Story Procurement, Selection, and InclusionArticles were obtained via a combination electronic databases (Dialog, Factiva, Nexis), supplemented by hard copies ofdaily publications. 3
All articles with distinct bylines that appeared on the selected newspaper’s front page (Page A1), on the first page of theLocal/Metro Section, or on the first page of the “soft news” section, (i.e., Living, Food, Style, Entertainment, Weekend,etc.) were selected for analysis. 4
News Magazines
This year the study sought to examine content of general interest news magazines. The news magazine samplecomprised the three largest weekly general interest news magazines: Time, Newsweek, and U.S. News and WorldReport. As of June 30, 2003, all three magazines had circulations above two million. 5
News Magazine Study – Operative Dates 2003 6In order to ensure a sample that was spread throughout the year, the first 40 weeks of 2003 (January 1 to October 7)were divided into 4 groups of 10 weeks. One week was chosen at random from each group, which resulted in a sample of4 weeks.
Using these procedures, the following dates were generated and make up the 2003 sample:
February 17April 7June 16October 6
In addition, the study took a census of all 2003 covers of the three magazines in the sample. Covers of Time wereobtained its Web site, http://www.time.com/time/magazine/coversearch/. Covers for Newsweek were obtained throughNewscom.com, http://prn.newscom.com. Covers for U.S News & World Report were obtained through its Web site,http://www.usnews.com/usnews/issue/archive.htm.
Story Procurement, Selection, and InclusionFor each news magazine, all stories with distinct bylines appearing in issues delivered to general mail subscribers in theWashington, D.C., area were included. Stories were procured via a combination of the Nexis database and hard copies ofeach publication.
In order to select the Internet news sites to be coded, the Nielsen//NetRatings top 20 news sites list was consulted todetermine the most prominent news sites. The list contained four basic types of sites: news aggregators, 7 newspapersites, network news sites and cable news sites. Two sites were chosen for each of these categories. For aggregators,AOL and Yahoo were selected as they are the only two aggregators in top 20 list. For network news sites, two sites wererandomly chosen from among ABC, CBS, and MSNBC. For cable sites, two were randomly chosen from among CNN,Fox News, and MSNBC. MSNBC appeared in both lists because it is the news site for both NBC News and the MSNBCcable channel. For newspapers, the first site was chosen randomly from the four newspapers in circulation group 1 andthe second site was chosen randomly from the 12 newspapers in groups 2 through 4.
Using Via this sample selection, the following sites were included in the 2003 study:
AOL (news section front page)CBS News (www.cbsnews.com) CNN (www.cnn.com) Fox News (www.foxnews.com) The Las Vegas ReviewJournal Online (www.reviewjournal.com) MSNBC (www.msnbc.com) The New York Times Online (www.nytimes.com) Yahoo! (news.yahoo.com)
Internet News Sites – Operative Dates 2003The eligible dates for Web site coding ranged from July 14 to October 7, a period of 86 days. We were unable to acquirepast Web pages, and therefore selected July 14 as the earliest available date to capture Web pages. October 7 was thelatest date to collect pages to allow time for coding. Labor Day was excluded from the sample. Five days were selectedat random, one of each weekday in order to account for variations due to the day of the week.
With these procedures, the following dates were generated and make up the 2003 Internet News Site sample.
July 14August 5August 15September 10September 25
Story Procurement, Selection and Inclusion
Each site was visited four times on each day – 9 a.m., 1 p.m., 5 p.m. and 9 p.m., all Eastern time, to download stories.The order in which the sites were visited was rotated for each capture time. Each download took about 20 minutes tocomplete.
Each time, the following method was used to determine which stories to capture. From the news home page of each ofthe sites, we captured two levels of stories. First, all stories at the top of the page explicitly relating to a graphic picture –event or person – were captured as featured stories. Multiple stories explicitly relating to the same graphic were alsocaptured as features. Pages with more than one graphic have more than one featured story.
After the featured stories, we included the next three most prominent stories without graphics starting from the top andmoving down. These stories were recorded as nonfeatured.
The following rules were put into place in selecting stories:
For the sample, omitted from study were video, audio, charts, maps, background/archival information, news tickers,chat and polls.
Any headline link that linked to an outside Web site was also omitted. (However, stories attributed to other outlets butpresent on the site being studied were counted.)
Links to secondary stories about the same topic were counted as unique, nonfeature stories.
A graphic attached to a nonstory item (i.e., video, audio, charts, maps, background/archival information, “completecoverage,” chat and polls) was not counted as a story.
If there were no stories associated with a graphic, then only the top three stories were coded and none wereconsidered featured.
If there was no graphic present, then no story was considered as featured, and the top three stories were counted asnonfeatured.
When news headlines with the same font and type size appeared in sidebyside columns, stories were prioritized in alefttoright, linebyline zigzag pattern.
TextBased Media Coding Procedures General practice called for a coder to work through no more than seven days/issues from any news outlet during a codingsession. After completing up to seven days/issues from one publication, coders switched to another TextBased Mediaoutlet, and continued to code up to seven days/issues.
All coding personnel rotated through all circulation groups, publications/sites, with the exception of the designated controlpublications. A control publication was chosen in each category of Text Media, including one newspaper in eachcirculation group. The designated control publication was initially handled by only one coder. That work was thenoversampled during intercoder reliability testing.
Working with a standardized codebook and coding rules, coders generally worked through each story in its entirety,beginning with the inventory variables – publication date, story length, placement and origination. Next, they recorded thecodes for that same story’s content variables – topics, protagonists, sourcing levels and recurring leads/big stories. (Note:in approximately 10 percent of all cases, the inventory variables were precoded by research assistants; the contentvariables were then completed by coding staff.)
Intercoder Reliability Testing For Text Media Intercoder reliability measures the extent to which two coders, operating individually, reach the same coding decisions.The principal coding team for Text Media comprised four individuals, who were trained as a group, augmented by twoprecoders. One coder was designated as a general control coder and worked offsite for the duration of the project. Inaddition, one publication in each circulation group was designated as a control source.
At the completion of the general coding process, each coder, working alone and without access to the initial codingdecisions, recoded publications originally completed by another coder. Intercoding tests were performed on 5 percent ofall cases for inventory variables, and agreement rates exceeded 98 percent for those variables. For the more difficultcontent variables, 20 percent of all publications/sites were recoded, and intercoder agreement rates were as follows:
Big Story/Recurring Lead Agreement Rate = 90%Protagonist Code = 86 % for designation of Individual vs. Institutional ProtagonistTopic = 87% Level I Sourcing (Named and Identified Sources) = 93%;Level II Sourcing (Name/Title Without Relationship Explained) = 91% Level III Sourcing (Unnamed/Untitled With Relationship Explained) = 91%Level IV Sourcing (Unnamed, No Explanation of Relationship) = 89%
No significant differences were found to exist on a recurring basis.
Broadcast Network Sample
The ability to make direct comparisons between Newspaper and Broadcast Network findings was a project design goal;thus, the weekday sample dates for those two news categories are identical. Because of preemptions and schedulechanges, weekend network news broadcasts do not always appear in all markets; thus, Saturday and Sunday broadcastnetwork news programs were excluded from the study. The following dates made up the Broadcast Network sample:
Broadcast Network Morning News Programs(7 to 7:59 a.m. Eastern time)
ABC — “Good Morning America”CBS — “The Early Show”NBC — “Today”
Broadcast Network Evening News Programs(Full program as broadcast in New York market)
ABC – “World News Tonight” CBS – “Evening News”
NBC – “Nightly News”PBS – “NewsHour”
Program Procurement and Story Selection/InclusionThe morning and evening broadcasts of the three commercial networks were videotaped live in the New York City market.For the evening newscasts, this represents each day’s 6:30 p.m. East Coast feed. PBS supplied the Project with tapes ofthe “NewsHour.” All programming was available on videotape. No coding relied on secondary sources such as transcripts.
In the mornings, the following content was analyzed: stories read by the newscaster in the halfhourly newsblocks; featureand interview segments outside of the newsblocks; banter between members of the anchor team whose import was otherthan to tease upcoming segments in that day’s program or to promote the network’s programming at some later time.Onefifth, 20 percent, of the sample was coded for teasers and promos and was analyzed separately. Excluded from theanalysis were the content of the weather, local news inserts, commercials, and other contentfree editorial matter such aslogos, studio shots, openings and closings.
In the evenings the same rules applied, but because the content of the newscasts is less variegated, concerns aboutnewsblocks, banter, weather and local news inserts were not applicable.
Cable News Sample
Cable News Programming – Operative Dates 2003Cable coding dates were generated by randomly selecting five days, one of each weekday, from the period of June 1 toOctober 7, a 129day span. June 1 was chosen as the start date due to the availability of tapes. October 7 was the lasteligible date in order to allow time for coding. Weekend days were excluded because of the variability of the weekendcable schedule.
Following these criteria, the following dates were generated and represent the Cable News sample for 2003:
June16July15August21September19, 24
In order to assess the nature of the 24hour news cycle as presented on cable news programming, CNN, Fox News andMSNBC were selected because they were the three most viewed cable news channels in 2003. To get a sense of thenature of cable news, programming for the five days was coded from 7 a.m. (the beginning of the morning shows) until11 p.m. (the end of prime time), a 16hour stretch of programming. This resulted in 240 hours of programming.
Following these criteria, the following cable networks and broadcasts made up the 2003 Cable Network sample.
CNN“American Morning”“CNN Live Today” “Live From … ”“Inside Politics”“Crossfire”
“Wolf Blizter Reports” “Lou Dobbs Tonight” “Live From the Headlines With Anderson Cooper”“Live From the Headlines With Paula Zahn”“Larry King Live”“NewsNight”News BreakIn/Unscheduled Breaking NewsOther Show, NonNews BreakIn
FOX“Fox and Friends”“Fox News Live”“Day Side With Linda Vester” “Studio B With Shepard Smith”“Your World With Neil Cavuto” “The Big Story With John Gibson”“Special Report with Brit Hume”“Fox Report with Shepard Smith”“The O’Reilly Factor”“Hannity and Colmes”Program Procurement and Story Selection/Inclusion
Cable news videotape was collected by VMS, a commercial thirdparty monitoring service. Dubbed copies were sold toPEJ for use for “internal review, analysis or research only.” In a few instances, the Federal Document Clearing HouseInc., a nongovernment source, supplied videotape unavailable through VMS. On a few occasions the videotapes endedfive minutes short of an hour or started a few minutes late. Here, transcripts were consulted when needed. In total, fewerthan three hours were missing out of the total 240hour sample.
For each 16hour day, editorial content was broken into individual story items (the television equivalent of newspaperarticles). An item was defined by its format, produced as a single program element standing alone, and by its content,covering a discrete story. Each item was measured for its duration and coded for its journalistic content according to anarray of variables including format, topic focus, levels of sourcing, any depiction of a central protagonist and coverage ofthe year’s overarching major news developments, in particular Iraqrelated coverage. Onefifth, 20 percent, of the samplewas coded for teasers and promos and analyzed separately.
Electronic Media Coding Procedures
A team of three coders analyzed television news. No one coder analyzed less than 20 percent of each the three types ofprogramming (morning broadcast, evening broadcast and cable news). In order to keep track of repetition and freshnessof stories during the course of the day, coders were assigned to an entire bloc of a cable network’s 16 hours ofprogramming.
Since many of the findings are weighted by time spent on each item, it was essential to ensure accurate measurement ofthe duration of items. They were documented as rundowns with start times and end times, allowing for the duration to becomputed as the difference between the two. All of the commercial network broadcasts were viewed twice to derive an
accurate inventory and item length statistics. To double check the accuracy of all longformat items, coders not onlydesignated packages, interviews (external or inhouse) and standups, but also documented a story summary in the formof headlines/slugs and the identity of the reporter or interview subject involved. These headlines/slugs were also used todouble check topic and big story coding.
Intercoder Reliability Testing For Electronic Media An intercoder reliability check was performed to test the stability of the protagonist code and the source codes, bothnamed and unnamed. A total of 35 hours of programming (777 different items) was recoded on these variables by asecond coder, following the rundowns of start time and end times produced by the first coder’s inventory. The code for asingle protagonist being portrayed as the central character of a story had an 87 percent reliability level. The code fornamed and identified Sources (at least three per story versus two or fewer) had a 92 percent reliability level. The code forunnamed yet identified sources (at least three per story versus two or fewer) had a 94 percent reliability level.
Intercoder Reliability Testing Across Media The project was designed so that for two specific media subcategories – Newspapers and Broadcast Network News –there could be direct comparisons made as to findings within each subcategory. Because there were two distinct codingoperations that worked on TextBased and Electronic Media, intercoder reliability testing was conducted between the twogroups. PSRA coders, working independently and without access to original coding decisions, recoded 10 percent of theBroadcast Network News stories completed by each Tyndall Research staff member on topic and big story/recurring leadvariables. For topic, agreement was reached in almost four of every five cases (79 percent); for big story/recurring lead,agreement was found in more than nine of every ten cases (94 percent). These are the only media and the only twovariables where crossmedia comparison can be and are made.
Data Analysis
For each media subcategory – Newspapers, News Magazines, Internet News Sites, Broadcast Network News and CableNetwork News – separate datasets were created, and separate tabulations were constructed. There was no aggregationof the data, and in reporting results, all cites of “totals” refer only to the specific media subcategory at hand.
For much of this report, the individual news story is the unit of analysis. There are, however, selected variables where itwas more informative to present analysis via a measurement of the time/words devoted to particular topics or recurringleads.
Within each universe (cable, newspapers, etc.), each case in the applicable SPSS dataset represents one story. Length isone of the measurements recorded for each case. (For network and cable television, this number represents seconds; fornewspaper and news magazines, this number represents word count; for Internet, no volume analysis was applied.)
To create the volumetric tables, each case was selected and the number recorded in the length variable was designatedas a weight. Then, that individual weight was applied to each individual case. The resulting weighted dataset was used inthe production of volumetric tables for selected variables.
Statistical Analyses
For most comparisons of how content and structure of the news varies as a function of which medium is being examined,chi square analyses were used. Chi square is a nonparametric statistic that examines the relationship between nominal
variables, that is, variables that are identified by “name” and are not on a numeric scale (e.g., CNN, MSNBC and FoxNews are nominal variables.) As explained by scholars Daniel Riffe, Stephen Lacy and Frederick Fico:
“The chisquare test of statistical significance is based on the assumption that the randomly sampled data wasappropriately described, within sampling error, the population’s proportions of cases falling into the categorical values ofthe variables being tested.
“Chisquare starts with the assumption that there is in the population only random association between the two variables,and that any sample finding to the contrary is merely a sampling artifact. “ 8
This is called the “null hypothesis” and refers to the situation where thereis no relationship between the two variables examined.
Riffe and Lacy continue, “For each cell in the table linking the two variables, chisquare calculates the theoreticalexpected proportions based in this null relationship. The empirically obtained data are then compared cell by cell with theexpected nullrelationship proportions. Specifically, the absolute value of the differences between the observed andexpected values in each cell goes into the computation of the chisquare statistic. Therefore, the chisquare statistic islarge when the differences between the empirical and theoretical cell frequencies is large, and small when the empiricallyobtained data more closely resemble the pattern of the null relationship.
“This chisquare static has known values that permit a researcher to reject the null hypothesis (no relationship betweenthe variables) at the standard 95 percent and 99 percent levels of probability.” 9
Footnotes
1. U.S. Census Bureau, see http://www.census.gov/geo/www/us_regdiv.pdf for a map of the regions
2. The Detroit Free Press is bound to The Detroit News by a Joint Operating Agreement (JOA). Weekend editions reflectcombined resources of both newspapers.
3. For the Nashville Tennessean, it was not possible to capture wire copy for the June – October dates.
4. All Page One articles from The Rockford (Ill.) Register were removed from the newspaper database before analysis.This was dictated by the frontpage format of the Register, which differed from all other newspapers in this study. Nocomplete articles are found on Page A1 of The Register; rather, abridged stories are presented, referring the reader tothe full account, found on other pages throughout that day’s paper. Articles published on the lead pages of theMetro/Local and the Style/Living sections of The Register are included in this analysis.For the New York Times, the following daily selections were made re: applicable “soft news” section: Monday, Tuesday –Arts & Culture; Wednesday – Dining In; Thursday – House and Home; Friday – Escapes; Saturday – Arts & Ideas;Sunday – Styles.
5. For circulation figures, see Advertising Age, http://www.adage.com/page.cms?pageId=1020.
6. These represent the publication date as reported on the cover of each news magazine; the newsstand appearance ofthese issues occurred about one week before the publication dates.
7. Aggregators do not create news articles. Instead, they post material from wires and other news outlets.
8. Riffe, D., Lacy, S., & Fico, F. (1998). Analyzing media messages using quantitative content analysis in research.Mahwah, New Jersey: Laurence Erlbaum, 1988, pp 167168.
9. Ibid.
Authors and CollaboratorsAuthors and CollaboratorsMany partners contributed to this report.
The content analysis was designed by the Project in collaboration with three of those partners, Lee Ann Brady ofPrinceton Survey Research Associates International, Andrew Tyndall of ADT Research, Publisher of the Tyndall Report,and Esther Thorson, associate dean of graduate studies and research at the University of Missouri School of Journalism.The coding of print media (online, newspapers and magazines) was executed by PSRAI under the supervision of Brady.The coding of electronic media (cable and network TV) was executed by ADT under the supervision of Tyndall. PSRAIthen conducted additional testing of Tyndall’s coding to assess whether comparisons of codes between houses and printand electronic media were statistically feasible. All conclusions and analysis were then sent to Thorson’s team at Missourifor statistical testing. Video tapes for content analysis were either supplied by Andrew Tyndall or provided courtesy ofVideo Monitoring Services. We would especially like to thank Juan Hidalgo and Pro Sherman for their support.
Daniel Riffe, professor of journalism at Ohio University consulted on the design of the sample.
The chapters on cable and network television were coauthored by Tyndall. The chapter on newspapers was coauthoredby Rick Edmonds of the Poynter Institute. The rest of the chapters were written by the Project.
Matt Carlson of the Project conducted the data aggregation for the newspaper and online chapters. Atiba Pertillaconducted the data aggregation for the cable and local television chapters. Tom Avila conducted the data aggregation forthe radio chapter. Dante Chinni conducted the data aggregation for the ethnic, alternative and magazine chapters.Carlson, Chinni and Pertilla collaborated on data collection for the network chapter.
Carter Cosgrove designed the website. Matt Carlson implemented the design and construction of the site with theassistance of Dante Chinni and Atiba Pertilla. Tom Avila aided in the visual design of the website as well as of theExecutive Summary. Wendy Kelly of WLK Design published the executive summary. Meredith Everson assisted inexamining the website’s functionality.
Amy Mitchell, PEJ’s associate director and research director, supervised the project. Tom Rosenstiel is the Project’sdirector.
Irv Molotsky, a former reporter and editor at the New York Times, was the copy editor. Carrie Brown and Brett Muelleralso copy edited parts of the report.
More than twenty people served as readers of the chapters. Among them are: Laurien Alexandre, Charles Bierbauer,Merrill Brown, Wally Dean, Tom Dolan, Paul Friedman, Bob Giles, Jeff Gralnick, Lawrence Grossman, Samir Husni,Brooks Jackson, Don Kimelman, Katie King, Bill Kovach, Wayne Lynch, Victor Navasky, Bob Papper, Deborah Potter,Adam Powell, Henrik Rehbinder, Lee Rainie, Al Stavitsky, Cyndi Stivers, and Roberto Suro.
Their thoughtful insights and suggestions greatly improved the chapters, but the readers are in no way responsible for theanalysis or narrative accounts in this report. Moreover, the readers were not sources for information, unless explicitly citedin footnotes. In no case did a reader serve as an anonymous source for anything in the report.
Finally, the project could not have been completed without the extraordinary support, both financially and personally, ofthe Pew Charitable Trusts, particularly Don Kimelman, our friend and colleague, and Rebecca Rimel, whose idea thisreport was in the first place.
Source BibliographySource BibliographyThe following list comprises the sources used throughout this report.
A | B | C | D | E | F | G | H | I | J | K | L | M | N | O | P | R | S | T | U | V | W | Y
A“ABC News Online Services Turns to Profit.” Reuters, December 18, 2003.
Ad Age. “100 Leading Media Companies, 2002 data.” Published August 18, 2003. Web site:http://www.adage.com/page.cms?pageId=601.
Laurien Alexandre and Henrik Rehbinder, “Separate but Unequal.” Columbia Journalism Review, November/December2002, pp 99 – 101.
Craig M. Allen. News Is People. Ames, Ia.: Iowa State University Press, 2001.
American Association of Advertising Agencies and the Association of National Advertisers. “Television CommercialMonitoring Report, 2001.” Web site: http://www.ana.net/com/ta/clutter.pdf.
American Cable Association. “American Cable Association Files FCC Petition for Inquiry Into Retransmission ConsentPractices.” Press release, October 1, 2002.
American Society of Newspaper Editors. “Newsroom Employment Survey.” Published 2003. Web site:http://www.asne.org.
Arbitron, Inc. “Radio Today: How America Listens to Radio,” various editions, 1998 through 2003. Web site:http://www.arbitron.com/study/grt.asp.
Arbitron/Edison Media Research. “Internet and Multimedia 11: New Media Enters the Mainstream, 2003.” Published2003. Web site: http://www.arbitron.com/downloads/Internet_Multimedia_11.pdf.
Associated Press, weekly stories on television ratings.
Association of Alternative Newsweeklies, unpublished data. Web site: http://aan.org.
Association of Alternative Newsweeklies. “AAN Publication Directory.” Continually updated. Web site:http://aan.org/gbase/Aan/publicationDirectory.
Audit Bureau of Circulations. “Audit Reports,” various magazines, 19912003. Web site: http://www.accessabc.com.
Audit Bureau of Circulations. “Newspaper Publisher’s Statement,” March 30, 2003.
Ken Auletta, “Vox Fox.” The New Yorker, May 26, 2003.
return to the top
BDavid Bauder, “Bad business news boosts CNBC.” Associated Press, July 4, 2002.
David Bauder, “CBS News hits ratings low.” Associated Press, July 3, 2003.
David Bauder, “For CNN, Fox’s openandshuttle case of piracy.” Associated Press, February 17, 2003.
Cory Bergman, “TV Stations May Finally Get the Point.” Online Journalism Review, April 24, 2003.
BIAfn MediaAccess Pro, unpublished data. Web site: http://www.biafn.com.
David Bianculli, “CNN exec knocks Fox News.” The New York Daily News, July 11, 2003.
Todd Bishop, “TV’s morning wars.” Philadelphia Business Journal, March 27, 2000.
Leo Bogart, “Newspapers. Figure out how to give readers a choice and take your eye off the quarterly earnings report.”Media Studies Journal, Spring/Summer 1999, pp. 6068.
Borrell Associates, Inc. “What Newspaper Web Sites Earn.” Published April 2003. Web site:http://www.borrellassociates.com.
return to the top
C“Cable News Network.” Encyclopedia of Television. Web site:http://www.museum.tv/archives/etv/C/htmlC/cablenewsne/cablenewsne.htm.
Cable Television Advertising Bureau, “CNN Profile.” Web site: http://www.cabletvadbureau.com/02Profiles/CNNProf.htm.
Cable Television Advertising Bureau, 2003 Cable TV Fact Book. Web site:http://www.cabletvadbureau.com/02facts/viewership2.htm.
“Ratings.” Cable World, January 13, 2003.
“Ratings.” Cable World, March 24, 2003.
“Ratings.” Cable World, March 31, 2003.
“Ratings.” Cable World, June 30, 2003.
Mercedes M. Cardona, “TV ad spending rebounds during week three of war.” Ad Age, April 23, 2003.
Dan Careless, “News sets on a budget.” Digital TV, January 2003.
Steve Carney, “Radio: Around the Dial: 22% of Americans get news from talk jocks.” Los Angeles Times, Friday, January10, 2003.
David Carr, “Newsweeklies Agree to Pact on Allegations of Collusion.” The New York Times, Jan. 27, 2003 p. C01.
Center for Media and Public Affairs, various studies. Web site: http://www.cmpa.com.
Stephen Chiger, “FCC throws its weight behind DTV.” Medill News Service, August 8, 2002.
Classified Ventures, LLC. “Who we are.” Online presentation, 2003. Web site:http://www.classifiedventures.com/business/who_we_are.htm.
“CNN downsizing.” The NewsHour with Jim Lehrer. PBS, January 29, 2001. Web site:http://www.pbs.org/newshour/bb/media/janjune01/cnn_129.html.
CNN. “CNN Nuts and Bolts.” Web site: http://www.cnn.com/SPECIALS/2000/CNN20/story/nutsbolts/facts.
comScore. “comScore Media Metrix Announces Top 50 U.S. Internet Property Rankings for September 2003.” Pressrelease, October 21, 2003. Web site: http://www.comscore.com.
Dwight Crumb, “Centralcasting at WALATV.” Broadcast Engineering, March 1, 2003.
return to the top
DPaul Davidson, “Local stations multicast multishows.” USA Today, January 28, 2004.
Lisa de Moraes, Washington Post, “Tim Russert Signs Record Deal With NBC News.” December 12, 2001.
Lyle Denniston, “Court delays FCC rules on media.” Boston Globe, September 4, 2003.
Walt Disney Company. “The Walt Disney Company Annual Report, 1999.” Web site:http://www.reportgallery.com/work/disney99/dis99ar08.html.
Steve Donohue, “Fox News raced to 80M subs.” Multichannel News, June 3, 2002.
Robin Dougherty, “Animal Magnetism.” Salon, March 25, 1997. Web site:http://www.salon.com/march97/media/media970325.html.
Dow Jones, Inc. “SEC Quarterly Report (10Q).” SEC filing, November 14, 2003.
Kevin Downey, “Viewers, not $s, drive cable news networks.” Media Life Magazine, September 19, 2001.
return to the top
EEditor and Publisher Yearbook, various years, 19402003. Web site:http://www.editorandpublisher.com/eandp/resources/yearbook.jsp.
Rick Edmonds, “Good Times Coming? Watch Out.” Poynter Online, December 8, 2003. Web site:http://www.poynter.org/content/content_view.asp?id=56948&sid=47.
“8 Journalists laid off at struggling MSNBC.COM.” Seattle Times, October 11, 2002
Marcus Errico, “Fox News Channel goes live Monday.” E! Online, October 6, 1996.
“Even when the economy recovers, many newspapers that have gone a lean diet won’t be bulking up again.” Editor andPublisher, March 4, 2002.
return to the top
FPaul Farhi, “Everybody Wins.” American Journalism Review, April 2003. Web site: http://www.ajr.org/Article.asp?id=2875.
U.S. Federal Communications Commission. “Broadcast Station Totals.” Web site:http://www.fcc.gov/mb/audio/totals/index.html.
Lucinda Fleeson, “Bureau of missing bureaus.” American Journalism Review, October/November 2003. Web site:http://www.ajr.org/Article.asp?id=3409.
Professor Joe Foote, Arizona State University (Tempe, Ariz.), unpublished data.
“For networks, finding younger viewers is a gray area.” Los Angeles Times, June 11, 2002.
“For the big fish, the water’s fine.” Broadcasting and Cable, December 1, 2003, pp. 3441.
“Fox News Channel overtakes CNN in ratings for the first time.” Associated Press, January 30, 2002.
Phyllis Furman, “CNN in big ad shakeout.” The New York Daily News, June 25, 2003.
Phyllis Furman, “CNN sacks big names.” The New York Daily News, January 3, 2003.
Future of Music Coalition, “Radio Deregulation: Has It Served Citizens and Musicians? A Report on the Effects of RadioOwnership Consolidation.” Published November 18, 2002. Web site:http://www.futureofmusic.org/images/FMCradiostudy.pdf.
return to the top
GDominic Gates, “Dubious Accounting?” Online Journalism Review, July 10, 2002. Web site:http://www.ojr.org/ojr/future/1026348767.php.
Verne Gay, “High stakes in the war for cable news supremacy.” Cable World, March 24, 2003.
Michael Getler, “Department of Continuous News.” Washington Post, July 31, 2003, p. B6.
Melinda Gipson, “Playing the Game to Win.” Presstime, July/August 2002. Web site:http://www.naa.org/Presstime/PTArtPage.cfm?AID=4409.
Mark Glaser, “Best Coverage of the US Elections.” Online Journalism Review, December 11, 2003. Web site:http://www.ojr.org/ojr/glaser/1071184205.php.
Mark Glaser, “CBSNews.com trying to win as tortoise in online news race.” Online Journalism Review, August 12, 2003.Web site: http://www.ojr.org/ojr/glaser/1060727744.php.
Mark Glaser, “Journal Takes Broader View of Circulation with Online Inclusion.” Online Journalism Review, November 11,2003. Web site: http://www.ojr.org/ojr/glaser/1068601595.php.
Thomas C. Greene, “Clear Channelization of America to commence Monday.” The Register (U.K.), May 29, 2003.
Marc Gunther, “The transformation of network news.” Nieman Reports, Summer 1999, pp. 2032. Web site:http://www.nieman.harvard.edu/reports/99SpNRspecial99/NRspecial99.pdf.
return to the top
HHall’s Reports, unpublished data. Web site: http://www.hallsreports.com.
Jesse Hamlin, “NBC declares victory in war’s TV ratings battle.” San Francisco Chronicle, March 22, 2003, p. W2.
“The Harris Case: What Next for Newspapers?” Poynter Online, April 11, 2001. Web site:http://www.poynter.org/content/content_view.asp?id=13025.
Kal Hassan, “WLSTV’s tapeless news upgrade.” Broadcast Engineering, April 1, 2003. Web site:http://broadcastengineering.com/ar/broadcasting_wlstvs_tapeless_news/.
John Heilemann, “The digital TV giveaway.” Wired.com, April 25, 1997.
Kelly Heyboer, “Cable clash.” American Journalism Review, June 2000. Web site: http://www.ajr.org/Article.asp?id=410.
John M. Higgins, “Big four look small in the margin column.” Broadcasting & Cable, June 30, 2003.
“Hispanic Television Network Wins Case.” Philadelphia Business Journal, March 25, 2002.
The Hispanic Yearbook, 2003 edition. Web site: http://www.hispanicyearbook.com.
Richard Huff, “Even minus Brown, CNN led cable ratings Sat.” The New York Daily News, February 5, 2003.
return to the top
IInsite Research. “Television Audience Survey: Local Television News.” Published October, 1999. Web site:http://www.tvsurveys.com.
return to the top
JJack Myers Report, “Advertising Expenditures History and Forecast, 19982006.” Web site: http://www.jackmyers.com.
Magazine Publishers Association. “Financial Review of Consumer Magazines 2001.” Web site: http://www.magazine.org.
Magazine Publishers Association. “Publisher’s Information Bureau statements,” 1980 through 2002. Web site:http://www.magazine.org/Advertising_and_PIB/PIB_Revenue_and_Pages/.
MagnaGlobal USA. “Media insights: Daypart briefings.” Published December 12, 2003. Authors: Lisa Quan andStephanie Spady. Web site: http://www.magnaglobal.com.
“Market has yet to meet demand.” Electronic Media, November 25, 2002
“Mergers and Acquisitions.” Encyclopedia of Television. Web site:http://www.museum.tv/archives/etv/M/htmlM/mergersanda/mergersanda.htm.
Diane Mermigas, “HearstArgyle aims for new biz opps.” TV Week, September 15, 2003.
Merrill Lynch, “Newspaper Industry Primer, 7th Edition.” Author: Lauren Rich Fine. Published July 9, 2003. Web site:http://www.ml.com.
Lawrie Mifflin, “Big 3 networks forced to revise newsgathering methods.” The New York Times, October 12, 1998.
Dave Morgan, “News Web Sites: A Future Waiting to Happen.” Editor and Publisher, December 18, 2003
“Morning news wars.” The NewsHour with Jim Lehrer. PBS, October 29, 1999. Web site:http://www.pbs.org/newshour/media/morningnews/morningnews_1029.html.
“Morning television programs.” Encyclopedia of Television. Web site:http://www.museum.tv/archives/etv/M/htmlM/morningtelev/morningtelev.htm.
Morton Research (Silver Spring, Md.). “Newspaper Segment Data.”
Lucia Moses, “Help Wanting.” Editorandpublisher.com, December 8, 2003.
“MSNBC.com tightens purse strings.” Reuters, December 3, 2001
return to the top
NProfessor Philip Napoli, Fordham University (Bronx, N.Y.), unpublished data.
National Association of Broadcasters. “Radio News Survey.” Published Dec. 30, 2002.
National Association of Broadcasters/Zogby International Survey. “Americans Love Their Radio.” Published Oct. 6, 2003.
National Newspaper Publisher Association. “Advertising on the BlackPressUSA.com Network.” Web site:http://www.nnpa.org/news/media/pdfs/220.pdf
National Newspaper Publisher Association. “NNPA Media Services.” Web site:http://www.nnpa.org/News/article/article.asp?sID=24
“NBC announces layoffs at MSNBC.com.” Marketplace. Minnesota Public Radio, December 4, 2001.
NBC. “NBC overview.” Presentation by Randy Falco, September 19, 2003. Web site:http://www.ge.com/files/usa/company/investor/downloads/091903_nbc_handout.pdf.
NBC. “NBC update.” Presentation by Bob Wright, August 1, 2003. Web site:http://www.ge.com/files/usa/company/investor/downloads/ nbc_update_bofa_080103.pdf
New California Media/Bendixen & Associates. “Post9/11 Public Opinion Research Survey.” Published July/August 2002.
New York Times Co. “SEC 10K Filing.” SEC filing, February 24, 2003.
New York Times Co. “SEC Quarterly Report.” SEC filing, November 5, 2003.
News Corp., “Testimony of Rupert Murdoch before the Committee on the Judiciary.” Testimony, May 8, 2003.
News Media Yellow Book, Autumn 2003. New York: Leadership Directories, 2003.
NewsLab. “Bringing viewers back to local TV: What could reverse the ratings slide?” Authors: Deborah Potter and WalterGantz. Web site: http://www.newslab.org/research/bringback.htm
“Newsmagazines woo viewers as mustsee TV drama.” Christian Science Monitor, February 20, 1998.
Newsweek, staff box, July 14, 2003.
Newsweek, staff box, October 3, 1983.
Newspaper Association of America. “Quarterly Newspaper Advertising Expenditures.” Web site: www.naa.org.
Nielsen Media Research, unpublished data. Web site: http://www.nielsenmedia.com.
Nielsen Media Research. “Hispanic Weekly Television Usage: Primetime.” Web site:http://www.nielsenmedia.com/ethnicmeasure/hispanicamerican/hispprimetime.html.
Nielsen//NetRatings. “American Web Surfers Boost Traffic to Foreign News Sites in March,” press release, April 24,2003.
Nielsen//NetRatings. “RoundtheClock News Coverage of the War in Iraq Draws Surfers Online,” press release, March27, 2003.
Nielsen//NetRatings, “Top 20 News and Current Events Sites” data, Editor and Publisher Online.
NYTimes.com. “Surround Sessions.” Online presentation, 2002. Web site:http://www.nytimes.com/ads/marketing/surroundsessions/
“NYTimes.com’s Paid News Tracker Service Surpasses 20,000 Subscribers.” Business Wire, August 7, 2003.
Stefanie Olsen, “Ballmer: Would not launch MSNBC again.” CNET News, June 7, 2001.
“On the road to irrelevance.” Columbia Journalism Review, Nov./Dec. 2002. Web site:http://www.journalism.org/resources/research/reports/localTV/2002/irrelevance.asp
Online News Association. “Digital Journalism Credibility Study.” Published 2002. Web site:http://www.journalists.org/Programs/credibility_study.pdf.
Online Publishers Association. “At Work Internet Audience Media Consumption Study.” Published May 2003.
Online Publishers Association. “Quality Online Content Providers Show Substantial Third Quarter and YeartoDate AdRevenue Growth.” Press release, November 20, 2003.
Kathleen O’Steen, “Tech wizardry controls network.” TV Week, September 22, 2003.
Steve Outing, “News is Really Continuous at washingtonpost.com.” Editorandpublisher.com, January 14, 2004.
Steve Outing, “Stop the Presses!” Editor and Publisher, January 27, 2003.
return to the top
PParamount Market Publishing. “Marketing to Latinos: A Guide to the InCulture Approach.”
James Peltz, “G.E. Would Gain Risk With Assets.” Los Angeles Times, September 3, 2003, page C 1.
Perseus Development Corporation. “The Blogging Iceberg: Of 4.12 Million Hosted Weblogs, Most Little Seen, QuicklyAbandoned.” White paper, 2003. Web site: http://www.perseusdevelopment.com/blogsurvey/thebloggingiceberg.html.
Pew Internet and American Life Project, tracking surveys. Web site: http://www.pewinternet.org.
Pew Internet and American Life Project. “The Internet and the Iraq War.” Published April 1, 2003. Web site:http://www.pewinternet.org/reports/toc.asp?Report=87.
Pew Internet and American Life Project. “Counting on the Internet.” Published December 29, 2002. Web site:http://www.pewinternet.org/reports/toc.asp?Report=80.
Pew Research Center for the People and the Press. “2002 Believability Survey.” Survey conducted May 816, 2002. Website: http://peoplepress.org/reports/print.php3?PageID=478.
Pew Research Center for the People and the Press. “America’s Place in the World, III.” Survey conducted August 21Sept. 5, 2001. Web site: http://peoplepress.org/reports/print.php3?PageID=35.
Pew Research Center for the People and the Press. “Internet Sapping Broadcast News Audience.” Published June 11,2000. Web site: http://peoplepress.org/reports/display.php3?ReportID=36.
Pew Research Center for the People and the Press. “January 2003 News Interest Index.” Survey conducted January 812,2003. Web site: http://peoplepress.org/reports/print.php3?PageID=669.
Pew Research Center for the People and the Press. “Late March 2003 War Tracking Poll.” Survey conducted March 2027, 2003. Web site: http://peoplepress.org/reports/print.php3?PageID=692.
Pew Research Center for the People and the Press. “Media Attitudes, Youth Engagement, Religion After 9/11.” Surveyconducted November 1319, 2001. Web site: http://peoplepress.org/reports/print.php3?PageID=14.
Pew Research Center for the People and the Press. “News media’s improved image proves short lived.” PublishedAugust 4, 2002. Web site: http://peoplepress.org/reports/display.php3?ReportID=159.
Pew Research Center for the People and the Press. “October 2003 News Interest Index.” Web site: http://peoplepress.org/reports/print.php3?PageID=748.
Pew Research Center for the People and the Press. “President’s Criticism of Media Resonates, But Iraq Unease Grows.”Published October 21, 2003. Web site: http://peoplepress.org/reports/display.php3?ReportID=195.
Pew Research Center for the People and the Press. “Public’s News Habits Little Changed by September 11.” PublishedJune 9, 2002. Web site: http://peoplepress.org/reports/display.php3?ReportID=156.
Pew Research Center for the People and the Press. “Strong Opposition to Media CrossOwnership Emerges.” PublishedJuly 13, 2003. Web site: http://peoplepress.org/reports/display.php3?ReportID=188.
Pew Research Center for the People and the Press. “Unusually High Interest In Bush’s State Of The Union.” PublishedJanuary 17, 2002. Web site: http://peoplepress.org/reports/display.php3?ReportID=147.
Deborah Potter, “Pessimism rules in TV newsrooms.” Columbia Journalism Review, November/December 2002. Website: http://www.journalism.org/resources/research/reports/localTV/2002/pessimism.asp.
Project for Excellence in Journalism, “Changing Definitions of News,” March 6, 1998. Web site:http://www.journalism.org/resources/research/reports/definitions/frontpage.asp.
Project for Excellence in Journalism. “ePolitics: A study of the 2000 Presidential Campaign on the Internet.” PublishedApril 10, 2000. Web site: http://www.journalism.org/resources/research/reports/campaign2000/epolitics/default.asp.
Project for Excellence in Journalism. “Before and After: How the War on Terrorism Has Changed the News Agenda.”Published November 19, 2001. Web site: http://www.journalism.org/resources/research/reports/agenda/default.asp.
Project for Excellence in Journalism. “Local TV News Project.” Web site:http://www.journalism.org/resources/research/reports/localTV/default.asp.
return to the top
RReadership Institute. “Characteristics of Subscribers, SingleCopy Buyers and Passalongs.” Published January 2003. Website: http://readership.org/consumers/data/RI_subscribers.pdf.
Readership Institute. “U.S. Daily Readership during the War with Iraq.” Published May 2003. Web site:http://readership.org/consumers/data/FINAL_war_study.pdf.
Richard K. Miller and Associates. The 2002 Entertainment, Media and Advertising Handbook.
David Riffe, S. Lacy, & F. Fico. Analyzing media messages using quantitative content analysis in research. Mahwah, NewJersey: Laurence Erlbaum, 1988
J. Max Robins, “Wins of War.” TV Guide, April 7, 2003.
“Roger’s balancing act.” Broadcasting & Cable, October 27, 2003.
Allison Romano, “Wish you were younger? So do many cable nets.” Broadcasting & Cable, August 25, 2003.
Tom Rosenstiel and Bill Kovach, “Why We Need ‘Nightline’.” The Washington Post, March 6, 2002, A19
RadioTelevision News Directors Association (RTNDA). “RTNDA/Ball State University Annual Survey,” 1997 through2003. Web site: http://www.rtnda.org/research/research.shtml.
RadioTelevision News Directors Foundation (RTNDF). “2003 Local Television News Study of News Directors and theAmerican Public.” Web site: http://www.rtndf.org/ethics/2003survey.pdf.
RadioTelevision News Directors Foundation. “The American Radio News Audience Survey.” Published 2000. Web site:http://www.rtndf.org/radio/.
John Russial, “Pagination in the Newsroom: A Question of Time.” Newspaper Research Journal, Winter 1994, p. 91101.
Jim Rutenberg, “Suffering News Burnout? Rest of America Is, Too.” New York Times, August 11, 2003.
return to the top
SScarborough Research, unpublished data. Web site: http://www.scarborough.com.
Brad Schultz, “Digital TV conversion still mired in uncertainty.” RTNDA Communicator, April 2003.
Vivek Shankar, “Reporters, readers get new ways to publish and read.” Online News Association, November 15, 2003.
Michael Starr, “Two new Fox channels,” The New York Post, October 2, 2003.
Carl Sullivan, “More Publishers Try AllPaid Web Model,” Editor and Publisher, January 23, 2003.
return to the top
TTime, staff box, April 28, 2003.
Time, staff box, October 3, 1983.
TNS Media Intelligence/CMR, unpublished data. Web site: http://www.tnsmicmr.com.
“Too Little Too Late,” The Economist, May 17, 2003.
Andrew Tyndall, ADT Research (New York, N.Y.), unpublished data. Web site: http://www.tyndallreport.com.
“Tyndall Report,” February 22, 2003. Web site: http://www.tyndallreport.com/tw0308.html.
“Tyndall Report,” March 1, 2003. Web site: http://www.tyndallreport.com/tw0309.html.
return to the top
UU.S. Bureau of the Census.
U.S. Bureau of the Census. “Race and Hispanic Origin 1790 to 1990.” Web site: http://factfinder.census.gov.
U.S. Bureau of the Census. “Twenty Languages Most Frequently Spoken at Home by English Ability for the Population 5Years and Over: 1990 and 2000.” Web site: http://factfinder.census.gov.
U.S. Bureau of the Census: “Race and Hispanic or Latino: 2000.” Web site: http://factfinder.census.gov.
U.S. Bureau of the Census. “A Nation on the Move.” Published 2003.
U.S. Bureau of Transportation Statistics.
U.S. Federal Highway Administration. “Journey to Work Trends in the United States and Its Major Metropolitan Areas,19601990.” Published November 1993. Web site: http://www.itsdocs.fhwa.dot.gov/jpodocs/repts_te/6@w01!.pdf.
U.S. General Accounting Office (GAO). “Additional Federal Efforts Could Help Advance Digital Television Transition.”GAO Reports, November 8, 2002. Web site: http://www.gao.gov/new.items/d037.pdf.
UCLA Center for Communication Policy. ”The UCLA Internet Report – Surveying the Digital Future.” Published January2003.
Univision. “Nielsen 2003 Universe Estimates.”
Lou Ureneck, “Newspapers arrive at economic crossroads.” Nieman Reports, Summer 1999, pp. 319. Web site:http://www.nieman.harvard.edu/reports/99SpNRspecial99/NRspecial99.pdf.
return to the top
VVeronis Suhler Stevenson. “Communications Industry Forecast.” Published July 2002.
“Viacom, CBS merger gets OK.” USA Today, May 4, 2000.
return to the top
WElizabeth Weinreb, “The News About News Magazines,” unpublished essay.
Erik Wemple, “Web Spinning.” Washington Citypaper, July 4, 2003.
BIG STORY/RECURRING LEAD % % % % % %All Big Stories 23 47 31 22 23 16All IraqRelated Big Stories 10 23 14 10 10 7All Other Intl. Big Stories 2 6 3 2 3 2All U.S. Based Big Stories 10 18 13 10 10 8Not a Big Story 77 53 69 78 77 84
TOP SPECIFIC BIG STORIESPreWar Activities 2 5 3 3 2 1Combat Ops. (Not Jessica Lynch) 3 5 3 2 3 1PostWar Military Activities 2 3 1 2 2 2Struggle to Rebuild Iraq 2 5 3 2 1 1States Face Budget Crises 2 3 2 2 3 2
BIG STORY/RECURRING LEAD % % % % % %All Big Stories 28 49 34 23 28 21All IraqRelated Big Stories 13 24 16 11 13 8All Other Intl. Big Stories 3 6 4 1 3 2All U.S. Based Big Stories 12 19 14 11 12 10Not a Big Story 72 51 66 77 72 79
BIG STORY/RECURRING LEAD % % % % %All Big Stories 59 62 57 60 54All IraqRelated Big Stories 19 22 19 21 13All Other Intl. Big Stories 10 12 14 9 6All U.S. Based Big Stories 29 29 24 30 35Not a Big Stories/Recurring Lead 41 38 43 40 46
STORY FRESHNESS % % % % %Package/Story/Interview – Exact Replay 21 0 26 28 31Repeat Story – No Substantive, New Information 14 0 20 15 21Repeat Story – New Angle Added, W/OUT New Information 2 0 4 2 2Repeat storyline – WITH Substantive, New Information 14 0 16 19 21New Story, First Appearance 49 100 34 36 25
VIDEO LINK % % % % %No Link 68 67 69 64 70Link Presented 32 33 31 36 30
AUDIO LINK % % % % %No Link 98 97 98 98 98Link Presented 2 3 2 2 2
PHOTO ESSAY/GALLERY LINK % % % % %No Link 64 61 63 65 67Link Presented 36 39 37 35 33
GRAPHIC/MAP LINK % % % % %No Link 84 84 82 83 86Link Presented 16 16 18 17 14
ARCHIVE/RELATED STORIES LINK % % % % %No Link 26 32 25 22 25Link Presented 74 68 75 78 75
FEEDBACK/CHAT LINK % % % % %No Link 60 59 59 61 60Link Presented 40 41 41 39 40
EXTERNAL SITE LINK % % % % %No Link 67 67 67 69 67Link Presented 33 33 33 31 33
*NOTE: Due to rounding, totals may not equal 100%.Due to sample dates, Internet comparisons to other media in the study are limited.
BIG STORY/RECURRING LEAD % % % % %All Big Stories 49 51 51 53 46All IraqRelated Big Stories 24 29 27 33 18All Other Intl. Big Stories 7 8 8 8 5All U.S. Based Big Stories 18 15 16 12 23Not A Big Story 51 49 49 47 54
PROTAGONIST % % % % %All Individual Protagonist 33 22 23 20 48President Bush (Singled Out As anIndividual)
BIG STORY/RECURRING LEAD % % % % %All Big Stories 49 54 52 47 43All IraqRelated Big Stories 20 26 21 16 14All Other Intl. Big Stories 7 9 7 6 7All U.S. Based Big Stories 23 19 23 24 22Not A Big Story 51 46 48 53 57
PROTAGONIST % % % % %All Individual Protagonist 34 30 31 36 43President Bush (Singled Out As an Individual) 1 1 1 1 1Other Individual Protagonist (nonBush) 32 29 30 36 42No Individual Protagonist 66 71 69 65 56
BIG STORY/RECURRING LEAD % % % % %All Big Stories 59 54 61 56 59All IraqRelated Big Stories 22 27 26 20 14All Other Intl. Big Stories 8 10 8 8 6All U.S. Based Big Stories 29 17 28 28 40Not a Big Story 41 46 39 44 41
TOTALTIMEFRAME %PreIraq Combat Operations (January 1 to February 15) 0LeadUp to Iraq Combat (February 16 to March 16) 26Iraq Combat Operations (March 17 to May 1) 21PostCombat Operations (May 2 to October 6) 53
PLACEMENT %Cover Story 15Inside Story 85
STORY LENGTH %100 Words or Less 5101500 Words 465011000 Words 31Above 1000 Words 19
STORY ORIGINATION %Staff Reported 98Wire – Unaffiliated 1Other 2
Other 2
BIG STORY/RECURRING LEAD %All Big Stories 36All IraqRelated Big Stories 22All Other Intl. Big Stories 3All U.S. Based Big Stories 11Not a Big Story 64
PROTAGONIST %All Single Protagonist 27All Institutional Protagonist 9No Protagonist 64
STORY TOPIC %ALL GOVERNMENT 11Exec. Branch/Admin 3Nat’l/State/Local (Legislation or Institution) 1Government Agencies *Law/Courts 3Campaigns/Elections 4DEFENSE 1.ALL DOMESTIC AFFAIRS 11Disease/Public Health 3Education *Environment *Health Care System 1Transportation *Terrorist Acts *Terrorism – Prevention Efforts 4Domestic Affairs Other 3BUSINESS / COMMERCE 9CRIME 1ALL FOREIGN AFFAIRS 18Foreign AffairsDiplomacy 4Foreign AffairsMilitary Activities 14ALL ACCIDENTS / DISASTERS 2Accidents (no intent) *Unusual Weather 0Catastrophes/Disasters (no intent) 2SCIENCE/TECHNOLOGY 7Science 3Medical Research 2Technology 2
STORY TOPIC BY REGION %All Local/Metro 1All Regional 1All National 67All U.S.Related International 27All NonU.S. Related International 4
SOURCING: NAME/TITLE WITH RELATIONSHIP %None 25One to Three 47Four or More 28
SOURCING: UNNAMED/UNTITLEDWITH RELATIONSHIP EXPLAINED %None 80One to Three 14Four or More 6
SOURCING: UNNAMED/NO EXPLANATIONOF RELATIONSHIP %None 99One to Three 1
Four or More 0
Four or More 0
BY VOLUMETotal N =333,768 Words
STORY ORIGINATION %Staff Reported 97Wire – Unaffiliated *Other 2
BIG STORY/RECURRING LEAD %All Big Stories 45All IraqRelated Big Stories 32All Other Intl. Big Stories 3All U.S. Based Big Stories 11Not a Big Story 55
STORY TOPIC %ALL GOVERNMENT 9Exec. Branch/Admin 3Nat’l/State/Local (Legislation or Institution) 1Government Agencies *Law/Courts 2Campaigns/Elections 3DEFENSE 1ALL DOMESTIC AFFAIRS 10Disease/Public Health 2Education *Environment 1Health Care System 1Transportation *Terrorist Acts 1Terrorism – Prevention Efforts 3Domestic Affairs Other 2BUSINESS / COMMERCE 9CRIME 1ALL FOREIGN AFFAIRS 29Foreign AffairsDiplomacy 5Foreign AffairsMilitary Activities 24ALL ACCIDENTS / DISASTERS 3Accidents (no intent) *Unusual Weather 0Catastrophes/Disasters (no intent) 3SCIENCE/TECHNOLOGY 9