88
OBESITY: WHICH DIET IS BEST? Ronen Gurfinkel, PGY4 May 30, 2012
| Date post: | 23-Dec-2015 |
| Category: |
Documents |
| Upload: | chad-warner |
| View: | 219 times |
| Download: | 2 times |

OBESITY: WHICH DIET IS BEST?Ronen Gurfinkel, PGY4
May 30, 2012

Objectives• Review the background of commonly used diets in
overweight and obese patients• Review the literature behind commonly used diets

Background• Obesity
• Risk factor for:• Cardiovascular disease• Hypertension• Type 2 diabetes• Cancer
• Associated with• Sleep apnea• Osteoarthritis• Reduced quality of life

CMAJ 2007

Background• Epidemiology
• Second most preventable cause of death• 66% of adults in U.S. are either overweight or obese


Background• Benefits of weight-loss
• Decreased risk of obesity-related diseases• Decreased risk of mortality

Weight-loss• Done by creating a negative energy balance
• Reduction of 500 kcal per day less than what is required to maintain current body weight
• Should lead to loss of 0.45 kg (1 lb) per week
• Successful weight-loss• 5% reduction in initial body weight• Maintained for at least 1 year

Weight-loss• Weight-loss therapies
• Dietary intervention• Exercise programs• Psychotherapy• Pharmacotherapy• Surgery


Diets• Commonly used dietary interventions:
• Low-carbohydrate• Low-fat• Low-calorie
• Other diets:• Glycemic index diet

Low-carbohydrate Diets• Restrict caloric intake by reducing consumption of
carbohydrates300 g/day 20-60 g/day
• Rationale: carb restriction causes liver to convert fat into fatty acids and ketones (ketosis) decreases hunger
• Popular Low-carb diets• Atkins Diet• Carbohydrate Addict’s Diet• Zone Diet• South Beach Diet

Low-carb Diets
Sherer EL and Sherer JA. JAAPA 2008


Low-fat Diets• Usually restrict fat consumption to less than 10% of total
caloric intake• Encourage consumption of fruits, vegetables, and
complex carbohydrates• Rely on complex carbohydrates and fiber to induce satiety• Rationale: reduced fat leads to reduced calories and thus
a negative energy balance• Popular low-fat diets:
• Ornish Diet• Pritikin Diet

Low-fat Diets
Sherer EL and Sherer JA. JAAPA 2008

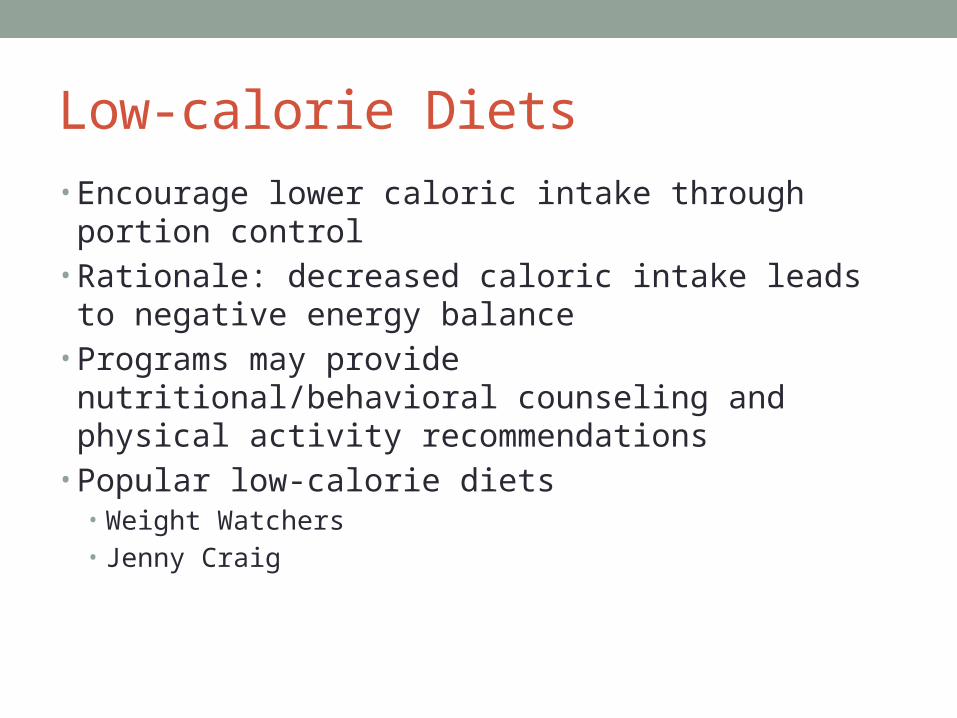
Low-calorie Diets• Encourage lower caloric intake through portion control• Rationale: decreased caloric intake leads to negative
energy balance• Programs may provide nutritional/behavioral counseling
and physical activity recommendations• Popular low-calorie diets
• Weight Watchers• Jenny Craig

Low-calorie Diets
Sherer EL and Sherer JA. JAAPA 2008

Weight Watchers


Which Diet is Best?• High-protein/low-carb vs high-carb/low-fat
• Some studies show high-protein/low-carb better• Other studies show no difference
• Very-high-carb/very-low-fat vegetarian diet• Better than conventional high-carb/low-fat
• Low-carb vs low-fat• Low-carb better in one study (Shai et al, 2008)
• High-protein vs low-protein• No difference in one study (Due et al, 2004)


Dansinger et al, JAMA 2005• Objective:
• Assess adherence rates and effectiveness of 4 popular diets for weight loss and cardiac risk factor reduction

Dansinger et al, JAMA 2005• Design:
• Single-center (academic) • Randomized trial• Single blinded
• Power:• 40 participants in each group needed to achieve 80% power to detect
weight change 2% from baseline or 3% between diets
• Analysis:• Intent-to-treat: missing data replaced with baseline data• Completers analysis: Missing data excluded
• Participants:• Adults age 22-72• Overweight or obese (BMI 27-42)• Known hypertension, dyslipidemia, or fasting hyperglycemia
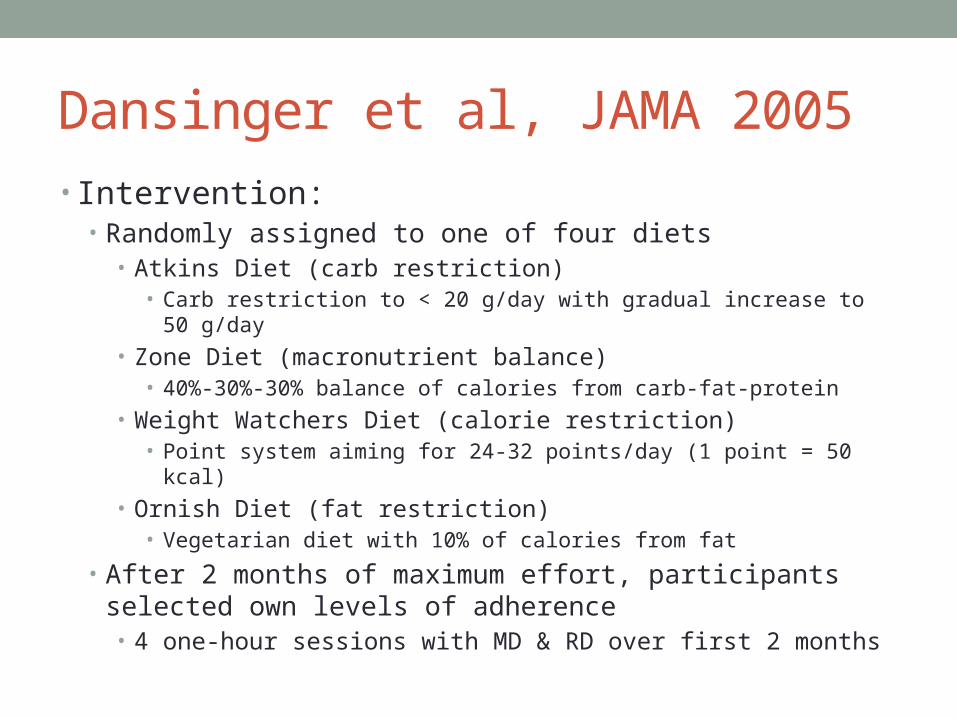
Dansinger et al, JAMA 2005• Intervention:
• Randomly assigned to one of four diets• Atkins Diet (carb restriction)
• Carb restriction to < 20 g/day with gradual increase to 50 g/day
• Zone Diet (macronutrient balance)• 40%-30%-30% balance of calories from carb-fat-protein
• Weight Watchers Diet (calorie restriction)• Point system aiming for 24-32 points/day (1 point = 50 kcal)
• Ornish Diet (fat restriction)• Vegetarian diet with 10% of calories from fat
• After 2 months of maximum effort, participants selected own levels of adherence• 4 one-hour sessions with MD & RD over first 2 months

Dansinger et al, JAMA 2005• Other recommendations:
• Multivitamin• 60 minutes of exercise weekly• Avoid commercial support services

Dansinger et al, JAMA 2005• Main Outcome:
• One-year changes in baseline weight and cardiac risk factors• Measured at baseline, 2, 6, and 12 months
• Self-selected dietary adherence rates per self-report• 3-day food records at 1, 2, 6, and 12-months• Monthly telephone contact for self-rated adherence over past 30 days
using 10 point scale


Dansinger et al, JAMA 2005• Results
• No difference between calories or macronutrients at baseline• Mean total energy intake 2059 calories


Dansinger et al, JAMA 2005• Results
• Calorie reduction from baseline at 1 year: (P< 0.05 for each, P= 0.70 between diets)• Atkins: -138• Zone: -251• Weight Watchers: -244• Ornish: -192


Dansinger et al, JAMA 2005• Results
• Weight loss at 1 year• Modest weight loss was statistically significant for each diet
• 25% had weight loss of 5% of initial body weight• 10% had weight loss of 10% of initial body weight
• Similar weight loss across all 4 diets (P=0.40)
• Results by gender• Women: weight loss 2.4 kg, waist circumference 2.3 cm• Men: weight loss 3.3 kg, waist circumference 3.1 cm
• Self-reported adherence strongly associated with weight loss• Top tertile of adherence lost 7% of initial body weight

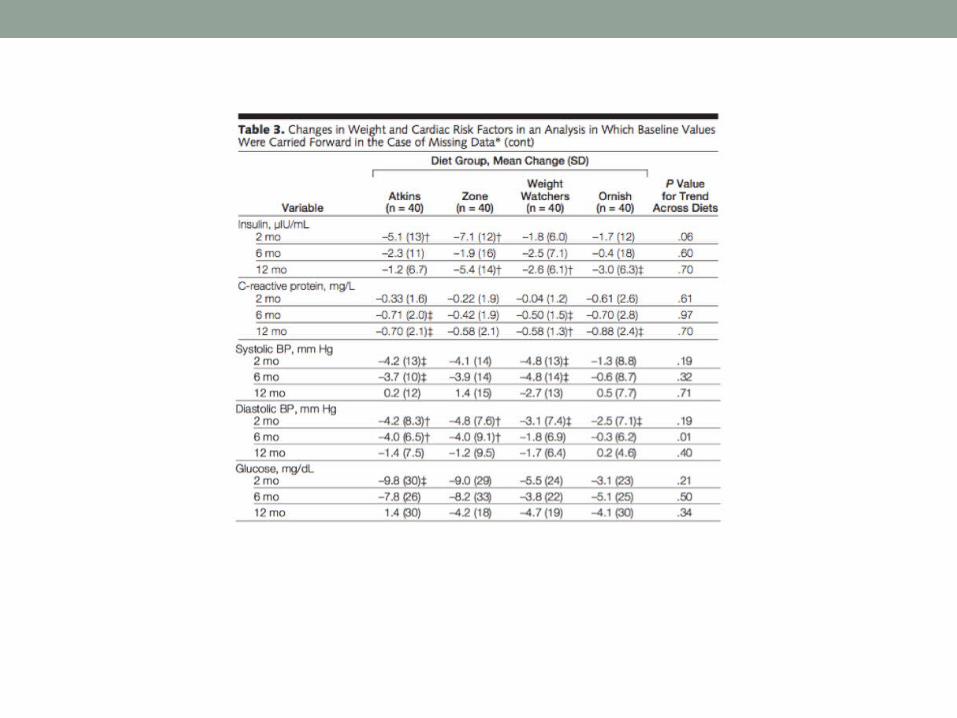
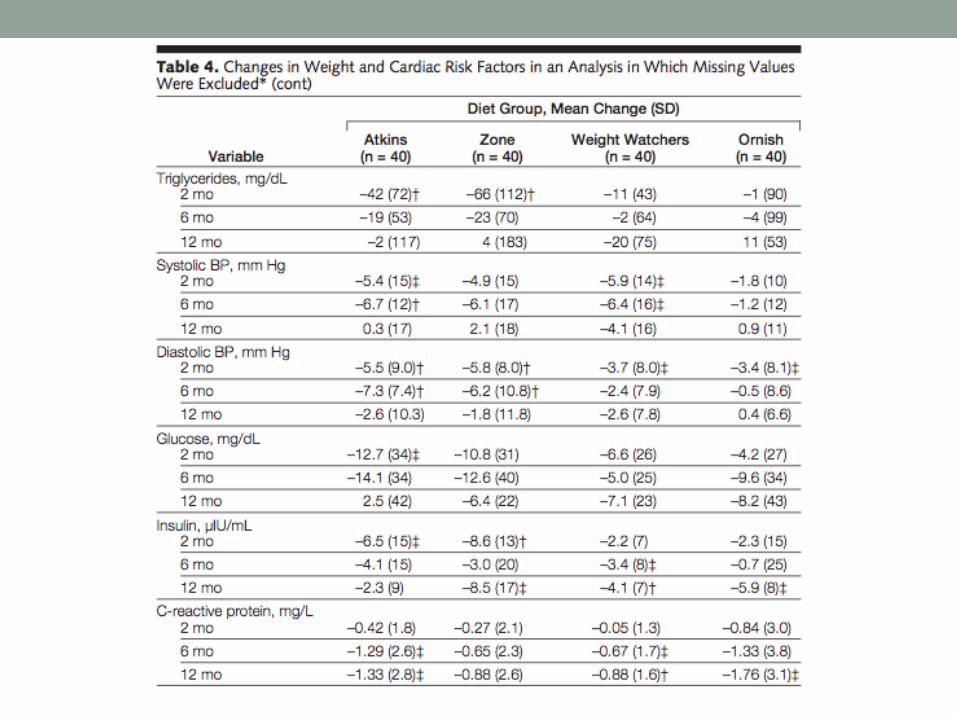
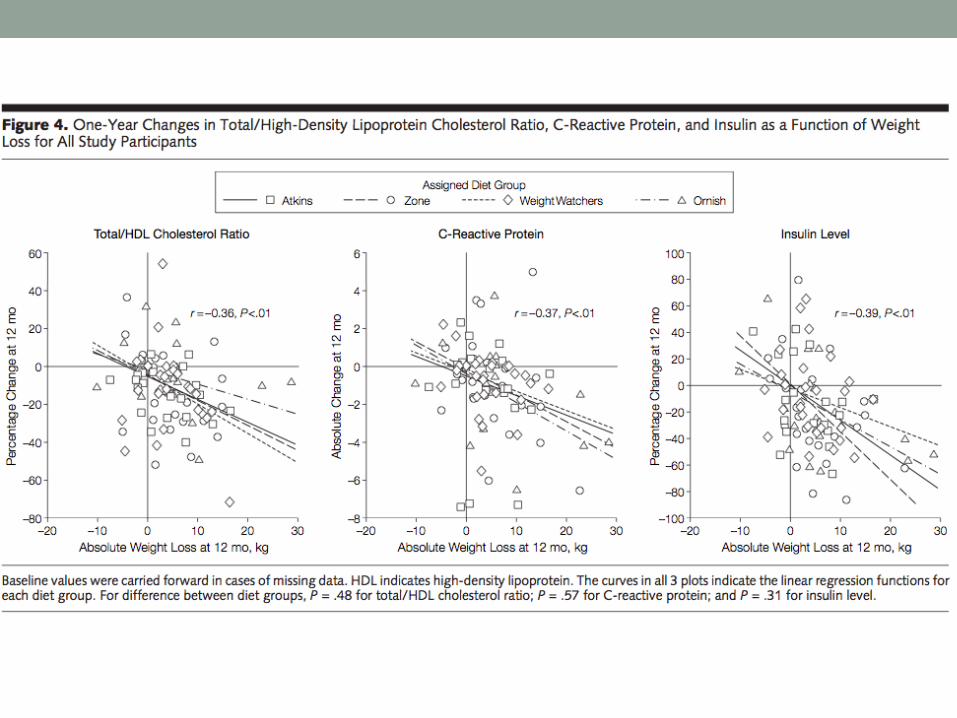
Dansinger et al, JAMA 2005• Results
• All diets lead to some improvement in cardiac risk factors at 1 year (intent-to-treat)• Reduced LDL cholesterol (except Atkins)• Increased HDL cholesterol (except Ornish)• No change in triglycerides, BP, fasting glucose• Reduced CRP (except Zone)
• Similar (but larger changes) seen in completers analysis• Amount of weight loss predicted the amount of improvement in
some of the cardiac risk factors


Dansinger et al, JAMA 2005• Results
• Adherence decreased with time, to similar extent in all groups• At 1 year, 25% of participants in each group had self-reported
adherence 6/10


Dansinger et al, JAMA 2005• Discontinuation rates at 1 year:
• Ornish – 50%• Atkins – 48%• Zone – 35%• Weight Watchers – 35%
• Reasons for discontinuation:• Diet too hard to follow• Diet not yielding enough weight loss

Dansinger et al, JAMA 2005• Conclusions
• Each popular diet modestly reduced body weight and several cardiac risk factors at 1 year
• Overall dietary adherence rates were low, although increased adherence was associated with greater weight loss and cardiac risk factor reductions for each diet group


Sacks et al, NEJM 2009• Objective:
• Compare effects of 3 principal dietary macronutrients over longer period (and with fewer limitations) than previous trials

Sacks et al, NEJM 2009• Design:
• 2 centers • Randomized trial• Double blinded
• Power:• Powered to detect 1.67 kg weight loss
• Analysis:• Intent-to-treat: withdrawals after 6 months included, assumed weight
re-gain 0.3kg/month, waist circumference regain 0.3cm/month
• Participants:• Age 30-70• Overweight or obese (BMI 25-40)• Excluded DM, unstable CV disease, medications causing weight gain,
insufficient motivation

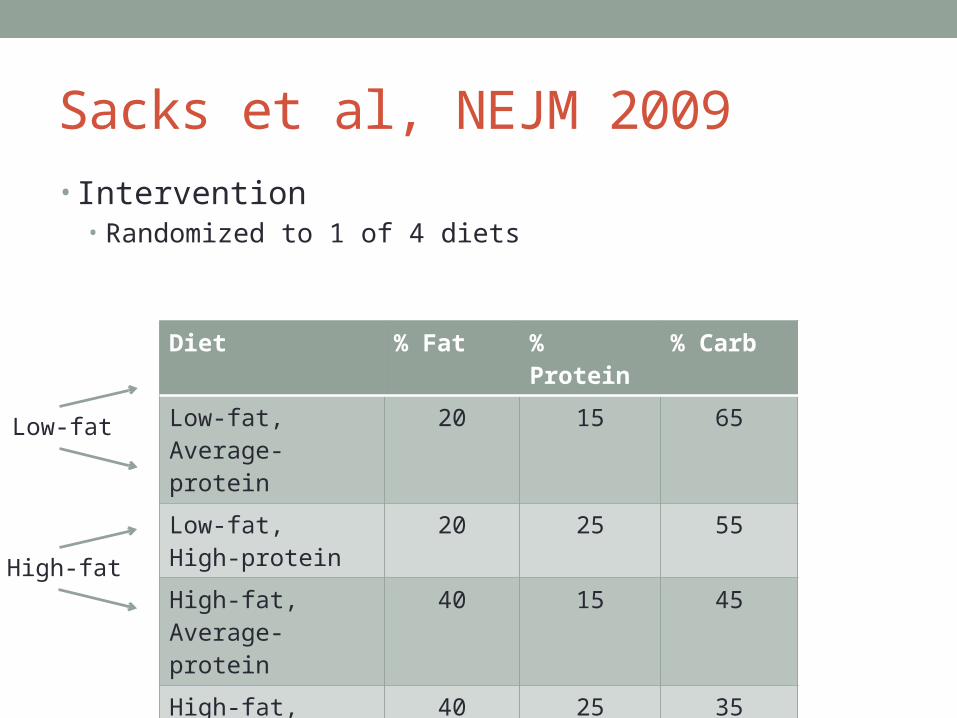
Sacks et al, NEJM 2009• Intervention
• Randomized to 1 of 4 diets
Diet % Fat % Protein % Carb
Low-fat,Average-protein
20 15 65
Low-fat,High-protein
20 25 55
High-fat,Average-protein
40 15 45
High-fat,High-protein
40 25 35
Sacks et al, NEJM 2009• Intervention
• Randomized to 1 of 4 diets
Diet % Fat % Protein % Carb
Low-fat,Average-protein
20 15 65
Low-fat,High-protein
20 25 55
High-fat,Average-protein
40 15 45
High-fat,High-protein
40 25 35
Low-fat
High-fat

Sacks et al, NEJM 2009• Intervention
• Randomized to 1 of 4 diets
Diet % Fat % Protein % Carb
Low-fat,Average-protein
20 15 65
Low-fat,High-protein
20 25 55
High-fat,Average-protein
40 15 45
High-fat,High-protein
40 25 35
Low-fat
High-fat
High-proteinAverage-protein

Sacks et al, NEJM 2009• Intervention
• Randomized to 1 of 4 diets
Diet % Fat % Protein % Carb
Low-fat,Average-protein
20 15 65
Low-fat,High-protein
20 25 55
High-fat,Average-protein
40 15 45
High-fat,High-protein
40 25 35
Low-fat
High-fat
High-proteinAverage-protein
High-carb
Low-carb

Sacks et al, NEJM 2009• Intervention
• Randomized to 1 of 4 diets
Diet % Fat % Protein % Carb
Low-fat,Average-protein
20 15 65
Low-fat,High-protein
20 25 55
High-fat,Average-protein
40 15 45
High-fat,High-protein
40 25 35
Low-fat
High-fat
High-proteinAverage-protein

Sacks et al, NEJM 2009• Primary outcome:
• Change in body weight after 2 years
• Secondary outcome:• Change in waist circumference after 2 years

Sacks et al, NEJM 2009• Other recommendations:
• Saturated fat < 8%• Dietary fiber 20 g/day• Cholesterol < 150 mg per 1000 kcal• Low glycemic index foods• Caloric deficit 750 kcal from baseline• Moderate exercise 90 mins/week

Sacks et al, NEJM 2009• Follow-up
• Group sessions:• First 6 months: weekly, 3 of 4 weeks• After 6 months: weekly, 2 of 4 weeks
• Individual sessions: every 8 weeks• Body weight and weight circumference measured at baseline and
every 6 months

Sacks et al, NEJM 2009• Results
1638 participants screened
811 randomized (50%)
645 completed the study (80%)

Sacks et al, NEJM 2009
NEJM 2009

NEJM 2009
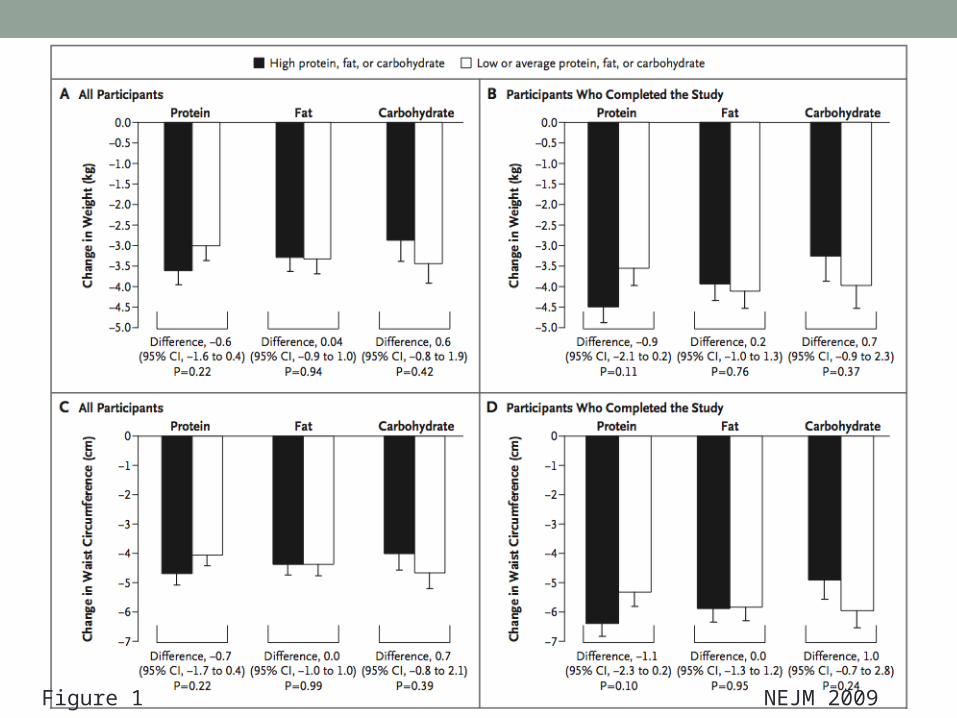
Figure 1 NEJM 2009

Figure 2 NEJM 2009

Sacks et al, NEJM 2009• Results
• Weight loss 5% at 2 years: 31-37%• Weight loss 10% at 2 years: 14-15%
• All diets reduced CV risk factors at 6 months and at 2 years

NEJM 2009

Sacks et al, NEJM 2009• Results (for completers)
• Best LDL decrease• Low-fat diets (5% vs 1%)• Highest-carb diets (6% vs 1%)
• Best HDL increase• Lowest-carb diets (9% vs 6%)
• Triglyceride decrease• Similar in all groups (12-17%)

Sacks et al, NEJM 2009• Results (for completers)
• Fasting insulin decrease• Not seen with highest-carb diet• High-protein diet better (10% vs 4%, p=0.07)
• Blood pressure decrease• Similar in all groups (1-2 mm Hg)
• Metabolic syndrome presence• Similar in all groups (32% 19-22%)

Sacks et al, NEJM 2009• Results (intention-to-treat)
• Effect was about 30-40% smaller
• Mean macronutrient intake did not reach target levels in all groups
• Serious adverse events in 7%

Sacks et al, NEJM 2009• Conclusion:
• Reduced-calorie diets result in clinically meaningful weight loss regardless of which macronutrients they emphasize

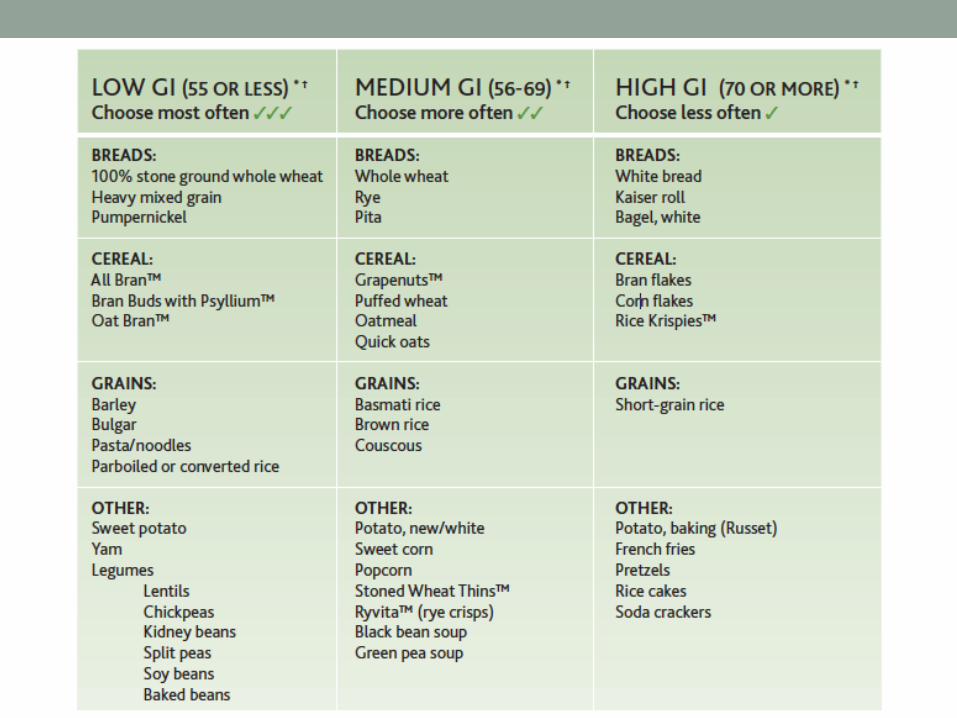
Glycemic Index - Background• Glycemic index (GI) reflects type/quality of carbs in food,
and how this food reacts metabolically• Ranks how much a carb-rich foods will increase blood
sugar levels• Equals to additional area under the blood glucose
response curve expressed as percent of response to a standard food (glucose or white bread)

Glycemic Index - Background

Glycemic Index - Background• Low GI diet may have benefit on:
• Body weight and composition• CV risk factors
* Evidence is controversial
Thomas TE, Elliott EJ, Baur J. Cochrane Database Syst Rev 2007


Larsen et al, NEJM 2010• Objective:
• Assess efficacy of moderate-fat diets that vary in protein content and glycemic index for preventing weight gain and obesity risk factors after weight loss
• Diogenes (Diet, Obesity, and Genes) study
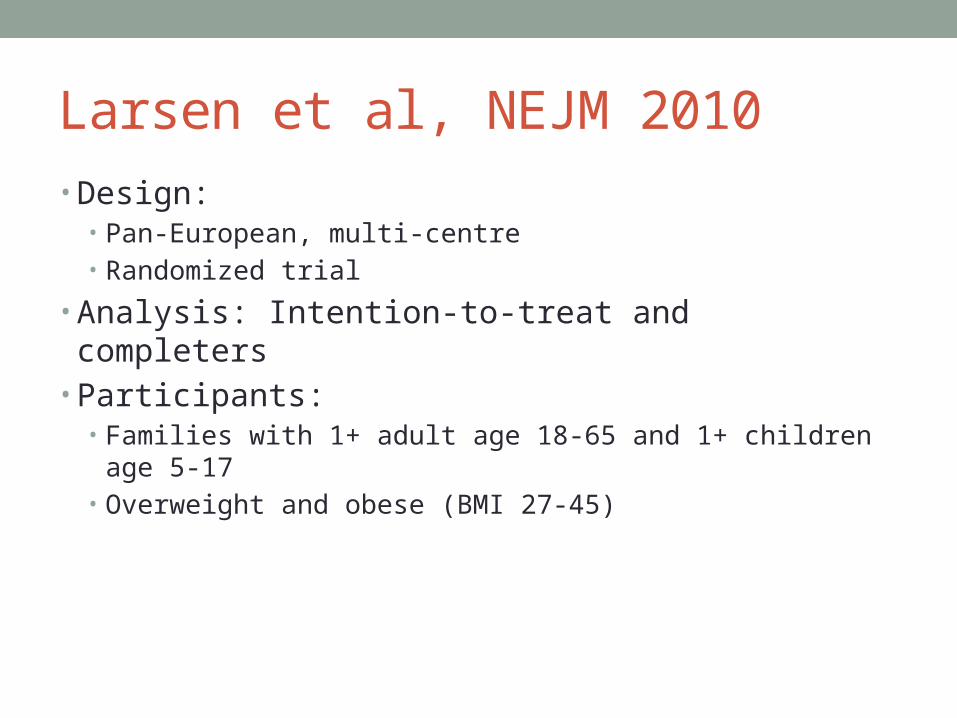
Larsen et al, NEJM 2010• Design:
• Pan-European, multi-centre• Randomized trial
• Analysis: Intention-to-treat and completers• Participants:
• Families with 1+ adult age 18-65 and 1+ children age 5-17• Overweight and obese (BMI 27-45)

Larsen et al, NEJM 2010• Intervention:
• 8-week low-calorie diet (800 kcal/day)• If achieved weight loss >8%, randomly assigned to 1 of 5 diets
(maintenance) for 26 weeks• Low-protein (13%) + low GI• Low-protein (13%) + high GI• High-protein (25%) + low GI• High-protein (25%) + high GI• Control diet

Larsen et al, NEJM 2010• Follow-up
• Dietary counseling weekly x 6, then monthly


Larsen et al, NEJM 2010• Mean initial weight loss: 11 kg• GI 4.7 units lower in low-GI vs high-GI• Weight regain
• Lower in high-protein diets vs low-protein diets
(0.93 kg difference)• Lower in low-GI diets vs high-GI diets
(0.95 kg difference)
• Further weight loss (> 5%)• More likely in high-protein groups (OR 1.92)• More likely in low-GI groups (OR 2.54)


Larsen et al, NEJM 2010• Completion/Drop-outs
• Overall completion rate 71%• Lower rate in the high-protein diets and low-GI diets (26.4% and
25.6%) vs low-protein/high-GI diet (37.4%)
• Adverse events (serious, n=4)• Abdominal pain• Cholecystectomy

Larsen et al, NEJM 2010• Conclusion:
• Increase in protein and decrease in GI helped maintain weight loss, and was more likely associated with adherence

Take Home Messages• No specific macronutrient regimen has been proven to be
superior• Diets can be tailored to individual preferences• Low glycemic index foods may have • Any type of diet leading to calorie reduction will lead
to weight loss

References• Sherer EL, Sherer JA. Examining the most popular weight
loss diets: How effective are they? JAAPA 2008;• Dansinger et al. Comparison of the Atkins, Ornish, Weight
Watchers, and Zone Diets for Weight Loss and Heart Disease Risk Reduction. JAMA 2005;
• Sacks et al. Comparison of Weight-loss Diets with Different Compositions of Fat, Protein, and Carbohydrates. N Engl J Med 2009;
• Larsen TM, Dalskov S-M, van Baak M, et al. Diets with high or low protein content and glycemic index for weight-loss maintenance. N Engl J Med 2010; 363:2102–2113

Questions?


