Finance and Economics Discussion Series Divisions of Research & Statistics and Monetary Affairs Federal Reserve Board, Washington, D.C. Observing Enforcement: Evidence from Banking Anya Kleymenova, Rimmy E. Tomy 2021-049 Please cite this paper as: Kleymenova, Anya, and Rimmy E. Tomy (2021). “Observing Enforcement: Evidence from Banking,” Finance and Economics Discussion Series 2021-049. Washington: Board of Gov- ernors of the Federal Reserve System, https://doi.org/10.17016/FEDS.2021.049. NOTE: Staff working papers in the Finance and Economics Discussion Series (FEDS) are preliminary materials circulated to stimulate discussion and critical comment. The analysis and conclusions set forth are those of the authors and do not indicate concurrence by other members of the research staff or the Board of Governors. References in publications to the Finance and Economics Discussion Series (other than acknowledgement) should be cleared with the author(s) to protect the tentative character of these papers.
Transcript
Finance and Economics Discussion SeriesDivisions of Research & Statistics and Monetary Affairs
Federal Reserve Board, Washington, D.C.
Observing Enforcement: Evidence from Banking
Anya Kleymenova, Rimmy E. Tomy
2021-049
Please cite this paper as:Kleymenova, Anya, and Rimmy E. Tomy (2021). “Observing Enforcement: Evidence fromBanking,” Finance and Economics Discussion Series 2021-049. Washington: Board of Gov-ernors of the Federal Reserve System, https://doi.org/10.17016/FEDS.2021.049.
NOTE: Staff working papers in the Finance and Economics Discussion Series (FEDS) are preliminarymaterials circulated to stimulate discussion and critical comment. The analysis and conclusions set forthare those of the authors and do not indicate concurrence by other members of the research staff or theBoard of Governors. References in publications to the Finance and Economics Discussion Series (other thanacknowledgement) should be cleared with the author(s) to protect the tentative character of these papers.
Observing Enforcement: Evidence from BankingI
Anya Kleymenova∗, Rimmy E. Tomy∗∗
July 27, 2021
Abstract
This paper finds that the disclosure of supervisory actions is associated with changes inregulators’ enforcement behavior. Using a novel sample of enforcement decisions and orders(EDOs) and the setting of the 1989 Financial Institutions Reform, Recovery, and Enforce-ment Act (FIRREA), which required the public disclosure of EDOs, we find that U.S. bankregulators issue more EDOs, intervene sooner, and rely more on publicly observable signalsafter the disclosure regime change. The content of EDOs also changes, with documentsbecoming more complex and boilerplate. Our results are stronger in counties with highernews circulation, indicating that disclosure plays an incremental role in regulators’ changingbehavior. We evaluate the main potentially confounding changes around FIRREA, includingthe S&L crisis and competition from thrifts, and find robust results. We also study changesin bank outcomes following the regime change and find that uninsured deposits decline atEDO banks, especially for banks with EDOs covered in the news. Finally, we observe thatbank failure accelerates despite improvements in capital ratios and asset quality.
IWe thank Anat Admati, Rich Ashton, Karthik Balakrishnan, Ray Ball, Anne Beatty, Phil Berger, Daniel Bens, Robert Bushman, Nicola
Cetorelli, Hans Christensen, Filippo De Marco (discussant), Doug Diamond, Linda Goldberg, Nargess Golshan (discussant), Yadav Gopalan(discussant), Jason Gonzalez, Joao Granja, Luzi Hail, Beverly Hirtle, Warren Hrung, Kathleen Johnson, Anil Kashyap, Urooj Khan (discussant),Bernard Kim, Ralph Koijen, Tim Kooijmans (discussant), Anna Kovner (discussant), Christian Leuz, Stefan Nagel, Valeri Nikolaev, Kathy Petroni(discussant), Raghuram Rajan, Sugata Roychowdhury (discussant), Thomas Ruchti (discussant), Stephen Ryan, Haresh Sapra, Doug Skinner,Abbie Smith, James Vickery, David Williams, Regina Wittenberg Moerman, and the participants of the seminars at INSEAD, the University ofChicago Accounting Research Workshop, the Federal Reserve Bank of New York, the University of Arizona, UIUC Young Scholars Symposium,the University of Chicago Banking Workshop, London Business School Accounting Symposium, 2019 NBER Summer Institute, Federal ReserveBank of St. Louis/IU Workshop on Financial Institutions, IIMB Accounting Research Conference, 2019 AAA Annual Meeting, the FDIC/JFSR19th Annual Bank Research Conference, Berlin Accounting Workshop 2019, Kellogg School of Management, Frankfurt School of Finance andManagement, 2019 AAA Midwest Region Meeting, USC, 2019 Knut Wicksell Conference on Financial Intermediation, Ohio State University, 2019Sydney Banking and Financial Stability Conference (winner of The Bureau Van Dijk Best Paper Award for Banking), the Federal Reserve Boardof Governors, and 2020 FARS Midyear meeting for their helpful comments and suggestions. The paper also received the 2020 EFA Institutions andMarkets best paper award (sponsored by Oklahoma State University). We are grateful to Byeongchan An, Nobuyuki Furuta, Owen Karpf, JamesKiselik, Diana Saakyan, Michelle Skinner, Nitya Somani, and Jason Yang for excellent research assistance. We gratefully acknowledge the financialsupport of the Fama-Miller Center for Research in Finance and the University of Chicago Booth School of Business. Anya Kleymenova gratefullyacknowledges the support of the FMC Faculty Research Fund at the University of Chicago Booth School of Business. Rimmy E. Tomy gratefullyacknowledges the support of the Kathryn and Grant Swick Faculty Research Fund at the University of Chicago Booth School of Business. Thispaper was previously titled “Regulators’ Disclosure Decisions: Evidence from Bank Enforcement Actions.” The views expressed in this study arethose of the authors and do not necessarily reflect the views of the Federal Reserve Board or the Federal Reserve System.
∗Federal Reserve Board, 20th Street and Constitution Avenue NW, Washington, DC 20551;[email protected]
∗∗Corresponding author: The University of Chicago Booth School of Business, 5807 South WoodlawnAvenue, Chicago, IL 60637; [email protected]
There is now a widespread consensus on the need for regulation, but that still
leaves open the question: even if we have good regulations, how do we ensure that
they will be enforced? How do we prevent regulatory failure?
—Joseph Stiglitz, in “Regulation and Failure” (Stiglitz, 2009)
1. Introduction
We study whether the required disclosure of regulators’ supervisory actions is associated
with changes in their enforcement behavior. This sort of disclosure could either increase
or decrease regulatory strictness. It could increase strictness by impacting regulators’ rep-
utation and credibility. Disclosure increases the costs of forbearance; therefore regulators
concerned about their reputation and career prospects might become stricter when their su-
pervisory actions receive public scrutiny (Holmstrom, 1999). On the other hand, disclosure
might lead regulators to take less aggressive actions. Bank regulators might be concerned
with how disclosing enforcement actions affects financial stability, in particular the likelihood
of bank runs, and reduces risk-sharing opportunities (Diamond & Dybvig, 1983; Goldstein
& Leitner, 2018; He & Manela, 2016; Morris & Shin, 2002). They might also want to ward
off lawsuits from regulated firms and ensure their continued cooperation.1
Although prior literature studies the impact disclosure of supervisory actions has on
regulated entities, limited empirical evidence exists on the effects of disclosure on regulators
because regulators’ actions are generally unobservable in a nondisclosure regime (Anbil,
2018; Docking et al., 1997; Jin & Leslie, 2003; Slovin et al., 1999). We address this empirical
challenge by exploiting the 1989 Financial Institutions Reform, Recovery, and Enforcement
Act (FIRREA), which, among other changes, required U.S. banking regulators to publicly
disclose their enforcement actions against banks.
Enforcement actions (officially referred to as enforcement decisions and orders or EDOs)
1We provide examples of banks suing regulators in the online appendix. Banks also have the right tocontest regulators’ decision to issue an EDO before an administrative law judge (see Section 2 and AppendixA).
1
are an important regulatory tool that bank regulators and supervisors use to require a bank
to take corrective actions (Curry et al., 1999; Eisenbach et al., 2017; Hirtle et al., 2020).
Noncompliance with an EDO is a serious offense that could lead to monetary penalties
or the withdrawal of deposit insurance. Although bank regulators have issued enforcement
actions since 1966, contemporaneous information on these actions has been publicly disclosed
only since the August 9, 1989, passage of FIRREA.
To study the effects of the change in the disclosure regime on regulatory incentives, a
researcher must observe enforcement actions before and after the regime change, even though
EDOs issued before were never disclosed by the regulators. A key feature of our study is that
we identify enforcement actions in the pre-FIRREA regime by using termination documents
that were released following the regime change. From the U.S. National Archives, we also
hand-collect a subset of enforcement actions for 1983–1984 that terminated during the pre-
disclosure period. Unlike the post-FIRREA actions, the pre-FIRREA EDOs were not public.
Therefore this setting and our sample allow us to study changes in regulators’ behavior once
their actions become observable. A drawback of our sample is that, apart from the hand-
collected observations, our pre-disclosure sample consists of enforcement orders that were
initiated prior to FIRREA and terminated afterward. This likely results in some missing
observations in the earlier part of the 1985–1989 sample for EDOs that were initiated and
resolved prior to FIRREA. Our sample for 1983–1984 partially alleviates this concern, as it
has a similar distribution of EDO length as the post-FIRREA sample (Figure 1).
We begin our analyses by investigating the likelihood of banks’ receiving an enforcement
action in the two regimes. Once enforcement actions are observable, we find regulators
become stricter, as evidenced by intervening more and, conditional on intervening, issuing
enforcement actions sooner. Publicly observable signals are also more strongly associated
with EDOs after the change in disclosure regime. For instance, we find banks’ nonperform-
ing assets, capital ratio, and profitability play a more significant role in regulators’ decisions
to issue enforcement actions after the regime change. We also observe that, conditional
2
on intervening, regulators issue EDOs 71% sooner in the disclosure regime, relative to the
nondisclosure regime. Next, we evaluate whether the content of enforcement actions changes
following the disclosure regime change. Prior studies have documented that regulators fac-
ing increased public scrutiny make their disclosures less informative and more standardized
(Meade & Stasavage, 2008; Hansen et al., 2017). In our content analyses, we likewise find
that EDOs become longer, more complex, and include more boilerplate language after the
regime change. These results suggest that the disclosure regime change is associated with
changes in regulators’ actions.
FIRREA was passed toward the end of the thrift crisis and included other changes to
regulatory enforcement. Therefore the disclosure of EDOs was not the only provision that
affected regulators’ actions but rather one of several contributors. To tie our findings to
the disclosure channel, we use variation in news circulation across counties. We argue that
regulators’ cost of not issuing enforcement actions is higher in counties with higher news cir-
culation because banks’ funding providers are more likely to be aware of issues at their banks
through news coverage. Therefore regulators’ credibility and reputation would be harmed if
they do not issue timely enforcement actions. In addition, market discipline is likely to work
better in counties with higher news circulation because funding providers are more likely to
learn about EDOs. Consequently, we expect the marginal benefit of regulators’ disclosing
enforcement actions to be higher in counties with higher news circulation, leading regulators
to issue more enforcement actions to problem banks in these counties. Even though deposi-
tors are more likely to learn about EDOs in higher news circulation counties and withdraw
their deposits from affected banks, regulators trade off the possibility of a run against their
credibility. Consistent with these arguments, in counties with higher news circulation, we
find regulators are 40% more likely to issue enforcement actions in the disclosure regime
than in the nondisclosure regime. We also find regulators intervene sooner in counties with
higher news circulation. These findings suggest that the disclosure regime change plays an
important role in observed changes in regulatory behavior.
3
We further evaluate concerns that other changes that occurred around FIRREA could
explain our results. For example, conditions that led to the enactment of the law at the
beginning of the resolution of the savings and loan (S&L) crisis, could have changed enforce-
ment. We conduct several tests to assess the impact of the S&L crisis on our inferences. First,
thrifts were at the center of the crisis, which resulted in an unprecedented number of thrift
failures.2 We exclude thrifts from our sample and focus our analyses on commercial banks,
which were less involved in the S&L crisis. Second, we investigate whether competition from
thrifts in risky lending and deposit markets affects our results for commercial banks. We find
that our inferences are robust to controlling for competition from thrifts. Finally, we eval-
uate whether negative publicity during the S&L crisis might have made regulators stricter
and less willing to forbear, regardless of the disclosure of enforcement actions. If negative
publicity drove our results, we would expect our findings to be less persistent, based on the
conjecture that the news media helps form public opinion (Dunaway et al., 2010; Happer &
Philo, 2013; McCombs, 2018; Norris et al., 2004). On the contrary, our results persist even
after mentions of the S&L crisis decline in the news. Overall, these tests provide further
evidence that the disclosure regime change plays an incremental role in changing regulators’
behavior.
Another concern is that regulators respond similarly to any banking crisis. Therefore we
investigate regulators’ response in another crisis when they faced significant negative public
opinion but no change in the disclosure regime. Specifically, we repeat our main analyses
using the financial crisis of 2007–2009.3 As opposed to our main results, we find regulators
were more likely to forbear in the financial crisis. When evaluating the textual content of
EDOs during that crisis, we also find different results from those we observe after the change
in the disclosure regime. These findings suggest that regulators do not issue EDOs in the
2Among other changes, FIRREA abolished the thrift regulator (Federal Home Loan Bank Board orFHLBB) and created the Office of Thrift Supervision (OTS) for regulating thrifts. For more details, seeBlack (1990), Kane (1989), and Malloy (1989).
3We do not consider the two crises to be the same but provide this analysis to address the concern thatregulators respond similarly to crises when facing negative publicity.
4
same way in all crises.4
Finally, we study bank outcomes. One of the reasons for disclosing EDOs under FIRREA
is to increase market discipline by funding providers. Consistent with this objective, we
find that EDO banks’ uninsured deposits decline following the regime change. We also
find that uninsured depositors react more to EDOs that are covered in the news, with a
greater response to EDOs with more intensive, longer, and national news media coverage.
Depositors’ response to the news of EDOs suggests they may view the issuance of an EDO
as a warning signal of issues at their bank and withdraw funds. One possibility is that such
withdrawals may accelerate bank failure. Therefore we study how EDOs are associated with
bank failure in the two regimes. We find that, conditional on failure, banks that receive
an EDO in the disclosure regime fail 74% faster, relative to those that receive an EDO in
the nondisclosure regime. We also study whether banks respond to the increased market
discipline and reduced probability of receiving forbearance in the disclosure regime and find
improvements in banks’ capital ratios and asset quality. Overall, our findings suggest an
increased role of market discipline and improved bank outcomes in the disclosure regime.
Our inferences are subject to limitations. First, our pre-FIRREA sample is limited to
enforcement actions we could identify through termination documents and hand-collect from
the National Archives. Therefore our data likely excludes more rapidly resolved EDOs for
at least a part of our pre-FIRREA sample. While we conduct several robustness tests to
alleviate this concern, we cannot fully rule out the impact of these missing EDOs on our
findings. Second, FIRREA introduced several changes to the enforcement environment in
addition to the change in the disclosure of EDOs. Our study does not rule out the effect of
regulators’ increased enforcement powers as a result of FIRREA but rather offers evidence
consistent with the disclosure channel playing an incremental role. Finally, other events that
occurred before or after FIRREA could have influenced our findings. We conduct additional
4We also consider the potential effect of the FDIC Improvement Act of 1991 (FDICIA), which wasimplemented in December 1992, as well as preemptive changes in bank behavior in anticipation of increasedenforcement. We discuss these alternatives further in Section 5.
5
analyses to evaluate these alternative explanations and find robust results. However, we
cannot rule out their impact.
Our research contributes to several strands of the literature. First, our study relates to
work on regulatory incentives (Agarwal et al., 2014; Costello et al., 2019; Granja & Leuz,
2019; Kedia & Rajgopal, 2011; Peltzman, 1976; Stigler, 1971). Given that supervisory actions
are generally unobservable in a nondisclosure regime, our paper provides a unique oppor-
tunity to study changes in regulatory incentives once regulatory effort becomes observable.
Our results provide suggestive evidence that regulators strive to protect their reputation and
credibility once their supervisory actions are disclosed. Our findings are consistent with the
work of Hansen et al. (2017), who analyze the text of the Federal Open Market Committee
(FOMC) deliberations and find that career concerns matter for how policymakers respond
to the disclosure of their discussions.
Second, our paper contributes to the literature on disclosure of supervisory information
2018; Thakor, 2015). We find a decline in deposits and acceleration of bank failure in the
disclosure regime, despite improvements in banks’ capital ratios and asset quality following
the regime change.
Finally, our study adds to the research investigating mandatory disclosure by bank reg-
ulators as well as to the literature related to bank enforcement actions (Beatty & Liao,
2014; Bischof & Daske, 2013; Curry et al., 1999; Delis et al., 2016; Ellahie, 2013; Gilbert &
Vaughan, 2001; Peristiani et al., 2010; Roman, 2016; Wheeler, 2019). We show that disclo-
6
sure of bank enforcement actions is associated with improvements in bank capital and loan
quality and has implications for bank failure. More importantly, we find that disclosure of
regulatory actions plays an incremental role in changing regulatory incentives.
2. Background
Bank supervision and regulation aim to ensure banks follow safe and sound practices and
do not take risks that could threaten the stability of the banking system. As part of their
supervision, regulators issue enforcement actions against banks and their officers. These
actions could come in response to such problems as inadequate capital, liquidity, or loan
loss reserves, excessive risk-taking, or poor management. Although bank regulators could
issue enforcement actions against banks following the Financial Institution Supervisory Act
of 1966 (FISA), these enforcement orders were publicly disclosed only after the 1989 passage
of FIRREA.
Bank regulators bring enforcement actions as a last resort and exercise discretion in
issuing these actions. For instance, regulators could employ informal methods, such as bank
board resolutions or issue memoranda of understanding, before resorting to more formal
techniques and issuing EDOs. The process for issuing an enforcement order starts with bank
examiners assigning low CAMELS ratings of 4 or 5 and recommending that the regulators
initiate proceedings against a bank.5
The primary reason for issuing a formal enforcement order is to force the affected bank
to take the specified corrective actions (Curry et al., 1999; Hirtle et al., 2020; Srinivas et al.,
2015). Upon the bank’s completion of those actions and receipt of an improved CAMELS
rating from bank examiners, a termination order is issued. If a bank fails to satisfy the
5CAMELS rating is an acronym for composite and component ratings issued by bank examiners. Thecomponents are based on the evaluation of six critical elements of bank operations: capital adequacy, assetquality, management, earnings, liquidity, and sensitivity to risk (market and interest rate). The highestrating is 1 and the lowest is 5. CAMELS ratings are not public and are only communicated to senior bankmanagement and bank regulators. The examiners recommend issuance of an EDO based on the componentratings.
7
requirements of the order, the FDIC has the power to enforce it in U.S. district court or ter-
minate the bank’s deposit insurance. If a bank becomes insolvent or is put into receivership,
a formal termination order is issued specifying that the bank failed. If a bank is acquired or
merges with another, the original order remains under the original name of the bank, and
the order is only terminated once the regulators are satisfied that the new entity has met its
requirements. Sometimes, enforcement orders are modified to include additional conditions
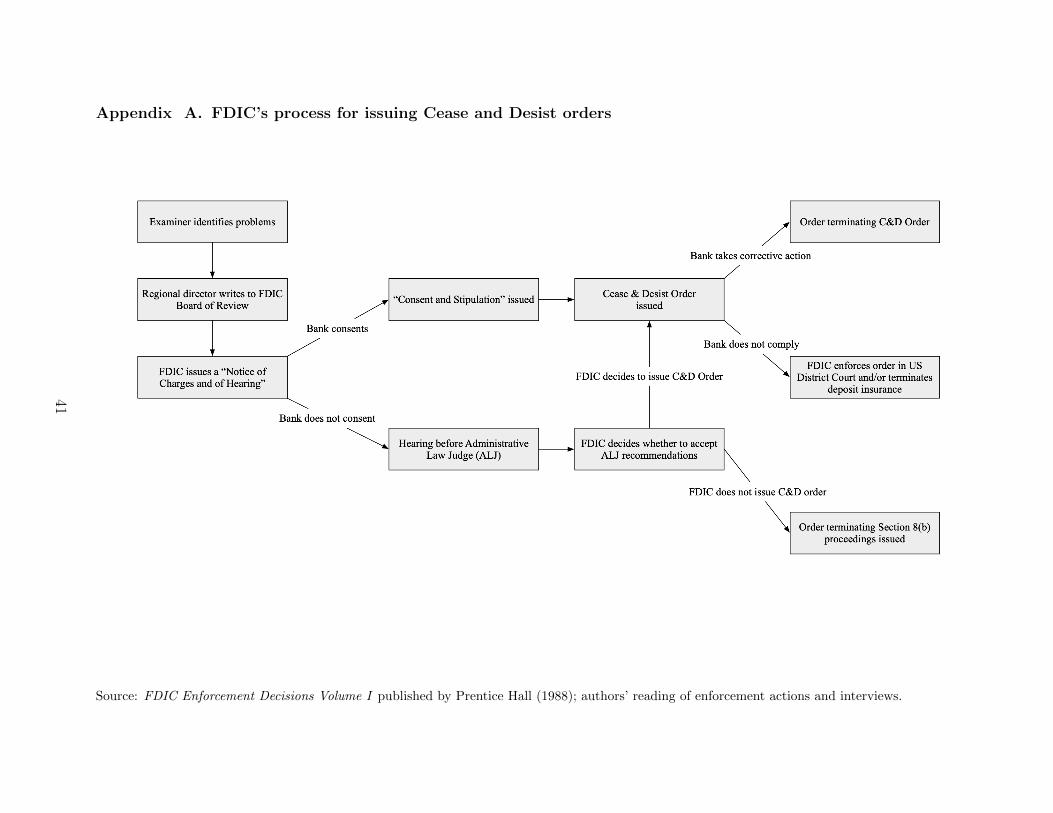
or requirements. We provide a schematic description of the C&D enforcement order process
over time in Appendix A.
The move from the nondisclosure to disclosure regime in 1989 followed a series of events
summarized in Appendix B. The S&L crisis of the mid-1970s–early 1990s sparked a debate
regarding the role of market discipline and increased regulation in the banking industry.
During the late 1980s, many banks failed, leading to a depletion of the FDIC deposit insur-
ance fund. As a result, the FDIC chairman at the time called for a greater role for market
discipline in bank regulation and oversight. In 1985, the FDIC released a proposal to disclose
enforcement actions, allowing depositors and other funding providers to monitor banks using
this information. However, citing the fear of bank runs and financial instability, banks and
banking associations opposed the proposal: of the 768 comment letters the FDIC received,
only 57 favored its implementation.6
The FDIC postponed consideration of the proposal to move forward in conjunction with
other federal bank regulators. FIRREA was passed in August 1989, and upon its imple-
mentation, the FDIC and other bank regulators were required to disclose final enforcement
actions and termination orders. In particular, FIRREA required that “the appropriate Fed-
eral banking agency shall publish and make available to the public—(A) any final order
issued with respect to any administrative enforcement proceeding initiated by such agency
under this section or any other provision of the law; and (B) any modification or termination
6See, for example, “FDIC May Delay Public-Disclosure Rule for Banks,” The Wall Street Journal, De-cember 11, 1985; “F.D.I.C. Decides to Disclose Disciplinary Actions,” The New York Times, May 5, 1985.
8
of any final order.”7
3. Data and sample
Our data come from several sources. We focus our empirical analyses on commercial
banks and obtain financial data from Call Reports from the Federal Financial Institutions
Examination Council (FFIEC). Using the S&P Global SNL Financial database, we collect all
enforcement actions issued by bank regulators disclosed after the introduction of FIRREA
in August 1989. To identify enforcement actions in the pre-FIRREA (nondisclosure) period,
we mainly rely on termination documents that were made public in the post-FIRREA (dis-
closure) period. If a bank received an enforcement order in the pre-FIRREA period but this
order was terminated after the passage of the act, a public termination order reveals the
identity of the bank that received an enforcement action as well as the date of issuance.8
We also hand-collect a subset of enforcement actions from the nondisclosure period from the
U.S. National Archives (the archives could only be viewed for 1983 and 1984).
Apart from the hand-collected sample for 1983–1984, we observe enforcement orders that
were initiated prior to FIRREA and terminated afterward, likely leading to some missing
observations in our pre-disclosure sample. We terminate our sample in 1997 to avoid creating
a panel that is skewed toward the post-FIRREA period. In the (pre-) post-FIRREA period,
the mean length of an EDO is (3.5) 2.3 years, the median is (3.1) 2.0 years, and the maximum
is (11.3) 11.8 years. In Figure 1, we plot the kernel distributions of the length of enforcement
actions in the pre- and post-disclosure regimes. The figure shows an overlap between the
distributions of the length of EDOs issued in the two regimes. In fact, the distributions are
very similar for the sample of EDOs that were issued and terminated pre-FIRREA and those
that were issued and terminated post-FIRREA (but not for other pre-FIRREA EDOs that
7Section 913—Public Disclosure of Enforcement Actions Required of FIRREA.8Publicly listed commercial banks were required to disclose information related to EDOs in their 8-K
filings before FIRREA. However, public banks represent less than 5% of our overall sample and have veryfew EDOs in the pre-disclosure period. Our search of local news produced only one mention of an EDO inthe nondisclosure regime.
9
were terminated post-FIRREA).
Several types of enforcement actions exist that vary by degree of severity. We restrict our
analysis to the most common and severe types: C&D orders, formal agreements/supervisory
agreements, consent orders, and PCA orders. C&D orders are enforceable, injunction-type
orders that may be issued to a banking organization when it engages, has engaged, or is
about to engage in an unsafe or unsound banking practice or violation of the law. Formal
agreements prescribe restrictions, corrective measures, and remedies that banks must follow
to return to a safe and sound condition. PCA orders require banks to take certain corrective
measures to protect or raise the level of their regulatory capital. We use SNL’s classification
of orders after verifying them with the orders available on banking regulators’ websites to
ensure classification accuracy. Our main sample consists of 1,823 unique severe enforcement
actions issued by any federal bank regulator during the years 1983–1997, of which 302 are
pre-FIRREA EDOs collected from the National Archives and termination orders.9 We focus
on severe enforcement actions for comparability because our pre-FIRREA sample consists
of only such EDOs.
Table 1 shows the characteristics of enforcement actions issued by the FDIC from 1983 to
2017: their length in terms of the total number of words, the most commonly used phrases
found in these actions (using bigrams), two widely used measures of content readability
(Gunning FOG index and Flesch Grade Level readability score), and the use of boilerplate
language.10 The focus of enforcement actions changed over time from unsafe and unsound
practices to a greater emphasis on fiduciary duty toward depositors and deposit insurance.
The resolution years after the financial crisis (as well as 1991 and 1992) had the longest
9All federal banking regulators refers to the FDIC, Federal Reserve, and OCC. Severe EDOs issued tostate-chartered banks are jointly issued by federal and state banking regulators. We checked a sample ofEDOs issued only by state regulators and found they were primarily targeted at individual managers oremployees at a bank. As we do not include thrifts in our sample, we exclude enforcement actions issued bythe OTS from our analyses.
10We focus our textual analysis on the FDIC’s severe enforcement actions because this is the sample forwhich we could collect the most comprehensive set of documents pre- and post-FIRREA. We identified 2,546severe enforcement actions issued by the FDIC that could be analyzed using textual analysis methods forthe full sample up to 2017, 700 of which were issued in 1983–1984 and 1989Q3–1997.
10
documents, averaging between 542 and 3,308 words across all sample years. The average
length of EDOs is 1,836 words. Due to their complexity, EDOs require, on average, more
than 17 years of education to understand. The most commonly used phrases over the whole
period are “supervisory authorities,” “deposit insurance,” and “federal deposit.” These
terms are not surprising, given that we study the severest enforcement actions from the
FDIC. The focus and content of EDOs change over time, with “federal deposit insurance”
featuring more prominently in later years, especially after the financial crisis.
We provide additional information on the number of EDOs, their severity (measured as
the length of time from issuance to resolution), and the name of the regulator issuing EDOs.
Figure 2 presents the number and average length of EDOs and shows two distinct periods
generated the highest volume of EDOs: the resolutions of the S&L crisis in the early 1990s
and the financial crisis from 2009 to 2011. The largest number of enforcement actions were
issued after the financial crisis, with 2010 being the most active year with 874 actions. The
average length of EDOs issued in later years is truncated, because many of these EDOs
were still outstanding at the point of data collection. Figure 3 shows the FDIC issues the
most EDOs, followed by the Federal Reserve (Fed), and the Office of the Comptroller of the
Currency (OCC). The FDIC issued the most EDOs after the financial crisis in 2010, with
more than 350 enforcement actions issued that year.11
Table 2 shows the summary statistics for the full sample. Panel A and Panel B present the
financial characteristics for EDO bank-quarters and non-EDO bank-quarters, respectively,
whereas Panel C shows the differences between EDO and non-EDO bank-quarters in the two
regimes. The panels show that, on average, unconditional bank characteristics improved in
the disclosure regime, relative to the nondisclosure regime, and EDO banks were on average
of worse quality than non-EDO banks.
11In addition, we summarize the fines that regulators impose on financial institutions as monetary remediesfollowing an enforcement action and find that less than a quarter of banks are required to pay a penalty.These monetary penalties could be levied against a bank, an individual responsible for a particular action(e.g., a bank or a branch manager), or both. We include details related to penalties in the online appendix,Figure OA1.
4.1. Changes in the determinants of enforcement actions
We begin our analyses by examining the role of bank-specific characteristics and the
changing disclosure regime on the likelihood of banks’ receiving an enforcement action. We
predict the likelihood of a bank receiving an enforcement action in the two regimes using
a Cox proportional-hazards model with time-varying covariates. The literature has used
the proportional-hazards model to predict the occurrence of events such as the decision to
privatize (Dinc & Gupta, 2011) and bank failure (Lane et al., 1986; Liu & Ngo, 2014). The
proportional-hazards model has two main advantages in our setting. First, it incorporates
both the receipt and timing of an EDO. Second, it allows for a general baseline hazard
function that can take whatever shape is necessary to capture the distribution of event
occurrence in the sample (Singer & Willett, 2003).
We use the following model to estimate the probability that a bank receives an enforce-
ment action in quarter t, given that it has not received one up to quarter t− 1:
h(t) = h0(t)exp(β1Disclosure Regime+ βkXk), (1)
where the time of an EDO is determined by the first time the regulator issues an enforcement
action. The model assumes a bank’s hazard rate at event time t equals the product of the
baseline hazard rate h0(t) and the function of bank EDO risk factors exp(βkXk), where X
is a vector of k time-varying explanatory variables lagged by one quarter. We allow the
baseline hazard rates to vary across time by estimating the model by year.
The indicator variable Disclosure Regime takes the value of 1 post-FIRREA and 0
otherwise. X includes controls for size, capital ratio, nonperforming assets ratio (a proxy for
asset quality), return on assets (a proxy for profitability), and liquidity ratio. We expect that
banks with higher levels of capital, higher profitability, and more liquid assets are less likely
to receive enforcement actions, whereas those with higher values of nonperforming assets are
12
more likely to receive such actions. X also includes changes in capital, liquidity, and loans.
Banks with declining capital and liquidity are more likely to receive an EDO. Furthermore,
regulators might view very high loan growth as risky if banks are not well diversified.12 We
also include distance from the regulators’ regional offices to control for regulatory attention
(Gopalan et al., 2017; Kedia & Rajgopal, 2011; Tomy, 2019). In addition, we control for
employment growth as local economic conditions could influence the likelihood of receiving
an EDO. We lag all explanatory variables by one quarter and define all the variables in
Appendix C.
We restrict the sample to the years around the change in the regime, namely, 1983 to
1997. This period includes 6.5 years before the change in the regulation (the first quarter
of 1983–the second quarter of 1989) and eight years after the change (the fourth quarter of
1989–the fourth quarter of 1997). We remove EDOs that were received in the third quarter
of 1989, the quarter in which the disclosure regime changed. We expand the period after
the change in regulation to eight years to minimize the impact of the period immediately
following 1989, which coincides with the resolution of the S&L crisis.
Table 3 reports the results of this estimation. Column (1) shows banks are more likely
to receive an enforcement action in the disclosure regime and banks with lower levels of
capital, higher nonperforming assets, lower profitability, and lower liquidity are more likely
to receive enforcement actions. Banks with large negative changes in their capital ratios or
loan portfolios are also more likely to receive enforcement actions. The coefficient on the
distance to regulators’ field offices is positive and statistically significant, suggesting more
distant banks are more likely to receive EDOs. Because formal enforcement actions are a
measure of last resort, a resource-constrained regulator may be less willing to spend time
negotiating with banks that are farther away and thus more prone to issue enforcement
actions against these banks.
12In untabulated results, we include changes in deposits and two measures of loan portfolio diversification(the ratio of commercial real estate loans to total loans and nonresidential real estate loans to total loans).The measures of portfolio diversification are not statistically significant and do not affect our main findings.
13
In columns (2) to (5), we interact capital ratio, nonperforming assets, return on assets,
and liquidity with the disclosure-regime indicator. In column (2), a negative and significant
coefficient on Capital Ratio×Disclosure Regime suggests a bank with a higher capital ratio
is relatively less likely to receive an EDO in the disclosure regime than in the nondisclosure
regime. Interpreting these results in terms of the hazard ratio over the distribution of capital
ratio implies a bank in the 75th percentile of Capital Ratio is 0.67 times as likely as a bank in
the 25th percentile of Capital Ratio to receive an EDO in the nondisclosure regime, whereas
a bank in the 75th percentile is only 0.56 times as likely as a bank in the 25th percentile of
Capital Ratio to receive an enforcement action in the disclosure regime.13
Column (3) shows that nonperforming assets are a significant predictor of EDOs in both
regimes. The positive coefficient on Nonperforming Assets × Disclosure Regime suggests a
bank with higher nonperforming assets is relatively more likely to receive an EDO in the
disclosure regime. In terms of magnitude, a bank in the 75th percentile of Nonperforming
Assets is 1.48 times more likely than a bank in the 25th percentile to receive an EDO in the
nondisclosure regime. In the disclosure regime, this ratio increases to 1.75. We find similar
results for return on assets in column (4). A bank in the 75th percentile of Return On Assets
is 0.88 times as likely as a bank in the 25th percentile to receive an EDO in the nondisclosure
regime; in the disclosure regime, a bank in the 75th percentile of Return On Assets is only
0.75 times as likely to receive an EDO. We do not find the liquidity ratio to be incrementally
significant in the disclosure regime. In column (6), we include all four interactions and find
the results related to nonperforming assets and return on assets continue to hold. We lose
significance on the capital ratio when interacted with the disclosure-regime indicator.14
13Table 2 shows that bank quality on average improves in the post-FIRREA period. However, the dis-tribution of bank quality also changes (standard deviation increases) in the post-disclosure period relativeto the pre-disclosure regime. Therefore, even though average bank quality improves post-FIRREA, in amultivariate setting where we control for year effects (in addition to bank characteristics and local economicfactors), we find that poorly performing banks are more likely to receive EDOs in the disclosure regimerelative to the nondisclosure regime.
14In an untabulated analysis, we find high correlations between the four interacted variables and thedisclosure-regime indicator in column (6), resulting in the risk of multicollinearity. We do not find similar highcorrelations between the explanatory variables in columns (1) to (5) and therefore base our interpretations
14
Finally, we estimate an accelerated-time model to ascertain whether regulators intervene
sooner in the disclosure regime (Anbil, 2018; Cleves et al., 2008):
log(t) = β1Disclosure Regime+ βkXk + log(τ), (2)
where t is the survival time (time the bank does not receive an EDO) and the residual τ is
assumed to have a Weibull distribution.15 All other variables are defined above. Column
(7) presents the results from the estimation of Equation 2. The coefficient of −1.232 on the
disclosure-regime indicator converts to a time ratio of 0.29 (e−1.232), which indicates that,
conditional on receiving an EDO, banks received an enforcement action 71% (1−0.29) faster
in the disclosure regime.16
The results in Table 3 indicate that, in the disclosure regime relative to the nondisclosure
regime, regulators intervene more and that publicly observable signals, such as nonperforming
assets and return on assets, are stronger determinants of the likelihood a bank receives an
enforcement action. Furthermore, conditional on receiving an EDO, regulators intervene
sooner in the disclosure regime.
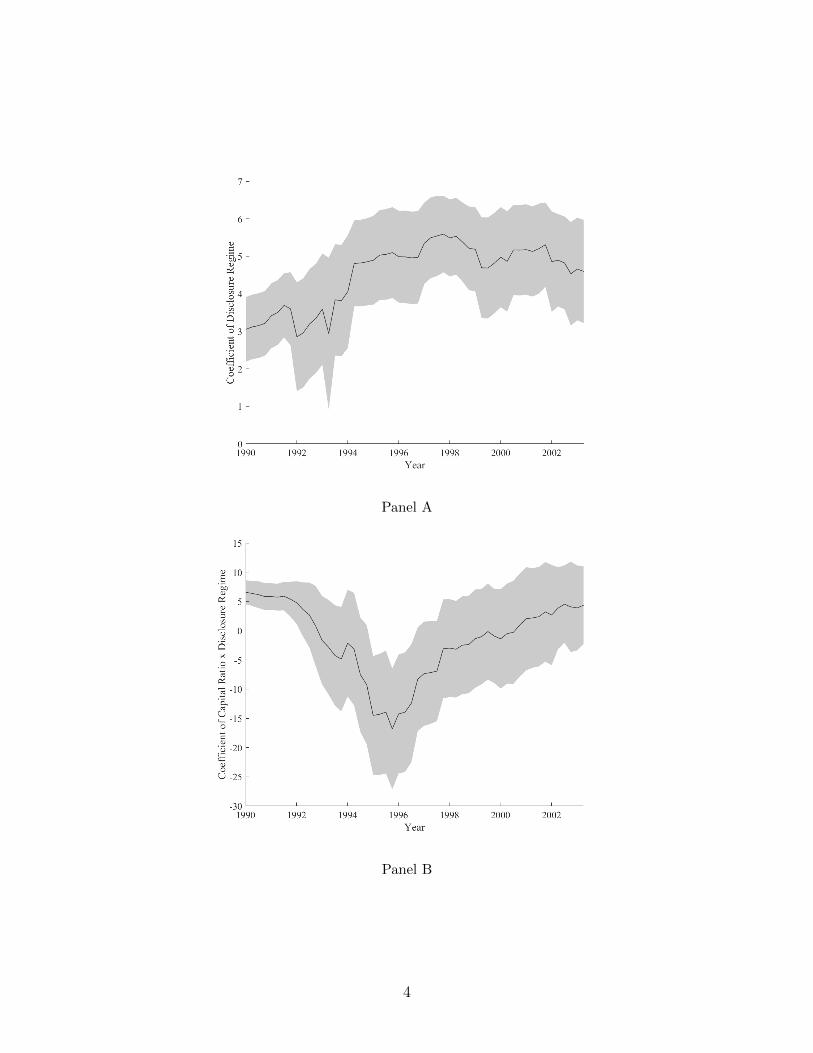
We conduct several additional analyses to evaluate the robustness of our findings. First,
to address concerns about increasing trends in the dependent variable prior to the regime
change, we compare banks that received EDOs and those that did not before the change in
the disclosure regime. The coefficients plot in Figure OA2 of the online appendix shows the
on the findings in these columns.15Please see Section 3 in the online appendix for a brief description of this model.16Equation 2 lends itself to a conditional interpretation of the results—a bank cannot receive an EDO
faster if in fact it did not receive an EDO (Anbil, 2018; Cleves et al., 2008). The full sample is employedin the estimation because the analyses assume that all banks, in theory, have some likelihood of receivingan EDO (Singer & Willett, 2003). The non-EDO banks (censored observations) contribute information onlythrough their survival function. For example, consider the general form of the likelihood function:
L =N∏j=1
[f(tj)]dj [S(tj)]
1−dj .
The uncensored observations (dj = 1) contribute to the density f , whereas the censored observations (dj = 0)contribute to the survival function S.
lack of a distinct trend in the pre-disclosure period. Second, we repeat our main analysis
using a linear probability model, controlling for year-quarter and bank fixed effects. Our
main results continue to hold (online appendix, Table OA1). Third, we conduct additional
analyses to address concerns that our method of constructing the pre-FIRREA sample could
bias our results. As described in Section 3, our sample of pre-FIRREA enforcement actions
from 1985 through the second quarter of 1989 is biased toward EDOs that take longer to
resolve and thus are likely more severe.
To assess the impact of the missing, quicker resolution EDOs on our results, we conduct an
additional robustness test by restricting the pre-FIRREA sample to 1983–1984. The sample
for these two years is hand-collected from the National Archives and therefore contains
shorter EDOs as well (Figure 1 shows that EDO length distributions are similar between
1983–1984 and post-FIRREA samples). We conduct a rolling-window analysis, where for the
pre-FIRREA years of 1983–1984, and we select all possible consecutive 20-quarter windows
in the post-FIRREA period and repeat our main specification. As the online appendix,
Figure OA3 shows, our results generally hold in these subsamples, reducing concerns that the
missing shorter EDOs could be biasing our results. Furthermore, our results also hold when
we restrict the pre-FIRREA sample to 1983–1984 and include the full post-FIRREA sample
(online appendix, Table OA2). Finally, we redefine the dependent variable to C&D orders
only to control for the heterogeneity in enforcement actions (online appendix, Table OA3)
and find similar results.17 Overall, our findings suggest that regulators become stricter in
their enforcement behavior, as evidenced by intervening more and issuing EDOs sooner, and
rely more on publicly observable signals when their efforts become observable.18
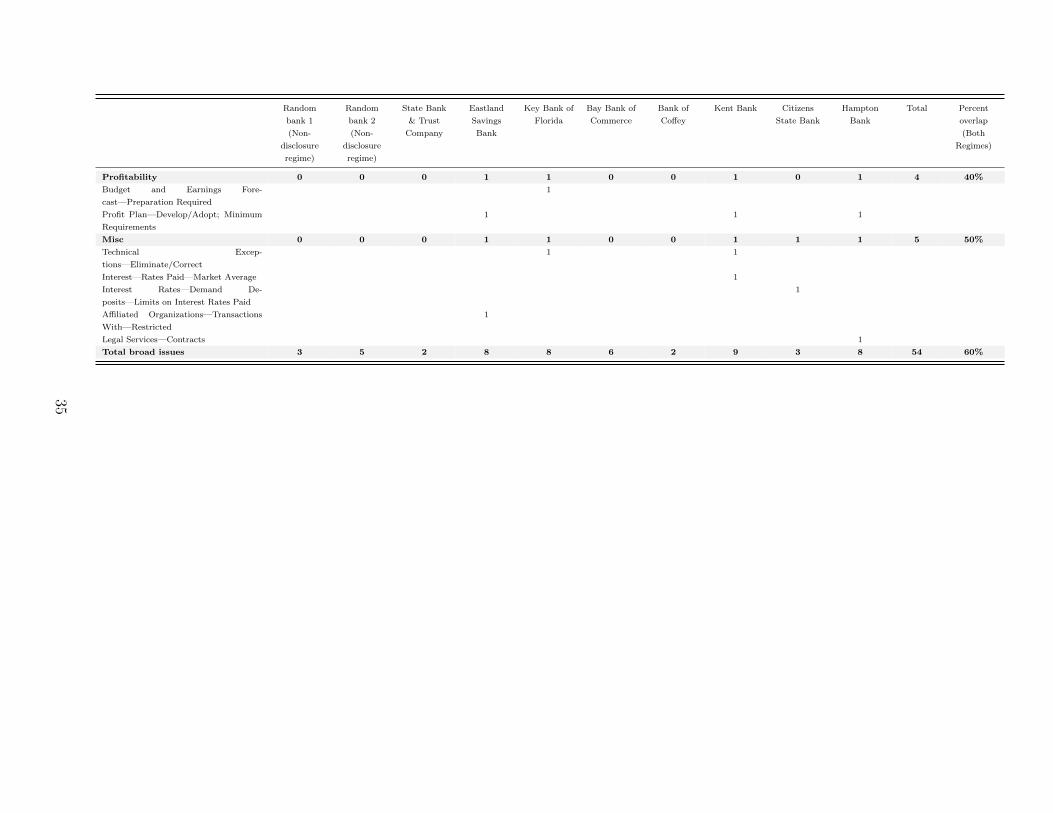
17We analyze a random sample of C&D orders and find a substantial overlap in the topics covered,indicating that restricting the sample to C&D orders controls for heterogeneity in EDOs. We include theseanalyses in Section 4 of the online appendix.
18One concern is that risky loans due to the thrift crisis may result in nonperforming loans and returnon assets being stronger predictors of EDOs in the disclosure regime, which coincided with the resolution ofthe S&L crisis. However, as shown later in Table 6, our results are robust to controlling for thrifts’ share ofrisky lending at the county level and its interaction with the Disclosure Regime indicator.
4.2. Changes in the content of enforcement actions
Next, we investigate whether changes in the content of enforcement actions is associated
with the change in the disclosure regime. We employ textual analysis techniques to analyze
the severe EDOs issued by the FDIC by using our hand-collected sample of 1983–1984
enforcement actions and the publicly disclosed EDOs from Q4 1989–Q4 1997. We control for
bank characteristics and local economic conditions, as in our other specifications, but given
that we do not observe many banks with multiple enforcement actions in our sample period,
we do not include fixed effects. We evaluate measures of complexity, such as document length
(measured as the natural logarithm of the number of words in a document), clarity (measured
as the Gunning FOG index), overall document readability (measured as the Flesch Grade
Level readability), numerical intensity (the relative percentage of numerical characters in
the document), and the percentage of boilerplate language used (based on common usage of
four-word phrases).
We rely on prior studies, which analyze the textual content of public financial disclosures,
to identify proxies for document complexity and readability. In particular, document length
is computed based on the number of words and has been used as a measure of the quantity
of disclosure. Gunning FOG index and the Flesch Grade Level readability index are con-
structed based on the usage of complex words in sentences and capture years of education
required to understand a given text (Li, 2008, 2010). These proxies for document readabil-
ity have been used to evaluate investors’ and analysts’ understanding of financial disclosures
(Lehavy et al., 2011; Miller, 2010). Similarly, numerical intensity has been used as a measure
of information content and usefulness to investors (Li, 2010; Bozanic et al., 2018). Finally,
financial regulators and accounting standard setters have identified companies’ increased use
of boilerplate language as an attempt to reduce legal or reputation exposure, making disclo-
sures with boilerplate language less informative (Lang & Stice-Lawrence, 2015). Following
Lang & Stice-Lawrence (2015), we define boilerplate language as standardized disclosures so
prevalent that it is unlikely to be informative. We measure boilerplate by identifying four-
17
word phrases (tetragrams) that are extremely common across documents in a given year
after removing common and stop words such as “Federal Deposit Insurance Corporation,”
“and,” or “bank” from the text of EDOs.19 The measure relies on the assumption that using
these common phrases does not provide new incremental information because it repeats the
language of other EDOs. The measure of boilerplate language usage is the percentage of
words in the text of EDOs that contain at least one of these boilerplate phrases.
Table 4 presents our main findings. Column (1) shows that following the change in the
disclosure regime, EDO documents become longer, with the average number of words in-
creasing by approximately 71%. Column (2) shows that enforcement actions also become
less clear, with the FOG index indicating a significant increase in complexity of the words
and structures used. This result is confirmed by our findings in column (3) that an addi-
tional 5.5 years of education are required to understand the text of EDOs in the disclosure
regime. In addition, EDOs contain 0.8 percentage points more numerical information fol-
lowing the change in the disclosure regime (column 4). Finally, column (5) shows that some
of the increased length of EDOs is attributable to the use of boilerplate, which increases by
9.8%. This increase, combined with the increase in document length, indicates that regu-
lators employ more standardized and legal language in enforcement orders in the disclosure
period.20
Overall, our analysis of EDOs’ content indicates that, following the change in the dis-
closure regime, publicly disclosed enforcement actions become more complex and difficult
to understand. Some of this increased complexity is due to regulators’ increased use of
boilerplate language. The reliance on more boilerplate following FIRREA could reflect an
increase in public scrutiny and attention from the media as a result of the public consump-
19Only tetragrams that occur in at least 80% of the documents in a given year are considered to beboilerplate. We also require that all the documents in this analysis are FDIC C&D orders for comparability.This restriction reduces our sample size for boilerplate analysis.
20In robustness analyses (online appendix, Table OA4), we also control for EDO severity, measured as thelength of time it takes a bank to exit an enforcement action. We find similar results that EDOs increase incomplexity and usage of boilerplate language.
where News Circulation is a county-level measure of the intensity of newspaper circulation.
Following Gentzkow et al. (2011), we define newspaper circulation as the number of news-
paper copies scaled by the population of the county.22 All other variables are defined above
21In our discussions with examiners and supervisors, we learned that increased public scrutiny as a resultof public disclosures was an important consideration when FIRREA was first implemented.
22The county-level news-circulation measure is available for the presidential election years of 1984, 1988,1992, and 1996. We interpolate the data for the missing years. This measure does not vary significantly overour sample period. For example, the Pearson (Spearman) correlation between news circulation in 1984 and
19
and in Appendix C.
A potential concern is that news circulation could be confounded by other factors related
to the probability of receiving an enforcement action. For example, county characteristics,
such as per capita income or the employment growth rate, could drive both news circulation
and the likelihood of banks receiving enforcement actions if regulators paid differential at-
tention to high- and low-income counties. We follow the literature and control for variables
likely to be correlated with news circulation (Bishop et al., 1980). These variables include
urbanization, per capita income and employment growth in a county, and the interaction
of urbanization with News Circulation. We also include News Circulation2 as a control
variable, because the effect of news circulation could increase with its level. Furthermore,
we interact urbanization, per capita income, and employment growth with the disclosure
regime indicator to allow for the impact of these variables to vary in the two regimes.
In addition, we estimate an accelerated-time model to assess whether regulators intervene
sooner in counties with higher news circulation using the following specification:
log(t) = β1Disclosure Regime+ β2News Circulation
+ β3Disclosure Regime×News Circulation
+ βkXk + log(τ),
(4)
where t is the time to receiving an EDO and the residual τ is assumed to have a Weibull
distribution. The remaining variables are defined above and in Appendix C.
We present results from these estimations in Table 5. Columns (1), (2), and (3) present
the results from the estimation of the Cox model (Equation 3), whereas columns (4) and
(5) present the accelerated-time model results (Equation 4). Column (1) includes our main
control variables described above. Denser and wealthier urban areas are likely to have higher
news circulation; therefore we include News Circulation×Urbanization as a control variable
1996 is 0.807 (0.883) with p-value < 0.0001. We plot kernel densities for the measure in these two years andfind similar distributions.
20
in column (2). In column (3), we also include interactions of employment growth, per capita
income, and urbanization with the disclosure regime indicator. The positive coefficient of
Disclosure Regime×News Circulation in columns (1) to (3) suggests counties with higher
news circulation are more likely to receive an enforcement action in the disclosure regime.
The coefficient of 0.335 in column (3) suggests regulators are 40% more likely to issue an EDO
in counties with higher news circulation in the disclosure regime relative to the nondisclosure
regime.23 The estimates in column (2) suggest a similar magnitude of 39%.
In columns (4) and (5), we present the results for the accelerated-time model. The
coefficient of −0.375 on Disclosure Regime×News Circulation in column (5) converts to
a time ratio of 0.69 (e−0.375), which indicates that, conditional on receiving an EDO, banks
in higher-news-circulation counties received an EDO 31% (1 − 0.69) faster in the disclosure
regime. The estimates in column (4) suggest a similar magnitude of 30%. These results
corroborate our main findings that regulators intervene faster in the disclosure regime.
In additional robustness analyses, we include interactions of the Disclosure Regime in-
dicator with bank characteristics (capital ratio, nonperforming assets, return on assets, and
liquidity ratio). As the online appendix, Table OA5 shows, our results continue to hold. We
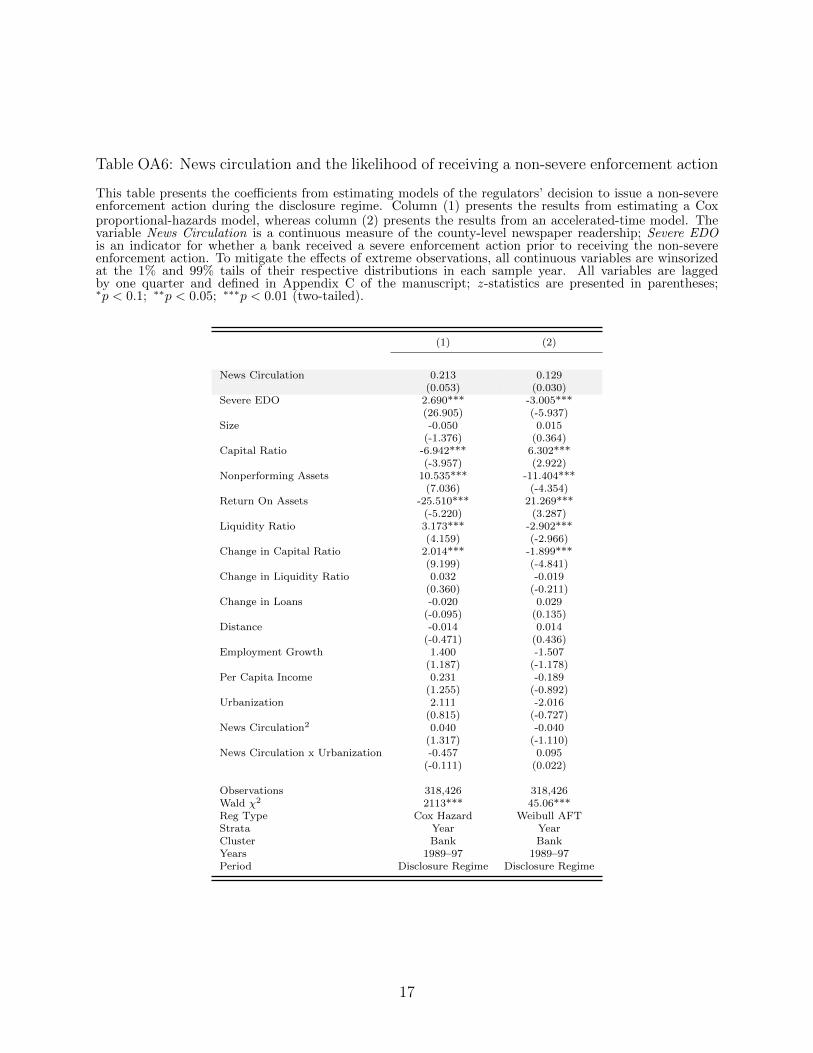
also analyze nonsevere enforcement actions to assess whether regulators’ expanded enforce-
ment powers could drive our results. We re-estimate the likelihood of receiving a nonsevere
enforcement action in the post-FIRREA period for models (3) and (5) of Table 5. Our results
for News Circulation are insignificant (online appendix, Table OA6), indicating that the like-
lihood of issuing nonsevere enforcement actions does not vary with news circulation. This
suggests that regulators’ expanded powers are unlikely to solely drive our results.24 Overall,
the results in this section provide evidence of the link between the disclosure channel and
regulators’ changing incentives.
23Calculation: (e0.335 − 1) ∗ 100 = 40%.24We provide examples of news media coverage of enforcement actions in Section 5 of the online appendix.
Although we exclude thrifts from our main analyses, the concern remains that some
(potentially small, local) commercial banks could also have been affected by the events
leading up to the S&L crisis. As one important example, competitive pressure from thrifts
could have led commercial banks to take greater risk and therefore receive more enforcement
actions.25 To measure competition, we evaluate thrifts’ investment in risky loans that might
have harmed commercial banks’ asset portfolios. Following Kandrac & Schlusche (2020), we
measure these risky investments as commercial real estate loans; acquisition, development,
and construction loans; and service corporation investments, which tend to have high credit
risk. We compute the share of these risky investments held by thrifts in a given county
lagged by one quarter. We include this measure of competition in our main specification
(Equation 1) as well as interact it with the Disclosure indicator. Table 6, Panel A shows that
our inferences are unaffected by the inclusion of this proxy for competition from thrifts.26
We also include this measure of competition from thrifts in our analyses of EDO content.
Table 6, Panel B shows that our results related to the content of enforcement actions continue
to hold. These findings suggest that competition from thrifts, which is believed to have
led to increased risk-taking by commercial banks, is not the main reason for the increase
in enforcement actions issued in the disclosure period or regulators’ increased reliance on
publicly observable signals. In an additional analysis, we construct a second measure of
competition based on the market share of deposits. In particular, for each EDO bank, we
measure the share of deposits held by thrifts in a given county where an EDO bank is
25See, for example, page 98 of FDIC’s Managing the Crisis: The FDIC and RTC Experience available athttps://www.fdic.gov/bank/historical/managing/documents/history-consolidated.pdf.
26Data for thrifts for 1983–1990 is not publicly available. Therefore we rely on confidential data from theFederal Reserve Board for form FHLBB 770 (for 1980–1983, available semiannually) and form FHLBB/OTS1313 (for 1984–1997, available quarterly). Our results (untabulated) are similar if we construct competitionmeasures using data for two, three, or four quarters prior to the receipt of an EDO by a given bank or byusing an average for the four quarters before a corresponding EDO.
headquartered. Our main inferences continue to hold (online appendix, Table OA7).
Another potential concern relating to the S&L crisis is that regulators might respond
to the negative publicity following the thrift crisis and more so in regions with higher news
circulation. The negative publicity was driven by the failure of thrifts and therefore tar-
geted at the thrift regulators.27 We exclude thrifts, their regulators, and any enforcement
actions they issue from our analyses and limit our sample to commercial banks throughout.
Nonetheless, the regulators of commercial banks could also have experienced negative pub-
licity from the crisis. To deal with this concern, we assess the persistence of our results.
If negative publicity following the S&L crisis explains our results, we should not observe
persistent results. Instead, our findings would be concentrated around the time when the
negative public opinion against bank regulators peaked. This conjecture assumes that the
news media plays a crucial role in forming public opinion (Dunaway et al., 2010; Happer &
Philo, 2013; McCombs, 2018; Norris et al., 2004).
We use news coverage of the S&L crisis as a measure of public opinion and search for
articles that relate to variants of the search terms “S&L crisis,” “savings and loan crisis,”
or “thrift failure” in Factiva, the Dow Jones news database. We find the press coverage of
this crisis peaked in 1988–1992. Coverage picked up in 2008–2009, as the financial crisis
elicited comparisons to the previous banking crises and the thrift crisis in particular (online
appendix, Figure OA5). Our sample extends to 1997, reducing concerns that our results are
driven by negative public opinion following the S&L crisis. In additional robustness tests,
we expand our sample to 1983–2007 and include indicator variables for Q4 1989–1997 and
Q4 1998–2007. We find our main results hold in both periods, confirming that our findings
persist over a fairly long time horizon and therefore are unlikely to be driven by negative
public opinion following the S&L crisis. We present these results in the online appendix,
Table OA8.
27Online appendix, Figure OA4 shows the cost to the deposit insurance fund for thrifts and commercialbanks and demonstrates the loss was largely due to the failure of thrifts.
where Crisis is an indicator variable that equals 1 for the financial crisis quarters of Q4
2007–Q2 2009, consistent with the NBER dates for the recessionary period, and 0 otherwise;
Post Crisis is an indicator variable that equals 1 for Q3 2009–Q4 2017 and 0 otherwise.
The remaining variables are defined as before. As Table 7 shows, our main results do not
generally hold in this sample. The insignificant coefficients on Crisis and Post Crisis in
column (1) of the table indicate that, conditional on covariates, regulators are not more
likely to issue enforcement actions in the aftermath of a crisis. In columns (2) to (5), we
interact the crisis-period indicators with the capital ratio, nonperforming assets, return on
assets, and the liquidity ratio. Although we still find a negative and significant coefficient
on the capital ratio interacted with the crisis-period indicator, we find opposite signs on the
interactions with nonperforming assets and return on assets. Hence, after the financial crisis
banks with high nonperforming assets and low profitability are not more likely to receive an
enforcement action. Finally, the results in column (6) are estimates from an accelerated-time
model, and they show regulators do not intervene sooner to issue EDOs during or after the
28We do not include the dot-com bubble burst in this analysis, because it is unlikely that our findings areaffected by this crisis. The dot-com bubble was primarily a stock market crisis and not a financial crisis; inparticular, its burst did not seriously affect the financial sector (Bernanke, 2013).
24
financial crisis.
To compare our results in Table 7 to the S&L crisis, we re-estimate our main specifications
(Equation 1 and Equation 2) after separating the Disclosure Regime indicator into two
distinct periods: S&L Crisis Resolution from Q4 1989–Q4 1992 and Post S&L Crisis from
Q4 1993–Q4 1997. We present these results in the online appendix, Table OA9. Our results
continue to hold, as evidenced by the consistent coefficients on the S&L Crisis Resolution
and Post S&L Crisis indicators.
These results indicate that, unlike in the disclosure-regime after FIRREA, regulators are
in fact more likely to forbear during and after the financial crisis.29 Therefore a crisis period
on its own is not a reason why we observe increased intervention by regulators, suggesting
that the change in the disclosure regime played an incremental role in regulators intervening
sooner, issuing more enforcement actions, and relying more on publicly observable signals to
issue enforcement actions. Overall, the results discussed above allow us to conclude that our
findings are unlikely to be driven solely by regulators’ response to negative publicity during
a crisis.
5.3. Impact of FDICIA
FDICIA was enacted in December 1991 and implemented in December 1992. It intro-
to comply with the Basel Capital Accord of 1988 by the end of 1992 (Getter, 2014). Under
FDICIA, banks are classified into five categories (from well capitalized to critically undercap-
italized) based on their capital levels, and the law requires regulators to intervene and apply
increasingly stringent restrictions if capital falls below certain thresholds. For banks above
29We also investigate whether the content of EDOs changes during and after the financial crisis. Using thesame period and textual analysis variables as described above, we find that, during and after the financialcrisis, the content of EDOs generally changes in a different direction from those we have documented in thedisclosure regime. In particular, online appendix, Table OA10 shows that, while the length of EDOs increasesduring and after the financial crisis, relative to the pre-crisis period, complexity decreases significantly,and readability improves. Regulators also use less boilerplate language during this time, suggesting thatenforcement actions issued and disclosed during and after the financial crisis contain more bank-specificinformation and are clearer.
a certain size, FDICIA also required improved internal controls, such as audit committees
and providing audited regulatory reports.30 The adoption (implementation) of FDICIA only
two (three) years after FIRREA introduces the concern that our results could be driven by
early intervention by regulators because of PCA or by increased reporting requirements for
banks above a certain size.31 As we describe below, due to the characteristics of our sample
and findings, FDICIA is unlikely to explain all of our results.
First, our sample contains only 12 PCA orders and removing these does not qualitatively
change our results. Second, our reading of enforcement actions and conversations with bank
examiners reveal that C&D orders contained PCA-type requirements, even before the intro-
duction of FDICIA. Third, the Basel Accord capital requirements applied to all regulated
banks and were implemented at a particular point in time, which we capture with our re-
search design and fixed effects. Fourth, the introduction of increased reporting requirements
for banks above the $500 million size threshold by the time of FDICIA implementation in
1993 does not explain our findings either. In our robustness tests, we exclude banks above the
initially announced $150 million threshold or above the implemented $500 million thresh-
old and find that our main results of regulators intervening more after the change in the
disclosure regime continue to hold. Finally, our results related to regulators’ relying more
on publicly observable signals, enforcing more in counties with higher news circulation, and
adjusting the textual content of EDOs is unlikely to be explained by early intervention due
to PCAs, changes to capital requirements for all banks, or the introduction of a reporting
threshold for a subset of commercial banks.
30The initial threshold specified in FDICIA was $150 million. This threshold was increased to $500 millionby the time of its implementation in 1993 (Altamuro & Beatty, 2010).
31Events preceding FDICIA’s implementation and in particular proposals to introduce FDICIA might havebeen in the works in mid-1980s. Some of these provisions were proposed at the time of FIRREA but werenot passed by Congress. Benston & Kaufman (1997) discuss that some of the provisions were watered downby the time FDICIA was passed in 1991.
26
5.4. Banks changing behavior in anticipation of the change in the disclosure regime
An additional concern is that banks may change their behavior in anticipation of increased
enforcement in the new regime. Although disentangling the effect of changes in the behavior
of banks from that of regulators is difficult, our results are unlikely to be explained by banks
changing their conduct in anticipation of regulatory change. We find that, after the regime
change, regulators issue more EDOs, intervene sooner, and rely more on publicly observable
signals. If banks improved their quality post-FIRREA, regulators would issue fewer EDOs,
not more. Furthermore, our findings that the textual content of EDOs becomes more complex
and boilerplate cannot be explained by this alternative.
6. Additional analyses and robustness
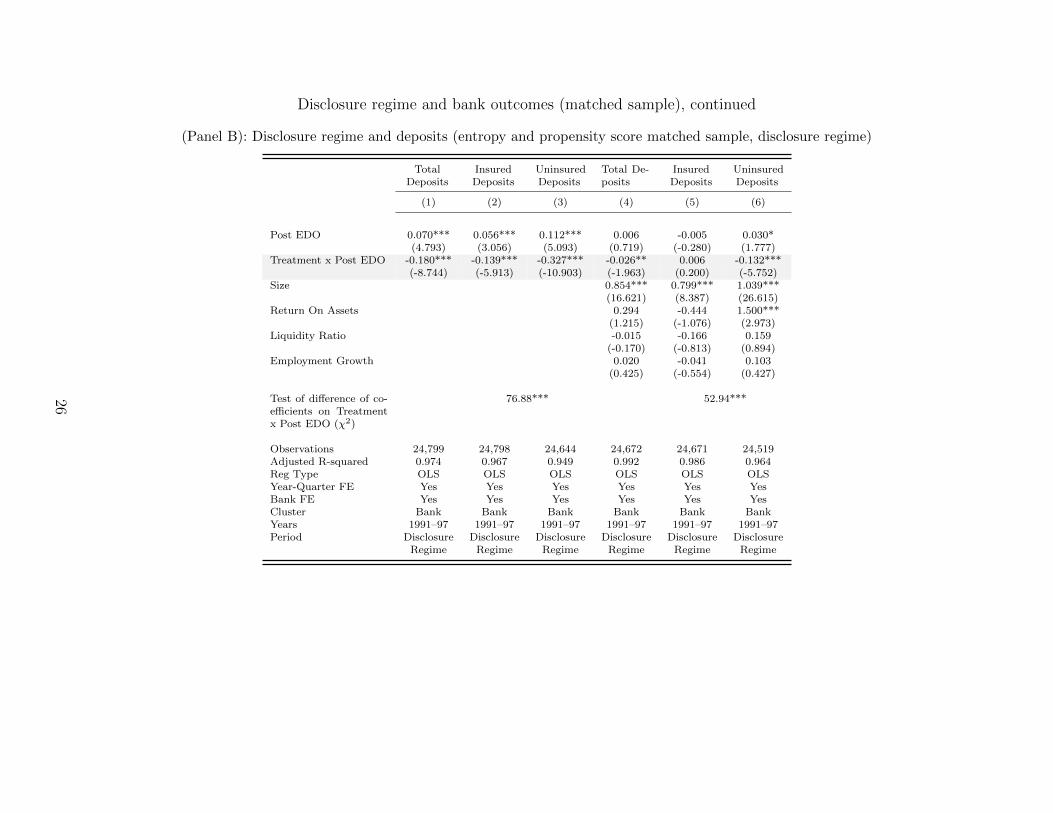
6.1. EDO disclosure and depositor reaction
If learning about enforcement actions leads depositors to exercise market discipline, we
would expect the change in the disclosure regime to result in higher withdrawals from de-
positors at banks that receive an EDO as depositors learn about issues at their bank. We
start by assessing the potential impact on all deposits and then distinguish deposits covered
by FDIC deposit insurance versus those that are not. Because the uninsured deposits are at
higher risk to bank failure, we expect uninsured depositors to withdraw funds more quickly
when concerns arise about the soundness of a bank receiving an EDO.
We match banks that receive an EDO to those that do not based on bank size (total as-
sets) and geographic location (county) to control for bank characteristics and local economic
where Yit refers to total deposits, insured deposits, and uninsured deposits, measured as
natural logarithms; Treatment is an indicator that takes the value of 1 for banks that
receive an EDO and 0 otherwise; and Post EDO takes the value of 1 for the 12 quarters after
the EDO has been received and 0 for the prior 12 quarters. (This window length is based
on the average length of an enforcement action.)33 Xiτ−1 is a vector of control variables,
including bank size (natural logarithm of total assets), profitability (measured as the return
on assets), and bank liquidity (measured as the ratio of liquid assets to total assets). We also
include county-level employment growth as a control for local economic conditions. Bank-
specific control variables are lagged by one quarter. We define the variables in more detail
in Appendix C. The terms αi and δt are bank and year-quarter fixed effects, respectively.
The full set of fixed effects subsumes the main effect of the Treatment indicator. Our main
coefficient of interest is β3, which measures the incremental effect of receiving an EDO on
deposits in the disclosure regime.
We present our findings in Table 8, Panel A, which shows total deposits decrease by 3.8%
(column 4). Uninsured deposits decline by 9.0% (column 6). We do not observe similar
results for insured deposits. This finding is consistent with uninsured depositors responding
to publicly disclosed enforcement actions and suggests that these depositors impose market
discipline on affected banks. Overall, our results are in line with those of Anbil (2018) and
32In this analysis, we cannot match on additional bank characteristics, because of the limited number ofbanks in a given county. We restrict our analyses of insured and uninsured deposits to the disclosure regimefrom the first quarter of 1991, due to lack of data availability in the pre-FIRREA period. For total deposits,we estimate this model for the whole sample. In robustness tests, we also match EDO banks in the tworegimes on EDO severity (measured as the time it takes a bank to exit an EDO) and find consistent results.
33As discussed in Section 3, in the (pre-) post-FIRREA period, the mean length of an EDO is (3.5) 2.3,and the median is (3.1) 2.0 years. In robustness analyses, we decrease the window size to eight quartersaround an EDO. Our results are robust to using shorter EDO windows.
28
Chen et al. (2018), who find uninsured depositors respond to the disclosure of bad news by
withdrawing their funds.
To more closely tie depositor response to the disclosure of enforcement actions, we inves-
tigate the press coverage of enforcement actions in the disclosure regime once EDOs become
publicly observable. We search the NewsBank archives for local newspapers covering all
banks that receive EDOs in our sample across all U.S. states and identify whether the news
of an EDO is covered by the media. Figure 4 shows significant variation across years in the
news coverage of EDOs. The indicator variable News Coverage takes the value of 1 if an
EDO receives news coverage by local media and 0 otherwise. We interact News Coverage
with our Post EDO indicator. As above, we control for bank characteristics and changes
in the local economic conditions and include bank and year-quarter fixed effects. With the
inclusion of bank fixed effects, the main effect of News Coverage indicator is subsumed.
We present our findings related to news coverage for banks that receive EDOs in Table 8,
Panel B. The results in column (6) indicate that uninsured deposits decrease by 13.9%
for banks whose EDOs are covered by the local news, relative to banks whose enforcement
actions are not. In Table 8, Panel C, we construct measures related to the intensity (the
number of news articles) and length (the number of days between the first and last news
articles) of news media coverage.34 We find that, conditional on being covered, depositor
reaction is greater for EDOs with more intense and lengthy coverage, consistent with the
argument that news coverage aids market discipline, motivating regulators to target counties
with higher news circulation. In additional analyses, we find that uninsured depositors react
incrementally more to EDO coverage in national news (as uninsured depositors are more
likely to be nonlocal). These findings tie depositors’ responses to the disclosure channel.
Furthermore, the evidence based on news coverage suggests that depositors were mostly
unaware of EDOs before FIRREA.
34To ensure that our search is robust, we impose the more restrictive condition that an EDO is covered inboth the NewsBank and Factiva archives. Our measures related to the intensity and length of news mediacoverage are based on EDO coverage in Factiva.
29
6.2. EDO disclosure and bank failure
Next, we study bank failure in the two regimes. As our findings above suggest, depositors
view the issuance of an EDO as a warning signal in the disclosure regime. Bank failure
without this early warning would bring into question the credibility of the regulator. We
use bank-failure data and a hazard model to estimate the probability that a bank fails in
quarter t, given that it has survived until quarter t− 1:
h(t) = h0(t)exp(β1Disclosure Regime+ β2Treatment
+ β3Treatment×Disclosure Regime+ βkXk),
(7)
where Treatment is an indicator variable that takes the value of 1 for banks that received
an enforcement action and 0 otherwise; and Disclosure Regime is an indicator variable
that equals 1 in the period after the change in regulation and 0 otherwise. The term Xk
is a vector of k control variables based on prior literature and includes size, capital ratio,
nonperforming assets, liquidity ratio, interest on deposits, loan portfolio composition, and
employment growth (Lane et al., 1986). We define our variables in more detail in Appendix
C.
Table 9, column (1) presents our findings. The coefficient on the Treatment × Disclosure
Regime indicator is positive and significant with a magnitude of 1.360, indicating banks that
received enforcement actions have a hazard of failure that is 36% higher in the disclosure
regime. A test that the sum of coefficients on Treatment and Treatment × Disclosure Regime
equals zero fails to reject the null (χ2 = 1.32, p-value = 0.2507). In untabulated results,
we separately estimate the coefficient on Treatment in the two regimes. The coefficients are
−1.536 and −0.380 in the nondisclosure and disclosure regimes, respectively. Both coeffi-
cients are highly statistically significant. These results indicate that, although EDO banks
are less likely to fail in both regimes, consistent with intervention by the regulator preventing
failure, they are relatively more likely to fail in the disclosure regime (as indicated by the
positive and significant coefficient on Treatment × Disclosure Regime in model (1)). Our
30
results are consistent with the explanation that regulators care about the public perception
of their actions and are more likely to issue EDOs to problem banks in the disclosure regime.
In Section 6.1, we show depositors react to information about enforcement actions. One
possibility is that depositors’ reaction could accelerate bank failure as they withdraw funds
from the affected banks. To assess whether the time to bank failure decreases in the disclosure
regime, we estimate the following accelerated-time model:
log(t) = β1Disclosure Regime+ β2Treatment
+ β3Treatment×Disclosure Regime+ βkXk + log(τ),
(8)
where t is the survival time for a bank, and the residual τ is assumed to have a Weibull
distribution. The remaining variables are defined above and described in more detail in
Appendix C.
Table 9, column (2) shows the results of estimating Equation 8. The coefficient for
Treatment×Disclosure Regime implies that, conditional on failure, banks that received an
EDO in the disclosure regime failed 74% (1−e−1.330) faster than banks that received an EDO
in the nondisclosure regime. This translates to an acceleration of failure by approximately
nine months.35 The signs of the coefficients indicate how the covariates affect logged survival
times. For instance, a positive coefficient on Capital Ratio indicates banks with higher
capital ratios have higher logged survival times.
Results in this section suggest EDOs are more strongly associated with bank failure in
the disclosure regime and, conditional on failure, bank failure occurs faster in the disclosure
regime. We conduct additional analyses to assess whether competition from thrifts could
have played a role. Using the measures of competition discussed in Section 5.1, we find that
35Unconditionally, the average number of months between receiving an EDO and bank failure is 29 in thepre-disclosure period for EDOs issued and terminated in that period. In the disclosure regime, this averagefalls to 15 months. A test that the sum of coefficients on Treatment and Treatment × Disclosure Regimeequals zero rejects the null (χ2 = 4.64, p-value = 0.0313), suggesting the two coefficients are significantlydifferent from each other.
31
EDO banks in counties with a higher share of risky loans made by thrifts (or higher share
of deposits held by thrifts) are not more likely to fail, relative to other EDO banks that do
not face the same competitive pressure from thrifts. In addition, our findings—that EDO
banks are relatively more likely to fail in the disclosure regime and fail sooner—continue to
hold. We present these findings in the online appendix, Table OA11. Overall, our results
are consistent with regulators becoming stricter in the disclosure regime.36
6.3. EDO disclosure and other bank outcomes
In this section, we investigate whether banks’ ability to lend and their capital and asset
quality vary with the change in disclosure regime. Disclosure increases the cost of receiving
an enforcement action, because funding providers may withdraw their capital. Furthermore,
disclosure increases the cost of forbearance, leading to regulators becoming stricter to pro-
tect their credibility. Therefore banks may respond to the increased market discipline and
reduced probability of receiving regulatory forbearance and improve their capital adequacy
and operating decisions to avoid an enforcement action.
To account for changes in the macroeconomic and enforcement environments, we create
a matched control sample (matched on size and geography) that consists of banks similar
to treated banks based on observable characteristics. Banks that receive an EDO at a point
in time form our treatment sample, and those that do not receive an EDO form our control
sample. Using the matched banks, we create a stacked panel in which each EDO bank and
its control bank have 24 quarters of data: twelve quarters before the receipt of an EDO and
12 quarters after, including the quarter when an EDO is received (Post EDO). We introduce
an indicator variable for banks that receive an EDO (Treatment) and estimate the following
36One concern is that post-FIRREA enforcement actions may be more severe. However, our results inTable 2 indicate that, on average, bank quality improved in the post-FIRREA period. Therefore any increasein the severity of enforcement actions could be tied to regulators’ changing behavior as opposed to decliningbank fundamentals. Another concern is that the disclosure regime changes regulators’ ability to forbear.An insignificant coefficient on Disclosure Regime in model (1) suggests no change in the likelihood of bankfailure for non-EDO banks, which is consistent with no change in regulatory forbearance with respect tobank closures for these banks. However, we cannot rule out the effect of changes in regulatory forbearancefor EDO banks.
where Yit corresponds to the ratio of loans to total assets (Loans), log of total deposits
(Total Deposits), total equity to total assets (Capital Ratio), and total nonperforming assets
to total assets (Nonperforming Assets); θ6 is the parameter of interest, which measures the
effect of the change in the disclosure regime on banks that receive an EDO, relative to control
banks. We expect θ6 to be significant if our outcome variables are associated with the change
in disclosure regime. We include the same control variables as before and use year-quarter
and bank-level fixed effects to account for unobserved heterogeneity. The main effect on
Treatment is subsumed by the inclusion of bank-level fixed effects. We present our findings
in Table 10. As the table shows, affected banks experience a 3% decline in total deposits
(column 4), 0.9% improvement in capital ratios (column 6), and 0.7% increase in the quality
of their assets (column 8), relative to control banks.37
6.4. Economic trends
Finally, we conduct additional robustness tests to assess the impact of changing economic
trends by estimating our main results in various subsamples. We expand the post-FIRREA
period to 2007 (prior to the financial crisis) and re-estimate Equation 1 for consecutive 16-
quarter windows in the pre- and post-FIRREA periods. Specifically, we conduct a rolling-
window analysis where, for each 16-quarter window in the pre-disclosure period, we select all
37We use other matching techniques (entropy and propensity-score matching) to construct alternativematched samples, as shown in the online appendix, Table OA12. Our main findings remain robust. Ourresults are also robust and qualitatively similar when using eight-quarter EDO windows.
possible consecutive 16-quarter windows in the disclosure period. We then re-estimate the
Cox hazard models for all possible combinations of pre- and post-FIRREA periods, allowing
us to assess the sensitivity of coefficients to the choice of sample period.38
The results of this analysis are presented in Figure OA6 and Figure OA7 of the online
appendix.39 The horizontal axis in the figure corresponds to the starting point of the 16
consecutive quarters in the post-disclosure period. For example, the coefficient estimate for
the analysis comparing pre-FIRREA rolling window sample to the post-FIRREA 1990–1994
sample corresponds to 1990 in the graph. Each line in the figure corresponds to a different
16-quarter window in the pre-FIRREA period. Plots of coefficients of the Disclosure Regime
indicator are presented in Panel A. The coefficient values are consistently positive over the
entire sample period, suggesting that, controlling for covariates, regulators are more likely to
issue enforcement actions in the disclosure regime than in the nondisclosure regime. Panel
B, Panel C, and Panel D plot the coefficients of Capital Ratio×Disclosure Regime, Nonper-
forming Assets×Disclosure Regime, and Return On Assets×Disclosure Regime. Although
the graphs show a trend over time, the figures are consistent with our findings that, relative
to the nondisclosure regime, regulators in the disclosure regime are more likely to issue en-
forcement actions against banks that have lower capital ratios, higher nonperforming assets,
and lower profitability.
7. Conclusion
We use the setting of the 1989 Financial Institutions Reform, Recovery, and Enforcement
Act, which mandated public disclosure of bank enforcement actions, to study how regulators
respond to the public scrutiny of their actions. A key feature of our study is that we
identify EDOs issued in the nondisclosure regime through termination documents issued in
38In this analysis, we drop year indicators from the model because our objective is to assess the variationin coefficients over time.
39Figure OA6 shows all possible combinations of the consecutive sixteen-quarter windows, whereas Fig-ure OA7 shows the graphs for only the first and last pre-FIRREA 16-quarter windows (but all post-FIRREAwindows) with 95% confidence intervals.
the disclosure period and a sample of EDOs from the U.S. National Archives.
We find that the change in disclosure regime is associated with several changes in regu-
lators’ supervisory actions. In particular, we find that relative to the pre-FIRREA period,
regulators issue more EDOs, intervene sooner, and seem to rely more on publicly observable
signals in the disclosure regime. We also find that EDO documents become less informative
and more boilerplate following the regime change. These results provide suggestive evidence
that regulators respond to the public scrutiny of their actions.
FIRREA included several changes to regulatory enforcement which could confound our
inferences. To tie our findings to the disclosure channel, we study how our results vary with
news circulation. Because banks’ funding providers are more likely to learn about issues at
the bank in regions with higher news circulation, regulators’ credibility and reputation would
be adversely affected if they did not issue timely enforcement actions in these regions. Market
discipline is also likely to be higher in regions with higher news circulation because banks’
funding providers learn about EDOs in these regions. Accordingly, we find that regulators
issue more EDOs and intervene sooner in regions with higher news circulation. We also
evaluate other potentially confounding events, including the resolution of the S&L crisis and
FDICIA, and find robust results. Finally, we find that the increased market discipline and
lower likelihood of forbearance in the disclosure regime is associated with improved bank
outcomes, even though uninsured deposits decline and bank failure accelerates.
While we show that our findings are robust, our results are based on one regulatory event
in the banking sector and limited to the sample of enforcement actions we could identify.
Nonetheless, our analyses are informative for situations where regulators face the choice of
whether to disclose enforcement efforts. For example, the implications of our study may
extend to a broad range of outcomes as diverse as restaurant hygiene and the disclosure of
SEC comment letters (Jin & Leslie, 2003; Duro et al., 2019; Dechow et al., 2016). We look
forward to future research on the impact of observability of regulatory actions on enforcement
in other settings.
35
References
Acharya, V. V., & Ryan, S. G. (2016). Banks’ financial reporting and financial systemstability. Journal of Accounting Research, 54 , 277–340.
Agarwal, S., Lucca, D., Seru, A., & Trebbi, F. (2014). Inconsistent regulators: Evidencefrom banking. Quarterly Journal of Economics , 129 , 889–938.
Altamuro, J., & Beatty, A. (2010). How does internal control regulation affect financialreporting? Journal of Accounting and Economics , 49 , 58–74.
Anbil, S. (2018). Managing stigma during a financial crisis. Journal of Financial Economics ,130 , 166–181.
Balakrishnan, K. (2018). Information costs and financial reintermediation: Evidence fromcorporate frauds. Working paper.
Beatty, A., & Liao, S. (2014). Financial accounting in the banking industry: A review ofthe empirical literature. Journal of Accounting and Economics , 58 , 339–383.
Benston, G., & Kaufman, G. (1997). FDICIA after five years. Journal of Economic Per-spectives , 11 , 139–158.
Bernanke, B. S. (2013). The Federal Reserve and the Financial Crisis . Princeton: PrincetonUniversity Press.
Bischof, J., & Daske, H. (2013). Mandatory disclosure, voluntary disclosure, and stockmarket liquidity: Evidence from the EU bank stress tests. Journal of Accounting Research,51 , 997–1029.
Bishop, R. L., Sharma, K., & Brazee, R. J. (1980). Determinants of newspaper circulation: Apooled cross-sectional time-series study in the United States, 1850-1970. CommunicationResearch, 7 , 3–22.
Black, W. K. (1990). Ending our forebearers’ forbearances: FIRREA and supervisory good-will. Stanford Law & Policy Review , 2 , 102–116.
Bozanic, Z., Roulstone, D., & Van Buskirk, A. (2018). Management earnings forecasts andother forward-looking statements. Journal of Accounting and Economics , 65 , 1–20.
Bushman, R. M., & Williams, C. D. (2012). Accounting discretion, loan loss provisioning,and discipline of banks’ risk-taking. Journal of Accounting and Economics , 54 , 1–18.
Chen, Q., Goldstein, I., Huang, Z., & Vashishtha, R. (2018). Bank transparency and depositflows. Working paper.
Cleves, M., Gould, W., Gould, W. W., Gutierrez, R., & Marchenko, Y. (2008). An intro-duction to survival analysis using Stata. Stata press.
36
Costello, A. M., Granja, J., & Weber, J. (2019). Do strict regulators increase the trans-parency of banks? Journal of Accounting Research, 57 , 603–637.
Curry, T. J., O’Keefe, J. P., Coburn, J., & Montgomery, L. (1999). Financially distressedbanks: How effective are enforcement actions in the supervision process? FDIC BankingReview , 12 , 1–18.
Dechow, P., Lawrence, A., & Ryans, J. (2016). SEC comment letters and insider sales.Accounting Review , 91 , 401–439.
Delis, M. D., Staikouras, P. K., & Tsoumas, C. (2016). Formal enforcement actions andbank behavior. Management Science, 63 , 959–987.
Diamond, D., & Dybvig, P. (1983). Bank runs, deposit insurance, and liquidity. Journal ofPolitical Economy , 91 , 401–419.
Dinc, I. S., & Gupta, N. (2011). The decision to privatize: Finance and politics. Journal ofFinance, 66 , 241–269.
Docking, D. S., Hirschey, M., & Jones, E. (1997). Information and contagion effects of bankloan-loss reserve announcements. Journal of Financial Economics , 43 , 219–239.
Dunaway, J., Branton, R. P., & Abrajano, M. A. (2010). Agenda setting, public opinion,and the issue of immigration reform. Social Science Quarterly , 91 , 359–378.
Duro, M., Heese, J., & Ormazabal, G. (2019). The effect of enforcement transparency:Evidence from SEC comment-letter reviews. Review of Accounting Studies , 24 , 780–823.
Eisenbach, T. M., Haughwout, A., Hirtle, B., Kovner, A., Lucca, D. O., & Plosser, M. C.(2017). Supervising large, complex financial institutions: What do supervisors do? Work-ing paper.
Ellahie, A. (2013). Capital market consequences of EU bank stress tests. Working paper.
Flannery, M. J. (1998). Using market information in prudential bank supervision: A reviewof the U.S. empirical evidence. Journal of Money, Credit and Banking , 30 , 273–305.
Flannery, M. J., Kwan, S. H., & Nimalendran, M. (2013). The 2007–2009 financial crisisand bank opaqueness. Journal of Financial Intermediation, 22 , 55–84.
Gentzkow, M., Shapiro, J. M., & Sinkinson, M. (2011). The effect of newspaper entry andexit on electoral politics. American Economic Review , 101 , 2980–3018.
Getter, D. (2014). U.S. implementaion of the basel capital regulatory framework. Congres-sional Research Service.
Gilbert, R. A., & Vaughan, M. D. (2001). Do depositors care about enforcement actions?Journal of Economics and Business , 53 , 283–311.
37
Goldstein, I., & Leitner, Y. (2018). Stress tests and information disclosure. Journal ofEconomic Theory , 177 , 34–69.
Goldstein, I., & Sapra, H. (2014). Should banks’ stress test results be disclosed? An analysisof the costs and benefits. Foundations and Trends in Finance, 8 , 1–54.
Gopalan, Y., Kalda, A., & Manela, A. (2017). Hub-and-spoke regulation and bank leverage.Working paper.
Granja, J. (2018). Disclosure regulation in the commercial banking industry: Lessons fromthe national banking era. Journal of Accounting Research, 56 , 173–216.
Granja, J., & Leuz, C. (2019). The death of a regulator: Strict supervision, bank lendingand business activity. Working paper.
Hansen, S., McMahon, M., & Prat, A. (2017). Transparency and deliberation within theFOMC: A computational linguistics approach. Quarterly Journal of Economics , 133 ,801–870.
Happer, C., & Philo, G. (2013). The role of the media in the construction of public beliefand social change. Journal of Social and Political Psychology , 1 , 321–336.
He, Z., & Manela, A. (2016). Information acquisition in rumor-based bank runs. Journal ofFinance, 71 , 1113–1158.
Hirtle, B., Kovner, A., & Plosser, M. (2020). The impact of supervision on bank performance.Journal of Finance, 75 , 2765–2808.
Holmstrom, B. (1999). Managerial incentive problems: A dynamic perspective. Review ofEconomic Studies , 66 , 169–182.
Jin, G. Z., & Leslie, P. (2003). The effect of information on product quality: Evidence fromrestaurant hygiene grade cards. Quarterly Journal of Economics , 118 , 409–451.
Kandrac, J., & Schlusche, B. (2020). The effect of bank supervision and examination on risktaking: Evidence from a natural experiment. Review of Financial Studies , Forthcoming .
Kane, E. J. (1989). The high cost of incompletely funding the FSLIC shortage of explicitcapital. Journal of Economic Perspectives , 3 , 31–47.
Kedia, S., & Rajgopal, S. (2011). Do the SEC’s enforcement preferences affect corporatemisconduct? Journal of Accounting and Economics , 51 , 259–278.
Kleymenova, A. (2018). Consequences of mandated bank liquidity disclosures. Workingpaper.
Lane, W. R., Looney, S. W., & Wansley, J. W. (1986). An application of the Cox proportionalhazards model to bank failure. Journal of Banking and Finance, 10 , 511–531.
38
Lang, M., & Stice-Lawrence, L. (2015). Textual analysis and international financial reporting:Large sample evidence. Journal of Accounting and Economics , 60 , 110–135.
Lehavy, R., Feng, L., & Merkley, K. (2011). The effect of annual report readability on analystfollowing and the properties of their forecasts. Accounting Review , 86 , 1087–1115.
Li, F. (2008). Annual report readability, current earnings, and earnings persistence. Journalof Accounting and Economics , 45 , 221–247.
Li, F. (2010). Textual analysis of corporate disclosures: A survey of the literature. Journalof Accounting Literature, 29 , 143–165.
Liu, W.-M., & Ngo, P. T. (2014). Elections, political competition and bank failure. Journalof Financial Economics , 112 , 251–268.
Malloy, M. P. (1989). Nothing to fear but FIRREA itself: Revising and reshaping theenforcement process of federal bank regulation. Ohio State Law Journal , 50 , 1117–1157.
McCombs, M. (2018). Setting the agenda: Mass media and public opinion. Cambridge: JohnWiley & Sons.
Meade, E. E., & Stasavage, D. (2008). Publicity of debate and the incentive to dissent:Evidence from the US Federal Reserve. Economic Journal , 118 , 695–717.
Miller, B. (2010). The effect of reporting complexity on small and large investor trading.Accounting Review , 85 , 2107–2143.
Morris, S., & Shin, H. S. (2002). Social value of public information. American EconomicReview , 92 , 1521–1534.
Norris, P., Kern, M., & Just, M. (2004). Framing terrorism: The news media, the governmentand the public. New York: Routledge.
Peltzman, S. (1976). Toward a more general theory of regulation. The Journal of Law andEconomics , 19 , 211–240.
Peristiani, S., Morgan, D. P., & Savino, V. (2010). The information value of the stress testand bank opacity. Working paper.
Roman, R. A. (2016). Enforcement actions and bank loan contracting. Economic Review(Kansas City), 101 , 69–101.
Singer, J. D., & Willett, J. B. (2003). Applied longitudinal data analysis: Modeling changeand event occurrence. New York: Oxford University Press.
Slovin, M. B., Sushka, M. E., & Polonchek, J. A. (1999). An analysis of contagion andcompetitive effects at commercial banks. Journal of Financial Economics , 54 , 197–225.
Srinivas, V., Byler, D., Wadhwani, R., Ranjan, A., & Krishna, V. (2015). Enforcementactions in the banking industry: Trends and lessons learned. Deloitte University Press.
39
Stigler, G. J. (1971). The theory of economic regulation. The Bell Journal of Economicsand Management Science, 2 , 3–21.
Stiglitz, J. (2009). Regulation and failure. New Perspectives on Regulation, (pp. 13–25).
Thakor, A. (2015). Strategic information disclosure when there is fundamental disagreement.Journal of Financial Intermediation, 24 , 131–153.
Tomy, R. E. (2019). Threat of entry and the use of discretion in banks’ financial reporting.Journal of Accounting and Economics , 67 , 1–35.
Wheeler, P. B. (2019). Loan loss accounting and procyclical bank lending: The role of directregulatory actions. Journal of Accounting and Economics , 67 , 463–495.
40
Appendix A. FDIC’s process for issuing Cease and Desist orders
Source: FDIC Enforcement Decisions Volume I published by Prentice Hall (1988); authors’ reading of enforcement actions and interviews.
41
Appendix B. Events leading up to the disclosure of enforcement actions
August 1981 Ronald Reagan appoints William M. Isaac as chairman of the FDIC. In his first
10 months (August 1981–June 1982), Isaac oversees the disbursement of over $1.5
billion to satisfy in deposit insurance claims, three times as much as the FDIC
had paid out in its first 47 years of existence. [1]
April 3, 1983 In an environment of mounting bank failures, William M. Isaac argues for regu-
latory reform by providing investors with information regarding banks’ problem
loans and interest rate vulnerability. [2]
May 1984 Continental Illinois National Bank, with $40 billion in assets, fails. It is the largest
bank failure in the FDIC’s history at the time. [3]
February 11, 1985 The FDIC proposes weekly disclosure of the names of banks and employees cited
in enforcement actions against the 8,850 banks it regulates and solicits comments
from the public. [4]
February - May 1985 The FDIC receives 768 comment letters regarding the February proposal, with
only 57 favoring the agency’s plan. [5]
May 6, 1985 The FDIC votes unanimously to disclose when the FDIC enters a final enforce-
ment action against a bank, rolling back, in part, its February plan. The new rule
is set to take effect on January 1, 1986. [6]
October 1, 1985 William M. Isaac leaves the FDIC; L. William Seidman is appointed as chairman.
[7]
December 11, 1985 The FDIC prepares a proposal to defer the January 1, 1986, implementation
of disclosure policy. Seidman favors postponement in order to move forward in
conjunction with the Comptroller of the Currency and the Federal Reserve Board.
[8]
42
March 8, 1989 FDIC Chairman L. William Seidman testifies before the House Banking Com-
mittee’s Subcommittee on Financial Institutions, stating that the proposed Bush
bailout plan for savings institutions does not give the FDIC enough power to act
expediently in revoking deposit insurance of member banks, nor does it provide
enough independence to the FDIC since the plan gives the President authority to
remove the FDIC’s chairman and vice chairman at will. [9]
April 6, 1989 The House Banking subcommittee amends the Bush Administration’s rescue plan
for the savings industry, expanding the FDIC’s jurisdiction and insulating it from
White House intervention by prohibiting the President from removing the chair-
man before his four-year term expires. [10]
August 9, 1989 George H.W. Bush signs the Financial Institutions Reform, Recovery, and En-
forcement Act (FIRREA) of 1989. FIRREA expands the enforcement authority
of bank regulators, giving regulators expanded cease-and-desist authority and the
authority to terminate insured banks’ coverage more expediently. Regulators are
also given the authority to temporarily suspend deposit insurance to a bank with
no tangible capital. Enforcement actions are made public beginning with this
regulation. [11]
[1] Jack Anderson and Dale Van Atta, “Heroics at the FDIC,” The Washington Post, August 4, 1985.
[2] William M. Isaac, “Forum: A Challenge for Financial Regulators Instilling Discipline in Banks,” The New York Times, April
Gunning FOG Index Readability index corresponds to
the years of education required
to understand a given document
(Li, 2008).
SNL, National
Archives and au-
thors’ calculations
(Average words per sentence +
percent of complex words) x 0.4
44
Insured Deposits Natural logarithm of FDIC-
insured deposits (based on Chen
et al. (2018) and Balakrishnan
(2018)).
Call Reports and au-
thors’ calculations
log(RCON2702)
Interest on Deposits Ratio of interest on deposits to
average deposits.
Call Reports RIAD4170 / RCFD2200
Liquidity Ratio Ratio of cash and cash equiva-
lents to lagged total assets, where
cash is defined as the sum of
interest-bearing balances, non-
interest bearing balances, and
currency and coin.
Call Reports (RCFD0071 + RCFD0081) /
RCFD2170
Loans Net total loans scaled by lagged
total assets.
Call Reports (RCFD1400 - RCFD3123 -
RCFD2123) / RCFD2170
National Coverage Natural logarithm of the number
of articles covering an EDO in
the national newspapers.
NewsBank and Fac-
tiva
News Circulation The number of newspaper copies
divided by the total population
at the county level.
Gentzkow et al. (2011)
News Coverage Indicator variable which takes
the value of 1 if an EDO for a
given bank is covered by the lo-
cal media and 0 otherwise.
NewsBank
News Coverage Intensity Natural logarithm of the number
of articles that cover the EDO.
NewsBank and Fac-
tiva
News Coverage Length Natural logarithm of the number
of days between the first and last
news article.
NewsBank and Fac-
tiva
Nonperforming Assets Ratio
(NPA)
The sum of nonaccruing loans
and accruing loans past 90 days
divided by lagged net total loans.
Call Reports (RCFD1403+RCFD1407) /
(RCFD1400 - RCFD3123 -
RCFD2123)
Number of words Natural logarithm of the total
number of words in a document
SNL, National
Archives and au-
thors’ calculations
Numeric intensity Ratio of numerical characters in
a document relative to the num-
ber of alphabetical characters
(Li, 2010).
SNL, National
Archives and au-
thors’ calculations
Total numerical characters/total
alphabetical characters
Per Capita Income Natural logarithm of the level of
per capital personal income
Bureau of Economic
Analysis
log(Per capita personal income)
Post Crisis Indicator variable which takes
the value of 1 for quarters after
the Great Recession (2009Q3–
2017Q4) and 0 otherwise.
NBER
45
Post EDO Indicator variable which takes
the value of 1 for 12 quarters
after the EDO was received for
treatment banks and matched
control banks and 0 for the 12
quarters prior.
SNL and authors’ cal-
culations
Real Estate Loans Ratio of real estate loans to net
total loans.
Call Reports RCFD1410 / (RCFD1400 -
RCFD3123 - RCFD2123)
Return on Assets (ROA) Net income divided by average
total assets.
Call Reports RIAD4340 / RCFD2170
Size Total assets of the bank (or nat-
ural log of total assets)
Call Reports RCFD2170
Thrifts’ Share of Risky Lending Thrifts total risky lending at a
county level divided by the share
of total risky lending by thrifts
and commercial banks in the
same county level. Risky loans
are defined as the sum of CRE
loans, ADC loans and Service
corporate investments (Kandrac
& Schlusche, 2020).
FHLB 770, FHLBB
1313 and Call Reports
(SVGL1441 + SVGL0136
+ SVGL1448 + SVGL1449
+ SVGL1451 + SVGL1534
+ SVGL0035 + SVGL2130)
/((SVGL1441 + SVGL0136
+ SVGL1448 + SVGL1449
+ SVGL1451 + SVGL1534 +
SVGL0035 + SVGL2130) +
(RCON1415 + RCON1420 +
RCON1460 + RCON1480 +
RCON2130)
Total Deposits Natural log of total deposits. Call Reports log(RCFD2200)
Treatment Indicator variable which takes
the value of 1 if a bank has re-
ceived an EDO and 0 otherwise
SNL and authors’ cal-
culations
Uninsured Deposits Natural log of deposits not cov-
ered by the FDIC insurance
(based on Chen et al. (2018) and
Balakrishnan (2018)).
Call Reports and au-
thors’ calculations
log(RCFD2200 - RCON2702)
Urbanization The ratio of nonagricultural pop-
ulation to total population
1990 Decennial Census 1- (P0060004 (Rural: Farm) /
P0010001 (Persons Total))
46
Figure 1: Distribution of EDO length
This figure shows the kernel density function for the length of an EDO in the nondisclosure (pre-FIRREA)and disclosure (post-FIRREA) regimes. Length of an EDO is defined as the number of days from theissuance of an EDO to its termination. The dotted line represents EDOs that were issued and terminated inthe nondisclosure regime (1983–84). The dashed line represents EDOs that were issued in the nondisclosureregime but terminated in the disclosure regime (1985–89). The solid line represents EDOs issued andterminated in the disclosure regime.
47
Figure 2: Number and the average length of enforcement actions (EDO)
Figure 3: Number of enforcement actions by primary federal regulator
48
Figure 4: News coverage of EDOs
This figure shows the news coverage of EDOs for banks that received an EDO during the sample period of1990 to 1997. The bars refer to the percentage of EDOs that received news coverage in a given year. Thenumbers above the bars represent the total number of EDOs received by banks in that year.
49
Table 1: Bigrams and textual characteristics of enforcement actions’ content
This table presents descriptive evidence of the content and textual characteristics of severe enforcement actions received by banks from the FDIC in1983–1984 and Q3 1989–2017. Columns (2) to (4) show the most commonly used two-word phrases in a given year (bigrams) and their correspondingfrequencies. Column (5) shows the total number of documents that could be read using machine reading techniques. Column (6) shows the averagenumber of words per document. Column (7) presents the average FOG index for EDOs in a given year, with higher values indicating more complexity.Column (8) shows the average values of the Flesch Grade Level readability index corresponding to the years of education required to understand agiven body of text. Column (9) shows the average percentage of boilerplate language used.
Total supervisory authorities 0.68% deposit insurance 0.62% federal deposit 0.62% 2,546 1,836 19.80 16.90 0.5556
50
Table 2: Descriptive statistics
This table presents financial characteristics for our sample of banks in the disclosure and nondisclosureregimes from 1983 to 1997. Panel A presents the characteristics for EDO bank-quarters, Panel B presentsthe characteristics for non-EDO bank-quarters, and Panel C presents differences in means between non-EDOand EDO banks in the two regimes. The differences in characteristics are tested using two-sample t-tests ofthe difference in means. All variables are winsorized at the 1% and 99% tails of their respective distributionsin each sample year. Variable definitions are provided in Appendix C. ∗p < 0.1; ∗∗p < 0.05; ∗∗∗p < 0.01(two-tailed).
Panel A: Descriptive statistics for EDO bank-quarters
Nondisclosure Regime Disclosure Regime
N Mean Sd N Mean Sd Difference (t-statistic)
(1) (2) (2) - (1)
Total Deposits 265 10.154 1.012 917 11.013 1.245 0.859*** (10.291)Loans to Total Assets Ratio 265 0.589 0.096 917 0.594 0.133 0.005 (0.564)Capital Ratio 265 0.062 0.022 917 0.070 0.034 0.008*** (3.417)Nonperforming Assets Ratio 265 0.085 0.058 917 0.056 0.063 -0.029*** (-6.634)Size 265 10.248 1.020 917 11.116 1.262 0.868*** (10.276)Return On Assets 265 -0.010 0.020 917 -0.005 0.015 0.005*** (4.422)Liquidity Ratio 265 0.082 0.046 917 0.067 0.043 -0.015*** (-5.095)Insured Deposits 729 10.771 1.150Uninsured Deposits 728 9.441 1.585
Panel B: Descriptive statistics for non-EDO bank-quarters
Nondisclosure Regime Disclosure Regime
N Mean Sd N Mean Sd Difference (t-statistic)
(3) (4) (4) - (3)
Total Deposits 345,473 10.475 1.226 326,012 10.882 1.288 0.407*** (132.929)Loans to Total Assets Ratio 345,819 0.509 0.143 326,394 0.532 0.154 0.023*** (63.348)Capital Ratio 345,821 0.092 0.054 326,395 0.100 0.059 0.008*** (59.084)Nonperforming Assets Ratio 345,211 0.027 0.034 325,492 0.015 0.045 -0.012*** (-126.952)Size 345,821 10.611 1.222 326,395 11.043 1.283 0.432*** (141.376)Return On Assets 344,059 0.005 0.014 325,405 0.007 0.016 0.002*** (54.209)Liquidity Ratio 345,819 0.089 0.071 326,394 0.061 0.053 -0.028*** (-182.514)Insured Deposits 258,800 10.653 1.259Uninsured Deposits 257,520 9.253 1.584
51
Table 2: Descriptive statistics, continued
Panel C: Descriptive statistics for differences between non-EDO and EDO bank-quarters
Total Deposits 0.321*** (4.250) -0.131*** (-3.071)Loans to Total Assets Ratio -0.080*** (-9.093) -0.062*** (-12.233)Capital Ratio 0.030*** (8.928) 0.030*** (15.491)Nonperforming Assets Ratio -0.058*** (-27.800) -0.041*** (-27.634)Size 0.363*** (4.839) -0.073* (-1.726)Return On Assets 0.015*** (17.217) 0.012*** (22.120)Liquidity Ratio 0.007* (1.643) -0.006*** (-3.014)Insured Deposits -0.118*** (-2.539)Uninsured Deposits -0.188*** (-3.198)
52
Table 3: Likelihood of receiving an enforcement action
This table presents the coefficients from estimating models of the regulators’ decision to issue an enforcement action during theperiod of 1983 to 1997. Columns (1)–(6) present the results from the estimation of a Cox proportional-hazards model. Column(7) presents the results from the estimation of an accelerated-time model. The variable Disclosure Regime takes the value of 1 forthe quarters after the introduction of FIRREA in Q3 1989 and 0 otherwise. To mitigate the effects of extreme observations, allcontinuous variables are winsorized at the 1% and 99% tails of their respective distributions in each sample year. All variables arelagged by one quarter and defined in Appendix C. The z-statistics are presented in parentheses. ∗p < 0.1; ∗∗p < 0.05; ∗∗∗p < 0.01(two-tailed).
Capital Ratio x Disclosure Regime -5.884** 3.635(-2.206) (0.970)
Nonperforming Assets x Disclosure Regime 7.032*** 4.670**(4.731) (2.283)
Return On Assets x Disclosure Regime -22.688*** -17.733***(-4.847) (-2.595)
Liquidity Ratio x Disclosure Regime 0.566 0.527(0.433) (0.404)
Observations 685,346 685,346 685,346 685,346 685,346 685,346 685,346Wald χ2 2828*** 2940*** 2989*** 2989*** 2828*** 3074*** 1557***Reg Type Cox Hazard Cox Hazard Cox Hazard Cox Hazard Cox Hazard Cox Hazard Weibull AFTStrata Year Year Year Year Year Year YearCluster Bank Bank Bank Bank Bank Bank BankYears 1983–97 1983–97 1983–97 1983–97 1983–97 1983–97 1983–97Period All All All All All All All
53
Table 4: Changes in the textual content of enforcement actions
This table presents changes in the textual content of enforcement actions using textual analysis of severe enforcement actions issuedby the FDIC, Federal Reserve and OCC for the period 1983–1984 and Q3 1989–1997. Column (5) contains only FDIC severeenforcement actions. The indicator Disclosure Regime takes the value of 1 for the quarters after the introduction of FIRREA inQ3 1989 and 0 otherwise. To mitigate the effects of extreme observations, all continuous variables are winsorized at the 1% and99% tails of their respective distributions in each sample year. All variables are lagged by one quarter and defined in AppendixC. The t-statistics are presented in parentheses. ∗p < 0.1; ∗∗p < 0.05; ∗∗∗p < 0.01 (two-tailed).
Observations 599 599 599 599 296Adjusted R-squared 0.111 0.404 0.313 0.069 0.104Reg Type OLS OLS OLS OLS OLSYear-Quarter FE No No No No NoBank FE No No No No NoCluster Year Year Year Year YearYears 1983–97 1983–97 1983–97 1983–97 1983–97Period All All All All All
54
Table 5: News circulation and the likelihood of receiving an enforcement action
This table presents the coefficients from estimating models of the regulators’ decision to issue an enforcementaction during the period of 1983 to 1997. Columns (1) to (3) present the results from estimating a Coxproportional-hazards model, whereas columns (4) and (5) present the results from an accelerated-time model.The indicator Disclosure Regime takes the value of 1 for the quarters after the introduction of FIRREA in Q31989 and 0 otherwise. News Circulation is a continuous measure of the county-level newspaper readership.To mitigate the effects of extreme observations, all continuous variables are winsorized at the 1% and 99%tails of their respective distributions in each sample year. All variables are lagged by one quarter and definedin Appendix C. The z-statistics are presented in parentheses. ∗p < 0.1; ∗∗p < 0.05; ∗∗∗p < 0.01 (two-tailed).
Disclosure Regime x Employment Growth -6.763*** 4.311***(-3.061) (3.156)
Disclosure Regime x Per Capita Income 1.360*** -0.933***(3.447) (-3.759)
Disclosure Regime x Urbanization 6.272*** -4.012***(4.492) (-4.127)
Observations 685,338 685,338 685,338 685,338 685,338Wald χ2 2927*** 2928*** 2987*** 1663*** 1932***Reg Type Cox Hazard Cox Hazard Cox Hazard Weibull AFT Weibull AFTStrata Year Year Year Year YearCluster Bank Bank Bank Bank BankYears 1983–97 1983–97 1983–97 1983–97 1983–97Period All All All All All
55
Table 6: Competition from thrifts
This table presents the effect of competition from thrifts on the likelihood of receiving an EDO and EDO content. Panel A presentsthe coefficients from estimating models of the regulators’ decision to issue a severe enforcement action. Columns (1)–(7) presentthe results from estimating a Cox proportional-hazards model and columns (8)–(9) present the results from an accelerated-timemodel. Panel B shows the impact on EDO content using OLS estimation. The indicator Disclosure Regime takes the value of 1for the quarters after the introduction of FIRREA in Q3 1989 and 0 otherwise. Thrifts’ Share of Risky Lending is a proportion ofrisky loans held by thrifts in a given county where an EDO bank is headquartered lagged by one quarter. To mitigate the effectsof extreme observations, all continuous variables are winsorized at the 1% and 99% tails of their respective distributions in eachsample year. All variables are lagged by one quarter and defined in Appendix C. The z-statistics (Panel A) and t-statistics (PanelB) are presented in parentheses. ∗p < 0.1; ∗∗p < 0.05; ∗∗∗p < 0.01 (two-tailed).
Panel A: Likelihood of receiving an EDO, competition from thrifts in risky lending
Capital Ratio x Disclosure Regime -6.127** 3.631(-2.260) (0.949)
Nonperforming Assets x Disclosure Regime 7.736*** 5.464***(5.185) (2.646)
Return on Assets x Disclosure Regime -23.082*** -16.247**(-4.838) (-2.309)
Liquidity Ratio x Disclosure Regime 0.481 0.318(0.363) (0.243)
Thrifts’ Share of Risky Lending x Disclosure Regime 1.756*** 1.683*** -1.025***(3.979) (3.800) (-3.071)
Observations 661,792 661,792 661,792 661,792 661,792 661,792 661,792 661,792 661,792Wald χ2 2811*** 2929*** 3004*** 2992*** 2811*** 2848*** 3117*** 1431*** 1572***Reg Type Cox Hazard Cox Hazard Cox Hazard Cox Hazard Cox Hazard Cox Hazard Cox Hazard Weibull AFT Weibull AFTStrata Year Year Year Year Year Year Year Year YearCluster Bank Bank Bank Bank Bank Bank Bank Bank BankYears 1983–97 1983–97 1983–97 1983–97 1983–97 1983–97 1983–97 1983–97 1983–97Period All All All All All All All All All
56
Table 6: Competition from thrifts, continued
Panel B: Changes in the textual content of enforcement actions
Observations 592 592 592 592 592 592 592 592 289 289Adjusted R-squared 0.106 0.105 0.401 0.401 0.310 0.311 0.070 0.068 0.098 0.105Reg Type OLS OLS OLS OLS OLS OLS OLS OLS OLS OLSYear-Quarter FE No No No No No No No No No NoBank FE No No No No No No No No No NoCluster Year Year Year Year Year Year Year Year Year YearYears 1983–97 1983–97 1983–97 1983–97 1983–97 1983–97 1983–97 1983–97 1983–97 1983–97Period All All All All All All All All All All
57
Table 7: Likelihood of receiving an enforcement action during a crisis
This table presents the coefficients from estimating models of the regulators’ decision to issue an enforcementaction during the period of 2003 to 2017. Columns (1)–(5) present the results from the estimation of a Coxproportional-hazards model, while column (6) presents the results from the estimation of an accelerated-timemodel. The indicator Crisis takes the value of 1 for the quarters during the financial crisis in Q4 2007–Q2 2009and 0 otherwise and Post Crisis takes the value of 1 in Q3 2009–2017 and 0 otherwise. To mitigate the effectsof extreme observations, all continuous variables are winsorized at the 1% and 99% tails of their respectivedistributions in each sample year. All variables are lagged by one quarter and defined in Appendix C. Thez-statistics are presented in parentheses. ∗p < 0.1; ∗∗p < 0.05; ∗∗∗p < 0.01 (two-tailed).
Nonperforming Assets x Post Crisis -32.820***(-11.495)
Return On Assets x Crisis 60.205***(7.863)
Return On Assets x Post Crisis 79.444***(11.354)
Liquidity Ratio x Crisis -1.723(-0.878)
Liquidity Ratio x Post Crisis -1.581(-1.011)
Observations 331,153 331,153 331,153 331,153 331,153 331,153Wald χ2 2182*** 2220*** 2737*** 2657*** 2204*** 805.2***Reg Type Cox Hazard Cox Hazard Cox Hazard Cox Hazard Cox Hazard Weibull AFTStrata Year Year Year Year Year YearCluster Bank Bank Bank Bank Bank BankYears 2003–17 2003–17 2003–17 2003–17 2003–17 2003–17Period Disclosure Disclosure Disclosure Disclosure Disclosure Disclosure
Regime Regime Regime Regime Regime Regime
58
Table 8: EDOs and bank deposits
This table presents changes in banks’ deposits. Panel A shows total, insured, and uninsured deposits using a difference-in-differences research design and a control sample of non-EDO banks matched on size and geography. Panel B shows the associationbetween EDO news coverage in the NewsBank archive and deposits for banks that receive an EDO in the disclosure regime. PanelC shows the association between the intensity of news coverage and deposits for EDO banks, conditional on news coverage in theNewsBank and Factiva archives. The indicator Treatment takes the value of 1 for banks that receive an EDO and 0 otherwise;Post EDO takes the value of 1 for 12 quarters after the EDO was received for treatment banks and for the same quarters formatched banks and 0 for the 12 quarters prior for both treatment and control banks; and News Coverage takes the value of 1for banks whose EDOs were covered in the local media and 0 otherwise. The variable News Coverage Intensity is the naturallogarithm of the number of articles that cover the EDO; News Coverage Length is the natural logarithm of the number of daysbetween the first and last news articles; and National Coverage is the natural logarithm of the number of articles covering EDOsin the national newspapers. To mitigate the effects of extreme observations, all continuous variables are winsorized at the 1% and99% tails of their respective distributions in each sample year. The sample period is Q1 1991–1997 (disclosure regime period).The sample starts in 1991 due to data availability for computing insured and uninsured deposits. All variables are lagged byone quarter and defined in Appendix C. The t-statistics are presented in parentheses. We also present the χ2 statistic for thesignificance of the difference of the coefficients on the interaction term between insured and uninsured deposits using seeminglyunrelated regressions method. ∗p < 0.1; ∗∗p < 0.05; ∗∗∗p < 0.01 (two-tailed).
Panel A: EDOs and bank deposits
TotalDeposits
InsuredDeposits
UninsuredDeposits
TotalDeposits
InsuredDeposits
UninsuredDeposits
(1) (2) (3) (4) (5) (6)
Post EDO 0.081*** 0.074*** 0.082*** 0.019* 0.011 0.006(4.798) (4.751) (3.536) (1.762) (1.162) (0.388)
Treatment x Post EDO -0.203*** -0.163*** -0.287*** -0.038*** -0.001 -0.090***(-9.143) (-8.199) (-9.055) (-2.699) (-0.104) (-4.072)
Table 9: Disclosure of enforcement actions and bank failure
This table presents the coefficients from estimating hazard models of bank failure. Column (1) presentsthe results from the estimation of a Cox proportional-hazards model, while column (2) presents the resultsfrom the estimation of an accelerated-time model. The indicator Disclosure Regime takes the value of 1 forthe quarters after the introduction of FIRREA in Q3 1989 and 0 otherwise and Treatment takes the valueof 1 for banks that received an EDO and 0 otherwise. To mitigate the effects of extreme observations, allcontinuous variables are winsorized at the 1% and 99% tails of their respective distributions in each sampleyear. The full sample period is 1983–1997. All variables are lagged by one quarter and defined in AppendixC. The z-statistics are presented in parentheses. ∗p < 0.1; ∗∗p < 0.05; ∗∗∗p < 0.01 (two-tailed).
(1) (2)
Disclosure Regime 0.184 -0.352*(0.717) (-1.923)
Treatment -1.470*** 1.490***(-6.969) (5.096)
Treatment x Disclosure Regime 1.360*** -1.330***(5.938) (-4.588)
Size -0.220*** 0.215***(-8.608) (6.453)
Capital Ratio -78.676*** 81.329***(-30.755) (8.502)
Observations 653,555 653,555Wald χ2 4901*** 379.1***Reg Type Cox Hazard Weibull AFTStrata Year YearCluster Bank BankYears 1983–97 1983–97Period All All
62
Table 10: Disclosure regime and bank outcomes
This table presents changes in bank outcomes for the matched sample of banks that received an EDO (Treatment) and thosethat did not (matched on size and geography). The indicator Post EDO takes the value of 1 for 12 quarters after the EDO wasreceived for treatment banks and for the same quarters for matched banks, and 0 for the 12 quarters prior. Disclosure Regimetakes the value of 1 for the quarters after the introduction of FIRREA in Q3 1989. To mitigate the effects of extreme observations,all continuous variables are winsorized at the 1% and 99% tails of their respective distributions in each sample year. The fullsample period is 1983–1997. All variables are lagged by one quarter and defined in Appendix C. The t-statistics are presented inparentheses. ∗p < 0.1; ∗∗p < 0.05; ∗∗∗p < 0.01 (two-tailed).
Loans Total Capital Nonperforming Loans Total Capital NonperformingDeposits Ratio Assets Deposits Ratio Assets
(1) (2) (3) (4) (5) (6) (7) (8)
Treatment x Post EDO -0.029*** -0.159*** -0.009*** 0.014*** -0.015** -0.002 -0.014*** 0.011***(-3.974) (-8.679) (-4.479) (3.957) (-2.143) (-0.256) (-7.036) (3.322)
Observations 43,284 43,239 43,284 43,131 42,962 42,921 42,962 42,815Adjusted R-squared 0.789 0.967 0.717 0.557 0.815 0.991 0.775 0.600Reg Type OLS OLS OLS OLS OLS OLS OLS OLSYear-Quarter FE Yes Yes Yes Yes Yes Yes Yes YesBank FE Yes Yes Yes Yes Yes Yes Yes YesCluster Bank Bank Bank Bank Bank Bank Bank BankYears 1983–97 1983–97 1983–97 1983–97 1983–97 1983–97 1983–97 1983–97Period All All All All All All All All
63
Online Appendix to “Observing Enforcement: Evidence
from Banking”
Contents
1 Figures and Tables 3
2 Anecdotal evidence: Examples of banks suing regulators 28
3 Accelerated time models 31
4 Text comparison of a random sample of C&D orders 32
5 Anecdotal evidence: News media coverage of enforcement actions 36
List of Figures
OA1 Number of EDOs with penalties and mean (median) penalties by year . . . . 3
OA11Disclosure and bank failure (competition from thrifts) . . . . . . . . . . . . . 23
OA12Disclosure regime and bank outcomes (matched sample) . . . . . . . . . . . 25
2
1 Figures and Tables
Figure OA1: Number of EDOs with penalties and mean (median) penalties by year
Figure OA2: Coefficient plot to assess pre-trends
This figure presents the coefficient plot for the interaction coefficient of Treatment with year-quarter indicators from theestimation of the linear probability model of regulators’ decision to issue an enforcement action during the period of 1983to 1997 with bank fixed effects and control variables. The estimation is similar to that presented in Table OA1 apart fromyear-quarter indicators interacted with the Treatment indicator. Treatment takes the value of 1 for banks that receive an EDOand 0 otherwise. The vertical dashed line corresponds to the change in the disclosure regime in Q3 1989.
3
Panel A
Panel B
4
Panel C
Panel D
Figure OA3: Time trend of coefficients (pre-FIRREA 1983–1984)
This figure shows the time trend of coefficients of Disclosure Regime (Panel A), Capital Ratio × Disclosure Regime (PanelB), Nonperforming Assets × Disclosure Regime (Panel C), and Return On Assets × Disclosure Regime (Panel D) from theestimation of Equation 1 in the manuscript (excluding year indicators). The pre-FIRREA sample consists of the years 1983–1984, whereas the post-FIRREA sample consists of all possible consecutive 20-quarter windows. The gray bands correspond tothe 95% confidence intervals around the coefficient estimates.
5
(Panel A)
(Panel B)
Figure OA4: Cost of thrift/bank failure to the deposit insurance fund
This figure shows the total (Panel A) and average (mean) (Panel B) cost of thrift and bank failure to thedeposit insurance fund for the years 1986–1997. Data is from the FDIC’s Bank Failures and AssistanceDataset. The earliest year for which data is available is 1986.
6
Figure OA5: Number of news articles related to the S&L crisis
This figure shows the number of articles in the Dow Jones Factiva news database related to the variationsof the following search terms: “S&L crisis,” “savings and loan crisis,” or “thrift failure.”
7
(Panel A)
(Panel B)
8
(Panel C)
(Panel D)
Figure OA6: Time trend of coefficients (full sample)
This figure shows the time trend of coefficients of Disclosure Regime (Panel A), Capital Ratio × Disclosure Regime (PanelB), Nonperforming Assets × Disclosure Regime (Panel C), and Return On Assets × Disclosure Regime (Panel D) from theestimation of Equation 1 in the manuscript (excluding year indicators). The legend indicates pre-FIRREA quarters selected.Details of the estimation are described in Section 6.4 of the manuscript.
9
(Panel A)
(Panel B)
10
(Panel C)
(Panel D)
Figure OA7: Time trend of coefficients (sub sample)
This figure shows the time trend of coefficients of Disclosure Regime (Panel A), Capital Ratio × Disclosure Regime (PanelB), Nonperforming Assets × Disclosure Regime (Panel C), and Return On Assets × Disclosure Regime (Panel D) from theestimation of Equation 1 in the manuscript (excluding year indicators). The legend indicates pre-FIRREA quarters selected.Details of the estimation are described in Section 6.4 of the manuscript. The gray bands correspond to the 95% confidenceintervals around the coefficient estimates. 11
Table OA1: Likelihood of receiving an enforcement action (linear probability model)
This table presents the results from estimating a linear probability model of regulators’ decision to issue an enforcement actionduring the period of 1983 to 1997. The dependent variable is 1 in the year of EDO issuance and zero otherwise. Observationsfor EDO banks after receiving an EDO are dropped from the analysis. The variable Disclosure Regime takes the value of 1 forthe quarters after the introduction of FIRREA in Q3 1989 and 0 otherwise. To mitigate the effects of extreme observations, allcontinuous variables are winsorized at the 1% and 99% tails of their respective distributions in each sample year. All variablesare lagged by one quarter and defined in Appendix C of the manuscript; t-statistics are presented in parentheses; ∗p < 0.1; ∗∗p <0.05; ∗∗∗p < 0.01 (two-tailed).
Capital Ratio x Disclosure Regime -0.273*** -0.128***(-14.249) (-7.900)
Nonperforming Assets x Disclosure Regime 0.882*** 0.703***(19.658) (17.073)
Return On Assets x Disclosure Regime -2.818*** -1.897***(-20.436) (-16.258)
Liquidity Ratio x Disclosure Regime 0.037*** 0.008(3.757) (0.796)
Observations 686,872 686,872 686,872 686,872 686,872 686,872Adjusted R-squared 0.230 0.232 0.241 0.239 0.230 0.246Reg Type OLS OLS OLS OLS OLS OLSYear-Quarter FE No Yes Yes Yes Yes YesCluster Bank Bank Bank Bank Bank BankYears 1983–97 1983–97 1983–97 1983–97 1983–97 1983–97Period All All All All All All
12
Table OA2: Likelihood of receiving an enforcement action (pre-FIRREA sample of 1983–84)
This table presents the results from estimating linear probability models of the regulators’ decision to issue an EDO duringthe period of 1983–1984 and Q4 1989–1997. The dependent variable is 1 in the year of EDO issuance and zero otherwise.Observations for EDO banks after receiving an EDO are dropped from the analysis. The variable Disclosure Regime takes thevalue of 1 for the quarters after the introduction of FIRREA in Q3 1989 and 0 otherwise. To mitigate the effects of extremeobservations, all continuous variables are winsorized at the 1% and 99% tails of their respective distributions in each sampleyear. All variables are lagged by one quarter and defined Appendix C of the manuscript; t-statistics are presented in parentheses;∗p < 0.1; ∗∗p < 0.05; ∗∗∗p < 0.01 (two-tailed).
Capital Ratio x Disclosure Regime -0.290*** -0.138***(-15.279) (-8.628)
Nonperforming Assets x Disclosure Regime 0.919*** 0.728***(20.602) (17.826)
Return On Assets x Disclosure Regime -2.971*** -2.011***(-21.784) (-17.471)
Liquidity Ratio x Disclosure Regime 0.040*** 0.009(4.078) (0.946)
Observations 684,065 684,065 684,065 684,065 684,065 684,065Adjusted R-squared 0.233 0.236 0.247 0.245 0.233 0.254Reg Type OLS OLS OLS OLS OLS OLSYear-Quarter FE Yes Yes Yes Yes Yes YesBank FE Yes Yes Yes Yes Yes YesCluster Bank Bank Bank Bank Bank BankYears 1983–97 1983–97 1983–97 1983–97 1983–97 1983–97EDO years 1983–84 &
1989Q4–971983–84 &1989Q4–97
1983–84 &1989Q4–97
1983–84 &1989Q4–97
1983–84 &1989Q4–97
1983–84 &1989Q4–97
Period All All All All All All
13
Table OA3: Likelihood of receiving an enforcement action (C&D orders)
This table presents the coefficients from estimating models of the regulators’ decision to issue a cease and desist enforcementorder during the period of 1983 to 1997. Columns (1)–(6) present the results from the estimation of a Cox proportional-hazardsmodel. Column (7) presents the results from the estimation of an accelerated-time model. The variable Disclosure Regime takesthe value of 1 for the quarters after the introduction of FIRREA in Q3 1989 and 0 otherwise. To mitigate the effects of extremeobservations, all continuous variables are winsorized at the 1% and 99% tails of their respective distributions in each sample year.All variables are lagged by one quarter and defined in Appendix C of the manuscript; z-statistics are presented in parentheses;∗p < 0.1; ∗∗p < 0.05; ∗∗∗p < 0.01 (two-tailed).
Capital Ratio x Disclosure Regime -5.934* 3.408(-1.941) (0.818)
Nonperforming Assets x Disclosure Regime 6.962*** 4.413*(4.201) (1.894)
Return On Assets x Disclosure Regime -23.173*** -18.617**(-4.522) (-2.446)
Liquidity Ratio x Disclosure Regime 0.222 0.023(0.150) (0.015)
Observations 691,802 691,802 691,802 691,802 691,802 691,802 691,802Wald χ2 2229*** 2335*** 2397*** 2386*** 2229*** 2463*** 1637***Reg Type Cox Hazard Cox Hazard Cox Hazard Cox Hazard Cox Hazard Weibull AFT Weibull AFTStrata Year Year Year Year Year Year YearCluster Bank Bank Bank Bank Bank Bank BankYears 1983–97 1983–97 1983–97 1983–97 1983–97 1983–97 1983–97Period All All All All All All All
14
Table OA4: Changes in the textual content of enforcement actions (with EDO length andsample filters)
This table presents changes in the content of enforcement actions using textual analysis of severe enforcementactions issued by the FDIC, OCC or the Federal Reserve for the period 1983–1984 and Q3 1989–1997.Column (5) contains only FDIC severe enforcement actions, resulting in a reduced number of observations.The variable Disclosure Regime takes the value of 1 for the quarters after the introduction of FIRREA inQ3 1989 and 0 otherwise; EDO Severity is the length of time it takes a bank to exit an EDO. To mitigatethe effects of extreme observations, all continuous variables are winsorized at the 1% and 99% tails of theirrespective distributions in each sample year. All variables are lagged by one quarter and defined in AppendixC of the manuscript; t-statistics are presented in parentheses; ∗p < 0.1; ∗∗p < 0.05; ∗∗∗p < 0.01 (two-tailed).
Observations 499 499 499 499 234Adjusted R-squared 0.377 0.458 0.362 0.067 0.140Reg Type OLS OLS OLS OLS OLSYear-Quarter FE No No No No NoBank FE No No No No NoCluster Year Year Year Year YearYears 1983–97 1983–97 1983–97 1983–97 1983–97Period All All All All All
15
Table OA5: News circulation and the likelihood of receiving an enforcement action
This table presents the coefficients from estimating models of the regulators’ decision to issue an enforcementaction during the period of 1983 to 1997. Column (1) presents the results from estimating a Cox proportional-hazards model, whereas column (2) presents the results from an accelerated-time model. The variableDisclosure Regime takes the value of 1 for the quarters after the introduction of FIRREA in Q3 1989 and 0otherwise; News Circulation is a continuous measure of the county-level newspaper readership. To mitigatethe effects of extreme observations, all continuous variables are winsorized at the 1% and 99% tails of theirrespective distributions in each sample year. All variables are lagged by one quarter and defined in AppendixC of the manuscript; z-statistics are presented in parentheses; ∗p < 0.1; ∗∗p < 0.05; ∗∗∗p < 0.01 (two-tailed).
Return On Assets -21.414*** 10.012***(-3.669) (3.233)
Liquidity Ratio -1.490 0.961*(-1.441) (1.845)
Change in Capital Ratio -0.422** 0.432***(-2.410) (3.246)
Change in Liquidity Ratio 0.071 -0.059(1.040) (-1.563)
Change in Loans -0.864*** 0.368**(-3.641) (2.497)
Distance 0.176*** -0.103***(6.122) (-5.290)
Employment Growth 0.891 -0.684(0.528) (-1.020)
Per Capita Income -0.743** 0.313*(-2.020) (1.883)
Urbanization -3.173 2.100(-1.185) (1.439)
News Circulation2 0.023* -0.009(1.798) (-0.710)
News Circulation x Urbanization 2.015 -2.653(0.568) (-1.352)
Disclosure Regime x Employment Growth -5.589** 3.872***(-2.467) (2.972)
Disclosure Regime x Per Capita Income 1.356*** -0.712***(3.435) (-3.530)
Disclosure Regime x Urbanization 6.332*** -4.344***(4.478) (-4.791)
Disclosure Regime x Capital Ratio 7.154* -1.260(1.861) (-0.473)
Disclosure Regime x Nonperforming Assets 4.435** -9.455***(2.120) (-4.606)
Disclosure Regime x Return On Assets -15.938** 20.077***(-2.357) (4.126)
Disclosure Regime x Liquidity Ratio -0.717 0.374(-0.560) (0.494)
Observations 685,338 685,338Wald χ2 3138*** 2808***Reg Type Cox Hazard Weibull AFTStrata Year YearCluster Bank BankYears 1983–97 1983–97Period All All
16
Table OA6: News circulation and the likelihood of receiving a non-severe enforcement action
This table presents the coefficients from estimating models of the regulators’ decision to issue a non-severeenforcement action during the disclosure regime. Column (1) presents the results from estimating a Coxproportional-hazards model, whereas column (2) presents the results from an accelerated-time model. Thevariable News Circulation is a continuous measure of the county-level newspaper readership; Severe EDOis an indicator for whether a bank received a severe enforcement action prior to receiving the non-severeenforcement action. To mitigate the effects of extreme observations, all continuous variables are winsorizedat the 1% and 99% tails of their respective distributions in each sample year. All variables are laggedby one quarter and defined in Appendix C of the manuscript; z-statistics are presented in parentheses;∗p < 0.1; ∗∗p < 0.05; ∗∗∗p < 0.01 (two-tailed).
Return On Assets -25.510*** 21.269***(-5.220) (3.287)
Liquidity Ratio 3.173*** -2.902***(4.159) (-2.966)
Change in Capital Ratio 2.014*** -1.899***(9.199) (-4.841)
Change in Liquidity Ratio 0.032 -0.019(0.360) (-0.211)
Change in Loans -0.020 0.029(-0.095) (0.135)
Distance -0.014 0.014(-0.471) (0.436)
Employment Growth 1.400 -1.507(1.187) (-1.178)
Per Capita Income 0.231 -0.189(1.255) (-0.892)
Urbanization 2.111 -2.016(0.815) (-0.727)
News Circulation2 0.040 -0.040(1.317) (-1.110)
News Circulation x Urbanization -0.457 0.095(-0.111) (0.022)
Observations 318,426 318,426Wald χ2 2113*** 45.06***Reg Type Cox Hazard Weibull AFTStrata Year YearCluster Bank BankYears 1989–97 1989–97Period Disclosure Regime Disclosure Regime
17
Table OA7: Competition from thrifts (thrifts’ share of deposits)
This table presents the effect of competition from thrifts on the likelihood of receiving an EDO and EDO content. Panel A presentsthe coefficients from estimating models of the regulators’ decision to issue a severe enforcement action. Columns (1)–(7) presentthe results from estimating a Cox proportional-hazards model and columns (8)–(9) present the results from an accelerated-timemodel. Panel B shows the impact on EDO content using OLS estimation. The indicator Disclosure Regime takes the value of1 for the quarters after the introduction of FIRREA in Q3 1989 and 0 otherwise. Thrifts’ Share of Deposits is a proportion ofdeposits held by thrifts in a given county where an EDO bank is headquartered lagged by one quarter. To mitigate the effectsof extreme observations, all continuous variables are winsorized at the 1% and 99% tails of their respective distributions in eachsample year. All variables are lagged by one quarter and defined in Appendix C of the manuscript. z-statistics (Panel A) and andt-statistics (Panel B) are presented in parentheses. ∗p < 0.1; ∗∗p < 0.05; ∗∗∗p < 0.01 (two-tailed).
(Panel A): Likelihood of receiving an EDO, competition from thrifts in deposit market
Capital Ratio x Disclosure Regime -5.841** 3.639(-2.154) (0.950)
Nonperforming Assets x Disclosure Regime 7.498*** 5.327***(5.038) (2.578)
Return on Assets x Disclosure Regime -22.400*** -16.061**(-4.710) (-2.286)
Liquidity Ratio x Disclosure Regime 0.418 0.273(0.314) (0.207)
Thrifts’ Share of Deposits x Disclosure Regime 1.369*** 1.300*** -0.572*(2.844) (2.712) (-1.654)
Observations 661,792 661,792 661,792 661,792 661,792 661,792 661,792 661,792 661,792Wald χ2 2859*** 2973*** 3048*** 3037*** 2858*** 2879*** 3142*** 1482*** 1563***Reg Type Cox Hazard Cox Hazard Cox Hazard Cox Hazard Cox Hazard Cox Hazard Cox Hazard Weibull AFT Weibull AFTStrata Year Year Year Year Year Year Year Year YearCluster Bank Bank Bank Bank Bank Bank Bank Bank BankYears 1983–97 1983–97 1983–97 1983–97 1983–97 1983–97 1983–97 1983–97 1983–97Period All All All All All All All All All
18
Competition from thrifts, continued
(Panel B): Changes in the textual content of enforcement actions, competition from thrifts in deposit market
Observations 592 592 592 592 592 592 592 592 289 289Adjusted R-squared 0.106 0.104 0.397 0.397 0.307 0.307 0.070 0.068 0.080 0.089Reg Type OLS OLS OLS OLS OLS OLS OLS OLS OLS OLSYear-Quarter FE No No No No No No No No No NoBank FE No No No No No No No No No NoCluster Year Year Year Year Year Year Year Year Year YearYears 1983–97 1983–97 1983–97 1983–97 1983–97 1983–97 1983–97 1983–97 1983–97 1983–97Period All All All All All All All All All All
19
Table OA8: Persistence of results related to news circulation and the likelihood of receivingan enforcement action
This table presents the coefficients from estimating models of the regulators’ decision to issue an enforcementaction during the period of 1983 to 2007. Columns (1) to (3) present the results from estimating a Coxproportional-hazards model, whereas columns (4) and (5) present the results from an accelerated-time model.The variable Disclosure Regime (Q4 1989–1997) takes the value of 1 for the quarters after the introductionof FIRREA from Q4 1989 to Q4 1997 and 0 otherwise; Disclosure Regime (1998–2007) takes the value of1 for the years 1998–2007 and 0 otherwise; and News Circulation is defined as an indicator variable thatequals 1 for banks located in counties in the highest quintile of news circulation and 0 otherwise. To mitigatethe effects of extreme observations, all continuous variables are winsorized at the 1% and 99% tails of theirrespective distributions in each sample year. All variables are lagged by one quarter and defined in AppendixC of the manuscript; z-statistics are presented in parentheses; ∗p < 0.1; ∗∗p < 0.05; ∗∗∗p < 0.01 (two-tailed).
Disclosure Regime (Q4 1989–1997) x Employment Growth -6.310*** 6.424***(-2.780) (2.773)
Disclosure Regime (1998–2007) x Employment Growth -4.205* 3.225(-1.916) (1.623)
Disclosure Regime (Q4 1989–1997) x Per Capita Income 1.143*** -1.329***(2.892) (-3.190)
Disclosure Regime (1998–2007) x Per Capita Income 1.206*** -1.513***(2.838) (-3.621)
Disclosure Regime (Q4 1989–1997) x Urbanization 5.608*** -5.353***(4.041) (-3.346)
Disclosure Regime (1998–2007) x Urbanization 4.877*** -3.292**(3.580) (-2.376)
Observations 961,035 961,035 961,035 961,035 961,035Wald χ2 3025*** 3024*** 3109*** 1527*** 1643***Reg Type Cox Hazard Cox Hazard Cox Hazard Weibull AFT Weibull AFTStrata Year Year Year Year YearCluster Bank Bank Bank Bank BankYears 1983–07 1983–07 1983–07 1983–07 1983–07Period All All All All All
20
Table OA9: Likelihood of receiving an enforcement action during a crisis
This table presents the coefficients from estimating models of the regulators’ decision to issue an enforcementaction during the period of 1983 to 1997. Columns (1)–(5) present the results from the estimation of a Coxproportional-hazards model, while column (6) presents the results from the estimation of an accelerated-time model. S&L Crisis Resolution equals 1 for the quarters in Q4 1989–Q4 1992 and 0 otherwise. PostS&L Crisis equals 1 for the quarters Q1 1993–Q4 1997 and 0 otherwise. To mitigate the effects of extremeobservations, all continuous variables are winsorized at the 1% and 99% tails of their respective distributionsin each sample year. All variables are lagged by one quarter and defined in Appendix C of the manuscript.z-statistics are presented in parentheses. ∗p < 0.1; ∗∗p < 0.05; ∗∗∗p < 0.01 (two-tailed).
Capital Ratio x S&L Crisis Resolution -5.033*(-1.861)
Capital Ratio x Post S&L Crisis -10.014*(-1.851)
Nonperforming Assets x S&L Crisis Resolution 3.799**(2.496)
Nonperforming Assets x Post S&L Crisis 23.065***(10.160)
Return On Assets x S&L Crisis Resolution -13.386***(-2.842)
Return On Assets x Post S&L Crisis -81.115***(-9.740)
Liquidity Ratio x S&L Crisis Resolution -0.370(-0.266)
Liquidity Ratio x Post S&L Crisis 4.033**(2.319)
Observations 685,346 685,346 685,346 685,346 685,346 685,346Wald χ2 3227 3000 3304 3246 2841 458Reg Type Cox Hazard Cox Hazard Cox Hazard Cox Hazard Cox Hazard Weibull AFTStrata None Year Year Year Year NoneCluster Bank Bank Bank Bank Bank BankYears 1983-97 1983-97 1983-97 1983-97 1983-97 1983-97Period All All All All All All
21
Table OA10: Changes in the textual content of enforcement actions during a crisis (EDObanks only)
This table presents the change in the content of enforcement orders using an OLS model. Column (5) hasfewer observations due to its focus on severe enforcement actions issued by FDIC. The variable Crisis takesthe value of 1 for the quarters during the financial crisis in Q4 2007–Q2 2009 and 0 otherwise; Post Crisisis an indicator variable that equals 1 in Q3 2009–2017 and 0 otherwise. To mitigate the effects of extremeobservations, all continuous variables are winsorized at the 1% and 99% tails of their respective distributionsin each sample year. All variables are lagged by one quarter and defined in Appendix C of the manuscript;t-statistics are presented in parentheses; ∗p < 0.1; ∗∗p < 0.05; ∗∗∗p < 0.01 (two-tailed).
Observations 1,222 1,222 1,222 1,222 1,136Adjusted R-squared 0.043 0.034 0.039 0.038 0.053Reg Type OLS OLS OLS OLS OLSYear-Quarter FE No No No No NoBank FE No No No No NoCluster Year Year Year Year YearYears 2003–17 2003–17 2003–17 2003–17 2003–17Period Disclosure Disclosure Disclosure Disclosure Disclosure
Regime Regime Regime Regime Regime
22
Table OA11: Disclosure and bank failure (competition from thrifts)
This table presents the coefficients from estimating hazard models of bank failure. Columns (1), (3), (5), and (7) of Panel A andPanel B present the results from the estimation of a Cox proportional-hazards model, while columns (2), (4), (6), and (8) presentthe results from estimating an accelerated-time model. The variable Disclosure Regime takes the value of 1 for the quartersafter the introduction of FIRREA in Q3 1989 and 0 otherwise; Thrifts’ Share of Risky Lending (Thrifts’ Share of Deposits) isa proportion of risky loans (deposits) held by thrifts in a given county where an EDO bank is headquartered lagged by 1, 2, 3,or 4 quarters. To mitigate the effects of extreme observations, all continuous variables are winsorized at the 1% and 99% tailsof their respective distributions in each sample year. All variables are lagged by one quarter and defined in Appendix C of themanuscript; z-statistics are presented in parentheses; ∗p < 0.1; ∗∗p < 0.05; ∗∗∗p < 0.01 (two-tailed).
(Panel A): Likelihood of failure, competition from thrifts in risky lending
Thrifts’ Share of Risky Lending 0.095 -0.105(0.529) (-0.609)
Thrifts’ Share of Risky Lending(t−2) 0.112 -0.156(0.630) (-0.908)
Thrifts’ Share of Risky Lending(t−3) 0.105 -0.133(0.586) (-0.780)
Thrifts’ Share of Risky Lending(t−4) 0.069 -0.115(0.384) (-0.670)
Observations 629,935 629,935 630,431 630,431 630,913 630,913 631,390 631,390Wald χ2 4828*** 369.1*** 4812*** 370*** 4806*** 370.6*** 4824*** 371.9***Reg Type Cox Hazard Weibull AFT Cox Hazard Weibull AFT Cox Hazard Weibull AFT Cox Hazard Weibull AFTStrata Year Year Year Year Year Year Year YearCluster Bank Bank Bank Bank Bank Bank Bank BankYears 1983–97 1983–97 1983–97 1983–97 1983–97 1983–97 1983–97 1983–97Period All All All All All All All All
23
Disclosure and bank failure, continued
(Panel B): Likelihood of failure, competition from thrifts in deposit market
Thrifts’ Share of Deposits 0.178 -0.272(0.873) (-1.543)
Thrifts’ Share of Deposits(t−2) 0.148 -0.253(0.726) (-1.440)
Thrifts’ Share of Deposits(t−3) 0.155 -0.257(0.756) (-1.460)
Thrifts’ Share of Deposits(t−4) 0.154 -0.258(0.751) (-1.432)
Observations 629,935 629,935 630,431 630,431 630,913 630,913 631,390 631,390Wald χ2 4847*** 366.5*** 4829*** 368.7*** 4824*** 369.1*** 4842*** 370.4***Reg Type Cox Hazard Weibull AFT Cox Hazard Weibull AFT Cox Hazard Weibull AFT Cox Hazard Weibull AFTStrata Year Year Year Year Year Year Year YearCluster Bank Bank Bank Bank Bank Bank Bank BankYears 1983–97 1983–97 1983–97 1983–97 1983–97 1983–97 1983–97 1983–97Period All All All All All All All All
24
Table OA12: Disclosure regime and bank outcomes (matched sample)
This table presents changes in bank outcomes for the full sample of banks that received an EDO (Treatment) and those that did not (matched controlbanks). The variable Post EDO takes the value of 1 for twelve quarters after the EDO was received for treatment banks and for the same quarters formatched banks, and 0 for the twelve quarters prior; Disclosure Regime takes the value of 1 for the quarters after the introduction of FIRREA in Q31989. Panel A shows the covariate balance for treatment (EDO banks) and control (non-EDO banks) using a two-step matching procedure: entropybalance using four quarters prior to the receipt of an EDO for treatment banks followed by the propensity score matching (nearest neighbor). Panel Bpresents the results of the estimation using the matched control sample for deposits in the disclosure regime only. It also presents the χ2 statistic forthe significance of the difference of the coefficient on the interaction term between insured and uninsured deposits using seemingly unrelated regressionsmethod. Panel C presents the results of the estimation using the matched control sample for the whole sample. Bank-level control variables are laggedby one quarter. To mitigate the effects of extreme observations, all continuous variables are winsorized at the 1% and 99% tails of their respectivedistributions in each sample year. The full sample period is 1983–1997. All variables are defined in Appendix C of the manuscript; t-statistics arepresented in parentheses; ∗p < 0.1; ∗∗p < 0.05; ∗∗∗p < 0.01 (two-tailed).
(Panel A): Entropy-matched covariate balance
Before Disclosure Regime (Entropy Matched) After Disclosure Regime (Entropy Matched)
EDO Banks Non-EDO banks EDO Banks Non-EDO banksVariable N Mean Sd Mean Sd Difference (t-statistic) N Mean Sd Mean Sd Difference (t-statistic)
Observations 47,548 47,543 47,548 47,530 47,268 47,264 47,268 47,253Adjusted R-squared 0.807 0.973 0.775 0.576 0.827 0.995 0.823 0.616Reg Type OLS OLS OLS OLS OLS OLS OLS OLSYear-Quarter FE Yes Yes Yes Yes Yes Yes Yes YesBank FE Yes Yes Yes Yes Yes Yes Yes YesCluster Bank Bank Bank Bank Bank Bank Bank BankYears 1983–97 1983–97 1983–97 1983–97 1983–97 1983–97 1983–97 1983–97Period All All All All All All All All
27
2 Anecdotal evidence: Examples of banks suing regu-
lators
In this section, we provide examples of banks suing regulators. These examples provide anec-
dotal evidence in support of our argument that regulators’ behavior could also be influenced
by the threat of lawsuits by banks. The public disclosure of enforcement actions imposes
greater costs on banks as depositors withdraw their funds in response. Therefore, regulators
might include more legal and boilerplate language in post-FIRREA enforcement orders to
prevent lawsuits or challenges by banks.
MCorp, the Texas bank holding company stripped of 20 of its 25 banks by federalregulators, filed suit Friday against the government agencies on grounds that 10to 14 of the banks seized were not insolvent. The lawsuit, filed against the Officeof the Comptroller of the Currency and the Federal Deposit Insurance Corp.,added another twist to the already complicated case that may not be resolvedfor months and could cost the government more than $2 billion. —“MCorpSues Bank Regulators,” Los Angeles Times, April 01, 1989.
A former chairman of Madison National Bank of Washington yesterday filedsuit against federal regulators, alleging that they unlawfully shut down the bankin 1991. “I want to restore the reputation of the bank and the directors andthe officers and the employees,” Norman F. Hecht Sr. said in an interview.. . . Hecht’s suit argues that federal regulators unnecessarily caused Madison tofail by requiring the bank to set aside excessive amounts of cash as reserves againstbad loans. It seeks return of not only the banks’ assets but also their charters.. . . Ellen Stockdale, a spokeswoman for the OCC, said, “The only comment wehave is we think this does not have any merit.” —“Former Madison BankChief Sues Regulators,” The Washington Post, April 17, 1993.
Bank United of Texas filed suit against the FDIC, the FSLIC Resolution Fund,the RTC, the Thrift Depositor Protection Oversight Board and the director ofthe OTS, accusing them of breaching promises connected with the bank’s 1988acquisition of the insolvent United Savings Association of Texas. . . . The lawsuitincludes 20 specific complaints against regulators, including allegations that thegovernment reneged on promised tax benefits and changed other contracts thatwere part of the 1988 deal. —“Bank United of Texas: Bank sues U.S.regulators over acquisition of thrift,” The Wall Street Journal, August04, 1993.
Bank United of Texas has filed a lawsuit against federal bank regulators claim-ing the agencies trampled on their rights in an acquisition pact. The 98-pagecomplaint details 20 complicated issues, such as the secretary of the Treasury’sdecision not to allow tax benefits that the Federal Savings and Loan Insurance
28
Corp. had promised at the time investors took over. “No tactic has seemed be-yond the pale,” including “take-it-or-sue ultimatums, threats of retaliation, un-founded accusations of improper conduct,” the lawsuit said. —“Bank Unitedsues regulators,” Austin American Statesman, August 05, 1993.
Gerald J. Garner, ousted chairman of failed American Commerce National Bankhas sued federal regulators in an effort to recover his Anaheim bank and win$75 million in damages. . . . The banker filed a three-page, bare-bones lawsuitlast month to meet a statutory deadline. The suit, which has been expectedsince regulators closed the bank on April 30, now alleges that the regulatorswrongly took over a healthy bank, depriving shareholders and customers of theirproperty without due process. –“Ousted Chairman of Failed Bank SuesRegulators,” Los Angeles Times, November 18, 1993.
A group of Meritor Savings Bank stockholders yesterday sued federal and statebank regulators in an effort to have the 1992 takeover of the former PhiladelphiaSavings Fund Society’s parent company declared invalid. The stockholders, whoinclude Philadelphia businessmen Samuel Rappaport and Raymond Perelman,argue that the Dec 11, 1992, seizure violated their constitutional rights andagreements that the regulators had made as far back as 1982. —“MeritorBank Stockholders Sue Regulators,” Philadelphia Inquirer, April 15,1994.
The Bank of New York says Massachusetts state regulators violated federal lawswhen they rejected the bank’s bid to boost its investment in Boston-based StateStreet Bank Corp., a competitor in the corporate trust industry . . . the New Yorkbank said only the Federal Reserve Board has the authority to make those de-cisions, and that its petition before state regulators was merely a formality. —“BONY Sues Massachusetts, Charging Federal Violations,” The BondBuyer, April 17, 1997.
Almost 350 banks have failed since the financial crisis erupted. Now one of them,United Western Bancorp. (UWBK), is believed to be the first among them to sueits regulator, claiming it could have survived. The Denver bank-holding companywants its bank back. It filed a lawsuit against the Office of Thrift Supervision,the primary regulator of its main subsidiary United Western Bank, which wasseized by the OTS on Jan. 21, and the Federal Deposit Insurance Corp., whichsold the bank to Citizens BancShares (FCNCA) of Raleigh, N.C. In the suit filedFriday afternoon in federal court in Washington, D.C., the company claimed itsbank was “economically viable” and the seizure was “arbitrary and capricious.” Itdemanded that the court force the OTS to remove the FDIC as receiver of UnitedWestern Bank. —“Former Owner Of Failed United Western Bank SuesRegulators,” Dow Jones Institutional News, February 18, 2011.
A failed Kansas bank is suing state regulators alleging that they had insufficientgrounds to close it. Columbian Bank & Trust Co. was adequately capitalized,
29
profitable and liquid when regulators seized it on Aug. 22, 2008, according to alawsuit filed by the bank and its holding company, Columbian Financial Corp.The Office of the State Bank Commissioner of Kansas “seized the bank basedon speculative projections of future illiquidity and thereby deprived ColumbianFinancial Corp., the bank’s sole shareholder, of millions of dollars in equity,”according to the lawsuit filed April 10 in a Kansas City U.S. district court. —“Failed Kansas Bank Sues Regulators, Claiming Closure Was Unjust,”American Banker, April 24, 2014.
30
3 Accelerated time models
Accelerated time models are parametric models where instead of assuming a distribution for
the survival time tj, it is assumed for τj where
τj = exp(−xjβx)tj . (1)
The factor exp(−xjβx) is called the acceleration parameter. If exp(−xjβx) = 1, then τj = tj
and time passes at its normal rate. However, if exp(−xjβx) > 1 then τj > tj and time passes
more quickly for j, i.e., the event is expected to occur sooner. Similarly, if exp(−xjβx) < 1
then time is decelerated and the event is expected to occur later.
From Equation 1 it follows that
tj =τj
exp(−xjβx)=⇒ tj = τjexp(xjβx)
=⇒ log(tj) = xjβx + log(τj) .
(2)
We estimate the above log-linear specification using the maximum likelihood principle. Our
estimation of Equation 2 includes both EDO and non-EDO observations. The non-EDO
observations are censored observations because the event (EDO) does not occur for these
banks during the study period, i.e., these banks have unknown event times. For each interval
(quarter), we know the probability of event occurrence as well as nonoccurence. Therefore,
the estimated survival probability in quarter q is the estimated survival probability in the
previous quarter multiplied by the probability of event occurrence:
S(tq) = S(tq−1)[1− h(tq)] , (3)
where S is the estimated survival function and h is the estimated hazard probability.
For more details, please see Anbil (2018); Cleves et al. (2008); Singer & Willett (2003).
31
4 Text comparison of a random sample of C&D orders
In this section, we present a comparison of the text of a randomly selected sample (by year) of cease and desist enforcement
orders. We classify these enforcement orders into broad topics based on their content. Percent overlap is the number of orders
that contain the specified topic as a percent of the total number of orders. For example, there is a 60% overlap across banks
in management-related issues—that is, of the ten C&D orders in the sample, six raised issues related to bank management.
Overall, the overlap is 60% for all topics, indicating a significant amount of homogeneity in the broad topics covered in C&D
This section provides descriptive evidence related to the content of the press articles that
cover EDOs. These articles contain details about the enforcement actions and the specific
actions banks are required to take to exit the EDO successfully. More importantly, the
articles have bank managers’ comments and opinions and indicate the steps the bank is
taking to resolve the issues stated in the enforcement action.
Citizens Western Bank, the county’s smallest bank, was issued a cease and desistorder from the Federal Deposit Insurance Corp. last month, confirmed FDICspokesman David Barr. . . . Local bankers contacted for this story were not sur-prised Citizens Western was hit with a cease and desist order, saying the bankhas not been growing or making much money for several years. “They don’t haveany momentum. They don’t have any niche, and they don’t know where theyare going,” said one banker who preferred not to be named. “Now all of a sud-den their loan programs are getting worse.” When informed that the bank hadbeen hit with the regulatory sanction, another banker said, “Cease and desistfrom what? They haven’t made a loan in about five years.” — “Mo’s FavoriteBank Put on Restriction,” San Diego Daily Transcript, June 18, 1991.
Federal regulators have slapped restrictions on Urban National Bank, requir-ing the small Franklin Lakes bank to refurbish its loan-management procedures,tighten rules on overdrafts by insiders, and report monthly on its progress, exec-utives said Thursday. . . . “Apparently, the OCC wasn’t satisfied with the depth ofthe management to supervise the bank’s operations, particularly the loan activ-ities,” said George E. Stock, who is serving as interim chief of the bank. “They[the board] brought me in to spearhead the additions to the staff and get the besttalent in the right places.” The 71-year-old Stock, who retired as vice chairmanof Midlantic Corp. in 1987, said he initially planned to explain the agreementto shareholders at the annual meeting in April, but decided to answer questionsafter release of the regulatory report. Stock arrived at Urban in November, afterPresident and Chief Executive Theodore V. Kruckel retired after 29 years at thebank. “The whole bank isn’t falling apart,” Stock said. “There are just cer-tain areas that have to be strengthened.” — “Feds rein in Urban Nationalinsider overdrafts, loan rules cited,” The Record, March 13, 1992.
Jim Brown, BSD’s chairman and chief executive officer, said that while he is nothappy with the sanction, the company should be able to comply with its condi-tions. “Obviously I’m not pleased with having the order, but in the regulatoryenvironment we’re faced with, I think we’re going to be OK,” Brown said. “Theorder is one that is certainly achievable.” — “BSD Bancorp must increasecapital ratios,” San Diego Daily Transcript, September 3, 1992.
36
Edwin F. Hale Sr., chairman of the board, said, “We have already taken steps toaddress many of the requirements of the agreement and the order. The currentboard has been responding to the conditions which existed at the time of theproxy contest, and the recent improvements in the bank’s earnings and financialcondition reflect those efforts. Based on present projections from the previouslyadopted plan, the board currently expects that the company and the bank willbe able to meet the requirements of the agreement and the order. The successfulraising of capital in the public offering and reduction in classified assets will, ofcourse, be dependent upon a number of factors beyond our control, includingfuture market and economic conditions and upon the cooperation and success ofour borrowers.” Hale emphasized, “We fully recognize that we have our work cutout for us to achieve these goals and that there is little margin for error in ourprojections.” — “Baltimore Bancorp reports increased earnings; signsagreement and order with regulators,” PR Newswire, July 15, 1992.
Siggi B. Wilzig, The Trust Co.’s chairman and chief executive officer, on Mondaycalled the FDIC’s order “a bit of a hangover from a previous situation.” Headded: “We have an excellent compliance department, and we have an ethicspolicy. It may not have been complete or formalized, but nothing went wronghere.”. . . The FDIC was highly critical of Trust Co. employees working in thebank’s lending division and questioned the bank’s criteria for approving loans.The regulatory agency asked the bank to set up a committee to evaluate eachTrust Co. officer “to determine whether these individuals possess the ability,experience, and other qualifications to perform present and anticipated duties,including adherence to the Bank’s established policies and practices...” . . . WilzigMonday characterized his bank’s loan portfolio as “healthy,” with a low numberof bad loans and unwanted real estate. At the same time, he said The TrustCo. takes very seriously its motto, “The Bank With Heart Since 1896.” “This isa 99-year old bank,” he said. “We are very close to the community. You can’ttake the customers who made this bank and foreclose on their property. We can’tthrow women and children out on the street.” If there’s something wrong withus, then why would we be given permission to open five branches in the last 10months?” — “Trust Co. is accused of violations. FDIC orders criticalchanges,” The Record, November 01, 1994.
Under orders from federal regulators, Founders has less than a month to raise atleast $1.5 million of capital. But bank officials say Founders should raise at least$5 million to bring the bank into full compliance with a federal cease-and-desistorder requiring a Tier 1 leverage capital ratio of 6%. That would also allow thebank to address its nonperforming loan portfolio, which currently stands at $5.7million, or 7.23% of total assets. . . . “We think this is a very much an opportunityfor investors,” Mr. Connors [President and Chief Executive] said. “We believe,given the writeoffs the bank has taken, that it is now in a position to moveforward. That’s the proposition that we make to investors, that they are dealingwith a bank that has had a very thorough review and has still intact a very high
37
level of earnings.” — “Another Conn. Bank Scrambling for Capital,”American Banker, July 11, 1995.
38
References
Anbil, S. (2018). Managing stigma during a financial crisis. Journal of Financial Economics ,130 , 166–181.
Cleves, M., Gould, W., Gould, W. W., Gutierrez, R., & Marchenko, Y. (2008). An intro-duction to survival analysis using Stata. Stata press.
Singer, J. D., & Willett, J. B. (2003). Applied longitudinal data analysis: Modeling changeand event occurrence. New York: Oxford University Press.