Occasional Paper - 21 •f.:v.''.!ii.rt%VI ^'''!^iM,}S^X^^^tv...U^ .raifri-^->;..%<£ Recovery Management in Rural Credit mm^^^.M^^i'^mstm^^Mmmm'¥^^mM K.C. SHARMA RJOSH J C MISHRA SANJAY KUMAR R. AMALORPAVANATHAN R. BHASKARAN \T/ National Bank for Agriculture and Rural Developnnent Munnbai 2001
\T/ National Bank for Agriculture and Rural Developnnent
Munnbai
2001
Occasional Paper - 21
Recovery Managennent in Rural Credit
K.C, SHARMA R JOSH
J.C. MISHRA SANJAY KUIVIAR
R. AMALORPAVANATHAN R. BHASKARAN
\T/ National Bonk for Agriculture and Rural Developnnent
Munnbai
2001
Published by National Bank for Agriculture and Rural Development, Department of Economic Analysis and Research, 4th floor, 'C Wing, Plot No. C-24, 'G' Block, Bandra-Kuria Complex, P.B. No. 8121, Bandra(East), Mumbai - 400 051. Printed at Shubhamkaroti Printers, Ghatkopar (E), Mumbai.
ii
Acknowledgement
Authors are grateful to National Bank for Agriculture and Rural Development (NABARD)
for commissioning this occasional paper to Bankers Institute of Rural Development (BIRD).
Authors prepared the paper as a team. The views expressed are those of the authors and are
not in any way attributed to the Institute they belong. The authors are thankful to DEAR,
NABARD for reviewing the paper and offering critical comments for revision. Some revision
has been done but all could not be done due to lack of relevant disaggregated data. Many
thanks to Arindam Chakrabarty for his patient typing and cheerful attitude while carrying out
editorial corrections over many drafts of the paper.
October, 2001 Authors BIRD, Lucknow
III
Authors
K.C. Sharma, P.Josh, R.Amaiorpavanathan and J.C.MIshra are Faculty Members, BIRD, Lucknow.
Sanjay Kumar Is Faculty Associate, BIRD, Lucknow
R.Bhaskaran Is Joint Director, BIRD, Lucknow.
The usual disclaimer about the responsibility of the National Bank as to the facts cited and views expressed in the paper is implied.
IV
CONTENTS
Page No
CHAPTERI
CHAPTER II
CHAPTER III
CHAPTER IV
CHAPTERV
ACKNOWLEDGEMENT
INTRODUCTION
CONCEPTUAL ASPECTS OF OVERDUES, RECOVERY AND PRUDENTIAL NORMS
IMPACT OF NPAs ON HEALTH OF RFIs
NON-PERFORMING ASSETS IN RURAL FINANCIAL INSTITUTIONS
RECOVERY PERFORMANCE
1
3
11
15
27
CHAPTER VI RECOVERY AND NPA MANAGEMENT 37
REFERENCES
CHAPTER I
INTRODUCTION
This occasional paper on recovery management in rural credit is prepared
at the behest of National Bank for Agriculture and Rural Development (NABARD),
Head Office, Mumbai. The focus is on rural financial institutions (RFIs). Regional
Rural Banks (RRBs), Co-operative banks and rural branches of Commercial Banks
(CBs) are the RFIs for the purpose of this paper.
The Broad Objectives of the Paper are
• To discuss the conceptual aspects of overdues, recovery and prudential norms.
• To analyse the pattern of build up of overdues in Rural Financial Institutions.
• To discuss the factors affecting recovery of loans in Rural Financial
Institutions.
• To suggest methods and strategies for better recovery and NPA Manage
ment in Rural Financial Institutions.
The paper is based on the review of earlier work in the area of overdues and
recovery management. Empirical analysis in the paper is based on relevant data
and information that are available to throw light on the issue of overdues and
recovery management in Rural Financial Institutions (RFIs).
Rural credit relates to credit for agriculture and non-agricultural purposes,
the former being the major component (about 85% of the total disbursement during
1998-99). The relative share of commercial banks, co-operative banks and RRBs
in the total institutional credit disbursement to agriculture is about 49, 44 and 7
per cent respectively for TE 1998-99 (Economic Survey 2000-01).
For in-depth understanding of the problem of overdues in RFIs,
NABARD had earlier sponsored three studies in Karnataka, Orissa and Madhya
Pradesh. These studies were undertaken by the National Institute of Rural Development
(NIRD 1999), Hyderabad; National Institute of Bank Management (NIBM 1996),
1
Pune; and the Bankers Institute of Rural Development (BIRD 1997), Lucknow,
respectively. This occasional paper makes use of these three study reports in addition
to other literature available on the subject. The information from RRBs and co-operative
banks (short term and long term stnjcture) is available in some detail and has been
used in the paper. However, the exact position in rural branches of CBs is not readily
available.
This occasional paper is organised in six Chapters. Chapters 2 and 3 present
the conceptual aspects of overdues, recovery, prudential norms and non-performing
assets (NPAs) that impact on the financial health of RFIs. Chapters 4 and 5 deal
with empirical analysis of NPAs and recovery performance across institutions, states
and regions. Chapter 6 deals with recovery and NPA management along with
macro policy issues including legal changes required for better recovery.
CHAPTER II
CONCEPTUAL ASPECTS OF OVERDUES, RECOVERY AND PRUDENTIAL NORMS
2.1 Overdues, Recovery and NPAs
2.1.1 Overdues and Recovery
The magnitude of recovery amount overdue is one of the most important
indicators of financial health of RFIs. Currently, the accepted standard of measurement
of overdues is in relation to demand. The logic for the demand as the basis is that it
is the amount which has become due and not the amount which is yet to become
due for repayment. This distinction is important because loans will have varying
due dates for instalments as they are issued on the basis of future cash flow from
investments.
The term "overdues" is used to convey the meaning that instalments of
loans and Interest thereon are not paid on due date. The term "recovery" of dues
relates to repayments of loans and interest thereon in time. Therefore, overdues exist
if recovery of loans is not in time.
There exists a provision in RFIs to block the part of defaults that are legally
disputed or against which legal proceedings have been initiated. This amount does
not get included in the total amount due for repayment i.e. "demand". For example,
if a RFI has Rs. 100 in default including Rs. 20, on which legal case is filed and
recovery out of Rs. 80 is Rs. 50. The recovery percentage will be calculated as
62.5% and not 50%. Therefore, exclusion of disputed amount leads to overestimation
of recovery performance.
RFIs often fail to write off bad loans due to various reasons. When bad
debts are not written off, the reported loan recovery performance may be highly
distorted. For example, assume that an RFIs lends Rs. 100 every year and recovers
90 of that each year and Rs. 10 become bad.
The Following illustration shows how the recovery percentage is calculated over a
It is clear from the above example that though recovery percent on the current
year basis is 90% throughout, on a cumulative basis it becomes 47% in tenth year.
It is therefore, not easy to accurately measure the recovery performance of RFIs if
there is no provision for writing off bad debts.
2.1.2 Non-Performing Asset (NPA)
An amount under any of the credit facilities viz., term loan, overdrafts, cash
credit account, etc. is to be treated as 'past due' when it remains unpaid for 30 days
beyond the due date. A non-performing asset (NPA) is defined as a credit facility in
respect of which interest or instalment of principal is past due for 'two quarters'. In
respect of advances for agricultural plirposes, if interest has not been paid during
the last 2 seasons of harvest (covering two half years), after it has become 'past due'
then such advance should be treated as NPA. Further, if any one of the credit
facilities enjoyed by a client becomes NPA, all of the other credit facilities enjoyed
by the client also deemed to have become NPA and are treated accordingly. In case
of RFIs, the lumping poses a problem. There are instances where the borrower
had serviced one account but not the other. Further, when there is limited
repayment to be made borrowers normally do not have option as to where the
repayment need to be applied.
2.1.3 Repayment
The assumption in delivery of credit as a source of finance is that the use of
credit would generate enough income to repay the loan with interest. However,
generation of adequate additional income has to be accompanied by willingness of
borrower to repay the loan with interest. Failure of investment may result in
non-generation of income, failure of expected income may lead to inadequate
income, perception or pressure of more important and urgent use of income
may incapacitate the repayment and finally the borrower's willingness and
desire has to be there to fulfil repayment obligation. If loans are not repaid, the RFI
loses both its interest income as well as its capital. Good management of recovery
of dues is, therefore, a complex issue encompassing economic and non-economic
factors and has implications for profitability of the RFIs.
Repayment of loan together with interest by borrowers is crucial for
recycling of funds deployed in rural credit. The fuelling of development process by
dispensing credit is meaningful only when timely repayment is forthcoming. Othenwise
expansion of credit delivery is seriously vitiated and the delivery system gets
chocked limiting the continued supply of credit by financial institutions in rural
areas. Good recovery is an important ingredient for profitability of RFIs as it leads
to increased financial capacity to deliver credit.
2.2 Prudential Norms
The introduction of banking sector reforms in 1992 is a watershed in the
Indian banking system. The reforms have not only brought about structural changes
in the Indian banking system but have also greatly influenced all types of banking
entities in various aspects of operations, governance, transparency and accountability.
Though the reforms were initially directed towards the commercial banks, they were
subsequently extended to cover the rural banking sector of the country corriprising
also of regional rural banks and co-operative banks.
Out of the various reform measures, the introduction of prudential norms
has been the cornerstone of banking sector reform process. The prudential norms
mainly cover the following four major aspects: Capital Adequacy; Income Recognitiop;
Asset Classification; and Provisioning. Herg it will be pertinent to mention the views
of the Committee on the Financial Systerri, .j 991 popularly known as Narasimh^m
Committee I.
"The committee believes that a proper system of income recognition and
provisioning is fundamental to the preservation of the strength and stability of the
banking system. A proper asset classification will however, have to precede this
exercise." (Committee on the Financial System, 1991)
The prudential norms for income recognition have to be objective and based
on "the record of recovery" rather than on any subjective or security consideration.
Likewise, the classification of assets has to be done on the basis of objective criteria
which would ensure a uniform and consistent application of norms. Under income
recognition, banks were advised not to charge and take to income account interest
on all non-performing assets. They were also required to classify all their loans
and advances into four broad group (i) standard assets (ii) sub-standard assets
(iii) doubtful assets and (iv) loss assets by compressing the existing eight health
codes on the basis of pre-defined parameters. While no provision is required to be
made in case of standard assets, provision is required to be made in case of sub
standard, doubtful and loss assets in varying degrees.
In respect of non-performing assets, interest is not recognised on accrual
basis but is booked as income only when actually received.
2.3 Applicability of Prudential Norms
The timeframe and manner of application of prudential norms to commercial
banks (CBs), regional rural banks (RRBs) and co-operative banks have been as
foiiows:
2.3.1 Commercial Banks and Regional Rural Banks
The prudential norms were introduced to CBs vide Reserve Bank of
India (RBI) circular no. DBOD.BP.BC. 129/21.04.043-92 dated 27 April 1992 in a
phased manner over a three-year period commencing with the accounting year
beginning 1 April 1992. In case of RRBs, the prudential norms relating to income
recognition, assets classification were made applicable with effect from the
accounting year 1995-96 and provisioning from the financial year 1996-97 vide RBI
circular no.03.05.34/95-96 dated 22 March 1996.
2.3.2 Co-operatives Banks
Co-operative banks in India occupy a unique position and are organised on
co-operative principles. Co-operatives are governed by the co-operative societies
act of the concerned state, while Banking Regulation Act is applicable to them only
in a limited form. Thus, co-operatives in India enjoy a quasi-banking position. Under
three tier system, the village or taluka level co-operatives are independent units that
are federated into District Central Co-operative Banks which are in turn along with
other state level societies federated into State Co-operative Banks (SCBs). Some
states have no middle tier, but have only two tier systems. In a few states, there is
only unitary system without affiliated federal membership.
Co-operative banks in the country are given preferential treatment and support
by RBI and NABARD as regards maintenance of Statutory Liquidity Ratio (SLR)
and Cash Reserve Ratio (CRR) because of their unique and quasi-banking position.
The discipline of prudential regulation was extended to co-operative banks at a
laterstagei.e 1996-97,
The prudential norms were introduced to SCBs and DCCBs vide RBI circular
No. RPCD. BC. 155/07.37.02/95-96 dated 22 June 1996 from the accounting year
1996-97 in the same form as applicable to CBs and RRBs. Though there was no
phasing in the assets classification norms as allowed in case of CBs and RRBs in
the initial years, considerable relaxation as regards provisioning in the first year
was provided to SCBs and DCCBs. The phasing in provisioning requirement was
as follows:
(i) First year of introduction of prudential norms (1996-97): 100% in re
spect of loss assets and not less than 30% of the provisioning needed
in respect of sub-standard and doubtful assets.
(ii) Second year (1997-98): The balance provisioning needed in respect
of the above categories of assets together with current provision needed in
respect of assets classified in the second year (1997-98). In other words, all
the doubtful and sub-standard assets have to be provided fully as in case of
CBs from second year onwards in addition to 100% for loss assets.
However, as some cooperative banks reported difficulties in introducing
prudential norms due to lack of relevant data / information, experience and expertise
in making provisions, Reserve Bank of India gave further relaxation of one year to
them so that the norms may be fully operationalised.
For State Go-operative Agriculture and Rural Development Banks
(SCARDBs), the long term credit structure of co-operative banks, the prudential
norms have been made applicable since 1997-98.
Income recognition on realisation basis and provisioning in respect of bad
advances were not totally new concepts to the co-operative banks before prudential
regulation. It is not that co-operative banks were unaware of the prudential norms
and provisioning aspect. In fact, there exists a system of recognizing income on
actual realization basis and not on accrual basis. They also, in most states, make
provisions on a very conservative basis which is more stringent than the present
provisioning norms in some respects. The profit appropriation stipulates norms for
bad debt reserves, statutory reserves, stabilisation fund, etc. As such, it was
observed that most of the SCBs and DCCBs, mainly profit making, had higher loan
loss provisions than what was required by the prudential norms. Nevertheless, the
prudential norms have not only standardised the whole exercise of income recognition,
classification of loan assets and provisioning but also brought about uniformity in
maintenance and disclosure of financial information which has facilitated an objective
inter-bank comparison overtime.
8
The time frame of applicability of prudential norms to the three types of RFIs
mentioned above are summarised in Table 1.1
Table 1:1 : Timeframe of Applicability of Prudential Norms in CBs, RRBs and Co-operative Banks
Prudential Norms CBs RRBs Co-operative Banks
Income Recognition
Assets classification
Provisioning
1992-93
1992-93
1995-96
1995-96
1996-97
1996-97 (with three years (with three years (No phasing for NPAs) phasing of NPAs) phasing of NPAs)
1992-93 1996-97 1996-97 (with relaxation in
the first year)
2.4 Stringency in Prudential Norms and Capital Adequacy
Initially, as mentioned above, the prudential norms were introduced to different
types of RFIs in a phased manner and that, too, in a diluted form so that RFIs may
suitably adjust to new discipline and stabilise in due course of time. It was also
expected that only a robust and vibrant RFI can cope up with stringent prudential
norms at par with international standards. The Committee on Banking Sector
Reforms (Narasimham Committee II, 1998) also emphasised this aspect and
recommended gradual tightening of the prudential norms. RBI after examining the
same and taking into account the perfomriance of the banks, have further strengthened
the prudential norms for CBs only, with a gradual time frame as follows:
• Provision for loans guaranteed by government and public financial
institutions from 31.3.99.
• Income recognition and provisioning on government guaranteed advances on
par with those on other advances with effect from 2000-2001.
• Provision for standard assets @ 0.25% with effect from 31.3.2000.
• Reduction of time frame from 24 month to 18 months for categorising advances
as doubtful from 31.3.2001.
The above stringent prudential norms have also been made applicable to
RRBs and Co-operative banks in a phased manner. Further, for CBs, the norms
shall be made more stringent as an on-going process to cope up with the new and
complex banking risks and also to keep them at par with international standards.
Alongwith the prudential norms, the capital adequacy norms were also
introduced to commercial banks with a liberal timeframe. The CBs were required to
attain a capital adequacy of minimum 8% by 31 March 1996. These norms have
been further raised to 9% with enhancement and extension of risk weights on
investments, government guaranteed advances and other assets with effect from
31.3.2000. RRBs and co-operative banks are at present, excluded from capital
adequacy norms in viewof their weak financial position, however it is expected that
these norms shall be made applicable to them also once their financial position
improves and stabilises.
10
CHAPTER III
IMPACT OF NPAs ON HEALTH OF RFIs
The non-performance of loans affects RFIs in several ways and slowly
incapacitates the institution over time. A few notable areas are discussed below:
3.1 Solvency
The solvency of the RFI as exhibited by capital adequacy ratio is directly
related to quality of its loan portfolio. Like any company, RFIs can make losses and
so need capital which acts as a cover for such difTiculties. Since the loan portfolio is
a major part of net assets of any RFI, loan defaults are a prime source of potential
losses. Thus, new equity is required whenever such loan losses occur. As loan
loss provisions are a charge to profit, the RFI's owned funds are significantly
reduced. If tax provisions are ignored, an increase in loan loss provision or writing
off an asset requires an equal amount of increase in the mandated capital (Beattie
et al, 1995). A substantial portion of non performing assets in loan portfolio, thus,
jeopardises solvency of the RFI as accretion to owned fund is reduced due to higher
provision and consequently less profit. Besides, minimum capital is to be
maintained even for hard core non performing assets falling under doubtful or loss
category which are, in effect, dead assets and are carried over in the balance
sheet over the years in the absence of write off. Thus, every time NPAs increase,
RFI has to look for additional avenues to raise minimum capital to cover them.
3.2 Profitability
After the introduction of prudential norms, the NPAs have adversely affected
the profitability of RFIs in two ways. First, there is a loss of interest income to the
extent of interest accrued on NPAs since income recognition is limited to only
standard assets. Thus, RFI's income is affected to the extent of proportion of NPAs
in loan portfolio. Secondly, the RFI has to divert a part of profit for loan loss provisions
to cover the incremental portion of NPAs. This affects the net-profit and thereby
11
erodes the solvency.
3.3 Liquidity
Banking business is a highly leveraged one. The intermediation involves
mobilizing short term deposit resources and lending for longer term on the strength
of future flow of deposits and the repayment of loans. Increasing NPAs not only
critically affect the liquidity of RFIs but also force the RFIs to maintain more liquid
assets thereby increasing the cost. Since the NPAs remain in the balance sheet of
the RFIs till they are written off or adjusted against loan loss provision which is a
long-winded process, they have to be funded either through deposits or capital so
far as they continue to remain in the balance sheet. Capital enhancement is not
always possible and can not be resorted to every year. Hence, every time NPAs
increase, deposits are mobilised to fund the incremental NPAs, thereby,
increasing interest expenditure. Further, because of the mandated obligations,
like SLR and CRR, RFIs not only have to fund the non-performing assets but for
every Rs 100 of such assets, RFIs have to look for more than Rs 100 of resources.
This can be expressed as follows:
NPAs
Deposits Required =
1- (SLR + CRR)
Where SLR = Statutory Liquidity Ratio
CRR= Cash Reserve Ratio
Thus, as the level of NPAs to total loans and advances increases, the liquidity
risk of RFI also increases.
3.4 Loan Assets Turnover
RFIs with high NPAs have a regressive loan portfolio. As large amount is
blocked in NPAs and is not available for recycling, the loan availability starts shrinking
over the period. This invariably reduces the real rate of expansion of loan portfolio.
12
RFIs as financial intermediaries provide multiplier effect to the economy by the
process of credit creation and are required to maintain a fast moving effective turnover
of loans assets. With increase in NPAs, the turnover of loan assets becomes gradually
slow and the very essence of banking i.e., credit creation is greatly hampered.
3.5 Interest Rate
Another fallout of lower profitability and shrinkage of performing loan portfolio
due to high NPAs is that the RFIs are not able to reduce the lending rate in relation
to bank rate which adversely affects their competitiveness and leads to poor credit
expansion. Moreover, as a result of higher provisioning due to incremental NPAs
and the cost of servicing the resources, the RFIs have to perforce charge higher
interest on the performing borrowers.
As the interest rate becomes higher than the market rate, the RFIs are left
with the option of adverse selection i.e., availability of only low rated borrowers for
their credit expansion which again increases the risk of creating new NPAs. Thus,
starts a vicious cycle as given below:
Low rated borrowers
Incremental NPAs High interest rate
(r> PLR)
Higher Provisioning ^ Lower Profitability
The following excerpt effectively summarises the catch-22 position of the
RFIs in this regard (Jilani, 1999).
"Besides affecting their ability to lower their interest rates, such overhang also
compels banks to maintain higher spreads to protect their profit position. In the
recent period when the inflation levels have been at all-time low, it has been
13
suggested that lending rates should also come down. Although theoretically such
reduction is relevant, yet in the context of the huge burden of NPAs and need to
maintain higher spreads to protect their profit position, banks have not been in a
position to do so."
3.6 Risk Taking Ability
Lastly, high level of NPAs reduces risk taking ability of the RFIs. It also
affects the credit rating of the RFIs thereby restricting their ability to approach the
public for capital subscription (Tier I Capital). Alternatively, a low rating substantially
increases the cost of raising funds even for Tier II Capital.
3.7 Sum Up
Thus, it can be concluded that NPAs greatly affect the financial health of the
RFIs. Nothing can highlight the importance of NPAs and their impact more than the
Narasimham Committees (I and II) whose reports have become the precursor of
the financial reforms in general and banking reforms in particular. The Committee
on Banking Sector Reforms (Narasimham Committee II, 1998) is quoted in this
regard as follows:
" NPAs constitute a real economic cost to the nation in that they reflect the
application of scarce capital and credit funds to unproductive uses. The moneys
locked up in NPAs are not available for productive use and to the extent that banks
seek to make provisions for NPAs or write them off, it is a charge on their profits. To
be able to do so, banks have to charge their productive and diligent customers a
higher rate of interest. It thus becomes a tax on efficiency. It is the customer who
uses credit efficiently that subsidises the inefficiency represented by NPAs. This
also raises the transaction costs in the system thus denying the diligent credit
customers the benefit of lower rates, which would help them to be more
efficient and competitive. NPAs, in short, are not just a problem for banks. They are
bad for the economy".
14
CHAPTER IV
NON- PERFORMING ASSETS IN RURAL
FINANCIAL INSTITUTIONS
The introduction of prudential norms has been a turning point in the reform
process of the RFIs. NPAs are the key to the whole range of prudential norms as
mentioned earlier. It will, therefore, be pertinent to have an analysis of the
Non-Performing Assets from various dimensions for three important RFIs viz., CBs,
RRBs and Co-operative banks for which data are available. The discussion on the
levels of NPAs and recovery performance is done together wherever data are available.
This is done as NPA levels and recovery performance are highly negatively correlated.
That is better recovery performance corresponds to lower NPAs.
4.1 NPAs in Commercial Banks
RBI conducted a study of NPAs in 27 public sector commercial banks. The
study reveals that the gross Non Performing Advances of these banks were marginally
reduced to 17.84% as on 31 March 1997 after introduction of objective norms. Under
the earlier concept of sticky advances, the position as on 13 March 1989 was at
17.91%. However, a paper brought out by FITCHIBCA, an international credit rating
agency, observes "there is significant improvement since 1991 when gross
Non-Performing Loans (NPL) to total loans were estimated to be around 23%, or
even in 1995-96, when this ratio was 17.5%. The bulk of the NPLs in the banking
sector are due to historical reasons and incremental NPLs, until now, were not a serious
problem".
Rajaraman, et al (1999) report bank specific percentage of net NPAs to net
advances in commercial banks for the year 1996-97. These range from 2 per cent
in case of 9 new private sector banks to 9 per cent in case of 27 public sector
banks.
15
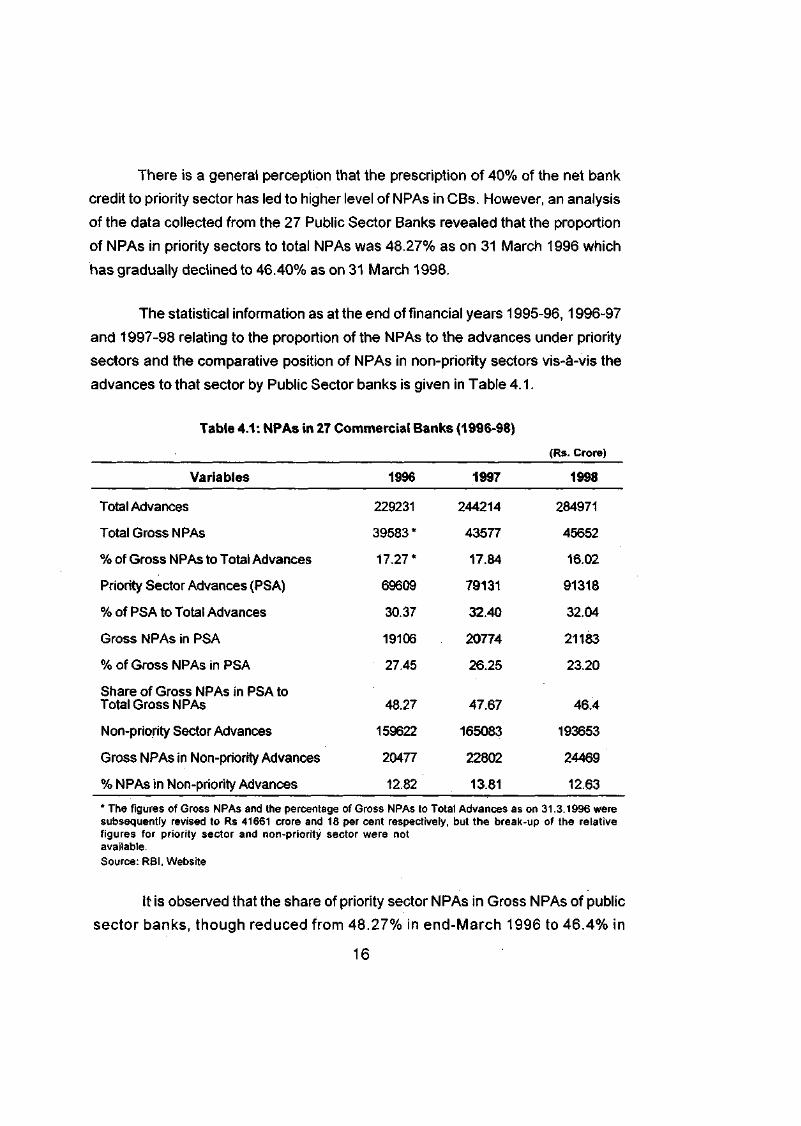
There is a general perception that the prescription of 40% of the net bank
credit to priority sector has led to higher level of NPAs in CBs. However, an analysis
of the data collected from the 27 Public Sector Banks revealed that the proportion
of NPAs in priority sectors to total NPAs was 48.27% as on 31 March 1996 which
has gradually declined to 46.40% as on 31 March 1998.
The statistical information as at the end of financial years 1995-96,1996-97
and 1997-98 relating to the proportion of the NPAs to the advances under priority
sectors and the comparative position of NPAs in non-priority sectors vis-a-vis the
advances to that sector by Public Sector banks is given in Table 4.1.
Table 4.1: NPAs in 27 Commercial Banks (1996-98)
(Rs. Crore)
Variables 1996 1997 1998
Total Advances 229231 244214 284971
Total Gross NPAs 39583 * 43577 45652
% of Gross NPAs to Total Advances 17.27* 17.84 16.02
Priority Sector Advances (PSA) 69609 79131 91318
% of PSA to Total Advances 30.37 32.40 32.04
Gross NPAs in PSA 19106 20774 21183
% of Gross NPAs in PSA 27.45 26.25 23.20
Share of Gross NPAs in PSA to Total Gross NPAs 48.27 47.67 46.4
Non-priority Sector Advances 159622 165083 193653
Gross NPAs in Non-priority Advances 20477 22802 24469
% NPAs in Non-priority Advances 12.82 13.81 12.63
* The figures of Gross NPAs and the percentage of Gross NPAs to Total Advances as subsequently revised to Rs 41661 crore and 18 per cent respectively, but the break figures for priority sector and non-priority sector were not available. Source: RBI, Website
on 31.3.1996 were •up of the relative
It is Observed that the share of priority sector NPAs in Gross NPAs of public
sector banks, though reduced from 48.27% in end-March 1996 to 46.4% in
16
end-March 1998, was significantly higher than the proportion of priority sector ad
vances to total advances, which ranged between 30% and 32% during the above
period. The percentage of gross NPAs in priority sector advances, though came
down from 27.45 per cent in end-March 1996 to 23.2 per cent in end-March 1998,
was almost twice the NPAs in Non-priority sector advances in per cent terms, which
ranged from 12.8% to 13.8% during the above period. It could be inferred that the
higher NPAs in priority sector advances have pushed up the overall proportion of
NPAs of these banks by about 3% to 4 %. However, the gradual increase in the
proportion of NPAs in non-priority sectors could indicate that NPAs are increasingly
occurring on credit accounts of industrial sector during the recent years.
4.2 NPAs in Regional Rural Banks
For a majority of RRBs, the high level of NPAs has been a major stumbling
block to attain profitability and solvency. However, at all India level, percentage of
NPAs to loans declined from 43.07% in 1995-96 to 27.89% in 1998-99. The median
NPAs in per cent, too, has come down from 45.2% in 1995-96 to 26.2% in 1998-99.
Undoubtedly, RRBs in general suffer from a high proportion of NPAs and
therefore, command a low esteem in Indian banking industry. This is due to past
policies of directed credit, faulty appraisal, poor monitoring and recovery efforts in
RRBs, etc. To have a proper perspective of NPAs in RRBs, it is necessary to
analyse the incidence of NPAs in further detail.
4.2.1 Distribution of RRBs According to NPA Level
Table 4.2 shows that over the last four years, there has been significant
improvement in terms of reduction of NPAs in RRBs. In the above 70% NPAs
category, there is only 1 RRB in 98-99 as against 22 in 95-96 and that too the lone
RRB is Tripura Gramin Bank having peculiar socio-political problems of North Eastern
(NE) region.
17
Table 4.2: Distribution of RRBs according to Percent NPA to Total Advances
% of NPA to Loans
Years Above 41% to 10% to Below Total Median 70% 70% 40% 10% NPA ratio
95-96 22 91 79 4 196 45.2
96-97 10 88 88 10 196 40.0
97-98 4 71 109 20 196 32.3
98-99 1 56 119 20 196 26.2
Source: Key Statistics on Regional Rural Banks 1996, 97,98, and 99, NABARD, Mumbai,
Initially, there has been major shift of RRBs from higher level NPA categories
(viz., above 70% and between 41 % to70%) to lower level categories but the improvement
has not further progressed downward from the 3"* category of 10% to 40% to 4*
category of below 10%. The concentration of majority of RRBs in the 3'" size
category indicates that after major reduction in NPAs, it becomes increasingly difficult
to effect marginal reduction in NPAs position & stupendous efforts are
required to further reduce the NPAs of the RRB.
4.2.2 State Wise Analysis
NPAs and recovery perfonnance of RRBs of major states of India are given in
Table 4.3
Table 4.3 : NPAs and Recovery Performance of RRBs: Major States
State 1996-97 1997-98 1998-99 % NPAs Recovery % NPAs Recovery %NPAs to loans %* to loans %* to loans
A. States with NPAs% below National Average (98-99)
1. Kerala 6.44 85.59 6.11 88.16 5.25 2. Tamil Nadu 11.06 79.24 -10.29 79.37 10.04 3. H.P. 22.33 58.97 19.33 68.95 15.58
Loss 52.07 0.30 268.74 1.34 627.37 2.37 791.43 2.65
Total Assets 17293.27 100.00 20107.73 100.00 26513.01 100.00 29907.25 100.00
Total NPAs 1626.47 9.41 2419.75 12.03 5223.85 19.70 5451.13 18.23
Source: Dossier on Co-operatlves-State-wise status of the Co-operative Credit Structure, March 1998, NABARD, Mumbai.
21
It may be observed that non-performing assets of SCBs in each category
have increased both in absolute and relative terms during the period. It may be due
to more accurate classification of non-performing assets in the subsequent year
since co-operative banks took some time to stabilise to the new system. Besides,
there might be slippage of high grade assets to the next low grades. Though, the
former factor explains the substantial increase in non-performing assets to a great
extent, there is no empirical evidence or in- depth analysis to isolate the causal
factors. However, it is expected that in later years the proportion of NPAs for SCBs
will come down with increase in loan portfolio and no fresh or marginal accretion to
existing NPAs.
Percent-wise, NPAs in both SCBs and DCCBs as a whole are pegged around
12% and 18% respectively as compared to 28% in case of RRBs. To certain extent,
the progressively low levels of NPA at higher tiers of the co-operative credit system
is the result of absorption of the burden of NPAs by lower tiers, consisting of PACS,
marketing societies etc. Further, the higher recovery rate among co-operatives as
compared to RRBs, which again is a reflection of more efficient legal recourse
available to co-operatives for recovery of overdue loans, has also helped the
co-operatives to have lower incidence of NPA. The share of NPAs in case of DCCBs
has marginally come down from 19.70% to 18.23%. It seems that DCCBs have
been able to contain the level of existing NPAs i.e., there is no fresh accretion,
however they have not been able to effectively noanage and reduce the NPAs in
absolute terms. There is no significant improvement in the first two NPAs categories
over the period though, per cent-wise, both have come down due to increase in the
size of loan portfolio.
4.3.2 Size Wise Analysis
The frequency distribution of SCBs in terms of percentage of NPAs to total
loans for the two years has been given in Table 4.6.
22
Table 4.6: Frequency Distribution of SCBs as per percentage of NPAs to Total Loans (1996-97 to 1997- 98)
% of NPAs to Loans 1996-9r 1997-98" Below 5% 6 7 5% to 10% 5 3 11% to 20% 4 4 21% to 50% 9 8 Above 50% 2 3 Total 26 25
* The data relate to 26 SCBs. Data for Arunachal Pradesh are not available. ** Data for Delhi SCB and Arunachal Pradesh are not available. Source: Dossier on Co-operatives-State-wise status of the Co-operative Credit Structure, March 1998,
NABARD, Mumbai.
In addition to Himachal Pradesh, Jammu & Kashmir, and Bihar, SCBs of
north-eastern states and union territories with peculiar socio-political problems
and poor co-operative base have NPAs above 20% in 1997-98. Thus, majority of
SCBs, specially of large states having strong co-operative base fall in the categories
of below 20%) NPAs. This is a very heartening feature. With concerted efforts, the
position can further be improved by bringing down NPAs in SCBs of North Eastern
(NE) states. The frequency distribution of NPAs percentage for DCCBs could not
be presented due to non-availability of bank-wise data for all the states.
4.3.3 State Wise Analysis
The state-wise analysis of NPAs and recovery performance for the two years
has been attempted for both SCBs and DCCBs and is presented in Tables
4.7 and 4.8, respectively.
23
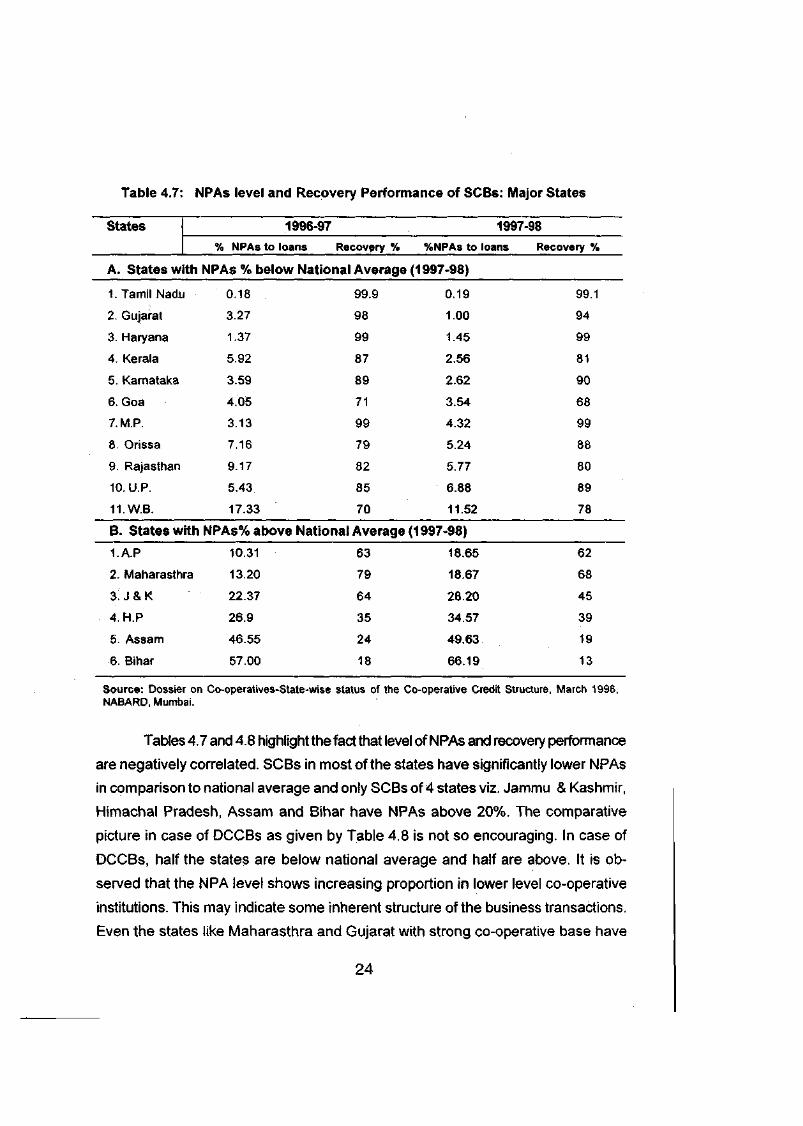
Table 4.7: NPAs level and Recovery Performance of SCBs: Major States
States 1996-97 1997-98
% NPAs to loans Recovery % %NPAs to loans Recovery %
A. States with NPAs % below National Average (1997-98)
1. Tamil Nadi 0.18 99.9 0.19 99.1
2. Gujarat 3.27 98 1.00 94
3. Haryana 1.37 99 1.45 99
4. Kerala 5.92 87 2.56 81
5. Karnataka 3.59 89 2.62 90
6. Goa 4.05 71 3.54 68
7.M.P. 3.13 99 4.32 99
8. Orissa 7.16 79 5.24 88
9. Rajasthan 9.17 82 5.77 80
10. U.P. 5.43 85 6.88 89
11.W.B. 17.33 70 11.52 78
B. States with NPAs% above National Average (1997-98)
1.A.P 10.31 63 18.65 62
2. Maharasth ra 13.20 79 18.67 68
3: J & K 22.37 64 28.20 45
4. H.P 26.9 35 34.57 39
5. Assam 46.55 24 49.63 19
6. Bihar 57.00 18 66.19 13
Source: Dossier on Co-operatives-State-wise status of the Co-operative Credit Structure, March 1998, NABARD, Mumbai.
Tables 4.7 and 4.8 highlight the fact that level of NPAs and recovery perfonnance
are negatively correlated. SCBs in most of the states have significantly lower NPAs
in comparison to national average and only SCBs of 4 states viz. Jammu & Kashmir,
Himachal Pradesh, Assam and Bihar have NPAs above 20%. The comparative
picture in case of DCCBs as given by Table 4.8 is not so encouraging. In case of
DCCBs, half the states are below national average and half are above. It is ob
served that the NPA level shows increasing proportion in lower level co-operative
institutions. This may indicate some inherent structure of the business transactions.
Even the states like Maharasthra and Gujarat with strong co-operative base have
24
weak co-operative intermediaries as indicated by high NPAs percent at DCCBs
level while it is not so in case of SCBs of these states.
Table 4.8: NPAs level and Recovery Performance of tlGCBsiMajof States
States 1996-97 1997-98
% NPAs to loans Recovery % %NPAs to loans Recovetv %
A. States with NPAs % below National Average (1997-98)
1. Haryana
2. Rajasthan
3. Tamil Nadu
4. Karnataka
5. H.P.
6. W.B.
7.A.P.
8. Kerala
4.35 12.23
10.76
31.36
15.87
16.50
11.87
15.49
79 5.98 78
83 8.84 85
60.2 12.51 76.4
75 13.35 69
63 14.97 56
72 15.11 74
75 15.52 71
80 18.12 79
B. State with NPAs % above National Average (1997-98)
LMadhya 21.36
Pradesh
2. Maharasthra 21.43
3. Orrisa 22.13
4. U.P. 28.01
5. Gujarat 20.03
6. J & K 40.60
7. Bihar 73.34
8. Assam 88.83
62 18.63 58
64 19.60 66
58 20.33 57
56 23.18 36
70 24.85 70
17 48.18 17
18 72.56 11
7 88.54 4
Source: Dossier on Co-operatives-State-wise status of the Co-operative Credit structure, March 1998, NABARD, Mumbai.
4.4 A Comparative Position of NPAs in CBs, RRBs and Co-operative Banks
To sum up. Table 4.9 gives a comparative position of growth of NPAs in CBs,
RRBs, SCBs and DCCBs for the last 3 years.
25
Table 4.9: Growth of NPAs in CBs, RRBs, SCBs and DCCBs
(1996-97 to 1998-99)
Category of Banks
NPAas%of to ta l Advances
Volume of NPAs (Rs. Crores) Share in the total NPAs
3. Jammu & Kashmir 74 64 45 34 23 17 17 26 NA NA NA
4. Punjab 99 99 100 96 89 87 87 88 83 83 85
5. Rajasthan 85 85 81 89 80 83 85 83 71 68 70
6. Chandigarh 48 49 34 22 NA NA NA NA NA NA NA
7. Delhi 53 48 51 39 NA NA NA NA NA NA NA
North- Eastern
Region
1. Arunnachal Pradesh28 25 22 37 NA NA NA NA NA NA NA
2. Assam 24 24 20 27 6 7 4 5 NA NA NA
3. Manipur 9 8 4 4 NA NA NA NA NA NA NA
4. Meghalaya 39 41 40 44 NA NA NA NA NA NA NA
5. Mizoram 11 31 43 42 NA NA NA NA NA NA NA
6. Nagaland 39 28 23 13 NA NA NA NA NA NA NA
7. Tripura 25 28 19 34 NA NA NA NA NA NA NA
Eastern Region
1. Bihar 20 18 13 7 18 18 11 12 NA NA NA
2, Orissa 78 79 88 91 61 58 57 48 63 40 49
3. West Bengal 62 70 78 78 76 72 74 75 67 72 NA
4. Andaman & 44 55 61 64 NA NA NA NA 52 55 60
Nicobar
Central Region
1. Madya Pradesh 97 99 99 94 59 52 58 60 50 52 64
2. Uttar Pradesh 85 85 89 80 58 56 54 53 67 43 41
Western Region
1. Goa 74 72 68 66 NA NA NA NA 47 51 47
2. Gujarat 99 98 94 90 67 70 70 66 71 69 69
3. Maharashtra 86 84 78 84 66 64 68 66 57 57 55
Southern Region
1. Andhra Pradesh 68 63 62 72 69 75 71 72 55 NA NA
2. Karnatal<a 92 89 90 91 73 68 69 71 67 65 79
3. Kerala 96 87 81 88 77 80 79 84 79 NA 83
4. Tamil Nadu 99.8 99.9 97.3 94.6 77.7 80.2 76.4 77.4 70 62 62
5. Pondicherry 61 59 63 NA NA NA NA NA 53 48 44 Source: Dossier on Cooperatives, NABARD, Manual 1998 & 1999. NA= Not Available/ Applicable.
31
Recovery percentage in relation to long term co-operative credit is lower
compared to short term co-operative credit generally. However, recovery patterns
are similar across states in case of short term and long term co-operative credit.
Table 5.4 : Recovery Percentage of Long Term Cooperative Credit (% of Collection to Demand)
states SCARDB PCARDBs
95-96 96-97 97-98 98-99 95-96 96-97 97-98 98-99 A. Northern Region 1. Haryana 95 96 93 94 66 70 65 69 2. Himachal Pradesh 65 70 67 69 69 80 80 81 3. Jammu & Kashmir 39 32 33 37 NA NA NA NA 4. Punjab 100 100 100 100 89 82 83 83 5. Rajasthan 80 84 85 82 69 72 67 65 6. Chandigarh 48 49 34 22 NA NA NA NA 7. Delhi NA NA NA NA NA NA NA NA B. Northern -Easterr 1 Region 1, Arunachal Pradesh NA NA NA NA NA NA NA NA 2. Assam 2 24 16 1 NA NA NA NA 3. Manipur 11.91 11.15 4.99 NA NA NA NA NA 4. Mehhalaya NA NA NA NA NA NA NA NA 5. Mizoram NA NA NA NA NA NA NA NA 6. Nagaland NA NA NA NA NA NA NA NA 7. Tripura 66 51 44 57 NA NA NA NA C. Eastern Region 1. Bihar 33 38 38 36 NA NA NA NA 2. Orissa 18 11 6 7 39 31 24 23 3. West Bengal 60 61 62 64 60 63 62 59 4. Andaman & Nicobar NA NA NA NA NA NA NA NA D. Central Region 1. iVIadhya Pradesh 39 42 37 42 52 55 48 60 2. Uttar Pradesh 79 80 81 82 NA NA NA NA E. Western Region 1. Goa 2. Gujarat 66 65 66 64 NA NA NA NA 3. Maharashtra 52 50 44 45 NA NA NA NA F. Southern Region 1. Andhra Pradesh NA NA NA NA NA NA NA NA 2. Karnatal<a 38 41 31 33 36 38 32 34 3. Kerala 92 93 93 95 75 76 73 73 4 Tamil Nadu 50 55 51 52 42 47 43 47 5. Pondicherry 49 53 36 41 NA NA NA NA
Source: Dossier on Cooperatives, NABARD Manual 1998 & 1999. NA = Not Available/ Applicable.
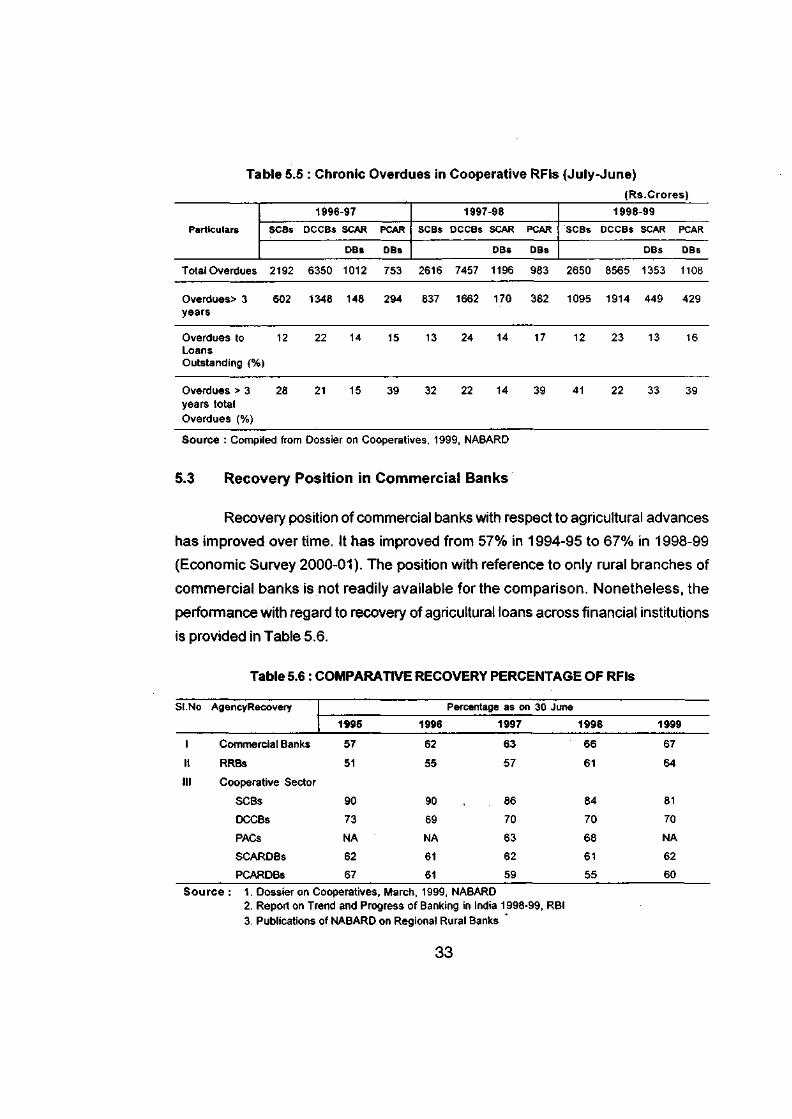
The amount of overdues in co-operative RFIs is shown in Table 5.5. Overall
picture that emerges is that of increasing overdues in short term and long term
co-operative credit in India.
32
Table 5.5 : Chronic Overdues in Cooperative RFIs (July-June) (Rs.Crores)
Source : Compiled from Dossier on Cooperatives, 1999, NABARD
5.3 Recovery Position in Commercial Banks
Recovery position of commercial banks with respect to agricultural advances
has improved overtime. It has improved from 57% in 1994-95 to 67% in 1998-99
(Economic Survey 2000-01). The position with reference to only rural branches of
commercial banks is not readily available for the comparison. Nonetheless, the
performance with regard to recovery of agricultural loans across financial institutions
is provided in Table 5.6.
Table 5.6 : COMPARATIVE RECOVERY PERCENTAGE OF RFIs
SI.No AgencyRecovery Percentage as on 30 June AgencyRecovery
1995 1996 1997 1998 1999
1 Commercial Banks 57 62 63 66 67
II RRBs 51 55 57 61 64
III Cooperative Sector
SCBs 90 90 86 84 81
DCCBs 73 69 70 70 70
PACs NA NA 63 68 NA
SCARDBs 62 61 62 61 62
PCARDBs 67 61 59 55 60
Source : 1. Dossier on Cooperatives, March, 1999, NABARD 2. Report on Trend and Progress of Banking in India 1998-99, RBI 3. Publications of NABARD on Regional Rural Banks
33
Table 5.6 shows that recovery percentage is improving in case of CBs and
RRBs whereas it is worsening in case of co-operatives. However, in absolute sense,
recovery percentage is higher in case of co-operatives (SCBs and DCCBs) generally
compared to that of CBs and RRBs.
5.4 Feasibility of Demand Collection Balance (DOB) Reporting
Demand collection balance (DCB) data relating to recovery are presented
July to June every year whereas other banking statistics are presented April to
March every year. It seems reasonable to think that if DCB is also reported April to
March every year, it would make it consistent with other banking statistics.
However, rural credit being largely agricultural credit, its recovery season
coincides with agricultural season. Recoveries start coming after the Rabi crop in
March and April. If DCB is reported in March, it would provide an underestimate of
actual amount recovered which in fact belongs to that year.
Nonetheless, it is an interesting point to investigate the difference between
DCB ending March and DCB ending June. If the difference is significant, it is
worthwhile to see the figures for few years. If the difference is not significant, it
could very well be changed to ending March every year to make it consistent with
other banking statistics. As a matter of fact, both DCB figures can be compared
and it should not be difficult to do so with available information technology with
RFIs, at least at corporate level.
As regards the shift from June to March, it would make a difference only in
the first year when DCB will be reported for nine months. From the next year onward,
it would be for the whole year. Therefore, the transition from June ending to March
ending should not be difficult if the shift is considered appropriate for comparison with
other banking statistics which are reported according to the financial year ending
March every year.
34
5.5 Factors Affecting Recovery of Loans in RFIs
The discussion above points to the fact that recovery performance of
commercial banks (CBs) and RRBs has improved in the recent past whereas
it has stagnated or worsened in case of co-operatives. However, there are inter-
institutional and intra-institutional differences in recovery performance. This, however,
should not be taken as a matter for complacency because recovery percentage
should be close to hundred per cent if the build-up of NPAs has to be arrested.
Therefore, it is important to consider the factors which are responsible for low
recovery of loans in RFIs.
The factors affecting the recovery of loans by RFIs may be broadly grouped
into two, the external and the internal. Among the internal factors, some are related
to the borrowers and some are related to the RFIs. A few important factors responsible
for poor recovery of loans and therefore build up of NPAs in RFIs are illustrated in
Box. 1.
35
Box 1: REASONS FOR POOR RECOVERY OF LOANS IN RFIs
A. External
Natural calamities Political Interference Loan waiver, write off, etc. Geographical factors Changes in Policy environment Changes in Technology Changes in Economic Conditions Target approach under Government sponsored programmes Legal process
B. Internal
I. RFI Related:
Credit Decisions
Improper identification of borrower—| Lack of appraisal skills Delay in loan sanctioning Under or over financing Insufficient gestation or repayment period Lack of post-disbursement follow-up Lack of borrower contact and poor understanding of rural clientele No thrust on recovery Laxity in internal control systems Poor Management Information System Failure to ensure adequate rapport with government agencies Low motivation and involvement of staff Perception of bank as a charity institution Poor Industrial Relations climate
II. Borrower Related:
Misutilisation of Loan Diversion of Funds Lack of Technical and Managerial Skills Poor maintenance of Assets Wilful Default Personal accident, death, etc. Shifting of place of residence or business
The external factors such as natural calamities, political interference, policy
changes and legal process are outside the control of RFIs but are critical for
creating conducive recovery climate. The internal factors - be related to the
borrower or the RFI, are within the zone of influence of RFIs. Proper methods of
borrower appraisal and credit management may yield good results if RFIs conduct
the job of recovery management well under the changed economic environment of
financial reforms. Various methods to improve recovery performance and NPA
management are discussed in the following section.
36
CHAPTER VI
RECOVERY AND NPA MANAGEMENT
RFIs were never so serious in their efforts to ensure timely recovery and
consequent reduction of NPAs as they are today. It is important to remember that
recovery management, be of fresh loans or old loans, is central to NPA management.
This management process needs to start at the loan initiating stage itself. Effective
management of recovery and NPA comprise two pronged strategy. First relates to
arresting of the defaults and creation of NPA thereof and the second is to handling
of loan delinquencies. The tenets of financial sector reforms were revolutionary
which created a sense of urgency in the minds of staff of RFIs and gave them a
message that either they perform or perish. The prudential norms has forced the
RFIs to look into the asset quality. The recovery and NPA management strategies
adopted by the RFIs may be classified into two broad categories viz. 1. Preventive
and 2. Corrective strategies. While preventive methods are aimed at preventing the
event of a default within the prescribed procedures, the corrective methods are^
aimed at ensuring recoveries once credit is due for payment.
6.1 Preventive Methods
The preventive methods include-
• More careful and responsible scrutiny and appraisal. This includes timely
sanction, realism in fixing repayment schedule and adequacy of credit with
efficient delivery.
• Evolving a broad loan recovery policy and implementing through the cadres
with adequate accountability and empowerment.
• Regular and effective follow up with borrowers and timely action on sensing
the likely default.
• Title, value, etc. and additional security are to be investigated before the
disbursement of loan.
• More detailed information about the borrowers is to be obtained in terms of
37
his/her family background such as i) size of the family ii) number of depen
dents in the family iii) earning members in the family iv) standard of living v)
length of residency in the area, etc.
• Reviewing the advances in time and taking appropriate immediate action.
• Sending demand notices in time.
• Contacting the borrower before the harvest or cash inflow.
• Proper supervision of the borrowal account through personal visits and
calling for periodical returns to get incipient signals of default.
• Efficient MIS system on the borrowers and on the branches.
• Credit rating of clientele.
• Developing an early warning system for identifying potential weakness in
the accounts.
• Strict observance of time schedules.
• Timely extension of period of limitation through debt acknowledgement,
partial payment, renewal of documents etc.
• Timely rephasement or rescheduling of loan in the event of natural
calamities.
RFIs particularly the Regional Rural Banks in recent years have resorted to
the preventive methods to ensure prompt recovery. These methods are seldom
resorted to by the co-operative system because under the co-operative laws strin
gent legal actions could be ensured to force a recovery. In case of Commercial
Banks performing in rural areas, the preventive methods are not so much visible.
This may be because they have a wider option to relocate or consolidate their rural
branches or may be as a percentage the rural lending is small against their total
loans and advances.
6.2 Corrective Methods
The corrective methods conventionally start with initiating legal action for
recovery and followed by lodging insurance claims with DICGCI wherever possible
and initiating coercive action against the borrower and the surety. However, corrective
methods, in recent years, have become more innovative and participatory.
38
The distinction between preventive and corrective methods has become blurred.
Some corrective methods, as practiced mainly by RRBs, are discussed here.
(i) Sharing the Threat Perception
The top management conducts seminars and meetings with the staff and
conveys the crisis in which the RRB is in. It indicates that unless recoveries start
coming the RRB would be closed. Periodical seminars involving small group
of Branch Managers and other staff including the sub-staff are conducted to
educate them about the impact of NPA accounts on the overall profitability of the
branch and RRB and how it affects the very existence of the RRB.
(ii) Staff Motivation
Some Regional Rural Banks have dismantled the demotivated mindset of
their staff by releasing staff benefits like conveyance allowance, housing loan, etc.
and some have effected promotions. These measures have motivated the staff to
perform better in every area and particularly the areas which hurt the bank the most
viz. recovery of loans and management of NPAs. In some banks the organisational
development intervention (ODI) has motivated the staff to step up recovery efforts
(e.g., Howrah Gramin Bank).
Shields, trophies and appreciation certificates are awarded to the staff and
branches showing good recovery performances, in some cases transfer to cen
tres of choice are linked to recovery performance of the concerned staff. In some
banks, in each branch the NPA accounts are allotted to each staff right from the
officer to the messenger for personal follow-up and monitoring.
(iii) Constitution of Special Recovery Cells and Related Measures
The special recovery cell in some RRBs maintains rapport with Nodal Officers
and branches for effecting recoveries. For example in the case of RRBs sponsored
by Syndicate Bank, the Head Office of RRB identifies branches which constitute
39
50% of the total NPA of the bank so that Head Office can have control over the
recovery efforts initiated at the selected high NPA branches through intensive
monitoring. In some cases, top 100 NPA accounts of the bank pertaining to various
branches are identified and monitored directly from the Head Office in co-ordination
with branches. Following steps are taken.
• Executives of RRBs visit selected 100 NPA parties and establish direct
personal contact for ensuring recovery. The RRBs arrange for customers'
meet especially of NPA clients at various important centres to discuss and
address their problems.
The RRBs arrange periodical lawyers' meet to review the status of suit filed
cases.
Pragmatic approach is followed for out of court settlement of loan accounts
and bringing compromise proposals to logical end at the earliest.
Identification of potential NPAs Is done by the end of the first quarter of the
financial year so that preventive measures could be initiated at the beginning.
Staff mobility is ensured and the recovery staff is allowed to hire transport to
suit their needs and no questions are asked.
Staff are deputed to Sub Divisional Officer (SDO) orTehsil courts to assist
the court staff for issuing notices to borrowers In case of overdue loans.
Periodical recovery camps are held In villages In co-ordination with Government
officials.
The borrowers are constantly reminded about their overdues and notice to
clear them are regularly sent.
List of defaulters is displayed in the notice board of the branch without
disclosing the account number, amount of loan, overdue, etc. The Idea is
simply to draw attention of the defaulters to contact the Branch Manager.
A copy of the list Is also given to the counter clerk so that he/she can ask the
defaulters whenever they come to the branch to transact to meet the Branch
Manager.
40
(iv) Involvement of Government Agencies
There are instances where RRBs are able to recover overdue loans by
involving District Administration. Some of the methods adopted to involve government
machinery are listed below:-
• Revenue recovery notices are issued by the District Magistrate or Sub-
Divisional Officer once a year advising Ixjrrowers to deposit the overdue amount
in the RRB to avoid legal actions permitted under the law.
• The list of defaulters is given to the Revenue Authorities or Tehsildars in case
of agriculture loans, in case of industrial loans the list is given to District
Industries Centres for follow-up.
• Joint recovery teams are formed in which Tehsildars, Revenue Inspector,
Patwari and RRB Staff jointly participate to expedite the execution of
decrees.
• Help of Block Development Officer (BDO) is solicited in case of Government
sponsored schemes. Joint inspections are carried out with BDO and incase
of accounts where misutilisation of loans and subsidy amount is noticed,
joint First information reports (FIRs) are lodged.
(v) Extraordinary Methods
Apart from what has been stated above some RRBs have
adopted certain extra-ordinary methods to ensure recovery and a few of
such methods adopted by the RRBs are narrated here.
• Announcing the names of the defaulters in market places through drum beating.
• Approaching influential bon-owers who are defaulters, while important functions
such as thread ceremony, marriage, etc. are going on in their houses. Cases
have been reported where the branch staff have directly asked for repayment
during such functions and loans have been repaid because the borrowers
(defaulters) tried to protect their self prestige in the presence of invited guests
and relatives. But there are also instances where the branch staff have simply
41
attended the marriage ceremony with gifts and repayments have followed.
In some cases, the branch staff have paid money for the performance of
last rites in the event of the death in the family of the borrower (defaulter)
and repayments have followed.
• List of defaulters prepared and pasted at public places and the recovery
van, a hired jeep, was flag marched with banner Vasuli Dal (recovery squad)
by order of district administration. Bank records related to recovery were kept
wrapped in red cloth to impress the public that Government officials are also
involved in the recovery of bank dues.
• In some places the visit of a police constable to a particular person's house is
considered inauspicious and banks' taking advantage of this aspect have
served recovery notices through police constables and have put pressure
to get the loans recovered.
The methods mentioned above have either tried to tarnish the social image
or appeal to the morale of the borrower to repay the banks' dues. While these meth
ods have yielded fruitful results in some places it may be dangerous and risky to
adopt such methods everywhere.
To sum up, it may be seen that whether it is preventive or corrective method,
proper motivation and commitment of the bank staff, strict adherence to proper loan
supervision and monitoring and a congenial relationship with Government machinery
contribute to good recovery. But there may be cases where all or any of these
methods fail and consequently the loans have to be finally written off. Moreover, the
legal procedure in regard to recovery of bank dues is cumbersome, lengthy and
time consuming and it is time to critically examine these laws for their efficacy.
42
(vi) Corrective Management for NPA Management
The following diagram shows the corrective management of NPAs.
Study the problems of NPAs - branch-wise, amount-wise and age-wise
I Prepare a loan recovery policy and strategies exclusively for NPAs
1 Create Special Recovery Cell at various levels
I jnd
I 'en
I Identify critical branches for intensive recovery
t Fix targets of recovery and draw timebound action programme i
gtf
i Select proper strategy for solving the problem of each NPA account
I Monitor implementation of time bound action plan
Under corrective management, each NPA has to be examined in totality and
on the basis of various factors like past efforts, period of overdue, client profile,
natural calamities etc. and suitable strategy is decided. Since the reasons or factors re
sponsible for sliding a good loan into bad one vary for each loan account, it is neces
sary to adopt different strategies for different NPA accounts. Some corrective man
agement strategies for reducing NPAs are:
• Recovery Strategies
effect recovery
compromises to improve recovery status of account
partial write off
adjustment of collateral securities
pressure on guarantors
43
special recovery drive
help from revenue authorities
Rephasement of loans or Rescheduling of demands
Rehabilitation of potentially viable units
Compromise with borrowers for final settlements
Calling up the advances and filing of civil suits
Approaching debt recovery tribunals
Settlement of claims with Deposit Insurance and Credit Guarantee
Corporation of India (DICGCI) and Export Credit Guarantee Corporation
of India (ECGCI).
Write off the outstandings
6.3 Recovery Through Legal Process
Experience has shown that legal support is critical to recovery management.
The recovery of loans through crystallised collateral and other back-stoppings is
subject to a prolix process as the present legal system normally does not provide a
fast and effective exit route. Discussion on recovery process through legal means
amenable to RFIs is presented in the following section.
6.3.1 Legal System Administration
The security obtained for a loan account has only one major objective, that,
in the event of default, the RFI should be able to recover the money through the
security. It could be by sale of the security or through the compromise process as the
borrower would not like to lose the security.
The process of recovery through legal process involves proper documentation
of credit, issue of notices, filing and sustaining of suit in the court of law, obtaining the
decree, issue advertisement in the newspapers on the intention of execution of decree,
arrange for execution, make the sale, realize the proceeds and adjust the loan. In
almost all the activities, the RFI needs the services of professionals such as lawyers,
court receivers, etc. The bank has to meet all these expenses and adjust or seek
44
reimbursement once the decree is executed from out of sale proceeds as per decree.
However, in most cases the cost aJlowed is far less than the actual, inflicting high
expenditure to the banks. It is seen that in case of RFIs, the legal process is not only long
drawn buK also expensive.ln the meantime, as per prudent accounting procedure, the money
will remain in the books of accounts without earning anyinterest. Also, making it imperative
to make provisions as per directives. The following points are worth mentioning.
i The law does not allow sale as an automatic right of the creditor - except
through a court process even in the case of mortgage,
i The procedure for seizure and foreclosure is involved and costly,
ii In many cases, such as tribals, property alienation is not permitted,
iv In case of small loans to poor, there is no asset available for attachments.
Therefore, proper and effective legal process is very crucial in creating a
repayment atmosphere. If it is proved that the legal process is time consuming and
long, it would make the security ineffective. Once this is well known, borrowers would
not hesitate to offer security as they can default with impunity and get compromises.
Maharastra Land Development Bank (LDB) has, in fact put the entire compromise
process in the form of Bye-Laws which encourage a borrower to default to and then
settle the dues after getting substantial interest waiver. Nowadays, compromise
proposals are on the increase. For the compromise process to start the RFI will have
to complete the legal process and obtain the decree. Once the borrower is apprehensive
of losing the security he comes to the compromise table. In case of loan accounts
where there are no assets to proceed against, the compromise is a non-starter.
6.3.2 Use of Collaterals and Collateral Substitute
It is seen that the recovery process through legal system with or without collat
eral is equally costly and lengthy. The court fee is payable on the amount of default or on
the amount to be recovered and not on the value of the security. Judiciary and Revenue
machinery have been generally unable to help the RFIs in recovery. The sheer volume
of cases weighs them down even if the system has the intention. Except for the
demonstrative effect, filing of summary or money suit for unsecured loans does not
45
provide any tangible benefit for the RFIs. RFIs observe that pursuing such suits to a
logical end is not prudent as it involves higher administrative and risk costs for them.
The expenses made on the court lie in the books of accounts until their
recovery is made by effecting the sale. This is a drain on the RFI's resources and
is often without any return for the RFI during the period. The RFIs feel that the cost of executing the collateral is quite high for the RFIs.
6.3.3 Efficacy of Cooperative Law
Under State enactments, the Cooperative Banks and Credit Societies enjoy
certain privileges like 'change' and priority over other creditors for recovery of dues
from members. They also enjoy exemption from payment of stamp duty and
registration charges for mortgaged land while availing agricultural loans (upto
some financial ceiling) and the creation of mortgage by the borrower by simple
declaration.
In addition, the Cooperative Banks enjoy special facilities to expedite the
process of recovery of their dues without recourse to civil courts. State Laws
authorise some officials of the Government (Registrars of Cooperative Societies)
to exercise the powers of a civil court to order attachment and sale of property of
debtor to fulfill the repayment obligation to a cooperative society.
The essence of these special facilities, usually referred to as summary procedure,
is that the authorised officials are empowered to issue an order having the force of a
decree of a civil court for payment of any sum due to the banks by sale of the
property changed or mortgaged in favour of the bank. These powers have been
granted to facilitate recovery of dues of cooperatives without having to resort to time
consuming litigation in civil courts. The Recovery performance of the cooperatives is
not improving despite the above special facilities showing the inept handling by
government machinery. The cost, despite the easy procedure, is high as the high
cost of the departmental officials for the semi judiciary process is met by these
banks in addition to recovery officers of the bank. Further, the execution of awards
46
through sale gets, most often, vitiated by external forces, as being the government
agency, cutting the root of the efficacy of the special facilities supposedly given to
co-operatives.
6.3.4 Revenue Recovery Acts
An Expert Group headed by Shri R.K. Talwar in 1970 had recommended
extension of similar facilities to commercial banks by appropriate State legislation
(TalwarCommittee, 1970). On the basis of the recommendations of the Talwar Committee,
the State Governments (barring nine) have passed the Agricultural Credit Operations
and Miscellaneous Provisions (Banks) Act, The act empowers designated officials
of Revenue Department to issue an order having a force of decree of a civil court
for payments of any sum due to a bank by sale of the property charged or mortgaged
in favour of the bank. This facilitates foreclosure of mortgage on land in bank's
favour and brings the property for sale. Under the act a nominal fee and not the
entire salary of the government official, is charged to the bank.
The recovery officers under the Act have helped in recovering small loans of
the banks. The banks, in States like Uttar Pradesh, Karnataka, have taken proactive
steps to fund the cost (salary of recovery officers and other incidental expenses) by
making a collective contribution for their establishment and/or allowing a recovery fee
of 5% to 10% of the recovered amount towards their maintenance. But the above
system has not worked uniformly well in all the states. The state governments had
found it difficult to spare officials possessing zeal for this type of work which is a
prerequisite for a supporting machinery to work efficiently. Use of government official
machinery helps in infusion of the threat perception amongst people, but the political
interference becomes a part of it. Therefore, the lack of political will beconrles a
hindering factor in the process. It would perhaps be necessary to study the
relative efficiency of the system across the country, so that improvements wherever
possible, could be made.
47
6.3.5 Debt Recovery Tribunals
Special Debt Recovery Tribunals (SDRTs) have been set up under the Recovery
of Debts due to banks and Financial Institutions Act, 1993 for expeditious adjudication
and recovery of debts. These courts now adjudicate banks' suits involving amount
of Rs 10 lakh and above by transferring the cases pending with the civil courts.
These loans are nomnally secured with collaterals. Only six such tribunals are operative
now. The number of such tribunals is inadequate resulting in large number of cases
pending before them. They are not yet equipped with proper infrastructure and flexibility
to function smoothly.
For recovery of small loans and to ensure quick justice on settlement of
dues, Lok Adalats (People's Courts) have been set up in some States. These
courts are headed by retired high court judges and two other members. These
small courts are found to be of success in selected pockets. Efforts are continuing
to popularise this arrangement. The judgement of these courts are found to lack
the teeth of a civil court judgement for their enforceability. But these courts have
provided good opportunity to narrow or bridge the differences between the banker
and the defaulter by creating a favourable environment for a settlement and also in
formalising such settlements.
6.3.6 Legal Changes Required
From the above and the immensity of cases pending in the courts it is obvi
ous that the recovery of RFI dues through the legal process has not been encouraging.
With the introduction of the NPA norms and as the secured NPA loans are
subject to lesser provisions than the unsecured NPA loans, it is essential to look
into the effectiveness of security and legal process towards recovery. There is no
doubt that the laws governing the collaterals need to be improved and the legal
process expedited. It is perhaps essential to start many units of the Revenue Recovery
(RR) procedures in each state. Increasing the efficiency of the RR courts, SDRTs
and making the sale of a mortgaged or hypothecated asset possible without court
intervention are some of the steps that need to be taken in this direction. As more
48
and more RFIs feel the pressure of NPAs such improvements are crucial to the
success of rural financial intermediation.
One of the most important causes hampering the recoveries of NPAs, among
other things is a long-winded and ineffective legal recourse available to RFIs in India. A
legal framework that clearly defines the rights and liabilities of parties to contracts
and provides for a speedy resolution of disputes is essential for efficient financial
intermediation. It is true that existing legal framework is archaic, slow and outright
non-productive as discussed above. It is also not in tune with the changing commercial
practices and banking refonns. Some of the legal acts which were enacted in nineteenth
century and therefore require immediate overhauling are Indian Contract Act 1872,
Transfer of Property Act 1882 and Indian Stamp Act 1899.
It is understood that RBI has already constituted committees for looking into
the necessary amendments to various banking related Acts. Simultaneously, there is
a committee which is looking into the amendments necessary in the plethora of
Acts that affect the collateral and collateral efficiency.
Improvements in the legal process involving collaterals will have no impact
in the case of small loans where the borrowers have no collaterals to offer. It is
here that the propagation of various models of microfinance will be welcome.
6.4 Macro Policy issues
6.4.1 Central Government and State Governments
The great contribution central and state governments can make in improving
recovery management of RFIs is by not announcing politically motivated schemes
like distribution of loans through loan melas, loan waivers, interest waivers, etc.
State government have to ensure that no state law governing the business
of co-operative banking is curtailing the liabilities provided under B.R. Act by RBI.
That is, state governments need to liberate banking co-operatives in line with
B.R.Act. This includes freedom on interest rate matters, terms of lending etc.
49
Regarding the law of mortgage, the response has been to enact the
separate enactments by many states to remove difficulties in recovery of loans
and to speed up the process of enforcement and foreclosure. Besides, suggesting
amendments in the various legal Acts, Narasimham Committee II (1998) has
recommended two approaches to recover NPAs and thus, to cleanse the balance
sheet of the banks. They are:
(i) Setting up of Special Tribunals for recovery of dues to banks
and financial institutions. (Originally suggested by the Tiwari Committee
(1984) and subsequently endorsed by both the Narasimham
Committees)
(ii) Forming of special purpose vehicle like Asset Reconstruction Company
(ARC) for each bank or a group of banks.
The special tribunals known as debt recovery tribunals (DRT) have been
set up under the DRT Act as mentioned earlier. Recently, Government of India has
approved granting more teeth to DRT act by moving some important amendments.
These relate to empowerment of tribunals to attach property on filing of complaint
of default by the bank. Besides, it also empowers the processing officers to execute
the decree based on a certificate issued by the DRT. These two steps together
would ensure speedy recovery of dues, iron out delays at the DRT end as well as
prompt action without waiting for the venture to go sick.
Some important areas where the support of the GOI/ RBI/ NABARD is
required for improved recovery management are outlined as follows.
i) RFIs should be governed by the state Act for empowering recovery
initiatives with specific provisions. A Rural Credit Recovery Act could
cover all loans issued in the state but not covered by Debt Recovery
Tribunals. Empowered Rural Credit courts financed by all RFIs, as a
percentage of rural credit portfolios may be established.
Or
ii) The state governments may speedily devise suitable
mechanisms under the existing legislation such as Revenue Recovery
50
Act, Public Debt Recovery Act etc., for providing recovery assistance
to RFIs.
iii) The RFIs need to be allowed to offer social security financial
products, like rehabilitation loans, insurance, etc. directly or
indirectly in collaboration with other agencies offering such products.
This would broad base the functioning of RFIs at village level and
would improve the recovery climate.
6.4.2 Internal Policies of RFIs
In the changed circumstances of financial reforms, more and more freedom
to RFI in decision making is expected. RFIs will have to act promptly to benefit from
such freedom in decision making.
For speedy recovery management, decentralisation of decision making
regarding resheduling of loans and repayments due to local events of drought,
floods, etc. should be with regional, zonal or branch managers in the area.
Similarly, decisions regarding compromises and write offs should also be
decentralised to branch level. This decentralisation in terms of decision making is
not limited to just taking decisions at branch level but making branch staff account
able to their decisions. There is also an urgent need to train the bank staff on prudent
decisions making.
Innovative methods of involving panchayats, good non government
organisations (NGOs), self help groups (SHGs), Vikas Volunteer Vahini (VW) farmers'
clubs, etc. for recovery of loans need to be evolved. This is because these local
level institutions - be formal legal entities like panchayats and NGOs or informal
entities like SHGs and \AA/ farmer clubs have the advantage of understanding the
local conditions better. The RFIs could benefit from this advantage if these are
involved in informing and educating the borrowers the benefits of prompt recovery
for continued financial services in a sustainable manner.
RFIs have to involve themselves more in propagating rural technology, rural
51
health etc. to exhibit their concern for rural development for mutual benefit rather
than just the credit alone. It is this feature of credit that has potential to distinguish
RFIs from others, increase their relevance in the rural setting and improve the
recovery climate in rural areas.
It is sincerely hoped that RFIs working in rural India shall be able to manage
recovery to reduce NPAs effectively by adopting suitable preventive and corrective
recovery methods specific to their area and clientele.
6.5 Sum Up
Legal support is critical to effective recovery management. However, the
experience with legal support has not been very encouraging as it has been prolonged,
ineffective and expensive for the RFIs. A legal system that clearly defines the rights
and liabilities of parties to contracts and provides for timely resolution of disputes is
essential for efficient recovery management. Existence of legal framework is one
thing and its enforcement is quite another. Changes are required on both fronts.
Outdated laws need to be changed and laws enacted need to be properly enforced.
It is heartening to note that RBI has already taken initiatives in this direction.
The role of governments (Central and State) is crucial for creating and main
taining proper recovery environment in society. India being a democratic
country, politically motivated but otherwise damaging public announcements like
loan waivers, interest waivers, etc. pollute the recovery environment. Governments
have to learn to respect the professionalism of RFIs and should not interfere in their
business affairs.
In the era of financial reforms involving liberalization and decentralisation in
decision making, it is important that it percolates down to branches of RFIs. Decisions
relating to rescheduling of loans and repayments at branch level due to local conditions
of drought, floods, etc. is an example to illustrate the point. Similarly, decisions
regarding compromises and write offs also need to be decentralised to branch
level. This decentralisation in terms of decision making is not only limited to decision
52
making alone but is about making branch staff accountable to their decisions.
With renewed emphasis on participatory development process, it is relevant
that RFIs involve panchayats, NGOs, SHGs and V W farmer clubs for recovery of
loans. This is a mutually advantageous partnership. These grassroot level institu
tions have the knowledge about local people and conditions which RFIs do not
have. In return, rural people get financial services on a continuous basis if good
recoveries are effected with involvement of village level institutions.
53
References
Seattle, V.A.eta l . (1995), Bank and Bad Debts. John Wiley New York.
BIRD (1997) Report of a study on Buildup of overdues of Institutional loans in the state of Madhya Pradesh contributory factors, BIRD, Lucknow.
Dossier on Co-operatives, March 1998,1999, NABARD, Mumbai.
Economic Survey 2000-01, Ministry of Finance, Government of India.
Key Statistics on Regional Rural Banks, 1996,97,98 and 1999, NABARD, Mumbai.
Jilani, R. (1999), Key Note Address on Non-performing Assets: Issues and Prospect, IBA Bulletin, August 1999.
NIBM (1996), Study of Recovery Performance of Bank Loans in Orissa, NIBM, Pune.
NIRD (1999), Buildup of overdues of Institutional Loans in Karnataka Some contributory factors, NIRD, Hyderabad.
Rajaraman, I. et al (1999), NPA Variations Aaoss Indian Commercial Banks, Economic and Political Weekly, January 16-23, pp 161-168.
Report of the Committee on the Financial System (Narasimham Committee I), 1991, RBI, Mumbai.
Report of the Committee on the Banking Sector Reforms (Narasimham Committee II), 1998, RBI, Mumbai.
Report of the Working Group on Restructuring Weak Public Sector Banks (Verma Panel), 1999, RBI, Mumbai.
RBI (1989), A Review of the Agricultural Credit System in India, Report of the Agricultural Credit Review Committee (ACRC), RBI, Mumbai.
Talwar Committee, 1971, Report of the Expert Group on State Enactments having a Bearing on Commercial Banks' Lendings to Agriculture , RBI, Mumbai.
Tiwari Committee (1984), Report of the Committee to Examine the Legal and other difficulties faced by Banks and Financial Institutions in Rehabilitation of Sick Industrial Undertakings and Suggest Remedial Measures including changes in the Law, RBI, Mumbai.