3 Egypt. J. Chem. 58, No.1 pp. 43 - 69 (2015) ــــــــــــــــــــــــــــــــــــــــــــــــــــــــــ ـــ ــــــــــــ ــــ ــــــــــــــــــــــــــــــــــــــــــــــــــــــــــ* Corresponding author:[email protected]Occurrence and Distribution of Aliphatic and Polycyclic Aromatic Hydrocarbons in Surface Waters along Coastal Area of Suez Gulf Nazik A. Farid, Sawsan A. Mahmoud and Omayma E. Ahmed * Egyptian Petroleum Research Institute, Nasr City, Cairo, Egypt. UEZ Gulf is an area of environmental interest due to tourism, Suez port, El-Sukhna beach, shipping activity, petroleum production, and industry activities. Water samples were collected from the coastal area of Suez Gulf, and analyzed in 2014 by Gas Chromatography, HPLC, Ultraviolet, and FT-IR spectroscopy for the spatial distribution and sources of aliphatic n-alkanes and unresolved complex mixture of fossil hydrocarbons. The ratio of UCM to n- alkanes and CPI values in all stations indicates that the main contribution to petroleum hydrocarbon contamination is via oil and its products and 16 parent polycyclic aromatic hydrocarbons, the concentrations ranged from 13.352 to 205398.76 ng/L with a mean value of 52531.578 ng /L, which exceed the maximum admissible concentrations of PAHs 200 ng/L for the water standard of European Union. The total concentrations varied from 4105 to 24229 ng /L for aliphatic hydrocarbons, the highest concentrations of total PAHs were recorded for stations near the Inlet of Suez Oil Petroleum Company (SOPC) and both of EL-Sukhna at Loloh and El-Suez beaches. Interferences of rather petrogenic and pyrolytic PAH contaminations were noticed in different locations in Suez Gulf due to petroleum products deliveries and production as well as fuel combustion emissions from boats and ships. The presences of aliphatic and aromatic hydrocarbons were confirmed by both FT-IR analysis and UV absorption spectra. The concentrations detected at each site were sufficiently high to pose a risk to marine organisms if they are exposed continuously to this concentration. Hence, continuous monitoring of the ecosystem is highly warranted. Keywords: Hydrocarbons, PAHs, Pollution, Hydrocarbon sources and UV and FT-IR Spectroscopy. Aliphatic hydrocarbons (AH) and polycyclic aromatic hydrocarbons (PAHs) are two major classes of compounds that have attracted most investigations of petroleum related hydrocarbons (1) . They enter the marine environment from various sources. Accidental oil spills, although most newsworthy, are not the only sources of those compounds in the marine environment. AH can be of both petrogenic and biogenic origin, while PAHs can be petrogenic, pyrolytic and S
Low molecular weight (LMW) / High molecular weight (HMW) The ratios of low molecular weight (LMW, sum of nC10 to nC20) to high
molecular weight (HMW, sum of nC21to nC34) (48)
. It appears that for all stations, the concentrations of nC10 to nC20 hydrocarbons were less concentrated than the longer chain (>20) n-alkanes. LMW/HMW n-alkanes are indicated in Table 3. It has been reported that LMW/HMW ratios that are less than unity 1.0 usually represent n-alkanes produced by higher plants, marine animals and bacteria, while LMW/HMW ratios close or greater than unity 1.0 suggest n-alkanes that are mainly from petroleum and plankton sources
(49). As summarized in Table 3, the LMW/HMW
ratios which are all lower than unity for all samples, ranged between 0.0063- 0.5460 indicating the presence of n-alkanes in the surface water which is mainly from biogenic-originated contaminations.
Occurrence and Distribution of Aliphatic …
Egypt. J. Chem. 58, No. 1 (2015)
55
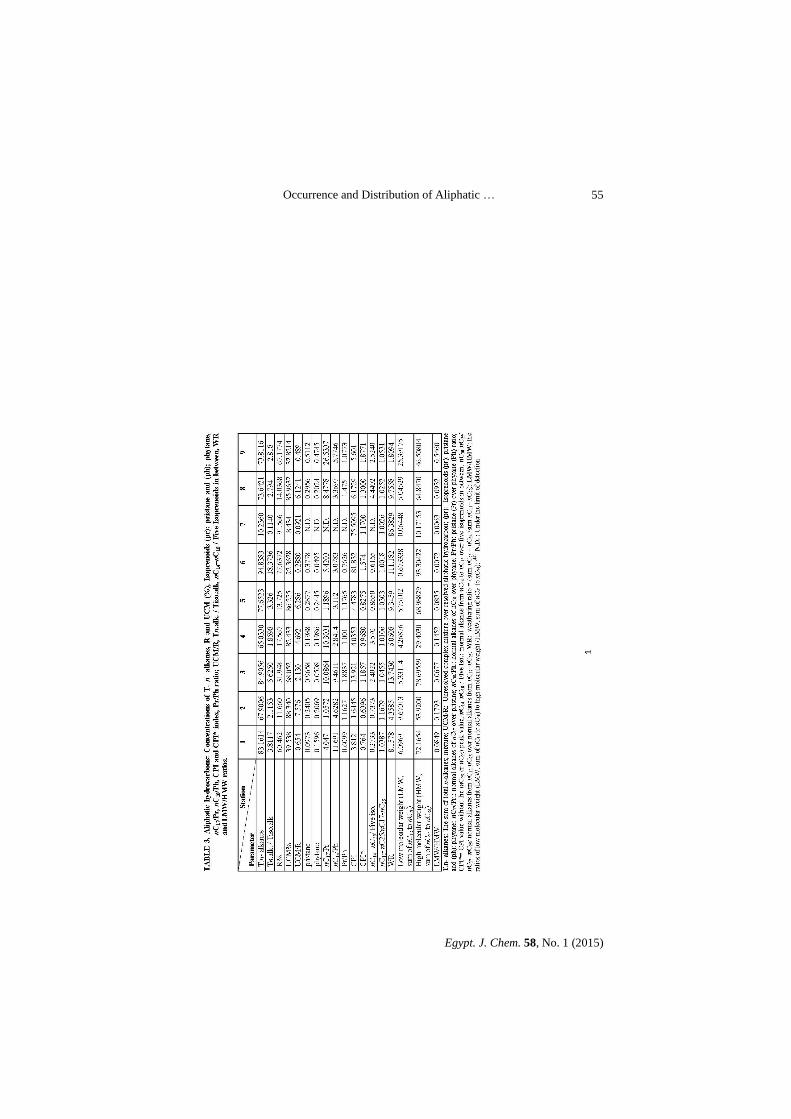
Table 3
Nazik A. Farid et al .
Egypt. J. Chem. 58, No. 1 (2015)
56
PAH concentrations in surface waters
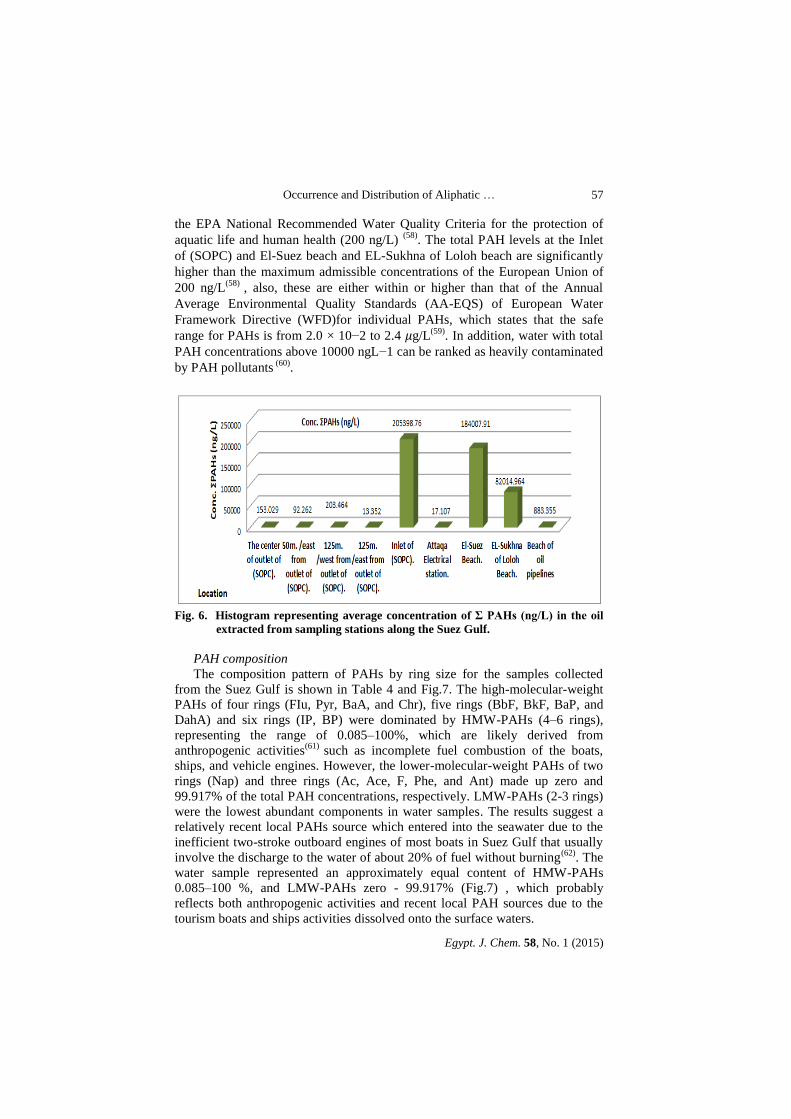
The mean total concentrations of 16 PAHs
poly-aromatic hydrocarbons in surface waters ranged from 13.352 at
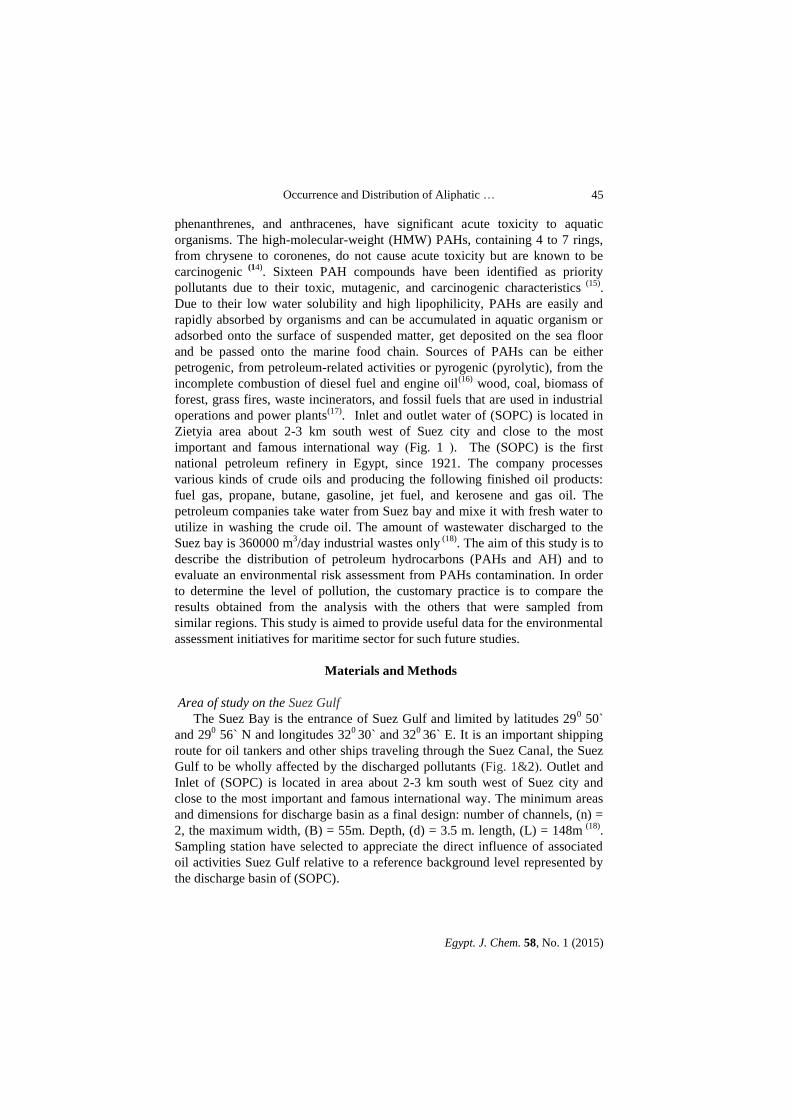
(125m.), from the drainage center at the east of (SOPC) and 205398.76 ng/ at
Inlet of (SOPC) (Fig. 6), the highest concentration at Inlet of (SOPC) 205398.76
ng/L due to the Suez Gulf is used in many areas as a recipient for wastewaters
from different sources, which highly polluted it with wastes from drains directly
into it. The amount of PAHs detected there is obviously related to urban
runoffs, sewage discharges, and intense shipping and oil refinery activities, ship
breaking and oil seepage from industrial activities near the study area, lead to
high concentrations of total PAHs. Additionally, boats and ships transports in
these regions were discharging black smokes throughout their movement; hence
there are many nonpoint sources in the bay, contributing to the wide variations
of PAH concentrations detected. Moreover, the level of (PAHs) are found to
vary widely depending on sites with the west coast of discharge basin recorded
higher value than the east coast ones, this is consistent with the direction of the
water currents and winds from the west to the east side's within the basin.
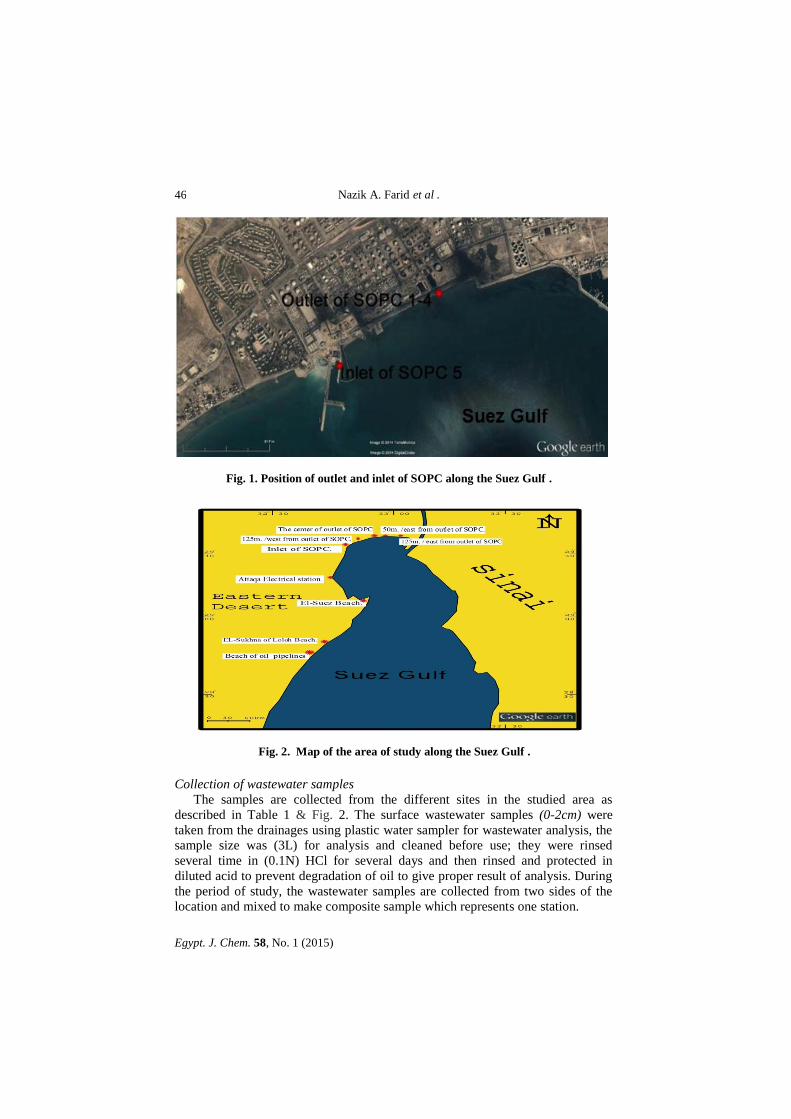
Similarly, high concentration 184007.91 ng/L was also found at El-Suez beach,
which is close to sewage outlet from Attaqa Electrical station have a surface
area of about 4 km along the Suez Gulf. Many of the samples from drainage of
(SOPC) and beach of oil pipelines represented concentrations in excess of ng/L,
suggesting that the water in the area was heavily contaminated by PAHs. Such a
wide range of PAHs at different concentrations indicates that there are
potentially many different sources of PAHs in the area, possibly including
combustion followed by oil residues, sewage outfalls, and industrial wastewater.
From the distribution of PAHs in water alone, it is difficult to differentiate these
different sources of input, nevertheless, collected from different locations along
the Suez Gulf. The data can act as an indication of the potential impacts of such
high levels of PAHs on the local ecosystems. The total PAH concentrations
found in water along the Suez Gulf, are several orders of magnitude higher than
those detected in various other studies around the world. Similarly, comparable
high levels of PAHs were also found in seawater samples of Daya Bay, China
4228–29320 ng/L (50)
and northern Spanish 190–28800ng/L (51)
. In addition, to
values recoded between 8660–46740 ng/L in Mumbai Harbor Line, India (52)
.
Although PAHs do not show extremely high acute toxicity to aquatic
organisms, the lower molecular mass compounds tend to exhibit higher lethal
toxicity than the larger PAHs (53)
. And above all this lethal concentration
(LC50) down to less than 10000 ng/L has been reported for various organisms (54)
beside, represent value ranged between 52811-559096 ng/L in Alexandria coast,
Egypt (55)
Suez, Gulf recorded values 3115-252786, 15392-66718 ng/L (56)
for
winter and summer, respectively, also Suez Gulf revealed values between 1640-
39139 and731.7-219373 ng/L (57)
for summer and winter seasons (Table 4). The
PAH concentrations detected in water samples of Inlet (SOPC)and El-Suez
beach clearly (Fig. 7) show that these results are higher than the safe limits of
Occurrence and Distribution of Aliphatic …
Egypt. J. Chem. 58, No. 1 (2015)
57
the EPA National Recommended Water Quality Criteria for the protection of
aquatic life and human health (200 ng/L) (58)
. The total PAH levels at the Inlet
of (SOPC) and El-Suez beach and EL-Sukhna of Loloh beach are significantly
higher than the maximum admissible concentrations of the European Union of
200 ng/L(58)
, also, these are either within or higher than that of the Annual
Average Environmental Quality Standards (AA-EQS) of European Water
Framework Directive (WFD)for individual PAHs, which states that the safe
range for PAHs is from 2.0 × 10⁻² to 2.4 g/L(59)
. In addition, water with total
PAH concentrations above 10000 ngL−1 can be ranked as heavily contaminated
by PAH pollutants (60)
.
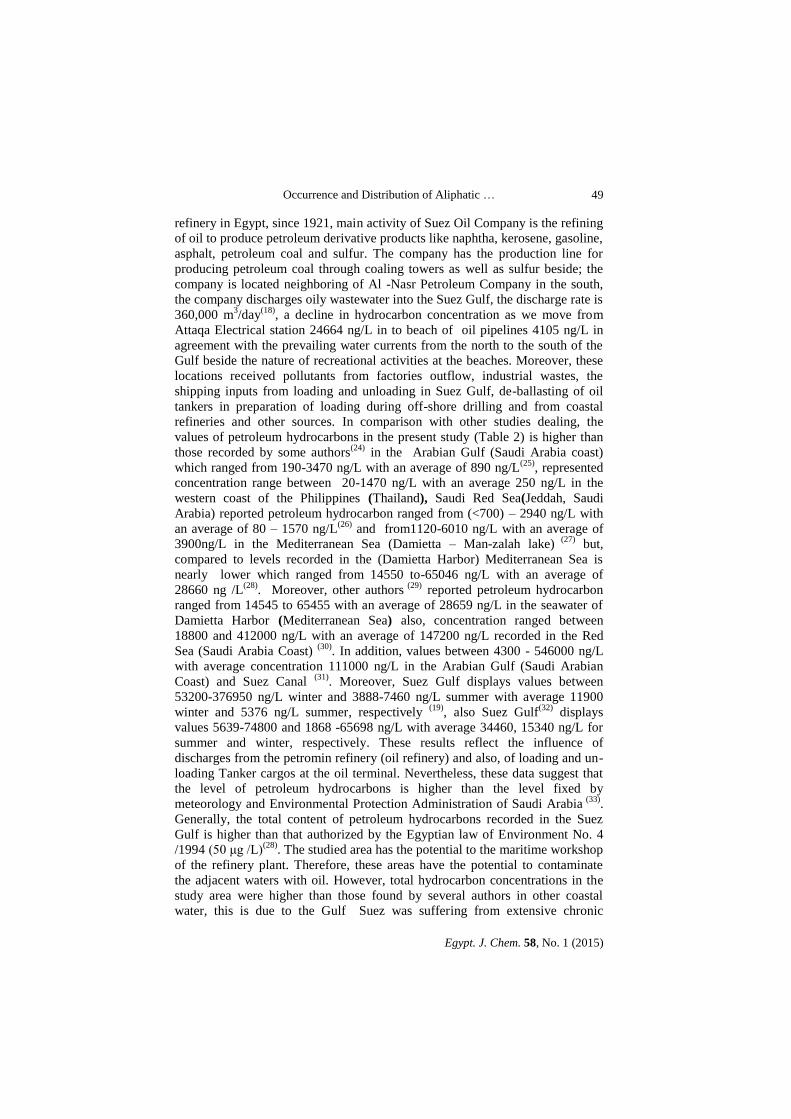
Fig. 6. Histogram representing average concentration of Σ PAHs (ng/L) in the oil
extracted from sampling stations along the Suez Gulf.
PAH composition
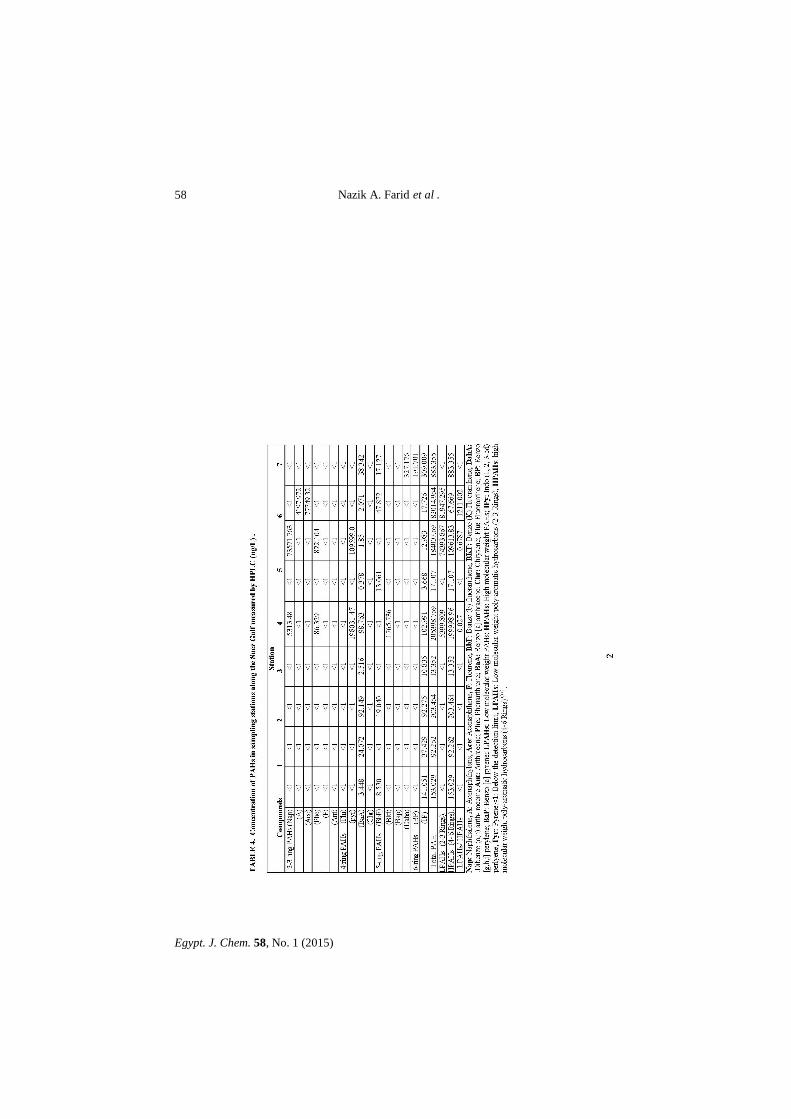
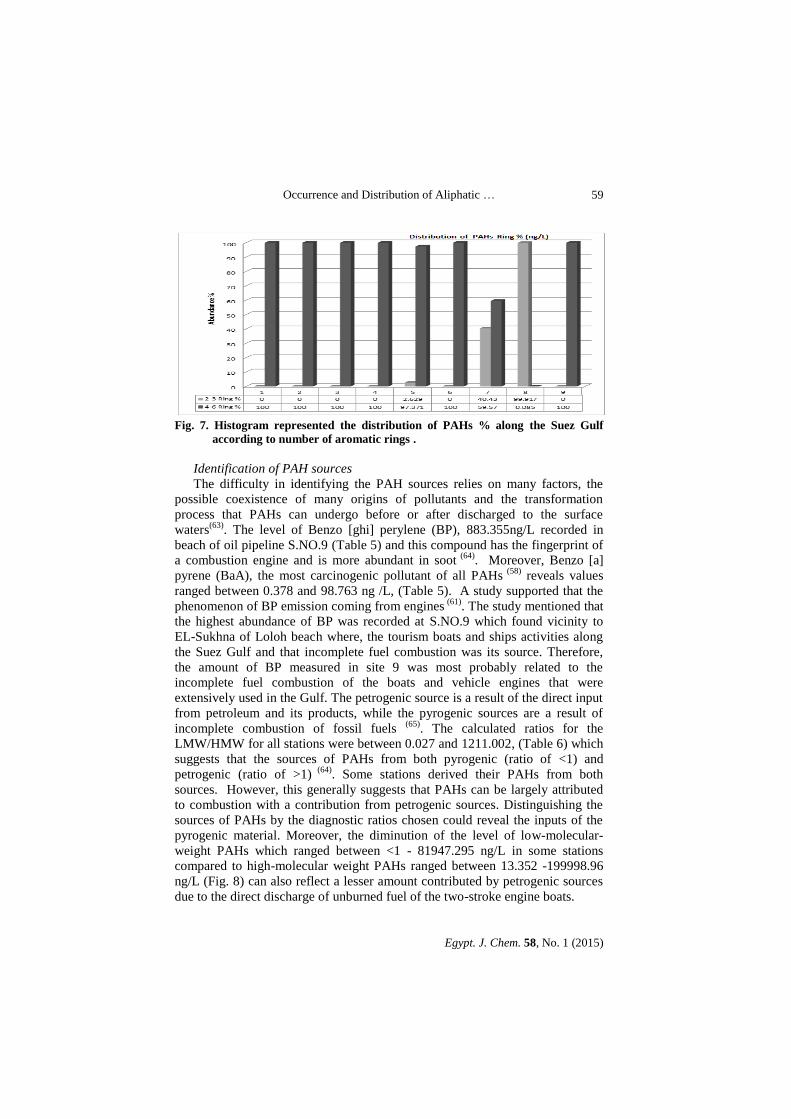
The composition pattern of PAHs by ring size for the samples collected
from the Suez Gulf is shown in Table 4 and Fig.7. The high-molecular-weight
PAHs of four rings (FIu, Pyr, BaA, and Chr), five rings (BbF, BkF, BaP, and
DahA) and six rings (IP, BP) were dominated by HMW-PAHs (4–6 rings),
representing the range of 0.085–100%, which are likely derived from
anthropogenic activities(61)
such as incomplete fuel combustion of the boats,
ships, and vehicle engines. However, the lower-molecular-weight PAHs of two
rings (Nap) and three rings (Ac, Ace, F, Phe, and Ant) made up zero and
99.917% of the total PAH concentrations, respectively. LMW-PAHs (2-3 rings)
were the lowest abundant components in water samples. The results suggest a
relatively recent local PAHs source which entered into the seawater due to the
inefficient two-stroke outboard engines of most boats in Suez Gulf that usually
involve the discharge to the water of about 20% of fuel without burning(62)
. The
water sample represented an approximately equal content of HMW-PAHs
0.085–100 %, and LMW-PAHs zero - 99.917% (Fig.7) , which probably
reflects both anthropogenic activities and recent local PAH sources due to the
tourism boats and ships activities dissolved onto the surface waters.
Nazik A. Farid et al .
Egypt. J. Chem. 58, No. 1 (2015)
58
Table 4
Occurrence and Distribution of Aliphatic …
Egypt. J. Chem. 58, No. 1 (2015)
59
Fig. 7. Histogram represented the distribution of PAHs % along the Suez Gulf
according to number of aromatic rings .
Identification of PAH sources
The difficulty in identifying the PAH sources relies on many factors, the
possible coexistence of many origins of pollutants and the transformation
process that PAHs can undergo before or after discharged to the surface
waters(63)
. The level of Benzo [ghi] perylene (BP), 883.355ng/L recorded in
beach of oil pipeline S.NO.9 (Table 5) and this compound has the fingerprint of
a combustion engine and is more abundant in soot (64)
. Moreover, Benzo [a]
pyrene (BaA), the most carcinogenic pollutant of all PAHs (58)
reveals values
ranged between 0.378 and 98.763 ng /L, (Table 5). A study supported that the
phenomenon of BP emission coming from engines (61)
. The study mentioned that
the highest abundance of BP was recorded at S.NO.9 which found vicinity to
EL-Sukhna of Loloh beach where, the tourism boats and ships activities along
the Suez Gulf and that incomplete fuel combustion was its source. Therefore,
the amount of BP measured in site 9 was most probably related to the
incomplete fuel combustion of the boats and vehicle engines that were
extensively used in the Gulf. The petrogenic source is a result of the direct input
from petroleum and its products, while the pyrogenic sources are a result of
incomplete combustion of fossil fuels (65)
. The calculated ratios for the
LMW/HMW for all stations were between 0.027 and 1211.002, (Table 6) which
suggests that the sources of PAHs from both pyrogenic (ratio of <1) and
petrogenic (ratio of >1) (64)
. Some stations derived their PAHs from both
sources. However, this generally suggests that PAHs can be largely attributed
to combustion with a contribution from petrogenic sources. Distinguishing the
sources of PAHs by the diagnostic ratios chosen could reveal the inputs of the
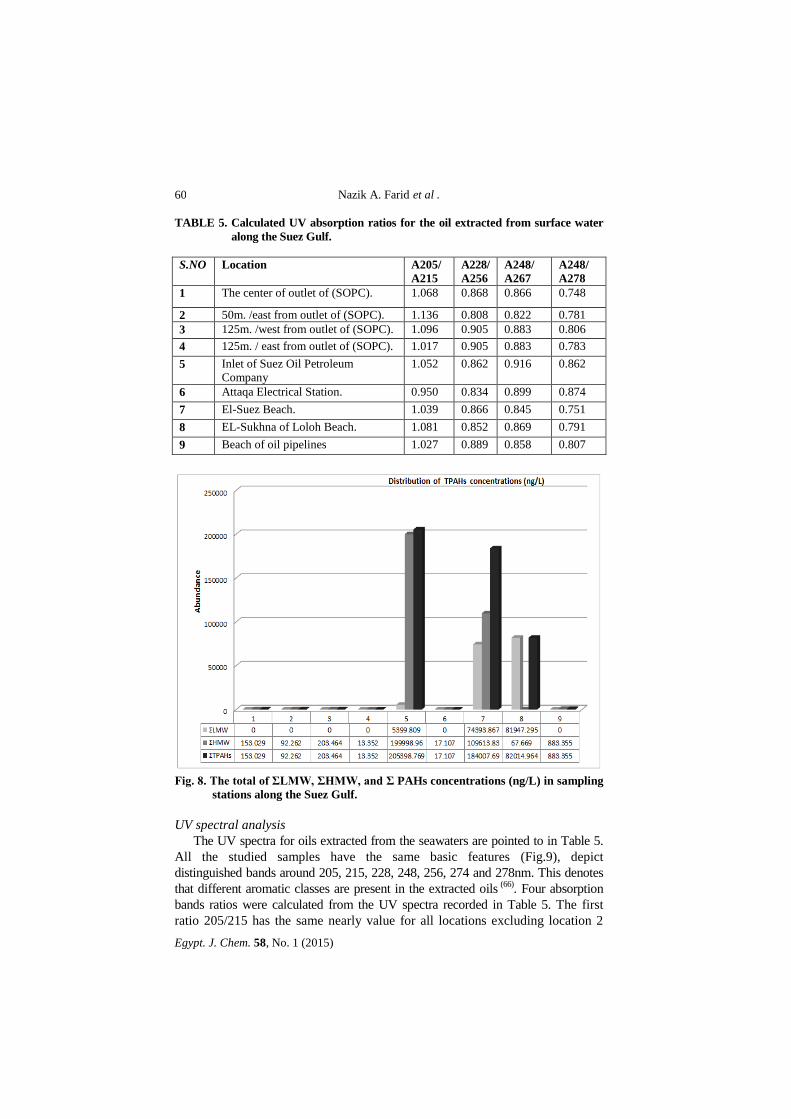
pyrogenic material. Moreover, the diminution of the level of low-molecular-
weight PAHs which ranged between <1 - 81947.295 ng/L in some stations
compared to high-molecular weight PAHs ranged between 13.352 -199998.96
ng/L (Fig. 8) can also reflect a lesser amount contributed by petrogenic sources
due to the direct discharge of unburned fuel of the two-stroke engine boats.
Nazik A. Farid et al .
Egypt. J. Chem. 58, No. 1 (2015)
60
TABLE 5. Calculated UV absorption ratios for the oil extracted from surface water
along the Suez Gulf.
S.NO Location A205/
A215
A228/
A256
A248/
A267
A248/
A278
1 The center of outlet of (SOPC). 1.068 0.868 0.866 0.748
2 50m. /east from outlet of (SOPC). 1.136 0.808 0.822 0.781
3 125m. /west from outlet of (SOPC). 1.096 0.905 0.883 0.806
4 125m. / east from outlet of (SOPC). 1.017 0.905 0.883 0.783
8 EL-Sukhna of Loloh Beach. 1.081 0.852 0.869 0.791
9 Beach of oil pipelines 1.027 0.889 0.858 0.807
Fig. 8. The total of ƩLMW, ƩHMW, and Ʃ PAHs concentrations (ng/L) in sampling
stations along the Suez Gulf.
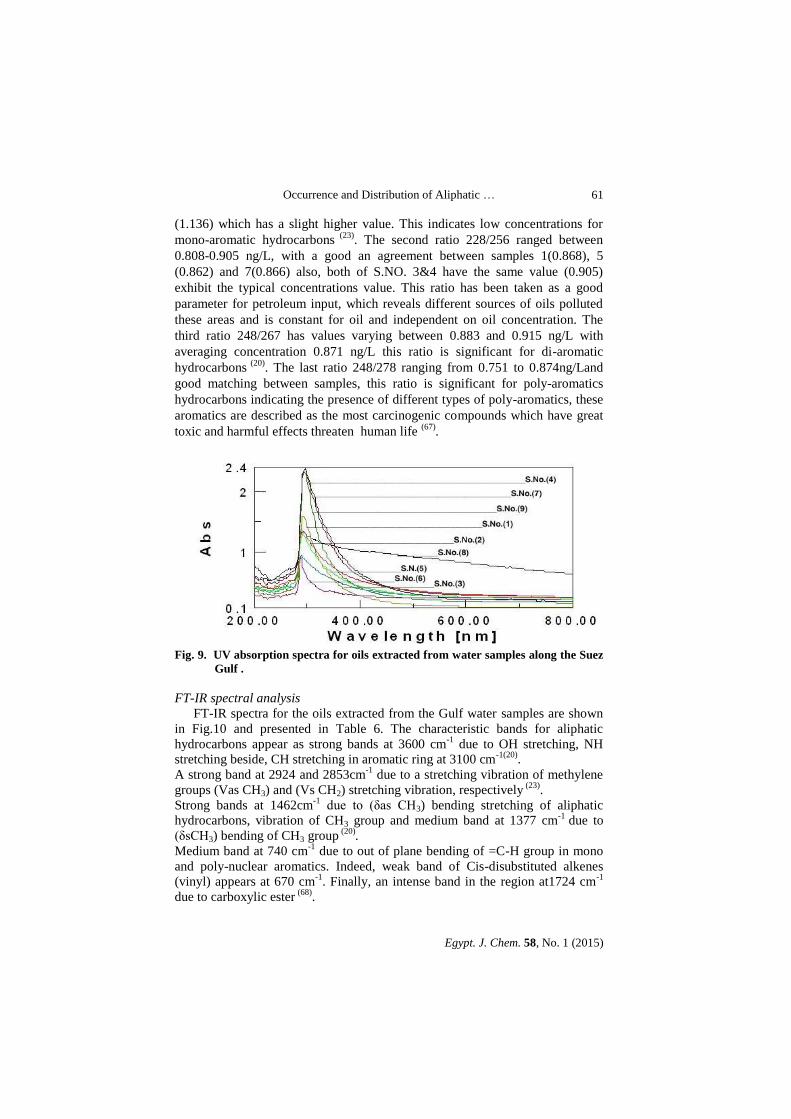
UV spectral analysis
The UV spectra for oils extracted from the seawaters are pointed to in Table 5.
All the studied samples have the same basic features (Fig.9), depict
distinguished bands around 205, 215, 228, 248, 256, 274 and 278nm. This denotes
that different aromatic classes are present in the extracted oils (66)
. Four absorption
bands ratios were calculated from the UV spectra recorded in Table 5. The first
ratio 205/215 has the same nearly value for all locations excluding location 2
Occurrence and Distribution of Aliphatic …
Egypt. J. Chem. 58, No. 1 (2015)
61
(1.136) which has a slight higher value. This indicates low concentrations for
mono-aromatic hydrocarbons (23)
. The second ratio 228/256 ranged between
0.808-0.905 ng/L, with a good an agreement between samples 1(0.868), 5
(0.862) and 7(0.866) also, both of S.NO. 3&4 have the same value (0.905)
exhibit the typical concentrations value. This ratio has been taken as a good
parameter for petroleum input, which reveals different sources of oils polluted
these areas and is constant for oil and independent on oil concentration. The
third ratio 248/267 has values varying between 0.883 and 0.915 ng/L with
averaging concentration 0.871 ng/L this ratio is significant for di-aromatic
hydrocarbons (20)
. The last ratio 248/278 ranging from 0.751 to 0.874ng/Land
good matching between samples, this ratio is significant for poly-aromatics
hydrocarbons indicating the presence of different types of poly-aromatics, these
aromatics are described as the most carcinogenic compounds which have great
toxic and harmful effects threaten human life (67)
.
Fig. 9. UV absorption spectra for oils extracted from water samples along the Suez
Gulf .
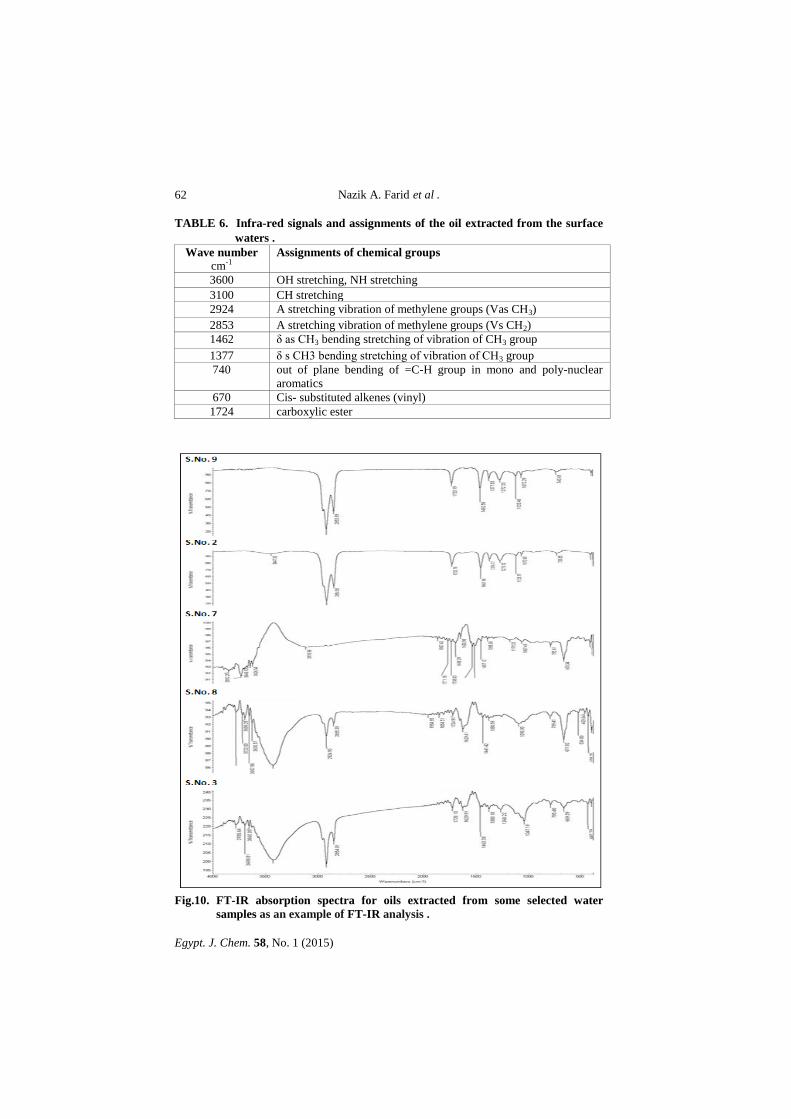
FT-IR spectral analysis FT-IR spectra for the oils extracted from the Gulf water samples are shown
in Fig.10 and presented in Table 6. The characteristic bands for aliphatic
hydrocarbons appear as strong bands at 3600 cm-1
due to OH stretching, NH
stretching beside, CH stretching in aromatic ring at 3100 cm-1(20)
.
A strong band at 2924 and 2853cm-1
due to a stretching vibration of methylene
groups (Vas CH3) and (Vs CH2) stretching vibration, respectively (23)
.
Strong bands at 1462cm-1
due to (δas CH3) bending stretching of aliphatic
hydrocarbons, vibration of CH3 group and medium band at 1377 cm-1
due to
(δsCH3) bending of CH3 group (20)
.
Medium band at 740 cm-1
due to out of plane bending of =C-H group in mono
and poly-nuclear aromatics. Indeed, weak band of Cis-disubstituted alkenes
(vinyl) appears at 670 cm-1
. Finally, an intense band in the region at1724 cm-1
due to carboxylic ester (68)
.
Nazik A. Farid et al .
Egypt. J. Chem. 58, No. 1 (2015)
62
TABLE 6. Infra-red signals and assignments of the oil extracted from the surface
waters .
Assignments of chemical groups Wave number
cm-1
OH stretching, NH stretching 3600
CH stretching 3100
A stretching vibration of methylene groups (Vas CH3) 2924
A stretching vibration of methylene groups (Vs CH2) 2853
δ as CH3 bending stretching of vibration of CH3 group 1462
δ s CH3 bending stretching of vibration of CH3 group 1377
out of plane bending of =C-H group in mono and poly-nuclear
aromatics
740
Cis- substituted alkenes (vinyl) 670
carboxylic ester 1724
Fig.10. FT-IR absorption spectra for oils extracted from some selected water
samples as an example of FT-IR analysis .
Occurrence and Distribution of Aliphatic …
Egypt. J. Chem. 58, No. 1 (2015)
63
Conclusion and Recommendations
This article provides important information on levels and sources of
contamination by aliphatic and polycyclic aromatic hydrocarbons in surface
waters sampled within the Suez Gulf. Quantitative analysis, made by gas
chromatography, as well as its deducted geochemical parameters (UCM, Pr/Ph,
CPI) allows to conclude that hydrocarbon’s origin could be linked to biogenic
(plankton and terrestrial plants) and petrogenic inputs attesting of an oil
contamination. The highest anthropogenic hydrocarbon inputs were found near
the Refinery Company and Attaqa Electrical station with an unresolved
complex mixture of aliphatic hydrocarbons, indicative of petrogenic inputs.
PAHs contamination is closely related to petroleum spills, shipping, sewage
input, and industrial activities. Molecular ratios indicated that PAHs in the
surface waters were mostly petrogenic in origin likely due to shipping activities,
whereas pyrogenic origin was found for PAHs in some sample probably due to
the high combustion inputs and urban runoffs from urbanized areas.
Comparison of the concentration range with a worldwide survey of surface
waters PAH concentrations ranked PAH. PAH concentrations detected at the
Inlet of (SOPC) site were sufficiently high to pose a risk to marine organisms if
they are exposed continuously to this concentration. Hence, continuous
monitoring of the ecosystem is highly warranted. The presences of aliphatic and
aromatic hydrocarbons were confirmed by both FT-IR analysis and UV
absorption spectra. Data on the aliphatic and polycyclic aromatic hydrocarbons
found in this study can be used as baseline reference concentration for future
monitoring programs.
References
1. Benlahcen, K.T., Chaoui, A., Budzinski, H., Bellocq, J. and Garrigues, P.H.,
Distribution and sources of polycyclic aromatic hydrocarbons in some Mediterranean
coastal sediment. Mar. Pollut. Bull. 34, 298–305 (1997).
2. Benlahcen, K.T., Chaoui, A., Budzinski, H., Bellocq, J. and Garrigues, P.H., Distribution and sources of polycyclic aromatic hydrocarbons in some Mediterranean
coastal sediment. Mar. Pollut. Bull. 34, 298–305 (1997).
3. Qiao, M., Wang, C., Huang, S., Wang, D. and Wang, Z., Composition, sources, and
potential toxicological significance of PAHs in the surface sediments of the Meiliang
Bay, Taihu Lake, China. Environ. Int. 32(1), 28–33 (2006).
4. Gogou, A., Bouloubassi, I. and Stephanou, E.G., Marine organic geochemistry of the
Eastern Mediterranean: 1. Aliphatic and polyaromatic hydrocarbons in Cretan Sea
sacrificial sediments. Mar. Chem. 68, 265–282 (2000).
5. Cripps, G.C., Problems in the identification of anthropogenic hydrocarbons against
natural background levels in the Antarctic. Antarctic Sci. 14, 307–312 (1989).
Nazik A. Farid et al .
Egypt. J. Chem. 58, No. 1 (2015)
64
6. Humphrey, B., Boehm, P.D., Hamilton, M.C. and Norstrom, R.J., The fate of
chemically dispersed and untreated crude oil in Arctic benthic biota. Arctic, 40, 149–
161 (1987).
7. Bouloubassi, I. and Saliot, A., Investigation of anthropogenic and natural organic
inputs in estuarine sediments using hydrocarbon markers (NAH, LAB, PAH).
Oenological Acta, 16(2), 145-161 (1993).
8. Mazurek, M. A. and Simoneit, B. R. T., Characterization of biogenic and petroleum-
derived organic matter in aerosols over remote, rural and urban areas In: L. H. Keith,
(Ed.), Identification and Analysis of Organic Pollutants in Air, Ann Arbor Science/
Butterworth, Boston, 353-370 (1984).
9. European Environment Agency, Europe’s environment: D. Stanners, P. Bourdeau,
the Dobris Assessment, Copenhagen, 712 pp. (1995).
10. Clark, R.B., Fourth, ed., Clarendon, P., Oxford, D.E. and Kucuksezgin, F., Distribution and origin of hydrocarbons in sacrificial sediments from the eastern
Aegean Sea (Izmir Bay). Mar. Pollut. Bull. 54, 1813–1838 (1997).
11. Wei, M.C. and Jen, J.F., Determination of polycyclic aromatic hydrocarbons in
aqueous samples by microwave assisted headspace solid-phase micro extraction and
gas chromatography/flame ionization detection. Atlanta, 72(4), 1269–1274 (2007).
12. Katsoyiannis, A., Sweet, man, A.J. and Jones, K.C., PAH molecular diagnostic ratios
applied to atmospheric sources: a critical evaluation using two decades of source
inventory and air concentration data from the UK. Environmental Science and
Technology, 45(20), 8897–8906 (2011).
13. Martinez, E., Gros, M., Lacorte, S. and Barcel´o, D., Simplified procedures for the
analysis of polycyclic aromatic hydrocarbons in water, sediments and mussels. Journal
of Chromatography A, 1047(2), 181–188 (2004).
14. Neff, J. M., Polycyclic Aromatic Hydrocarbons in the Aquatic Environment: Sources,
Fates, and Biological Effects, Applied Science Publishers (1979).
15. Tam, N. F. Y., Wang, L. Ke, X.H. and Wong, Y. S., Contamination of polycyclic
aromatic hydrocarbons in surface sediments of mangrove swamps. Environmental
Pollution, 114(2), 255–263 (2001).
16. Szewczynska, M., Posniak, M. and Dobrzynska, E., Study on individual PAHs
content in ultrafine particles from solid fractions of diesel and biodiesel exhaust fumes,
Journal of Chemistry, 2013, Article ID 528471, 10 pages (2013).
17. Ashraf, M.W., Taqvi S.I.H., Solangi, A.R. and Qureshi, U.A., Distribution and risk
assessment of polycyclic aromatic hydrocarbons in vegetables grown in Pakistan,
Journal of Chemistry, 2013, Article ID 873959, 5 pages (2013).
18. REMIP WORKING GROUPs 2(WG2), JICA and EEAA, State oil pollution and
Management in Suez Gulf region, page 15 (2008).
Occurrence and Distribution of Aliphatic …
Egypt. J. Chem. 58, No. 1 (2015)
65
19. Nazik, A. F., Mohamed, I., Omayma, E. A., Rabie, S. and Mostafa, M. E., State of
Petroleum Pollution in the Suez Gulf Coastal Waters, The 17th International
Conference on Petroleum Mineral Resources and Development, Feb., 9 – 11 (2014).
20. Omayma, E. A., Nabila, A. A., Sawsan, A. M. and Mamdouh, M. D., Environmental
Assessment of Contamination by Petroleum Hydrocarbons in the Aquatic Species of
Suez Gulf, ISSN: 2166-074 Florida, USA. International Journal of Modern Organic
Chemistry, 3, 1, 1-17 (2014).
21. Shou, F., Richard, A., Mowery, V.A., Castleberry Peter Van Walsum, G. and
Kevin Chambills, High –performance liquid chromatography method for simultaneous
determination of aliphatic products in biomass pretreatment hydrocarbons. Journal of
Chromatography a, 1104, 54-61 (2006).
22. Ehrhardt, M. and Petrick, G., Relative concentrations of dissolved/dispersed fossil
fuel residues in Mediterranean surface waters as measured by UV fluorescence.
Marine Pollution Bulletin, 20, 560 –565 (1989).
23. Abd El Rahman, Mousa, Nazik, A. Farid, Maged, M. Soliman and Omyma, E.
Ahmed, State of petroleum pollution in the south eastern Mediterranean Sea, Port Said
coastal waters. Egypt. J. Petrol. 10(1), (2001).
24. Ehrhardt, M.G. and Burns, K.A., Hydrocarbons and related photo- oxidation
products in Saudi Arabian Gulf coastal waters and hydrocarbons in underlying
sediments and bio-indicator bivalves. Marine Pollution Bulletin, 27, 187-197 (1993).
25. Suriyan, S. and Gullaya W., Petroleum Hydrocarbon Contamination in Seawater
along the Western Coast of the Philippines, Department of Marine Science,
Chulalongkorn University, Bangkok 10330, Thailand, Southeast Asian Fisheries
Development Center (1998).
26. Sultans, A. and Turkis, A., Petroleum Hydrocarbons in Saudi Red Sea Coastal Waters
.JKAU: Mar. Sci. 8, 83-89 (1997).
27. Mohamed, Abd-EL-Hakem, S. and Abd-ELElla, MSC, Thesis entitled, Studies on oil
pollutants in some selected important Egyptian marine environment (2004).
28. Shereet, S.M., Pollution of petroleum hydrocarbon in the new Damietta harbor, Egypt,
Emirates Journal for Engineering Research, 14(1), 65-71, (2009).
29. Wahby, S.D. and El Deeb, K.Z., A, study of the state of pollution by petroleum
hydrocarbons along the Alexandria Coast, Ves Journees Ehud Pollutions, Cagliari
C.I.E.S.M., 257-262 (1980).
30. Awad, H., Hydrocarbon content in Red Sea surface waters and fishes in the region
between Jeddah and Yanbu, Saudi Arabia. In: Proceedings of the First Conference on
Environmental Sciences, Sabha, Lybia, In Arabic, English abstract, 27-31 January
(1990).
31. El Samra, M.I., Emara, H.I. and Shunbo, F., Dissolved petroleum hydrocarbon in
the northwestern Arabian Gulf, Marine Pollution Bulletin, 17(2), 65-68 (1986).
Nazik A. Farid et al .
Egypt. J. Chem. 58, No. 1 (2015)
66
32. Eman M. K., Thesis submitted for MSC, Physico-Chemical Studies on Some Selected
Water Pollutants, Al-Azhar University, (2013).
33. MEPA, Environmental Protection Standard Document, Meteorology and Environment
protection Administration, Saudi Arabia, No. 1409 – 01, P17, (1982).
34. Keizer, P.D. and Gordon, D.C. Jr., Detection of trace amounts of oil in sea water by
Fluorescence spectroscopy. J. Fish. Res. Bd, Can 30, 1039-1045 (1973).
35. Saida, B., Soumaya, K., Ioanna, B., Alain, S. and Hassan, Er R., Assessment of the
Moroccan Mediterranean Coasts contamination by hydrocarbons (non aromatic
hydrocarbons, aromatic hydrocarbons and linear alkyl benzenes). International Journal
of Geosciences, 2, 562-572 (2011).
36. Aceves, M, Grinalt, O., Albuiges, J., Broto, F., Comllas, L. and Gassrot, M., J.
Chromatography, v 436, 503-509 (1998).
37. Dréau, Y., LeJacquot, F., Doumenenq, P., Guiliano, M., Bertrand, J. C. and Mille,
G., Hydrocarbon balance of a site which had been highly and chronically contaminated
by petroleum wastes of a refinery (from 1956 to 1992), Marine Pollution Bulletin,
34(6), 456-468 (1997).
38. Medeiros, P.M. and Bicego, M.C., Investigation of natural and anthropogenic
hydrocarbon inputs In sediments using geo chemical Markers I. Santos, Sp. Brazil.
Marine Pollution Bulletin, 49, 461 – 769 (2004).
39. Blumer, M., Guillard, R.R.L. and Chase, T., Hydrocarbons of Marine Phytoplankton.
Marine Biology, 8(3), 183-189 (1971).
40. Burns, K.A., Greenwood, P., Benner, R., Brinkman, D., Brunskill, G., Codi, S.
and Zagorskis, I., Organic biomarkers for tracing carbon cycling in the Gulf of Papua
(Papua New Guinea). Continental Shelf Research, 24(19), 2373-2394 (2004).
41. Munoz, D., Guiliano, M., Doumenq, P., Jacquot, F., Scherrer, P. and Mille, C., Mar. Pollut. Bull. 34, 868 (1997).
42. Gough, M. A. and Rowland, M. A., Characterization of unresolved complex mixture
of hydrocarbons in petroleum. Nature, 344(12), 648-650 (1990).
43. Bouloubassi, I., Fillaux, J. and Saliot, A., Hydrocarbons in surface sediment from the
changing (Yangtze River) Estuary, East China Sea. Marine Pollution Bulletin,
42(12), 1335-1346 (2001).
44. Peña, E., Astroga-España, Ma. S. and Montelongo, G., Chemical fingerprinting
applied to the evaluation of marine oil pollution in the coasts of the Canary Islands
52. Dhananjayan, V., Muralidharan, S. and Vinny and Peter, R. Occurrence and
distribution of polycyclic aromatic hydrocarbons in water and sediment collected along
the Harbor Line, Mumbai, India Hindawi Publishing Corporation . International
Journal of Oceanography Volume Article ID 403615, 7 pages (2012).
53. Law, R. J., Dawes, V. J., Woodhead, R. J. and Matthiessen, P., Polycyclic aromatic
hydrocarbons (PAH) in seawater around England and Wales. Marine Pollution
Bulletin, 34(5), 306–322 (1997).
54. JØRGensen, S.E., Nielsen, S.N. and Jørgensen, L.A., Handbook of Ecological
Parameters and Eco-toxicology, Elsevier, Amsterdam, the Netherlands (1991).
55. Nazik, A.F., Omayma E.A. and Abd EL-Rahman, M.M., Contamination of water,
sediment, tar ball and fishes by poly-aromatic hydrocarbons (PAHs) in Alexandria Sea
Coasts. Journal of Applied Sciences Research, ISSN 1819-544X., 9(11), 5619-5632
(2013).
56. Mohamed, I.A., Thesis submitted for MSc, Studied on water quality in selected area of
Egypt, AL-Azhar University (2012).
57. Mostafa, M. E., Nazik, A. F., Enas, A. E., Omayma, E. A. and Eman, M. K., Origin
and distribution of polycyclic aromatic hydrocarbons (PAHs) in surface water of Suez
Gulf. Egypt. J. Anal. Chem. 23, 54-73 (2014).
Nazik A. Farid et al .
Egypt. J. Chem. 58, No. 1 (2015)
68
58. EPA, Environmental Protection Agency United States, National Recommended Water
Quality Criteria (2009).
59. Werres, F., Balsaa, P. and Schmidt, T. C., Total concentration analysis of polycyclic
aromatic hydrocarbons in aqueous samples with high suspended particulate matter
content. Journal of Chromatography A, 1216(12), 2235–2240 (2009).
60. Tronczy´nski, J., Munschy, C., H´eas and Moisan, K., Contamination of the Bay of
Biscay by polycyclic aromatic hydrocarbons (PAHs) following the T/V, Erika oil spill.
Aquatic Living Resources, 17(3), 243–259 (2004).
61. Omar, N. Y. M. J., Abas, M. R. B., Rahman, N. A., Tahir, N. M., Rushdi, A. I. and
Simoneit, B. R. T., Levels and distributions of organic source tracers in air and
roadside dust particles of Kuala Lumpur, Malaysia. Environmental Geology, 52(8),
1485–1500 (2007).
62. Mosisch, T.D. and Arthington, A.H., Polycyclic aromatic hydrocarbon residues in the
sediments of a dune lake as a result of power boating. Lakes and Reservoirs, 6(1),
21–32 (2001).
63. Soclo, H. H., Garrigues, P. and Ewald, M., Origin of polycyclic aromatic
hydrocarbons (PAHs) in coastal marine sediments: case studies in Continuo (Benin)
and Aquitaine (France) Areas. Marine Pollution Bulletin, 40(5), 387–396 (2000).
64. Essam, N., Lee, Y. H., Zuriati, Z. and Salmijah, S., Concentrations and sources of
polycyclic aromatic hydrocarbons in the seawater around Langkawi Island, Malaysia,
Hindawi Publishing Corporation. Journal of Chemistry, 2013, 10 pages (2013).
65. Boonyatumanond, R., Murakami, M., Wattayakorn, G., Togo A. and Takada, H., Sources of polycyclic aromatic hydrocarbons (PAHs) in street dust in a tropical Asian
mega-city, Bangkok, Thailand. Science of the Total Environment, 384(1–3), 420–432
(2007).
66. Neveka, A., Bionda, K., S. and Rak, N., International Journal of Environmental
Analytical Chemistry, 39,381 (1990).
67. Zhengzhen, Z., Zhanfei, L. and Laodong, G., Chemical evolution of Macon does
crude oil during laboratory degradation as characterized by fluorescence EEMs and