Captains' response to a declining stock as anticipated in the surfclam(Spisula solidissima) fishery on the U.S. Mid-Atlantic coast by modelevaluation
Eric N. Powell a, *, John M. Klinck b, Eileen E. Hofmann b, Paula Moreno a,Kelsey M. Kuykendall a, Daphne M. Munroe c, Roger Mann d
a Gulf Coast Research Laboratory, University of Southern Mississippi, 703 E. Beach Dr., Ocean Springs, MS, 39564, United Statesb Center for Coastal Physical Oceanography, Department of Ocean, Earth and Atmospheric Sciences, 4111 Monarch Way, 3rd Floor, Old Dominion University,Norfolk, VA, 23529, United Statesc Haskin Shellfish Research Laboratory, Rutgers University, 6959 Miller Ave., Port Norris, NJ, 08349, United Statesd Virginia Institute of Marine Science, College of William and Mary, P.O. Box 1346, Gloucester Point, VA, 23062, United States
a r t i c l e i n f o
Article history:Received 25 March 2016Received in revised form1 September 2016Accepted 23 September 2016
Mid-Atlantic Bight (MAB) warming accompanied by a decline in recruitment has slowly reduced surf-clam abundance. Simulations examined fishery dynamics during an extended period of low recruitmentfollowed by stock recovery after a high-recruitment event. The model assigned performance charac-teristics to each vessel and gave captains defined behavioral proclivities including a tendency to search,to communicate with other captains, to use survey data, and to integrate variable lengths of past-historyperformance in targeting fishing trips. During the simulated excursion in abundance, LPUE (landings perunit effort) declined as lower abundance required an extended time at sea to catch a full load. Captainsexpanded their geographic range of interest steaming farther from port in an effort to maintain theirperformance. Net revenue declined. Use of survey data significantly improved performance. About equalin positive effect was moderate searching. Other behaviors incurred penalties. Communication failed toimprove performance because both poor and good information was transferred. Reliance on a longperiod of catch history failed to improve performance because information was out of date during a timeof rapidly changing conditions. In these simulations, no captains' behaviors prevented a collapse in vesseleconomics at low abundance, but certain behaviors limited the degree and duration of economicdislocation.
The Atlantic surfclam, Spisula solidissima, sustains one of thelargest shellfish fisheries on the east coast of the U.S. Since the early1990s, the fishery has operated under a specified quota distributedto shareholders under an ITQ (individual transferable quota) sys-tem (Adelaja et al., 1998; Chu, 2009; McCay et al., 2011). During theyears subsequent to the initiation of ITQ management, the fisheryhas operated at a fishing mortality rate well below the naturalmortality rate and well below the management reference pointproxy for Fmsy (NEFSC, 2013). During this time, the stock has
ll).
remained above the biological reference point proxy for Bmsy
(NEFSC, 2013). As a consequence, the fishery has generated onlylimited management concerns.
Surfclams, however, are sensitive to bottomwater temperaturesabove about 21 �C (Weinberg, 2005; Munroe et al., 2013) and largeanimals are sensitive to variations in food supply (Kim and Powell,2004; Munroe et al., 2013). As a consequence, warming of the Mid-Atlantic Bight (Scavia et al., 2002; Jossi and Benway, 2003;Friedland and Hare, 2007), likely accompanied by a reduction infood supply (Xu et al., 2011), has resulted in a contraction of rangefor this species since the mid-1990s (Weinberg et al., 2002, 2005;Weinberg, 2005) characterized by a large-spatial-scale mortalityevent at the southern boundary of the range (Kim and Powell,2004) driving the southern boundary northward and the inshoreboundary offshore. A compensatory range expansion anticipated
off Long Island has not occurred, although the modest offshorerange extension off New Jersey is well-documented (e.g., Weinberget al., 2005). Obvious impacts on the fishery from this range shiftbecame apparent by the mid-2000s and include the movement ofprocessing capacity northward, the shift of vessels from southerlyports northward, the focus of heaviest fishing pressure in a smallerregion of the MAB, and the re-opening of the fishery on GeorgesBank which had been closed for many years due to PSP (paralyticshellfish poisoning) concerns (Magnuson-Stevens FisheryConservation and Management Act, 2012). Nevertheless, oneconsequence of the post-1990 warming episode is a contraction ofthe region supporting much of the fishery east and south of RhodeIsland from the original southerly extent off Maryland and Virginiaextending to northern New Jersey to a primary focus in thenortherly region off New Jersey (NEFSC, 2013).
Because the fishery has operated under a cushion provided by astock size well above Bmsy and a fishing mortality rate well belowFmsy, the stock contraction has not imposed stringent demands onmanagement of the fishery, although it has imposed costs to theindustry in relocating fishing effort. However, the reduced arealextent of the fishery has resulted in concentrated effort off of NewJersey, where locally fishing mortality rates have risen and LPUEs(landings per unit effort) have declined. In addition, recruitment inthis region has been low for the last decade, so that the biomass ofharvestable clams has droppedmore or less consistently since 1997.These dynamics, both economic, managerial, and biological, influ-enced the development of a management strategy evaluation(MSE) model of the surfclam industry (Powell et al., 2015; seeSpillman et al., 2009; Baudron et al., 2010; Bastardie et al., 2010;Miller et al., 2010 for other examples of MSE models). Powellet al. (2015) examined the importance of behavioral choices madeby captains under conditions that existed during the 1990s andunder the more difficult conditions of the 2000s. The approach tofishing implemented by the vessel captains is an important ingre-dient in the dynamic of any fishing industry (Dorn, 1998, 2001;Gillis et al., 1995a,b; Powell et al., 2003a,b). How these choicesinteract with changing dynamics of the stock and differences infishing vessel size represent both an important component of theeconomic response by the fishery (Lipton and Strand, 1992) and animportant component of an MSE.
Powell et al. (2015) examined the influence of the captain'sapproach to fishing during a period of climate change that resultedin contraction of the stock and concentration of the fishery. Theyfound that the repertoire of behavioral options did not substanti-vely influence the primary metrics influencing the outcome of afishing trip, such as LPUE. This outcome agreed with responsesfrom interviews with surfclam vessel captains who indicated onlylimited variation in the approach to fishing between the 1990s and2000s. Thus regional changes in stock distribution would appear tochallenge captains skill relatively little. However, the examinationby Powell et al. (2015) presumed that the contraction of the stockdid notmaterially affect stock abundance available to the fishery, anassumption that was reasonable given the history of climate changeand of the surfclam stock in the early 2000s, but which may nolonger be a valid assumption in the 2010s because accompanyingthese changes in stock distribution has been a decline in recruit-ment that has slowly reduced the abundance of the MAB stock.
The purpose of this contribution is to utilize a MSE model toinvestigate howongoing stock reductions if continued over anotherdecade may influence the surfclam fishery as modulated throughthe ambit of choices available to the vessel captains as they executetheir fishing trips. The study focuses on fishery performance asdefined by metrics such as LPUE, vessel economics as influenced byfuel usage and landings per trip, and fleet dispersion, as decliningstock biomass in the MAB influences the fishery long before it
triggers quota reductions under present-day managementguidelines.
2. The model - SEFES (Spatially-explicit fishery economicssimulator)
2.1. Overview
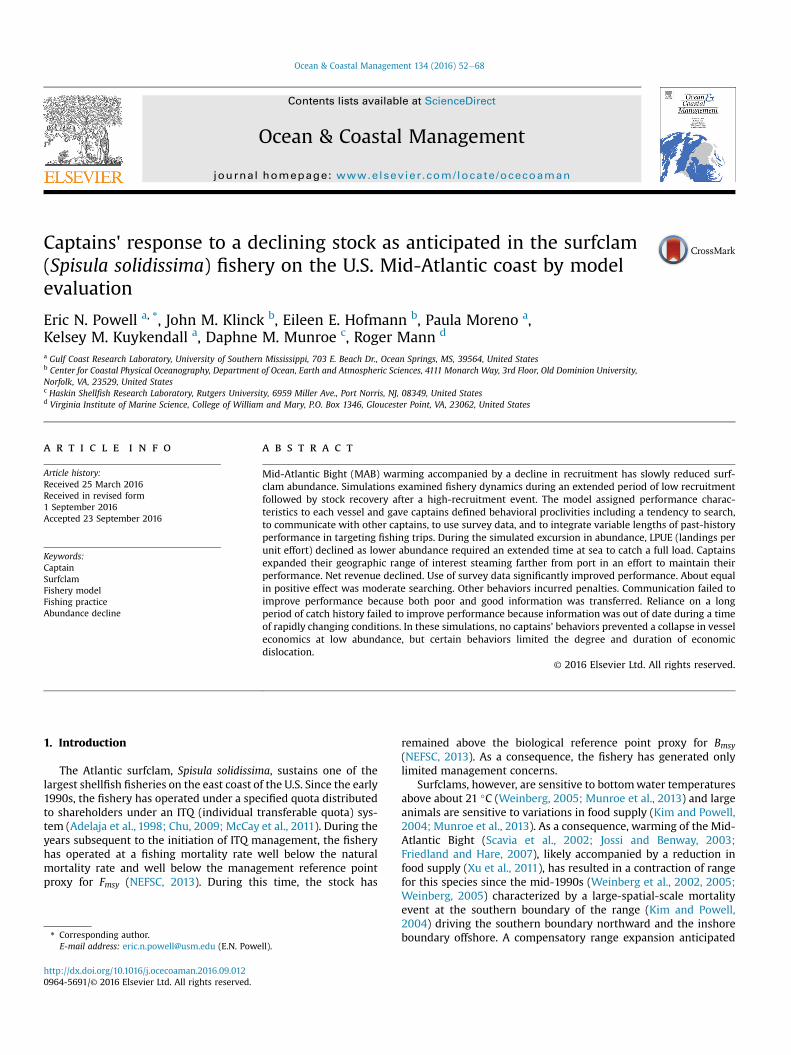
SEFES is a model capable of simulating a spatially and tempo-rally variable resource (in this case, surfclams) harvested by fleetsof boats landing in a number of homeports. The structure of SEFESis depicted in Fig. 1 and described in detail by Powell et al. (2015).The following summarizes that description. Boats and processingplants are the active agents in the model. The boats are attached tospecific processing plants and land catch at dedicated ports. Theboat may have varying characteristics such as different speeds,harvest capacities, and costs. Each boat is controlled by a captainwith specified characteristics that determine where and how effi-ciently the boat harvests the resource. Boats move around thedomain and harvest clams based on decisions by the captain andconstrained by the operating characteristics of the boat, such asspeed, maximum allowed time at sea, and imposed harvest quota.Each port has a processing plant that purchases the harvestedclams, providing income for the boats, and distributes quota ob-tained from the ITQ holders to each boat on aweekly schedule. Thistop-down control of fishing effort expresses present-day opera-tional practice in the fishery.
The spatial domain is partitioned into rectangular cells ten mi-nutes on a side. Within each cell, the clam population is describedin terms of clams m�2 per 1-cm size class. The number and sizedistribution of clams varies over time in response to differentbiological and fishery processes. Surveys are conducted annually. Amanagement module sets the harvest quota for the next year. Thebasic units in themodel are SI (Syst�eme international d'unit�es) withtime in seconds, distance in meters, and weight in kilograms. Forconvenience, commonly-used units are employed for some char-acteristics, such as specifying boat speed in knots (kt).
2.2. Domain and geometry configuration
The domain investigated in this paper is the MAB off the eastcoast of the US. The east-west extent of the domain has 17 cellsacross-shelf in the south and alongshore in the north to representthe transition from a quasi north-south trending shoreline south ofHudson Canyon to an east-west shoreline north of it. The north-south extent of the domain has 26 cells from Long Island south.For convenience, this model domain has the MAB rotated slightlycounterclockwise to remove the northeastward trend south of LongIsland, but this slight distortion of the domain has a negligible effecton model processes.
A mask is imposed on the model domain which identifies eachcell as land, water uninhabited by surfclams, or water inhabited bysurfclams. This mask is static, being defined at the beginning of asimulation. Ports are specified in certain land cells. For the simu-lations in this paper, three ports are included: Ocean City, Mary-land; Atlantic City, New Jersey; and Pt. Pleasant, New Jersey (Fig. 2).At present, Atlantic City and Pt. Pleasant account for most of thelandings (NEFSC, 2013) exclusive of the southern New Englandfishery off Nantucket and on Georges Bank.
2.3. Boat details
2.3.1. Operating characteristicsVessel characteristics were obtained from interviews in 2012
with industry representatives and boat owners and operators.
Fig. 1. SEFES model structure showing population dynamics components in blue, survey and management components in orange, external forces in green, and industry structureand function in pink.
Although a spectrum of detailed differences exist among vessels inthe surfclam fleet, these vessels can be grouped crudely into small(~40-cage capacity),1 medium (~80-cage capacity), large (~120-cagecapacity), and jumbo (~160-cage capacity). For this study, twocommon vessel types were compared: small and large. The largevessel has 3 times the capacity of the small vessel. To maintainfishing power equivalent, simulations with small vessels includedthree times as many vessels as simulations with large vessels. Toobtain fishing mortality rates representative of that observed intoday's fishery in the MAB, simulations included either 15 largevessels, five per port, or 45 small vessels, 15 per port. Each boat inthe model has the following characteristics specified: for the smallvessel, steaming speed, 8 kt; maximum on-deck processing ca-pacity, 6 cages hr�1; dredge width, 2.6 m; dredging speed, 3 kt: forthe large vessel, steaming speed, 12 kt; maximum on-deck pro-cessing capacity, 20 cages hr�1; dredge width, 3.8 m; dredgingspeed, 3 kt.
2.3.2. Boat economicsVessel economic data came from MAFMC (1988; see also
Weninger and Strand, 2003) as updated by interviews in 2012 withindustry representatives and vessel operators. For these simula-tions, the following were specified (small vessel, large vessel): fixedcosts ($1579 d�1, $1165 d�1); crew share as fraction of catch reve-nue (0.2, 0.2); boat share as fraction of catch revenue (0.15, 0.15);gear maintenance ($1500 trip�1, $1000 trip�1); fuel use steaming
(30 gal hr�1, 50 gal hr�1); fuel use fishing (45 gal hr�1, 80 gal hr�1).The higher fuel use while fishing occurs because these vessels usehydraulic dredges and the water pump is engaged while dredging.Higher fixed costs and costs of gear maintenance for the smallervessels incorporate the average older age of the vessel in service.For these simulations, the ex-vessel value of landings was set at $12surfclam bu�1 and the price of fuel was set at $4 gal�1. As many ofthe economic values used are temporally variable and as the tightrelationship between plant and vessel minimizes the requirementfor positive net vessel revenue, economic results are best assessedon a relative basis by comparing outcomes between ports, vesselsizes, and captains.
2.4. Captain descriptors
Information describing a captain's decision-making processwhen planning a fishing trip, constraints imposed by dealer landingdeadlines, and the captain's approach to information acquisition onsurfclam abundance came from interviews of vessel captains sup-plemented by interviews with other industry representatives andthe authors' own extensive experiences.
2.4.1. Captain's memoryThe captain controls where the boat fishes. Each captain retains
thememory of past fishing trips. This memory includes an expectedLPUE specified in cages per hour fishing for every fishable 10-minsquare in the domain. At the beginning of the simulation, thememory of each captain contains the LPUE that would be experi-enced by his boat for all 10-min squares based on initial surfclam
Fig. 2. The domain used to simulate conditions present during the 2000s. Blacksquares show the position of 3 ports, from north to south Pt. Pleasant, New Jersey;Atlantic City, New Jersey; and Ocean City, Maryland. Dark gray squares identify theremainder of the coast line. Light gray squares identify locations where surfclams arenot found. The fishable domain encompasses the open squares. Note that the domainhas been rotated for convenience to remove the northeast-southwest trend of the U.S.east coast south of Long Island without changing the dimensions of the 10-min squaresor the distances between ports and fishing grounds. Fig. 3. Recruitment time series for the two case histories. Shaded region identifies the
time frame used for statistical analysis and time series plots of fishing performance.The case shown in the upper plot is referred to in the text as Case 2. The lower plot isreferred to as Case 1. Simulations were run for 100 fishing years arbitrarily designatedto begin in 2000. The first 25 years were ignored (see Methods). The x-axis records theyears since 2000. Thus Case 2 as extracted from the simulation time series representedyears 58e90 of the 100-year simulation.
abundance. That is, initially, all captains have omniscient infor-mation. At the end of each fishing trip, the captain's catch history isupdated for that 10-min square. In this way the captain's memoryof the entire domain degrades over time as the surfclam populationchanges independently of the captain's experience and, therefore,updated memory of it. The captain uses his memory of LPUE tochoose a 10-min square for fishing.
After fishing in a selected 10-min square and returning to port,the LPUE for that trip is used to update the information in thecaptain's memory based on a memory factor (f) that is a fractionindicating the weight placed on past information. If the fraction is0.5, then the memory retained is the average of the previouslystored and just obtained LPUEs. If the fraction is 1, then old infor-mation is retained and new information is ignored. If the fraction is0, then old information is forgotten. For simulations discussed here,captains were assigned memory weights of 0.2 and 0.8 or 0.98 and0.99 (see Fig. 3 in Powell et al., 2015). Thus, certain captains'memories were biased towards new or old information, respec-tively. Responsive captains, given a memory weight of 0.2 or 0.8,based fishing decisions on performance within the previous 1e6weeks depending on the value of f and the number of trips takenper week. Obdurate captains, given a memory weight of 0.98 or0.99, based fishing decisions on performance over a much longerperiod of time (7 months to well over 1 year). The responsivecaptain is considered an average captain in today's fleet and is usedsubsequently as a point of comparison to captains exercisingalternative behaviors. Longer-term memory of locations with highnumbers of seed clams that might provide fishing opportunities4e6 years hence were not retained; rather, this information wasconflated with the provision of survey data to selected captains asdescribed subsequently.
2.4.2. Captain's idiosyncrasiesThe captain is conferred certain degrees of boldness, inquisi-
tiveness, and loquacity as summarized in Table 2. Specifics onimplementation are provided in Powell et al. (2015).
Boldness determines if the captain's behavior includes search-ing. A timid captain never searches, a bold captain searches 40% ofthe time he leaves port, whilst the confident captain searches 20%of the time, about one to two times a month depending on thenumber of fishing trips. When searching, the captain targets arandom square within a 6-hr steam of the homeport regardless ofhis memory of past LPUE performance in that square.
Inquisitiveness indicates whether or not a captain uses the mostrecent survey results to update his knowledge of the expected LPUEfor each 10-min square. Indifferent captains do not use survey re-sults, whereas inquisitive captains use the most recent survey. Thefederal surfclam survey occurs once every 3 years (NEFSC, 2013)and the provision of survey data to the public in the form of fish-ermen's reports (e.g., NEFSC, 1999; NEFSC, 2002) occurs within afewmonths of the survey. Thus, in these simulations, the inquisitivecaptain updates his memory every third year based on surveyresults.
Loquacity determines the tendency for a captain to share theresults of his most recent trip with other captains. This propensityis invoked in the model in probabilistic terms. Captains are eithertaciturn, so that information is never shared, or loquacious, so thatthe captain shares information with each other captain with aprobability of 0.5.
Simulations were run with captains varying by only one traitrelative to the standard, responsive captain. Thus, the responsivecaptain is responsive, timid, indifferent, and taciturn (Table 2). Incontrast, the confident captain varies from this suite of traits in onlyone way, he is confident rather than timid; in other words, hesearches occasionally (Table 2). Similarly, the loquacious captain isidentical to the responsive captain in all but one trait; he isloquacious rather than taciturn.
2.5. Processing plant
The harvest quota for the year is calculated based on the surveyof the previous year and is distributed among the processing plantsin proportion to the fraction of the total fishing power representedby the fleet attached to that plant. Each plant distributes quota to itsfishing boats in proportion to their hold size on a weekly basis. Theweekly quota for a boat is limited to twice its hold size to limitfishing trips to no more than twice a week. This is consistent withstandard operating procedure in the surfclam fishery.
If the weekly quota for a boat averaged over the year is belowtwice its hold size, then the boat cannot complete two trips perweek over the entire year. In this case, the quota is adjusted so thattrips are more frequent when meat yield is highest. Depending onthe success of the fishing effort, unused quota may accrue. At thebeginning of each week, the unused quota for a plant is distributedproportionally to all boats attached to that plant. If the originalquota cannot sustain two trips and the added quota is sufficient tosupport a second trip, a second trip is added. In no case does a thirdtrip occur; rather, unused quota cascades down the followingweeks until a one-trip week can be converted to a two-trip week.
2.6. Weather
Fishing may cease due to inclement weather, primarily in thewinter. Thus, weather was imposed as a factor for 6 months of theyear (OctobereMarch). The frequency of different winter windspeeds was obtained from two NOAA meteorological buoys (NDBC44008 over Nantucket Shoals and NDBC 44009 off Cape May). Thiswind analysis gave the fraction of time that boats of different sizescould fish. For this study, during the winter, small boats have a 50%chance on any given day of leaving port; large boats have an 85%chance.
2.7. Surfclam biology
The initial clam distribution (clams m�2 per size class) isimposed by assigning a biomass for the total population as an initialcondition. This biomass is distributed among 10-min squares as atotal clam density (summed over sizes) using a negative binomialrandom distribution to create a patchy distribution over the cells inwhich clams can exist. Then, a spatially-varying size distribution isused to distribute the clams in each cell into size categories. Theinitial conditions are adjusted by running the model for 100 yearswithout fishing, about three times the longest surfclam life span(Munroe et al., 2016), to allow the initial population to adjust to thechosen rates of growth, mortality, and reproduction. Fishing in eachsimulation, therefore, begins with a virgin stock.
The allometric relationship between length and weight wasobtained from Marzec et al. (2010). The von-Bertalanffy growthparameters were estimated from information provided by thefederal surfclam survey (Munroe et al., 2016; NEFSC, 2013; see alsoMunroe et al., 2013). Natural mortality is imposed once yearly usinga specified instantaneous mortality rate that is the same across allsize classes. Munroe et al. (2013) raise the issue of increased mor-tality at old age, consistent with other bivalves (see Powell et al.,
2012). However, the presently-accepted stock assessment modelretains the constant mortality assumption consistent withWeinberg (1999). Powell et al. (2015) provide theparameterizations.
Growth and mortality are varied by 10-min square by specifyingthe values of the von-Bertalanffy parameters k and L∞, and thenatural mortality rate at the corners of the domain and assigningvalues to each cell by interpolation. This permits latitudinal andcross-shelf variations in growth and mortality (Weinberg, 1999;Chintala and Grassle, 2001; Weinberg et al., 2002; Munroe et al.,2013, 2016). For this study, mortality rate was specified to in-crease from northeast to southwest across the domain to reducesurfclam abundance at the southern and inshore extremes of therange, consistent with Weinberg (1999, 2005). The von-Bertalanffyk varies latitudinally in the MAB from 0.25 yr�1 in the south to 0.19yr�1 in the north and declines offshore to 0.15 yr�1. L∞ varies lati-tudinally from 150 to 164 cm.
Clams recruit to the population one day per year, chosen arbi-trarily to be October 1. A stock-recruit relationship could not beresolved by the most recent stock assessment (NEFSC, 2013).Accordingly, for this model, Beverton-Holt parameters were esti-mated for the simulated virgin stock from an input value forsteepness, set at 0.8 for these simulations, following the method ofMyers et al. (1999; see also O'Leary et al., 2011). Each year, totalrecruitment, calculated using the Beverton-Holt relationship, isparsed out to each 10-min square by adding individuals to thesmallest size class (20 mm) based on a negative binomial distri-bution which makes the cell-wise recruit process patchy. Thesmallest size class used is consistentwith juvenile growth rates thatshow that newly settled clams can reach 20 mm by the end of thesettlement year (Chintala and Grassle, 1995; Ma et al., 2006).
To simulate a long-term decline in stock biomass as a result of amulti-year period of low recruitment, interannual variability inrecruitment was imposed by obtaining a random factor thatreduced recruitment more often than it enhanced recruitment, butwith a hundred-year average similar to that anticipated from theBeverton-Holt process. Thus, recruitment was imposed with spo-radic recruitment pulses that generated relatively large year clas-ses. Although low abundance might trigger depensation inrecruitment due to reduced fertilization efficiency (Levitan, 1991;Peterson, 2002; Gaylord, 2008), this process has not beenincluded in the model as the relationship of nearest neighbors toregional density (e.g., Hancock, 1973; Ghertsos et al., 2001) insurfclams is unclear. Furthermore, although hydraulic dredgesobviously influence the benthic community (Gilkinson et al., 2005;Morello et al., 2006), the mortality of juvenile surfclams that mightbe resuspended but not caught by the dredge is unknown althoughdredge mortality of all size classes is considered to be low (Meyeret al., 1981). No juvenile mortality as a result of fishing isincluded in the model.
2.8. Choosing a fishing location
A captain chooses a fishing location in the following way. Forthose captains not searching, the captain calculates the time tosteam from the port to each 10-min square in turn. Then the captaincalculates howmany hours would be required to fill his boat basedon his expected LPUE from memory and, in some cases, additionalsources of information from other captains or survey data. Thecaptain chooses to fish in the 10-min square yielding the shortestfill time and the least distance from port in order to minimize timeat sea while returning to the dock with a full load. This is consistentwith standard industry procedure in which plant demand isimposed by regulating the number of fishing trips, not the catch pertrip. Interviews with industry representatives emphasize the time-
at-sea criterion. The captain is assumed to know LPUE in wholecage units per hour. Thus, a number of 10-min squares may havethe same LPUE. Accordingly, the captain identifies one or more 10-min squares that maximize LPUE and chooses among these for hisnext trip the 10-min square nearest to port. A 10-min square isabout 80 nm2, so that multiple vessels may fish simultaneously inone 10-min square without interference.
2.9. Fishing details
The number of clams harvested during an hour of fishing iscalculated from the area swept by the dredge, which depends onthe tow speed and dredge width, the efficiency of the dredge, andthe size selectivity of the dredge. In addition, the harvest is reducedif the harvest rate per hour exceeds the boat's handling capacity.The number of hours fished is determined by the time necessary tofill the vessel, as constrained by the allowed time on site given thesteaming time to return to port. Vessel characteristics were ob-tained from vessel captains and industry representatives. Selec-tivity and efficiency relationships were obtained from the federalsurvey program (e.g., NEFSC, 2013; see also Rago et al., 2006;Hennen et al., 2012).
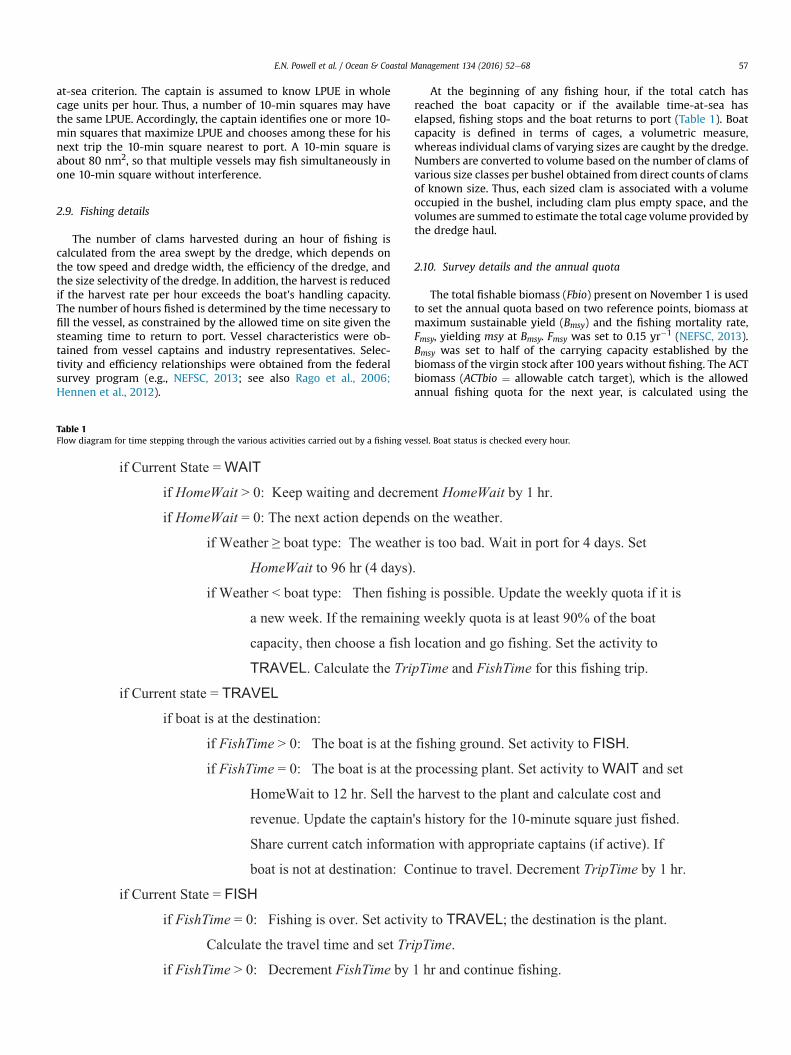
Table 1Flow diagram for time stepping through the various activities carried out by a fishing ve
At the beginning of any fishing hour, if the total catch hasreached the boat capacity or if the available time-at-sea haselapsed, fishing stops and the boat returns to port (Table 1). Boatcapacity is defined in terms of cages, a volumetric measure,whereas individual clams of varying sizes are caught by the dredge.Numbers are converted to volume based on the number of clams ofvarious size classes per bushel obtained from direct counts of clamsof known size. Thus, each sized clam is associated with a volumeoccupied in the bushel, including clam plus empty space, and thevolumes are summed to estimate the total cage volume provided bythe dredge haul.
2.10. Survey details and the annual quota
The total fishable biomass (Fbio) present on November 1 is usedto set the annual quota based on two reference points, biomass atmaximum sustainable yield (Bmsy) and the fishing mortality rate,Fmsy, yielding msy at Bmsy. Fmsy was set to 0.15 yr�1 (NEFSC, 2013).Bmsy was set to half of the carrying capacity established by thebiomass of the virgin stock after 100 years without fishing. The ACTbiomass (ACTbio ¼ allowable catch target), which is the allowedannual fishing quota for the next year, is calculated using the
following rules that include a 25% reduction in quota due touncertainty:
if Fbio>0:5 Bmsy then ACTbio¼ 0:75 Fbio�1� e�Fmsy
�; (1)
if Fbio<0:25 Bmsy then ACTbio ¼ 0; (2)
otherwise ACTbio ¼ 0:75 Fbio�1� e
��Fmsy
Fbio0:5Bmsy
��: (3)
The annual quota in biomass is converted to bushels of clamsand is capped at 3.5 million bushels. This cap is imposed by thefishery management plan (FMP) (MAFMC, 1986).
3. Simulations
Simulations were designed to permit extraction of informationprior to and after a pulsed recruitment event. To accomplish this, a100-year simulationwas conducted following the 100-year spin-upearlier described. The first 25 years were used to permit thesimulated fishery to fish down the stock from its virgin state to astock abundance consistent with observations in the MAB and toallow the captains to lose their initial omniscience. The following75 years contained a series of pulsed recruitments interspersed byvarying periods of low recruitment. We chose two sequencesamong many that had the following attributes: (a) the time seriesprior to the pulsed recruitment event was minimally decadal inlength without significant recruitment, (b) the time series after thepulsed recruitment event was approximately decadal without sig-nificant recruitment, (c) the excursion in fishing mortality rateduring the decade prior to the event involved at least a 100\% in-crease, and (d) the time series of biomass showed a substantialdecline but did not trigger the FMP rule resulting in a quotareduction beneath the FMP cap.
Simulations using these recruitment time series were designedto compare a series of behavioral choices available to the captains,identified through interviews with industry representatives andcaptains. These choices include (a) the degree to which captainsrely on recent catch history to determine where to fish, (b) whethera captain undertakes searching behavior to determine where tofish, (c) the degree to which captains communicate with each otherabout their trips, and (d) the degree to which captains availthemselves of federal survey data (Table 2). Although illegal har-vesting is often a component of behavioral choice (e.g., McCay,1984; Haring and Maguire, 2008; Bashore et al., 2012), therequirement that each cage receive a tag prior to off-loading haseliminated illegal fishing from the surfclam fishery; thus illegal
Table 2Designations and definitions of captain's traits.
Captain type Responsiveness Boldness
Responsive Responsive TimidMemory ¼ 0.2,0.8 Never searches
Obdurate Obdurate TimidMemory ¼ 0.98, 0.99 Never searches
Bold Responsive BoldMemory ¼ 0.2,0.8 Searches on 40% of trip
Confident Responsive ConfidentMemory ¼ 0.2,0.8 Searches on 20% of trip
Inquisitive Responsive TimidMemory ¼ 0.2,0.8 Never searches
Loquacious Responsive TimidMemory ¼ 0.2,0.8 Never searches
harvesting was not included in this study.We compared two vessel sizes, small and large, and three ports
that encompass the primary homeports in the MAB as they haveexisted over the recent history of the fishery. Analysis of simulationresults focused on the followingmetrics: the time spent fishing, thedifferential in catch between that anticipated if all trips returned toport fully loaded and the landed catch, the distance traveled by theboat to the fishing ground, LPUE (calculated as landings
total on�bottom time),the number of 10-min squares fished per year, and the net revenuefor the vessel. Net revenue is calculated relative to a stipulated ex-vessel value of the catch and the cost of fuel; accordingly, relativevariations in net revenue are more important than the actual value.
4. Statistics
Time series of vessel performance was standardized to a meanof 0 and a standard deviation of 1. Principal components analysis(PCA) was used to identify the relationship between a suite of timeseries of this kind. Only factors with eigenvalues �1 were retained.Time series were of the form of skewed parabolas or hyperbolas.Each time series was analyzed and a suite of diagnostic metricsobtained: skewness, kurtosis, the maximum value, the minimumvalue, the range of values (amplitude), the first and last yearsrepresenting the 50th and 25th or 75th (depending on parabola orhyperbola) portion of the amplitude, and the elapsed time in yearsbetween each of the pairs of first and last years. These variableswere inputted to another PCA and all factors with eigenvalues �1retained. Selected metrics were analyzed by ANOVA with maineffects being vessel size, captain behavior, and vessel homeport. ATukey's Studentized Range test was used to identify differencesbetween main-effect categories.
5. Results
5.1. Attributes of scenarios
Certain outcomes of the model depend on the choice of randomnumbers, particularly the distribution of recruits among 10-minsquares. A series of simulations was conducted by Powell et al.(2015) to evaluate the influence of random number on simulationoutcome. This analysis showed that the choice of seed number forthe random number generator did not substantively affect theeconomics of the vessel, LPUE, hours spent fishing, average distancetraveled from the port to the fishing ground, or the degree to whichthe vessel returned to port fully loaded. Thus, results presentedsubsequently are limited to single simulations for each combina-tion of case history, vessel size (small versus large), and captain'sbehavioral choice.
Inquisitiveness Loquaciousness
Indifferent TaciturnNever uses survey Communication probability ¼ 0Indifferent TaciturnNever uses survey Communication probability ¼ 0Indifferent TaciturnNever uses survey Communication probability ¼ 0Indifferent Taciturn
s Never uses survey Communication probability ¼ 0Inquisitive TaciturnUses survey Communication probability ¼ 0Indifferent LoquaciousNever uses survey Communication probability ¼ 0.5
We examined two case histories (Fig. 3). Both showed similartrends, although differing in some details. The relationship offishable biomass to fishing mortality rate during an extended seriesof low-recruitment years followed by a significant recruitmentevent is shown for both case histories in Fig. 4. Biomass drops earlyin the time series by a factor of about 5 in one case and 3 in another.Fishing mortality rate rises by a similar factor in both cases. Neitherexcursion triggers an overfishing definition nor does the quota dropbelow the FMP cap. Thus, the quota remains constant at the FMPcap. These attributes are consistent with the regulatory environ-ment under which the surfclam fishery has existed in the firstdecade of the 21st century.
5.2. LPUE
During the simulated low-recruitment event, LPUE declinessteadily in both case histories and for both vessel sizes (Figs. 5e6).Recovery occurs more rapidly than the decline in all cases and isdelayed by a few years following the recruitment event while newrecruits grow to market size. In both cases, LPUE drops from 2 to 4cages hr�1 for the smaller vessels to about 1 cage hr�1. Large vesselsdrop from 4 to 8 cages hr�1 to about 1e2 cages hr�1.
The first two eigenvalues of the PCA using the descriptors ofthese curves accounted for 69% of the variance in both cases. Thefirst two factor axes were explained by the range in LPUE during thedecline in biomass and its recovery (Factor 1) and by the span ofyears encompassed by the period of low LPUE (Factor 2). A PCA onthe time series data showed that eigenvalue 1 accounted for 99% ofthe variance in Case 1 and 66% of the variance in Case 2. Theincreased variability in the time series in Case 2 is obvious from acomparison of Figs. 5 and 6. Similarity between time series is pri-marily a function of the similar trajectories a few years before andafter the nadir in LPUE; that is, to a substantive degree, all captainsand both boat types respond similarly to the low recruitment event.Dissimilarity is imposed by the prior and subsequent histories
Fig. 4. The time series of fishable biomass (surfclams �120 mm) and fishing mortalityrate for the two case histories for the time period shaded in Fig. 3. Upper plot is Case 2.Years on the X-axis refer to the portion of the time series used for analysis (Fig. 3).
bounding the event.Port location little influenced simulated fishery performance as
it responded to a period of low recruitment (Fig. 7). The decline inLPUE during the low recruitment interval was much larger for largevessels, in part due to the fact that these vessels had greatercatching capacity in the first place (Fig. 7); however, the declinewasalso proportionately larger for large vessels, as small and largevessels had low and relatively similar LPUEs when stock abundancedeclined to low levels. Captain's performance varied the degree towhich LPUE declined; however, the two time series differed sub-stantively in the response depending on the behavioral strategyapplied to fishing (Fig. 7). Nearly all of this differential originatedfrom the degree of performance at high stock abundance. Thus, theapparent lesser impact on the bold captain is primarily due to therelatively poorer performance of that captain at high abundance.Notwithstanding this trend, the tendency for certain captains toperform poorly under normal stock densities was retained at lowstock abundance. Thus nadiral LPUE was lowest for the obduratecaptain and the highest nadiral value was obtained for the confi-dent captain in both time series (Fig. 7). The rank order of thecaptains' performances was similar at high abundance prior to thelow-recruitment event and at the nadir of stock abundance whenLPUE was lowest.
The duration of low performance as measured by LPUE is afunction both of the response to declining stock abundance and therapidity with which captains locate good fishing grounds when
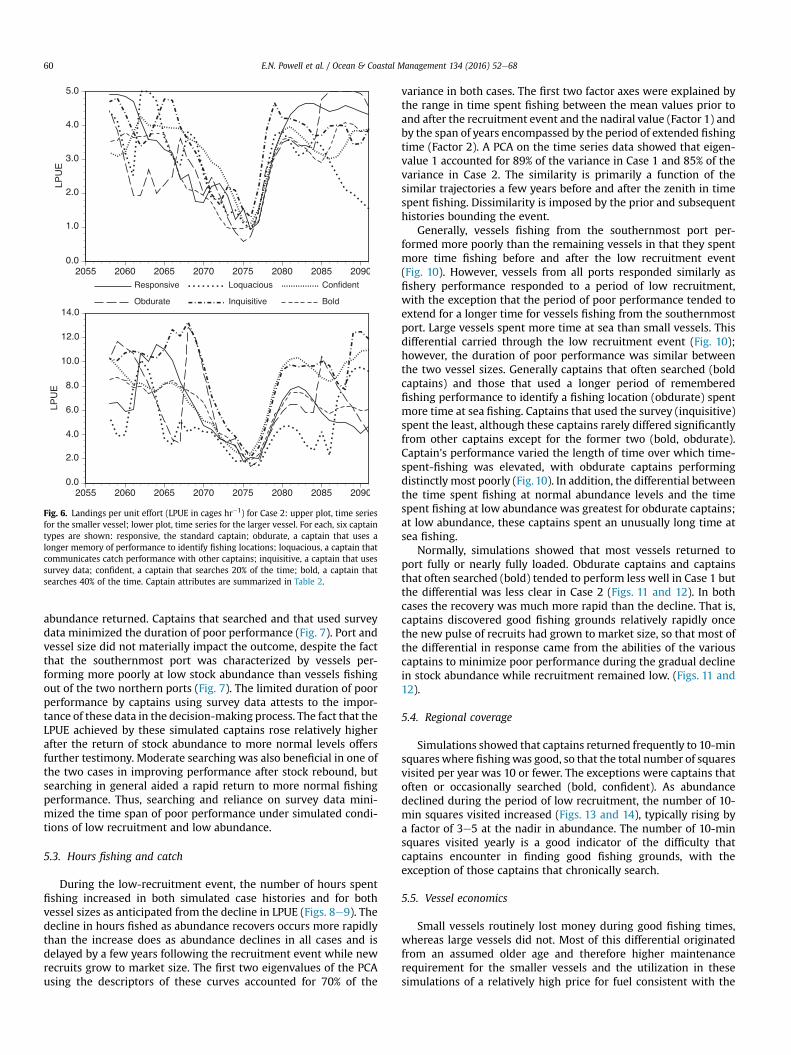
Fig. 5. Landings per unit effort (LPUE in cages hr�1) for Case 1: upper plot, time seriesfor the smaller vessel; lower plot, time series for the larger vessel. For each, six captaintypes are shown: responsive, the standard captain; obdurate, a captain that uses alonger memory of performance to identify fishing locations; loquacious, a captain thatcommunicates catch performance with other captains; inquisitive, a captain that usessurvey data; confident, a captain that searches 20% of the time; bold, a captain thatsearches 40% of the time. Captain attributes are summarized in Table 2.
Fig. 6. Landings per unit effort (LPUE in cages hr�1) for Case 2: upper plot, time seriesfor the smaller vessel; lower plot, time series for the larger vessel. For each, six captaintypes are shown: responsive, the standard captain; obdurate, a captain that uses alonger memory of performance to identify fishing locations; loquacious, a captain thatcommunicates catch performance with other captains; inquisitive, a captain that usessurvey data; confident, a captain that searches 20% of the time; bold, a captain thatsearches 40% of the time. Captain attributes are summarized in Table 2.
abundance returned. Captains that searched and that used surveydata minimized the duration of poor performance (Fig. 7). Port andvessel size did not materially impact the outcome, despite the factthat the southernmost port was characterized by vessels per-forming more poorly at low stock abundance than vessels fishingout of the two northern ports (Fig. 7). The limited duration of poorperformance by captains using survey data attests to the impor-tance of these data in the decision-making process. The fact that theLPUE achieved by these simulated captains rose relatively higherafter the return of stock abundance to more normal levels offersfurther testimony. Moderate searching was also beneficial in one ofthe two cases in improving performance after stock rebound, butsearching in general aided a rapid return to more normal fishingperformance. Thus, searching and reliance on survey data mini-mized the time span of poor performance under simulated condi-tions of low recruitment and low abundance.
5.3. Hours fishing and catch
During the low-recruitment event, the number of hours spentfishing increased in both simulated case histories and for bothvessel sizes as anticipated from the decline in LPUE (Figs. 8e9). Thedecline in hours fished as abundance recovers occurs more rapidlythan the increase does as abundance declines in all cases and isdelayed by a few years following the recruitment event while newrecruits grow to market size. The first two eigenvalues of the PCAusing the descriptors of these curves accounted for 70% of the
variance in both cases. The first two factor axes were explained bythe range in time spent fishing between the mean values prior toand after the recruitment event and the nadiral value (Factor 1) andby the span of years encompassed by the period of extended fishingtime (Factor 2). A PCA on the time series data showed that eigen-value 1 accounted for 89% of the variance in Case 1 and 85% of thevariance in Case 2. The similarity is primarily a function of thesimilar trajectories a few years before and after the zenith in timespent fishing. Dissimilarity is imposed by the prior and subsequenthistories bounding the event.
Generally, vessels fishing from the southernmost port per-formed more poorly than the remaining vessels in that they spentmore time fishing before and after the low recruitment event(Fig. 10). However, vessels from all ports responded similarly asfishery performance responded to a period of low recruitment,with the exception that the period of poor performance tended toextend for a longer time for vessels fishing from the southernmostport. Large vessels spent more time at sea than small vessels. Thisdifferential carried through the low recruitment event (Fig. 10);however, the duration of poor performance was similar betweenthe two vessel sizes. Generally captains that often searched (boldcaptains) and those that used a longer period of rememberedfishing performance to identify a fishing location (obdurate) spentmore time at sea fishing. Captains that used the survey (inquisitive)spent the least, although these captains rarely differed significantlyfrom other captains except for the former two (bold, obdurate).Captain's performance varied the length of time over which time-spent-fishing was elevated, with obdurate captains performingdistinctly most poorly (Fig. 10). In addition, the differential betweenthe time spent fishing at normal abundance levels and the timespent fishing at low abundance was greatest for obdurate captains;at low abundance, these captains spent an unusually long time atsea fishing.
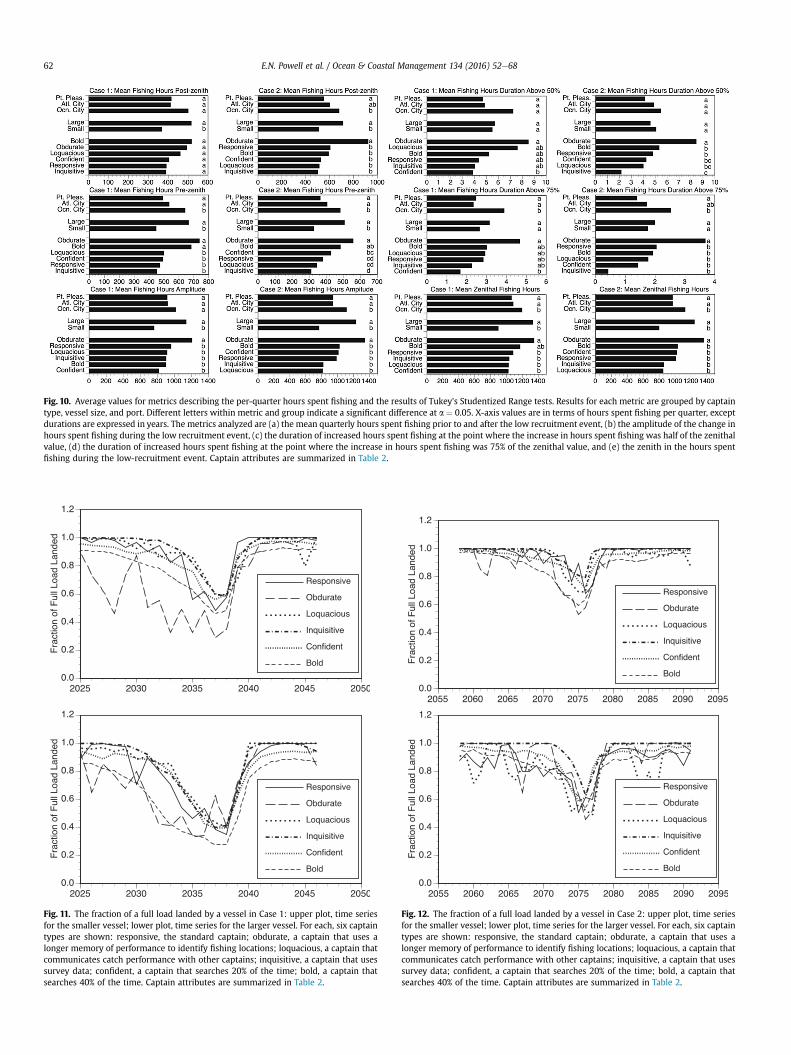
Normally, simulations showed that most vessels returned toport fully or nearly fully loaded. Obdurate captains and captainsthat often searched (bold) tended to perform less well in Case 1 butthe differential was less clear in Case 2 (Figs. 11 and 12). In bothcases the recovery was much more rapid than the decline. That is,captains discovered good fishing grounds relatively rapidly oncethe new pulse of recruits had grown to market size, so that most ofthe differential in response came from the abilities of the variouscaptains to minimize poor performance during the gradual declinein stock abundance while recruitment remained low. (Figs. 11 and12).
5.4. Regional coverage
Simulations showed that captains returned frequently to 10-minsquareswhere fishingwas good, so that the total number of squaresvisited per year was 10 or fewer. The exceptions were captains thatoften or occasionally searched (bold, confident). As abundancedeclined during the period of low recruitment, the number of 10-min squares visited increased (Figs. 13 and 14), typically rising bya factor of 3e5 at the nadir in abundance. The number of 10-minsquares visited yearly is a good indicator of the difficulty thatcaptains encounter in finding good fishing grounds, with theexception of those captains that chronically search.
5.5. Vessel economics
Small vessels routinely lost money during good fishing times,whereas large vessels did not. Most of this differential originatedfrom an assumed older age and therefore higher maintenancerequirement for the smaller vessels and the utilization in thesesimulations of a relatively high price for fuel consistent with the
Fig. 7. Average values for LPUE-related metrics and the results of Tukey's Studentized Range tests. Results for each metric are grouped by captain type, vessel size, and port.Different letters within metric and group indicate a significant difference at a ¼ 0.05. X-axis values are in terms of cages hr�1, except durations are expressed in years. The metricsanalyzed are (a) the mean LPUEs prior to and after the low recruitment event, (b) the amplitude of the change in LPUE during the low recruitment event, (c) the duration ofdepressed LPUE at the point where LPUE was half of the average pre-event value, (d) the duration of depressed LPUE at the point where LPUE was 25% of the average pre-eventvalue, and (e) the nadiral LPUE. Captain attributes are summarized in Table 2.
Fig. 8. Average hours fished by a vessel per quarter in Case 1: upper plot, time seriesfor the smaller vessel; lower plot, time series for the larger vessel. For each, six captaintypes are shown: responsive, the standard captain; obdurate, a captain that uses alonger memory of performance to identify fishing locations; loquacious, a captain thatcommunicates catch performance with other captains; inquisitive, a captain that usessurvey data; confident, a captain that searches 20% of the time; bold, a captain thatsearches 40% of the time. Captain attributes are summarized in Table 2.
Fig. 9. Average hours fished by a vessel per quarter in Case 2: upper plot, time seriesfor the smaller vessel; lower plot, time series for the larger vessel. For each, six captaintypes are shown: responsive, the standard captain; obdurate, a captain that uses alonger memory of performance to identify fishing locations; loquacious, a captain thatcommunicates catch performance with other captains; inquisitive, a captain that usessurvey data; confident, a captain that searches 20% of the time; bold, a captain thatsearches 40% of the time.
Fig. 10. Average values for metrics describing the per-quarter hours spent fishing and the results of Tukey's Studentized Range tests. Results for each metric are grouped by captaintype, vessel size, and port. Different letters within metric and group indicate a significant difference at a ¼ 0.05. X-axis values are in terms of hours spent fishing per quarter, exceptdurations are expressed in years. The metrics analyzed are (a) the mean quarterly hours spent fishing prior to and after the low recruitment event, (b) the amplitude of the change inhours spent fishing during the low recruitment event, (c) the duration of increased hours spent fishing at the point where the increase in hours spent fishing was half of the zenithalvalue, (d) the duration of increased hours spent fishing at the point where the increase in hours spent fishing was 75% of the zenithal value, and (e) the zenith in the hours spentfishing during the low-recruitment event. Captain attributes are summarized in Table 2.
Fig. 11. The fraction of a full load landed by a vessel in Case 1: upper plot, time seriesfor the smaller vessel; lower plot, time series for the larger vessel. For each, six captaintypes are shown: responsive, the standard captain; obdurate, a captain that uses alonger memory of performance to identify fishing locations; loquacious, a captain thatcommunicates catch performance with other captains; inquisitive, a captain that usessurvey data; confident, a captain that searches 20% of the time; bold, a captain thatsearches 40% of the time. Captain attributes are summarized in Table 2.
Fig. 12. The fraction of a full load landed by a vessel in Case 2: upper plot, time seriesfor the smaller vessel; lower plot, time series for the larger vessel. For each, six captaintypes are shown: responsive, the standard captain; obdurate, a captain that uses alonger memory of performance to identify fishing locations; loquacious, a captain thatcommunicates catch performance with other captains; inquisitive, a captain that usessurvey data; confident, a captain that searches 20% of the time; bold, a captain thatsearches 40% of the time. Captain attributes are summarized in Table 2.
circa-2012 time frame. Net revenue is highly dependent on suchassumptions, and vertical integration in the industry limits theimportance of specific outcomes, so that economic impact is bestdetermined by the differential between cases for vessels of thesame size class. Ergo, analysis of vessel economics focuses on dif-ferentials between ports, vessel sizes, and captains' behavioralproclivities.
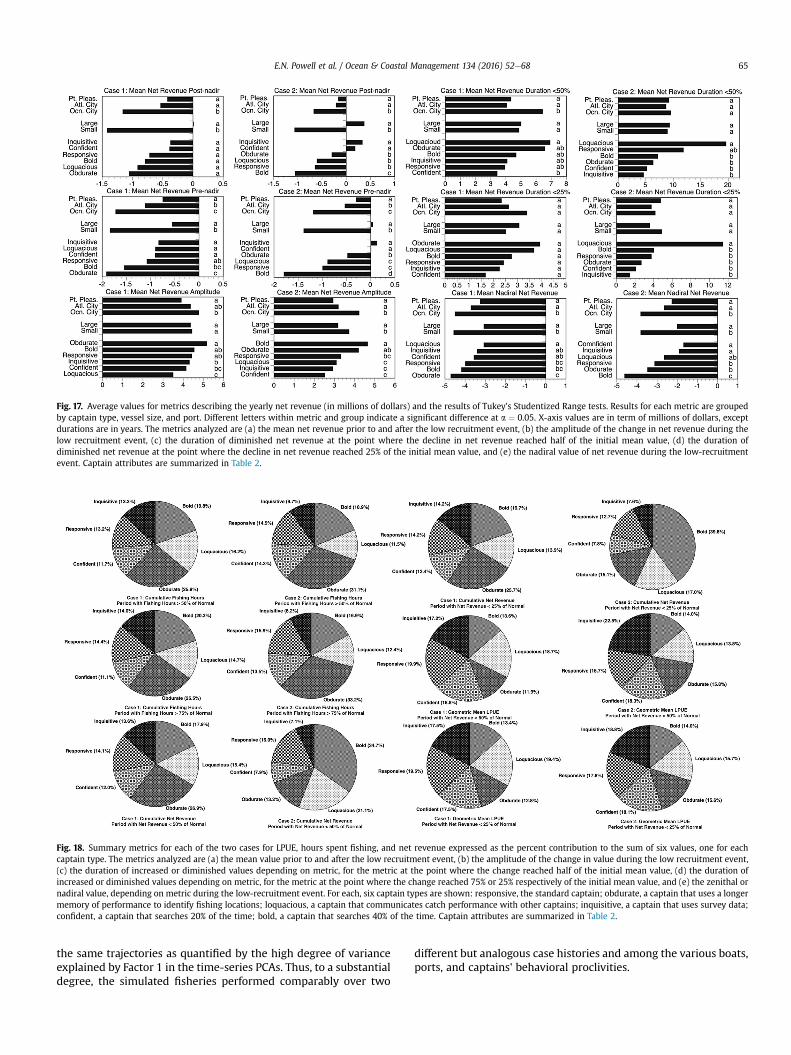
In all simulations, net revenue declined as LPUE declined(Figs. 15 and 16). Recovery occurred more rapidly than the declineand was delayed by a few years following the recruitment eventwhile new recruits grew tomarket size. The first two eigenvalues ofthe PCA using the descriptors of these curves accounted for 70% and76% of the variance in Cases 1 and 2, respectively. The first twofactor axes were explained by the mean, maximum, and minimumvalue of net revenue across the time series (Factor 1) and by theskewness and kurtosis of the curves and the duration of poorperformance as abundance declined (Factor 2). A PCA on the timeseries data showed that eigenvalue 1 accounted for 91% of thevariance in Case 1 and 82% of the variance in Case 2. The similarityis primarily a function of the similar trajectories a few years beforeand after the nadir in performance. Dissimilarity is imposed by theprior and subsequent histories bounding the event, with most ofthe variability imposed by the differential in performance of boldcaptains that tended to see reduced revenues earlier than theremainder and to see the nadiral value drop distinctly greater thanthe rest.
Generally, net revenue was distinctly lower for vessels fishing
Fig. 13. The average number of 10-min squares fished by a vessel in Case 1: upper plot,time series for the smaller vessel; lower plot, time series for the larger vessel. For each,six captain types are shown: responsive, the standard captain; obdurate, a captain thatuses a longer memory of performance to identify fishing locations; loquacious, acaptain that communicates catch performance with other captains; inquisitive, acaptain that uses survey data; confident, a captain that searches 20% of the time; bold,a captain that searches 40% of the time. Captain attributes are summarized in Table 2.
Fig. 14. The average number of 10-min squares fished by a vessel in Case 2: upper plot,time series for the smaller vessel; lower plot, time series for the larger vessel. For each,six captain types are shown: responsive, the standard captain; obdurate, a captain thatuses a longer memory of performance to identify fishing locations; loquacious, acaptain that communicates catch performance with other captains; inquisitive, acaptain that uses survey data; confident, a captain that searches 20% of the time; bold,a captain that searches 40% of the time. Captain attributes are summarized in Table 2.
from the southernmost port than for vessels fishing from the othertwo ports (Fig. 17). The decline in net revenue tended to be largerfor vessels fishing out of the southernmost port and the durationlonger in Case 1, but the latter did not characterize Case 2. Thedifferential between vessel sizes that was inherently present whenfishing performance was good little influenced performance duringthe low recruitment event. Generally simulated performance forboth vessel sizes remained poor for a similar period of time. Thelower nadiral value for small boats mirrored the differential duringperiods of good performance; that is, the amplitude of the declinediffered little and was not significantly different in Case 1 (Fig. 17).During good fishing times, inquisitive and confident captains ten-ded to perform best; bold and obdurate captains worst. Whenabundance declined, the drop in net revenue was largest forobdurate and bold captains and least for confident, inquisitive, andloquacious captains. Obdurate and loquacious captains tended toexperience poor performance for a longer period of time: confidentand inquisitive captains tended to experience poor performance fora briefer period of time. Net revenue dropped to the lowest levelsfor bold and obdurate captains: inquisitive, confident, and loqua-cious captains experienced a less negative nadiral value.
5.6. Integrated comparisons
Summary metrics calculated across the span of years in whichthemetric value fell below half and below the 25% or above the 75%quartile, depending on the direction of change of the metric, of thepre-low-recruitment value reflect both the duration of poor
Fig. 15. The yearly net revenue (in millions of dollars) for a vessel in Case 1: upper plot,time series for the smaller vessel; lower plot, time series for the larger vessel. For each,six captain types are shown: responsive, the standard captain; obdurate, a captain thatuses a longer memory of performance to identify fishing locations; loquacious, acaptain that communicates catch performance with other captains; inquisitive, acaptain that uses survey data; confident, a captain that searches 20% of the time; bold,a captain that searches 40% of the time. Captain attributes are summarized in Table 2.
Fig. 16. The yearly net revenue (in millions of dollars) for a vessel in Case 2: upper plot,time series for the smaller vessel; lower plot, time series for the larger vessel. For each,six captain types are shown: responsive, the standard captain; obdurate, a captain thatuses a longer memory of performance to identify fishing locations; loquacious, acaptain that communicates catch performance with other captains; inquisitive, acaptain that uses survey data; confident, a captain that searches 20% of the time; bold,a captain that searches 40% of the time. Captain attributes are summarized in Table 2.
performance and the degree of poor performance during thoseyears. We used the geometric mean of the yearly LPUE values andthe sum of the hours fished and net revenue for comparison. Thegeometric mean of LPUE was lowest for the bold and obduratecaptains in both cases (Fig. 18). In Case 1, the remaining captainsperformed similarly over the low-recruitment event. In Case 2, theinquisitive and confident captains performed distinctly better thanthe rest. This was true over the period of performance below half ofthe pre-low-recruitment period and generally true for the nadiralperiod when performance dropped by 75%.
Simulations indicated that the bold and obdurate captains couldbe expected to spend more time fishing than the other captainsduring the nadiral phase of the low-recruitment event (Fig. 18). Theremaining captains could be expected to perform similarly inrelation to the poorer performance of the bold and obdurate cap-tains. Thus, differences in LPUE between the bold and obduratecaptains and the remaining captains were a function of longertimes fishing due to substandard choices of fishing grounds. Threeof the four more successful captains acquired information throughsurvey, search, or communication. However, the responsive captainalso performed well, despite the absence of input beyond his ownmemory.
On the other hand, the bold and obdurate captains limited theimpact of low recruitment on earnings to a lesser extent than theother captains. In the case of earnings, the inquisitive and confidentcaptains performed distinctly better than the responsive andloquacious captains in most cases: the differential was most pro-nounced in Case 2. These two captains had the most up to date
information and limited cost under the same LPUE by limiting timeat sea, not just time fishing. On average, these captains fishednearer to the home port and returned more predictably with a fullload, thus improving net earnings under similar LPUEs.
6. Discussion
6.1. Perspective
We simulated an extended period of low recruitment duringwhichmarket-size abundance declined by about a factor of 5 over aperiod of about 10 years. The decline occurred gradually, but wasfollowed by a recruitment event that rapidly returned biomass tothe original higher levels. The fishing mortality rate rose from lowlevels to 0.02e0.025 yr�1, values that are consistent with a period oflow recruitment observed during the present-day fishery (NEFSC,2013). During this excursion in biomass, LPUE declined as lowerabundance required an extended time at sea to catch a full load.Vessels more frequently returned to port without a full load. Cap-tains expanded their geographic range of interest, occupyingincreasingly more 10-min squares in an effort to maintain theirperformance. Net revenue declined as increased time at sea andincreased fuel consumption, abetted by lower catch, reduced vesselrevenues and increased vessel costs. None of these changes isunanticipated.
We examined two case histories that differed in a host of par-ticulars, but the overall trends were the same, as were the re-sponses by the fishing vessels; the performance curves followed
Fig. 17. Average values for metrics describing the yearly net revenue (in millions of dollars) and the results of Tukey's Studentized Range tests. Results for each metric are groupedby captain type, vessel size, and port. Different letters within metric and group indicate a significant difference at a ¼ 0.05. X-axis values are in term of millions of dollars, exceptdurations are in years. The metrics analyzed are (a) the mean net revenue prior to and after the low recruitment event, (b) the amplitude of the change in net revenue during thelow recruitment event, (c) the duration of diminished net revenue at the point where the decline in net revenue reached half of the initial mean value, (d) the duration ofdiminished net revenue at the point where the decline in net revenue reached 25% of the initial mean value, and (e) the nadiral value of net revenue during the low-recruitmentevent. Captain attributes are summarized in Table 2.
Fig. 18. Summary metrics for each of the two cases for LPUE, hours spent fishing, and net revenue expressed as the percent contribution to the sum of six values, one for eachcaptain type. The metrics analyzed are (a) the mean value prior to and after the low recruitment event, (b) the amplitude of the change in value during the low recruitment event,(c) the duration of increased or diminished values depending on metric, for the metric at the point where the change reached half of the initial mean value, (d) the duration ofincreased or diminished values depending on metric, for the metric at the point where the change reached 75% or 25% respectively of the initial mean value, and (e) the zenithal ornadiral value, depending on metric during the low-recruitment event. For each, six captain types are shown: responsive, the standard captain; obdurate, a captain that uses a longermemory of performance to identify fishing locations; loquacious, a captain that communicates catch performance with other captains; inquisitive, a captain that uses survey data;confident, a captain that searches 20% of the time; bold, a captain that searches 40% of the time. Captain attributes are summarized in Table 2.
the same trajectories as quantified by the high degree of varianceexplained by Factor 1 in the time-series PCAs. Thus, to a substantialdegree, the simulated fisheries performed comparably over two
different but analogous case histories and among the various boats,ports, and captains' behavioral proclivities.
The purpose of the study was to examine the anticipated re-sponses of captains of varying behavioral proclivities to the chal-lenge of declining stock abundance. Powell et al. (2015) found littledifference in performance amongst captains of differing proclivitiesduring times of limited excursions in stock abundance or distri-butional pattern. In the case examined here, simulated captainsfaced extreme challenges as the fishing mortality rate increased byover an order of magnitude and stock declined by a factor of about5.
We examined a range of typical behaviors observed for captainsin the present fleet and reported to have occurred over the courseof the history of the fishery. This included captains that utilizedstock survey data to identify fishing locations (inquisitive captains),captains that searched occasionally (confident captains) orfrequently (bold captains), captains that shared information ontheir catches (loquacious captains), and captains that tended tointegrate a shorter period (responsive captains) or a longer period(obdurate captains) of their catch history into their decision-making process (Table 2).
To a substantial degree, all captains responded similarly to aperiod of low recruitment. LPUE slowly declined. Captains tendedto travel farther from port as 10-min squares nearer their portswere fished down. As a consequence, the tendency for boats toreturn to port fully loaded decreased. Time spent fishing alsoincreased as 10-min squares initially with lesser clam densitiesbecame favored as originally favored 10-min squares were fisheddown. The number of 10-min squares visited increased as the nadirof abundance was approached. Thus, all captains accessed a muchlarger portion of the domain in order to reduce the rate of decline inLPUE. In the end, however, no behavior was sufficient to offset thedecline in abundance, so that both LPUE and hence net revenueplummeted.
Despite the similarity in responses between captains, importantdifferences exist in the particulars of the response; the rank order ofcaptains' behavior varied between metrics and between the twoscenarios. Thus, the drop in LPUE was largest for the loquaciouscaptain in Case 1, but the loquacious captain performed aboutaverage by the same metric in Case 2. However, at a somewhatmore general level, captains that obtained information from surveydata or by searching limited the impact of low recruitment on LPUE.For those captains that used the survey (inquisitive) or moderatelysearched (confident), the lesser decline in LPUE was reflected in thelesser decline in net revenue and a lesser increase in total fishinghours. This did not occur for the captain that searched frequently; alesser decline in LPUE did not reflect positively in other metrics.Rather, LPUE was low initially and declined to the lowest nadiralvalue, although the amplitude was less due to the lower startingpoint, and time spent fishing remained high which limited theLPUE decline. Thus occasional searching derived benefits, whereasfrequent searching did not.
The degree of change in a metric is consequential, but theelapsed time underperforming is at least as important. Here, weexamined the time that passed with performance less than 50% andless than 25% or greater than 75%, depending on the metric, oforiginal performance levels. Simulations showed that captains thatsearched or used survey data limited the duration at which LPUEwas low because they were able to limit the duration of time whentime spent fishing was unusually high. Moderate searching per-formed better than frequent searching once again. For this reason,the duration of time when net revenue was low was less for thesecaptains.
The responsive captain, the captain that based choices on themost recent catch history, performed about average according to all
metrics, not as well in most cases as captains that searchedmoderately or used survey data, but better than captains thatcommunicated or employed a longer record of catch history indeciding locations to fish. The latter is not surprising. What issurprising is how poorly captains that communicated performed.These captains suffered a relatively long duration of poor perfor-mance; net revenue was low for a longer period of time althoughthe amplitude of decrease was less than for some other behavioraltypes. LPUE tended to be relatively low for these captains generally,but declined less. Time spent fishing was consistently relativelylow, but this did not translate into LPUE performance. LPUE reacheda lower nadiral value thanmost, but part of this response originatedin the lower initial value under normal conditions of abundance.Loquacious captains performed much better in Case 1 than in Case2, so the response was unusually case dependent. In these simu-lations, loquacious captains gather information haphazardly fromother captains. Some of this information is good, e.g., from confi-dent or inquisitive captains, and some of it is less good, e.g., frombold or obdurate captains. Thus, these captains implement amixture of good and less good choices, as they treat all informationwith equivalent cache.
6.3. Impetus for behavioral adaptation
Powell et al. (2015) examined a range of captains' behaviorsunder standard fishing conditions during a period of relativelyconstant and high stock abundance. Under these conditions,behavioral choice made little difference in the outcome. Powellet al. (2015) examined the influence of climate change bycomparing the 1990s period to that of the 2000s. Surfclams aresensitive to bottom water temperatures above about 21 �C(Weinberg, 2005; Munroe et al., 2013). As a consequence, warmingof the MAB (Scavia et al., 2002; Jossi and Benway, 2003; Kerr et al.,2009; Narv�aez et al., 2015) has resulted in a range contraction forthis species since the mid-1990s (Weinberg et al., 2002, 2005;Weinberg, 2005). A large-spatial-scale mortality event occurred atthe southern boundary of the surfclam's range coincident with thisrise in bottom water temperature (Kim and Powell, 2004; Narv�aezet al., 2015) driving the southern boundary northward and theinshore boundary offshore (Weinberg et al., 2002). This decadalredistribution of the stock has resulted in a redistribution of fishingeffort accompanied by the movement of processing plants north-ward and the shift of vessels from southerly ports northward. Theopening of Georges Bank has alleviated the forced regionalcompression of the fishery to some extent. Despite these fisheryresponses, the fleet remaining in the MAB now focuses heaviestfishing pressure in a smaller region. Powell et al. (2015) concludedthat the range contraction did not favor or debit any captain'sbehavioral choice disproportionately. Thus, the difference in per-formance amongst captains of various behaviors is a nuanced one, iffishing conditions are stable and abundance not unduly low.
Contrast these results from steady state conditions to thoseobtained in the present study. In our study, simulations subjectedcaptains to highly variable population dynamics that stressedperformance by reducing the density of market-size surfclams. Thebehavioral proclivities of captains substantively influenced theoutcome. Use of survey data, made available every three years,significantly improved performance. About equal in positive effectwas moderate searching. The survey is essentially a comprehensivesearch, but available only periodically. Moderate searching resultsin updated information more frequently, but over a smaller area.
Other behaviors incurred penalties. Communication failed toprovide improved performance because both poor and good in-formation was transferred. Reliance on a long period of catch his-tory failed to improve performance because too much information
was out of date during a time of rapidly changing conditions.Frequent searching underperformed mostly because frequentsearching in and of itself represents an additional cost factor andtakes time away from fishing; as a consequence, the benefit offrequent searching in providing up-to-date information did notcounterweigh the inherent liabilities associated with the activity.
Searching is an important component of captains' decision-making process in many fisheries (Gillis et al., 1993; Dorn, 2001;Powell et al., 2003a). Powell et al. (2015) noted that captainsdesire to search more than vessel owners will permit. The di-chotomy driving this differential is the difference between mod-erate and frequent searching. In this study, moderate searchingimproved performance: frequent searching deteriorated perfor-mance. What approach to use to optimize searching time is unclear,however. Moreover, frequent searching during a period of decliningstock abundance proved to bemuchmore injurious to performancethan under conditions of stable population dynamics (e.g., Powellet al., 2015) whereas occasional searching during a period ofdeclining stock abundance proved to be much more advantageousthan under conditions of stable population dynamics. Thus, thequestion of when and how frequently to search becomes moresignificant as fishery performance declines.
7. Conclusions
For surfclams, recruitment during the 2000s has averaged muchbelow recruitment in the 1985e1995 period in the MAB (NEFSC,2013). Six of the 7 lowest recruitment years since 1978 occurredin the 2000s, as estimated by the most recent federal stockassessment (NEFSC, 2013). Thus, the 2000s have been an extendedperiod of low recruitment. Fishing mortality rates have risen asabundances declined (NEFSC, 2013). The contraction in range hasexacerbated this trend. The simulations we present represent anextended period of low recruitment, but extended periods of lowrecruitment clearly fall within the ambit of the surfclam's popula-tion dynamics. Management of the surfclam fishery has beenrelatively noncontroversial as the quota cap in the FMP hasremained far below the overfishing limit, even under a period oflow recruitment. An important contributing factor is thegeographic extent over which surfclams live at relatively lowabundance. That is, the total population abundance is supported toa considerable extent by vast areas of low surfclam density. Suchareas are unfishable, as LPUEs are too low. The surfclam fishery seesstock abundance in terms of patches of high density. Boats fishingin areas of low abundance cannot fill their holds in the allotted timefor a trip, typically in the summer 48 h dock to dock. Thus, theimpact of low recruitment is realized much more rapidly by thefishery than by the stock.
LPUE has proven to be a difficult metric to evaluate in the stockassessment. Presently, trends in LPUE are not used to evaluate thestock and fishery relative to the sustainable yield reference points,Bmsy and Fmsy (NEFSC, 2013), because the fishery tends to concen-trate on a few 10-min squares supporting high surfclam density(e.g., Figs.13 and 14). These squares are slowly fished down creatinga stock-wide decline in LPUE that is not normally reflected in achange in abundance for the stock as a whole. The dynamics do notnecessarily mean that fishery performance is endangered by lowstock abundance as captains tend to revisit 10-min squares forsome time before searching for new areas to fish. As a consequence,evaluation of the impact of low recruitment as it imposes aconstraint on the availability of patches supporting adequate LPUEis a challenge.
This study identifies some metrics that might be gleaned fromlandings data that would suggest a restriction in adequate fishingopportunities imposed by a drop in abundance and particularly a
drop in the availability of high-density components of the popu-lation. We suggest that the number of 10-min squares visited bycaptains will increase under these conditions. LPUE will drop andthe drop will be dominated by the time spent fishing which willincrease. The distance traveled will also tend to increase as many ofthe new 10-min squares that are accessed will be farther from port.Total time at sea will increase and, assuming that refrigerationequipment is not installed, vessels will return to port without a fullhold increasingly often. We have not examined managementmeasures that might respond to these constraints. As is true intoday's fishery, the restrictions that so influenced vessel behaviornonetheless occurred under stock biomasses that did not triggerrestrictions imposed by federally-mandated guidelines. Thus, gravedislocations in the fishery can occur even if federally-mandatedguidelines on stock status are fully met. We note, for example,that fishing mortality rate in our simulations exceeded 0.02 yr�1 foronly a few years. Fishing mortality rates have been about twice thishigh since 2003 in the northern New Jersey region south of HudsonCanyon that supports the bulk of the fishery (NEFSC, 2013). LPUEhas declined. It would be interesting to determine the per-vessel10-min square visitation rate over this time period and to investi-gate the reasons for differential responses between vessels andvessel captains.
Acknowledgments
Particular thanks to Dave Wallace, Jack Miles, Rob Jarmol, JoeCarch, Tom Hoff and a number of other industry representativesand captains that provided substantial information leading to thedevelopment and parameterization of SEFES. This study could nothave been accomplished without their support. This project wasfunded by award GEO-0909484 from the NSF Coupled Natural andHuman Systems program and by the NSF I/UCRC (Industry/Uni-versity Cooperative Research Center) Science Center for MarineFisheries (SCeMFiS) under award ENG-1266057. We appreciate thissupport.
References
Adelaja, A., McCay, B., Menzo, J., 1998. Market share, capacity utilization, resourceconservation, and tradable quotas. Mar. Resour. Econ. 13, 115e134.
Bashore, C.J., Lane, H.A., Paynter, K.T., Naylor, M., Harding, J.R., Love, D.C., 2012.Analysis of marine police citations and judicial decisions for illegal harvesting ofeastern oysters (Crassostrea virginica, Gmelin 1791) in the Maryland portion ofthe Chesapeake Bay, United States, from 1954 to 2010. J. Shellfish Res. 31,591e598.
Bastardie, F., Vintehr, M., Nielsen, J.R., Ulrich, C., Paulsen, M.S., 2010. Stock-based vs.fleet-based evaluation of the multi-annual management plan for the cod stocksin the Baltic Sea. Fish. Res. 101, 188e202.
Baudron, A., Ulrich, C., Nielsen, J.R., Boje, J., 2010. Comparative evaluation of amixed-fisheries effort-management system based on the Faroe Islandsexample. ICES J. Mar. Sci. 67, 1036e1050.
Chintala, M.M., Grassle, J.P., 1995. Early gametogenesis and spawning in “juvenile”Atlantic surfclam, Spisula solidissima (Dillwyn, 1819). J. Shellfish Res. 14,301e306.
Chintala, M.M., Grassle, J.P., 2001. Comparison of recruitment frequency and growthof surfclams, Spisula solidissima (Dillwyn, 1817), in different inner-shelf habitatsof New Jersey. J. Shellfish Res. 20, 1177e1186.
Chu, C., 2009. Thirty years later: the global growth of ITQs and their influence onstock status in marine fisheries. Fish. Fish. 10, 217e230.
Dorn, M.W., 1998. Fine-scale fishing strategies of factory trawlers in a midwatertrawl fishery for Pacific hake (Merluccius productus). Can. J. Fish. Aquat. Sci. 55,180e198.
Dorn, M.W., 2001. Fishing behavior of factory trawlers: a hierarchical model ofinformation processing and decision-making. ICES J. Mar. Sci. 58, 238e252.
Friedland, K.D., Hare, J.A., 2007. Long-term trends and regime shifts in sea surfacetemperature on the continental shelf of the northeast United States. Cont. ShelfRes. 27, 2313e2328.
Ghertsos, K., Luczak, C., Dauvin, J.-C., 2001. Identification of global and local com-ponents of spatial structure of marine benthic communities: example from theBay of Seine (eastern English Channel). J. Sea Res. 45, 63e77.
Gilkinson, K.D., Gordon Jr., D.C., MacIsaac, K.G., McKeown, D.L., Kenchington, E.C.R.,Bourbonnais, C., Voss, W.P., 2005. Immediate impacts and recovery trajectoriesof macrofaunal communities following hydraulic clam dredging on Banquereau,eastern Canada. ICES J. Mar. Sci. 62, 925e947.
Gillis, D.M., Peterman, R.M., Tyler, A.V., 1993. Movement dynamics in a fishery:application of the ideal free distribution to spatial allocation of effort. Can. J.Fish. Aquat. Sci. 50, 323e333.
Gillis, D.M., Peterman, R.M., Pikitch, E.K., 1995a. Implications of trip regulations forhigh-grading: a model of the behavior of fishermen. Can. J. Fish. Aquat. Sci. 52,402e415.
Gillis, D.M., Pikitch, E.K., Peterman, R.M., 1995b. Dynamic discarding decisions:foraging theory for high-grading in a trawl fishery. Behav. Ecol. 6, 146e154.
Hancock, D.A., 1973. The relationship between stock and recruitment in exploitedinvertebrates. Rapp. P-v. R�eun.Cons. Int. Explor. Mer. 164, 113e131.
Haring, P., Maguire, J.-J., 2008. The monkfish fishery and its management in thenortheastern USA. ICES J. Mar. Sci. 65, 1370e1379.
Hennen, D., Jacobson, L., Tang, J., 2012. Accuracy of the Patch model used to estimatedensity and capture efficiency in depletion experiments for sessile in-vertebrates and fish. ICES J. Mar. Sci. 69, 240e249.
Jossi, J.W., Benway, R.L., 2003. Variability of Temperature and Salinity in the MiddleAtlantic Bight and Gulf of Mexico Based on Data Collected as Part of theMARMAP Ships of Opportunity Program, 1978-2001. NOAA Tech. Mem. NMFS-NE-172, 92 pp.
Kerr, L.A., Connelly, W.J., Martino, E.J., Peer, A.C., Woodland, R.J., Secor, D.H., 2009.Climate change in the U.S. Atlantic affecting recreational fisheries. Rev. Fish. Sci.17, 267e289.
Kim, Y., Powell, E.N., 2004. Surfclam histopathology survey along the Delmarvamortality line. J. Shellfish Res. 23, 429e441.
Levitan, D.R., 1991. Influence of body size and population density on fertilizationsuccess and reproductive output in a free-spawning invertebrate. Biol. Bull. 181,261e268.
Lipton, D.W., Strand, I.E., 1992. Effect of stock size and regulations on fishing in-dustry cost and structure: the surf clam industry. Am. J. Agric. Econ. 74,197e208.
Ma, H., Grassle, J.P., Rosario, J.M., 2006. Initial recruitment and growth of surfclams(Spisula solidissima Dillwyn) on the inner continental shelf of New Jersey.J. Shellfish Res. 25, 481e489.
MAFMC, 1986. Amendment #6 to the Fishery Management Plan for Atlantic Surf-clam and Ocean Quahog Fisheries. Mid-Atlantic Fisheries Management Council,Dover, Delaware, 102 pp.
MAFMC, 1988. Amendment #8 to the Fishery Management Plan for Atlantic Surf-clam and Ocean Quahog Fisheries. Mid-Atlantic Fisheries Management Council,Dover, Delaware, 142 pp.
Magnuson-Stevens Fishery Conservation and Management Act, August 31, 2012.Provisions; fisheries of the northeastern United States. Federal Register 53164Atl. Surfclam Ocean Quahog Fish. 77 (170), 53164e53167 (to be codified at 50C.F.R. pt. 648).
Marzec, R.J., Kim, Y., Powell, E.N., 2010. Geographic trends in weight and conditionindex of surfclams (Spisula solidissima) in the Mid-Atlantic Bight. J. Shellfish Res.29, 117e128.
McCay, B.J., 1984. The pirates of piscary: ethnohistory of illegal fishing in NewJersey. Ethnohistory 31, 17e37.
McCay, B.J., Brandt, S., Creed, C.F., 2011. Human dimensions of climate change andfisheries in a coupled system: the Atlantic surfclam case. ICES J. Mar. Sci. 68,1354e1367.
Meyer, T.L., Cooper, R.A., Pecci, K.J., 1981. The performance and environmental ef-fects of a hydraulic clam dredge. Mar. Fish. Rev. 43 (9), 14e22.
Miller, T.J., Blair, J.A., Ihde, T.F., Jones, R.M., Secor, D.H., Wilberg, M.J., 2010. Fish-Smart: an innovative role for science in stakeholder-centered approaches tofisheries management. Fisheries 35, 424e433.
Morello, E.B., Froglia, C., Atkinson, R.J.A., Moore, P.G., 2006. Medium-term impacts ofhydraulic clam dredgers on a macrobenthic community of the Adriatic Sea(Italy). Mar. Biol. 149, 401e413.
Munroe, D.M., Narv�aez, D.A., Hennen, D., Jacobson, L., Mann, R., Hofmann, E.E.,Powell, E.N., Klinck, J.M., 2016. Fishing and bottomwater temperature as drivers
of change in maximum shell length in Atlantic surfclams (Spisula solidissima).Estuar. Coast. Shelf Sci. 170, 112e122.
Munroe, D.M., Powell, E.N., Mann, R., Klinck, J.M., Hofmann, E.E., 2013. Underesti-mation of primary productivity on continental shelves: evidence frommaximum size of extant surfclam (Spisula solidissima) populations. Fish. Oce-anogr. 22, 220e233.
Myers, R.A., Bowen, K.G., Barrowman, N.J., 1999. Maximum reproductive rate of fishat low population sizes. Can. J. Fish. Aquat. Sci. 56, 2404e2419.
Narv�aez, D.A., Munroe, D.M., Hofmann, E.E., Klinck, J.M., Powell, E.N., Mann, R.,Curchitser, E., 2015. Long-term dynamics in Atlantic surfclam (Spisula solid-issima) populations: the role of bottom water temperature. J. Mar. Sys. 141,136e148.
NEFSC, 1999. Fishermen's Report Surfclam/ocean Quahog Cape Hatteras-Gulf ofMaine June 3-July 21, 1999. National Marine Fisheries Service Northeast Fish-eries Science Center, Woods Hole, Massachusetts, 16 pp.
NEFSC, 2002. Fishermen's Report Surfclam/ocean Quahog Delmarva Peninsula-Georges Bank June 3-July 12, 2002. National Marine Fisheries Service North-east Fisheries Science Center, Woods Hole, Massachusetts, 16 pp.
NEFSC, 2013. 56th Northeast Regional Stock Assessment Workshop (56th SAW)Assessment Report. Part A. Atlantic Surfclam Assessment in the US EEZ for 2013.NEFSC Ref. Doc. 13-10, 491 pp.
Peterson, C.H., 2002. Recruitment overfishing in a bivalve mollusc fishery: hardclams (Mercenaria mercenaria) in North Carolina. Can. J. Fish. Aquat. Sci. 59,96e104.
Powell, E.N., Bonner, A.J., Mann, R., Banta, S.E., 2003b. Evaluation of real-time catchand effort reporting in the U.S. Illex illecebrosus fishery. J. Northwest Atl. Fish.Sci. 32, 39e55.
Powell, E.N., Klinck, J.M., Ashton-Alcox, K., Hofmann, E.E., Morson, J.M., 2012. Therise and fall of Crassostrea virginica oyster reefs: the role of disease and fishingin their demise and a vignette on their management. J. Mar. Res. 70, 559e567.
Powell, E.N., Klinck, J.M., Munroe, D.M., Hofmann, E.E., Moreno, P., Mann, R., 2015.The value of captains' behavioral choices in the success of the surfclam (Spisulasolidissima) fishery on the U.S. Mid-Atlantic Coast: a model evaluation.J. Northwest Atl. Fish. Sci. 47, 1e27.
Rago, P.J., Weinberg, J.R., Weidman, C., 2006. A spatial model to estimate gear ef-ficiency and animal density from depletion experiments. Can. J. Fish. Aquat. Sci.63, 2377e2388.
Scavia, D., Field, J.C., Boesch, D.F., Buddemeier, R.W., Burkett, V., Cayan, D.R.,Fogarty, M., Harwell, M.A., Howarth, R.W., Mason, C., Reed, D.J., Royer, T.C.,Sallenger, A.H., Titus, J.G., 2002. Climate change impacts on U.S. coastal andmarine ecosystems. Estuaries 25, 149e164.
Weinberg, J.R., 1999. Age-structure, recruitment, and adult mortality in populationsof the Atlantic surfclam, Spisula solidissima, from 1978-1997. Mar. Biol. 134,113e125.
Weinberg, J.R., 2005. Bathymetric shift in the distribution of Atlantic surfclams:response to warmer ocean temperatures. ICES J. Mar. Sci. 62, 1444e1453.
Weinberg, J.R., Dahlgren, T.G., Halanych, K.M., 2002. Influence of rising sea tem-perature on commercial bivalve species of the U.S. Atlantic coast. Am. Fish. Soc.Symp. 32, 131e140.
Weinberg, J.R., Powell, E.N., Pickett, C., Nordahl Jr., V.A., Jacobson, L.D., 2005. Resultsfrom the 2004 Cooperative Survey of Atlantic Surfclams, pp. 1e41. NEFSCRef. Doc. 05e01.
Weninger, Q., Strand, I.E., 2003. An empirical analysis of production distortions inthe mid-Atlantic surf clam and ocean quahog fishery. Appl. Econ. 35, 1191e1197.
Xu, Y., Chant, R., Gong, D., Castelao, R., Glenn, S., Schofield, O., 2011. Seasonalvariation of chlorophyll a in the Mid-Atlantic Bight. Cont. Shelf Res. 31,1640e1650.