O~CFILE 1 I 0flC FILESL-TR-85-66 (Y) A LABORATORY STUDY OF ASPHALT Ln CONCRETE MIX DESIGNS FOR 0 HIGH-CONTACT PRESSURE AIRCRAFT TRAFFIC G.L. REGAN USAEWES GEOTECHNICAL LABORATORY P.O. BOX 631 VICKSBURG MS 39180-0631 JULY 1987 FINAL REPORT OCTOBER 1983 - JUNE 1986 " ,: APROVEDFOR PBLIC RELEASE: DISTRIBUTION UNLIMITED ENGINEERING & SERVICES LABORATORY AIR FORCE ENGINEERING & SERVICES CENTER TYNDALL AIR FORCE BASE, FLORIDA 32403
Transcript
O~CFILE1I0flC FILESL-TR-85-66
(Y)
A LABORATORY STUDY OF ASPHALTLn CONCRETE MIX DESIGNS FOR0
HIGH-CONTACT PRESSURE AIRCRAFTTRAFFIC
G.L. REGAN
USAEWESGEOTECHNICAL LABORATORYP.O. BOX 631VICKSBURG MS 39180-0631
JULY 1987
FINAL REPORT
OCTOBER 1983 - JUNE 1986 " ,:
APROVEDFOR PBLIC RELEASE: DISTRIBUTION UNLIMITED
ENGINEERING & SERVICES LABORATORYAIR FORCE ENGINEERING & SERVICES CENTERTYNDALL AIR FORCE BASE, FLORIDA 32403
NOTICE
PLEASE DO NOT REQUEST COPIES OF THIS REPORT FROM
HQ AFESC/RD (ENGINEERING AND SERVICES LABORATORY).
ADDITIONAL COPIES MAY BE PURCHASED FROM:
NATIONAL TECHNICAL INFORMATION SERVICE
5285 PORT ROYAL ROAD
SPRINGFIELD, VIRGINIA 22161
FEDERAL GOVERNMENT AGENCIES AND THEIR CONTRACTORS
REGISTERED WITH DEFENSE TECHNICAL INFORMATION CENTER
SHOULD DIRECT REQUESTS FOR COPIES OF THIS REPORT TO:
DEFENSE TECHNICAL INFORMATION CENTER
CAMERON STATION
ALEXANDRIA, VIRGINIA 2231i
I "'F" ' a
' I F~L~£~9N M MMIN '"j ,qF Nil v %X ' y .%y 'Ji r.F .w PI r'. _ " _X -7 '. 7 r 'W - *. ',-
A Laboratory Study of Asphalt Concrete Mix Designs for High-Contact Pressure AircraftTraffic
12. PERSONAL AUTHOR(S)
Regan, George L.13a. TYPE OF REPORT 13b TIME COVERED 14 DATE OF REPORT (Year, Month, Day) 15 PAGE COUNT
Final report FROM 10183 TO6/86 July 1987 13916. SUPPLEMENTARY NOTATION
Available from National Technical Information Service, 5285 Port Royal Road,Springfield, VA 22161-
17 COSATI CODES 18. SUBJECT TERMS (Continue on reverse if necessary and identify by block number)
FIELD GROUP SUB-GROUP Accelerated aging test CompactionM n2 Aircraft traffic Direct shear testI Asphalt concrete Gyratorv compaction (Continued)
19 ABSTRACT (Continue on reverse if necessary and identify by block number) , ,
This report documents a laboratory-based research effort to study the effects ofhigh-contact pressure F-4 and F-15 aircraft traffic in the 350-400 psi range on con-ventionally designed heavy-duty asphalt concretes. Specimens of mix were-prepared to cur-rent heavy-duty compactive effort (75 blow per side with an impact hammer) and four other
compactive efforts, using a modified gyratory compactor. The gyratory compactor was usedto roughly simulate high-contact pressure traffic on some of the mixes. Two aggregategradations recommended for high-pressure traffic were used to produce crushed limestoneaggregate blends. Two grades of asphalt cement, AC 20 and AC 40, and a Chemkrete@-
modified AC 20 asphalt cement were used as binders.
Heavy-duty mix selection criteria were used to bracket optimum mixes for supplementaltesting and analysis. Testing consisted of indirect tensile tests (dynamic and static),direct shear tests, accelerated aging tests, and unconfined creep tests. (Continued)
20 DISTRIBUTION/AVAILABILITY OF ABSTRACT 21 ABSTRACT SECURITY CLASSIFICATION
UNCLASSIFIEDIUNLIMITED E SAME AS RPT 0 OTIC USERS Unclassified22a NAME OF RESPONSIBLE INDIVIDUAL 22b TELEPHONE (Include Area Code) 22C OFF CE S%18' 1.
CPT MARTIN LEWIS (904) 283-6317 HO AFESC/RDCR
DD FORM 1473.8 4 MAR 83 APR edition may be used unil exhaust@d SEC-RITY C.ASSIFICAO% Or '- S 2AGEAll other editions are o0SOete Unclassified
18. SUBJECT TERMS (Continued).
Heavy-duty mix design Mix designsHigh-contact pressure Modified mix designIndirect tensile test Standard mix design
19. ABSTRACT (Continued).
!Results indicated that current heavy-duty mix selection criteria can be used, buthigher compactive effort is needed to prevent rutting and densification problems. Lowerasphalt content mixes were selected when higher compactive efforts were used.
Two modified methods of designing high-contact pressure asphalt concrete mixes werepresented. The preferred method is based on the use of a gyratory compactor at a highercompactive effort. The second method, an approximate method for use when a gyratoryvcompactor is not available, is based on use of the current 75-blow per side impact hammer.Several mixes were recommended for use in a field test at Tyrdall AFB, Florida..
"\ ; /St
PREFACE
This report was prepared by the Geotechnical Laboratory, USArmy Engineer Waterways Experiment Station, Vicksburg,Mississippi 39180, under Military Interdepartmental PurchaseRequests N-83-6-05, N-84-25, and N-85-2 for the Air ForceEngineering and Services Center, Tyndall Air Force Base,Florida.
This report summarizes work done between October 1983 andJune 1986. Captains John D. Wilson, George E. Walrond, andMartin D. Lewis were the HQ AFESC/RDCR project officers.
This report documents laboratory testing and thedevelopment of a modified mix design method for asphalticconcrete surfaces for very high contact pressures ofheavyweight F-15 aircraft.
This report has been reviewed by the Public Affairs Officeand is releasable to the National Technical Information Service(NTIS). At NTIS, it will be available to the general publicincluding foreign nationals.
This technical report has been reviewed and is approved forpublication.
M D. LEWIS, Capt, USAF ROBERT R. COSTI N, Lt Col, USAFProject Officer Chief, Engineer ngResearch
Division
GEORGE E. WALROND, Maj, USAF LAWRENCE D. HOKANSON, Col, USAFChief, Pavement Technology Director, Engineering and Services
A. OBJECTIVES ..................................................B. BACKGROUJND ................................................. I
1. General Design of Asphalt Mixtures .................... 12. Aggregate Gradations and Blends .. ........... 33. General Compaction Requirements for Pavement
Mixtures ............................................... 44. Specific Design of Surface Mixtures ................... 4
C. SCOPE ...................................................... 4
1. Materials ............................................ 42. Test Plan ........................-......... 6
II COMPACTION OF PAVING MIXTURES ....... ..... o.... ..... o, 8
A. LABORATORY COMPACTION METHODS ............................. 8
1. Theory of the Indirect Tensile Teat ...... o...........182. Static and Repetitive Load Tensile Testing... ....o...233. Equations Developed for this Study..... ............... 23
B.* DIRECT SHEAR TEST........................e- -so 25C. ACCELERATED AGING TEST.,...................................26
TABLE OF CONTENTS(CONCLUDED)
Section Title Page
D . CREEP TEST ................................................ 27
1. Deep-Seated Rutting in Lower Pavement Layers .......... 272. Shallow Rutting in Upper Pavement Layers .............. 28
V EQUIPMENT AND PROCEDURES ...................................... 30
A. MARSHALL AND GYRATORY TESTING ............................. 30B. INDIRECT TENSILE TESTING .................................. 30
C. SUPPLEMENTAL NONCONVENTIONAL TESTING: CHEMKRETEO-MODIFIED ASPHALT-CEMENT MIXES ............................. 78
1. Resilient Elastic Moduli .............................. 882. Direct Shear Data ..................................... 883. Creep Data ............................................. 88
VII CONCLUSIONS AND RECOMMENDATIONS ............................... 94
A. CONCLUSIONS ............................................... 94I
B. RECOMMeENDATIONS ........................................... 94
23 DIRECT SHEAR DATA SUMMARY (77 OF),CHEMKRETEO-MODIFIED MIXES ........................................ 91
viii
LIST OF TABLES(CONCLUDED)
Table Title Page
24 UNCONFINED CREEP DATA SUMMARY (77 OF),CHEMKRETE®-MODIFIED MIXES ........................................ 92
p.
ix(The reverse of this page is blank.)
SECTION 1
INTRODUCTION
A. OBJECTIVES
The objectives of this study were to investigate the effects of heavy-weight F-15 aircraft traffic with 350-400 psi contact pressures on propertiesof conventionally designed airfield asphalt concrete surface mixes and todevelop a modified mix design procedure to optimize the behavior of mixes sub-jected to these nontypical types of traffic.
B. BACKGROUND
Increased or expanded use of aircraft such as the F-4 or F-i5 will lead toincreased aircraft gear loads and increased tire contact pressures that mustbe resisted by an airfield pavement. Anticipated aircraft pressures up to400 psi must be resisted by the pavement surface and efficiently transferredto lower pavement layers in a manner that will provide maximum pavement lifeand good performance.
Asphalt concrete hot mix, designed with the aid of the Marshall Method,has provided satisfactory surfaces for airfield runways for many years. How-ever, in the past, tire contact pressures have not generally exceeded 250 psi.As a result, current mix design methods for surface mixes may be limited bytheir empirical nature. Thus, there is a need for an evaluation of currentempirical methods of mix design, and consideration should be given to modifi-cations based on more fundamental engineering characteristics.
Fundamental mix properties based on weight-volume relationships, an under-standing of compaction behavior, and the use of supplemental testing, based ontheoretically founded analysis, should provide a sound engineering basis forselecting an adequate surface course mix. Current practice includes the useof Marshall stability and flow measurements, along with voids total mix, voids
*;filled with asphalt, and total unit weight, to select a design mix. Use ofcurrent heavy-duty design criteria in conjunction with present standard corn-pactive efforts in designing mixes to support very-high-contact pressures,outside current experience, may not provide sound, strong, and durablesurfaces.
1. General Design of Asphalt Mixtures
* The overall design process for asphalt pavement layers is basically acompromise to optimize several basic mix characteristics. Reference 1 and
* Table I summarize some of the mix properties and the desirable control proper-ties. General properties of interest include stability, tensile strength,durability, fatigue resistance, permeability or imperviousness, skid resis-tance, and flexibility.
a. Stability is commonly defined as resistance to deformation underload. This includes nonrecoverable deformations from both vertical ruttingand plastic movement in the longitudinal and lateral directions. Typically,
TABLE 1. CHARACTERISTICS TO OPTIMIZE MIXTURE PROPERTIES (FROM REFERENCE 1).
Levels of mix variablesDesirable Bitumen Aggregate Degree of
mix property content gradation compaction
Stability Low Dense High
Durability High Dense High
Flexibility High Open ----
Fatigue resistance High Densea Highb
Skid resistance Low Dense cHighor open
Imperviousness High Dense High
Tensile strength High Dense High
a Assuming a heavy-duty, comparatively thick layer of bituminous concrete.
b Although compaction is not normally indicated for this property, it isimplied to ensure that aggregate particles will not dislodge.
c Both types of gradations have goad skid-resistance characteristics.What appears to be more important is the texture of the aggregate particles.
stiffness of the asphalt cement dominates the stability behavior at low tem-peratures and frictional resistance of the mix dominates at highertemperatures.
b. Tensile strength is the maximum strength the mix can develop whensubjected to tensile forces. High tensile strength is most important at lowtemperatures or in situations where underlying pavement layers can change vol-ume and generate tensile forces in the surface layer.
c. Durability can be defined as a resistance to wear and weathering.Wear includes abrasive traffic action on the aggregate and the asphalt. Wea-thering includes changes to the asphalt cement from volatile losses and oxida-tion and the effects of water action on the mix.
d. Fatigue resistance, which is the ability of a paving mixture towithstand repeated loadings, has been studied by many pavement researchers.It is not considered to be of primary interest in this study because of theanticipated relatively low volumes of traffic for fighter aircraft. Althoughfatigue resistance is secondary to pavement stability, it will affect mixperformance at very high traffic volumes.
e. Permeability of a dense asphalt concrete mix is intended to be lowbecause it is designed to perform a waterproofing function. For low perme-ability, a mix should have similar properties to those necessary for gooddurability. Conversely, high mixture permeability is sometimes desirable
to prcvide good skid resistance during wet weather. Porous friction surfacesare examples of highly permeable pavement mixes.
f. Skid resistance is generally ensured by providing those thingsnecessary for stability behavior. These necessities include the use of hard,wear-resistant, crushed aggregates and relatively low asphalt contents to pro-vide sharp surface points of contact.
g. Flexibility is the ability of the surface course mixture to con-form to long-term changes or movements in underlying components. Thesechanges can be a result of settlement, shear, or differential traffic-inducedcompaction of deeper layers.
All the preceding mix properties depend on certain key mix variables.As indicated in Table 1, these are asphalt content, aggregate gradation, anddegree of compaction.
2. Aggregate Gradations and Blends
Aggregate gradations for asphalt concrete mixes are generally blendsof two or more stockpiled aggregates. Mostly crushed, well-graded aggregateblends are required for airfield surface mixes.
Technical Manual (TM) 5-822-8/AFM 88-6, Chapters 2 and 9 (Refer-ence 2), contains recommended gradations for asphalt mix to be subjected tolow and high tire pressure. Low-pressure applications include those for ordi-nary traffic with contact pressures up to 100 psi. When pressures exceed100 psi (as with aircraft, tracked vehicles, or vehicles with solid tires),the high tire pressure gradations are recommended. Choice of maximum aggre-gate size is a function of final layer thickness, availability of aggregates,and other considerations. As a general rule, the maximum aggregate sizeshould not exceed one-half of the compacted layer thickness.
These recommended gradations are also based on limited amounts ofmaterial passing the Number 200 screen (-200 material). For all high pressureapplications, the range of -200 material is limited to 3-6 percent by weight.The purpose of this limitation is to ensure that a stable, durable mixture isobtained. High amounts of -200 material result in the mixture having a lowerasphalt content leading to higher stability and lower durability. Low amountsof -200 material result in the mixture having a higher asphalt content leadingto lower stability and higher durability. Thus, the amount of -200 materialmust be controlled to ensure satisfactory stability and durability.
Current Asphalt Mix Guide Specification (CEGS-02556) (Reference 3)limits the total amount of natural sand to 15 percent by total weight in mixesfor heavy-duty applications. The natural sand particles are assumed to berounded. Since strength and aggregate interlock are necessary in surfacemixes, this limitation on rounded sand helps maintain a high degree of physi-cal stability to the aggregate matrix.
3
ig
Ig fl
3. General Compaction Requirements for Pavement Mixtures
The term "compaction" can be defined in very general terms as the pro-cess of applying energy to a mass to decrease its volume. In paving mixtures,especially asphalt concrete surfaces, compaction is required to provideadequate shear strength, prevent further significant densification under traf-fic, prevent excessive hardening of the asphalt cement due to oxidation, andprovide an essentially waterproof layer to protect underlying pavement layers(Reference 4).
4. Specific Design of Surface Mixtures
A surface mix is designed to perform the preceding general functionsand to meet specific design criteria, based on anticipated service require-ments. Essential steps in the design process are:
a. Selection of the proper aggregate gradation.
b. Laboratory production and compaction of several mixes at an ade-quate compactive effort, resulting in a density equal to that which will beobtained in the field under traffic. Mixes are prepared and compacted tostudy the general behavior of mixes as a function of asphalt content.
c. Analysis of compacted mix properties.
d. Supplemental testing of mixes as required to satisfy specific de-sign criteria. With the Marshall Method of design, these tests include Mar-shall stability and flow measurement at 140 *F for mixes made with asphaltcements.
e. Utilization of results from Steps b-d to select an optimum asphaltcontent and design density.
C. SCOPE
The scope of this study was limited to laboratory mix production, testing,and analysis of the generated data. Conventional Marshall procedures andempirical mix design criteria were summarized and examined in the investiga-tion. Nonconventional test background and procedures were also summarized andused to develop data on several mixes. Indirect tensile tests (static anddynamic), accelerated aging tests, direct shear, and unconfined creep testswere performed on mixes produced at five compactive efforts, including the75 blow per side effort for high tire pressure and four levels of gyratorycompaction, with two aggregate gradations and three types of asphalt cement.
1. Materials
This investigation was conducted using all crushed limestone aggre-gate, an AC 20 grade asphalt cement supplied by Tyndall Air Force Base (AFB),Florida, AC 40 asphalt cement from the US Army Engineer Waterways ExperimentStation (WES) stock, and a ChemkreteO-modified AC 20 asphalt cement.
4
a. Aggregate Gradation
Aggregate was separated by sieve sizes and blended to obtain twogradations recommended for heavy-duty high-pressure applications (Refer-ence 2). Table 2 and Figure I show the gradations used. One was a 3/4-inch
TABLE 2. AGGREGATE GRADATIONS AND SPECIFIC GRAVITY.
SpecificationsaUS standard 3/4-Inch 1-Inch Gradations usedsieve size range range 3/4-Inch 1-Inch
a From TM 5-822-8/AFM 88-6, Chapters 2 and 9 for high-pressure applica-
tions (Reference 2).
AGGREGATE GRADING CHARTSCftCCN OPONWN6 IN INCNCS
AWEG A G
6 Cl GA |l 70
ski
0
1 4 /4 4 6 0 0 40 so so I zoSC(C-N i i iN
Figure 1. Limestone Aggregate Gradations.
5
W
maximum size gradation representing the middle of the 3/4-inch band for 4
airfields; the other was a 1-inch maximum size gradation representing thecoarse extreme of the 1-inch band.
b. Asphalt Cement and Modifier
Table 3 provides a summary of asphalt properties. The AC 40 wasincluded in the study to provide relative comparisons of the effects of vis-cous and less viscous asphalt cement on mix behavior. To produce mixes withChemkrete®, a commercial proprietary asphalt modifier was mixed with AC 20asphalt cement in a series of tests to observe the effect of this modifier on
TABLE 3. PROPERTIES OF ASPHALT CEMENTS.
Property ASTM Method AC 20 AC 40
Penetration - 77 °F (25 *C), 100g, D 5 75 565 sec, 0.1 mm
Specific gravity - 77 *F (25 °C) D 70 1.032 1.040
Ductility - 77 °F (25 °C), cm D 113 150+ 150+
Viscosity140 *F (60 °C), poises D 2171 2,102 4,506225 °F (107 °C), centistokes D 2170 2,170 3,908275 °F (135 *C), centistokes D 2170 423 704
Flash point, *F D 92 575 ---
Solubility, percent D 2042 99.55 ---
Thin film oven loss, percent D 1754 0.434 0.147
Residual penetration 77 °F(25 *C), 100 g, 5 sec, 0.1 m D 5 52 38
Viscosity - 140 °F (60 *C), poises D 2171 --- 11,348225 °F (107 °C), centistokes D 2170 3,505 6,553275 OF (135 *C), centistokes D 2170 558 1,018
Ductility - 77 °F (25 °C), cm D 113 --- 119
mix behavior. Table 4 summarizes properties of Chemkrete®, as given in themanufacturer's literature.
2. Test Plan
Asphalt mixtures made with the previously discussed materials weretested according to a test plan that was divided into three phases:
a. Phase 1 - Preliminary Mix Properties and Test Results
Impact and gyratory compaction methods were used to produce sev-eral levels of effort on mixes made with the three asphalt cements and both
6
'Ile
TABLE 4. CHEMKRETE® ASPHALT MODIFIER a DATA (1984 MANUFACTURER'S LITERATURE).
Property Typical value
Physical
Specific gravity, 60 *F 0.97
Viscosity, centistokes104 OF 40
212 OF 7275 OF 4
Flash pointPensky-Martens closed cup, OF 356
Pour point, OF 22
Chemicala
Manganese, percent weight 2.0-2.5
aAn oil-based soap containing manganese in liquid form.
aggregate gradations. Typical mix data were developed by compaction at fiveefforts--four gyratory compactive efforts and one impact hammer effort
(75 blow per side). Asphalt contents were increased in 0.50-percent incre-ments and the average of three specimens was used for each data point orproperty.
b. Phase 2 - Selection of Optimum Asphalt Contents and Production ofSpecimens for Nonconventional Testing
Optimum asphalt contents were chosen based on current mix design
criteria for high-pressure mixes. Nonconventional tests were planned for
mixes with asphalt contents in the vicinity of selected optimums. Asphalt
contents selected were chosen to bracket optimums by 0.50 percent (optimum±0.50 percent). Mixes were made using the five previous compactive efforts.
c. Phase 3 - Nonconventional Testing
Basic nonconventional testing included indirect tensile tests
(static and dynamic), direct shear tests, unconfined creep tests, and acceler-ated aging tests on 4-inch diameter by 2-1/2-inch-high disc-shaped specimensof mix.
The overall plan was to analyze results from the three phases andrecommend mix design requirements for asphalt surface mixes to resist350-400 psi contact pressure traffic. Mixes that appear adequate will be
evaluated in a full-load, accelerated-traffic test area by the Air Force Engi-
neering and Services Laboratory, Tyndall AFB, Florida.
7
SECTION II
COMPACTION OF PAVING MIXTURES
Asphalt mixtures must be compacted to produce the properties necessary forgood pavement service life. A pavement is initially compacted during con-struction. However, additional densification can occur because of traffic.For military airfields, the current standard for heavy-duty asphalt pavementsrequires a minimum field compactive effort of 98-100 percent of the laboratorydensity obtained using 75 blows per side.
A. LABORATORY COMPACTION METHODS
Current methods of asphalt concrete paving mix design are based on the useof mold-confined laboratory-compacted specimens. Generally, disc, cylindri-cal, or beam specimens are produced. Three common methods of laboratory com-paction include impact compaction, gyratory compaction, and kneadingcompaction.
1. Impact Compact.on
Impact compaction is done with a 10-pound sliding hammer raised anddropped 18 inches onto a baseplate, slightly smaller than the 4-inch insidediameter of a 3.4-inch-high Marshall compaction mold. The weight is eithermanually or mechanically moved to compact an asphalt mix inside the mold.Both faces or sides of the asphalt mix are compacted. Hammer impacts forcethe mix into a denser state. Disc-shaped specimens with 4-inch diameters andapproximate 2-1/2-inch heights are generally produced with this method. Asummary of development of this method can be found in References 5 and 6. I
2. Gyratory Compaction
Gyratory compaction methods usually apply normal forces to both topand bottom faces of the asphalt mix confined in cylindrical-shaped molds.Normal forces are supplemented with a rocking or gyrating motion to work themix into a denser configuration while totally confined. The Texas Highway De-partment (Reference 7) and the US Army Corps of Engineers (References 8-10)have developed methods, procedures, and equipment using this compactionmethod. The inside diameter of the molds are either 4 or 6 inches; compactedspecimens can be either cylindrical or disc-shaped.
3. Kneading Compaction
Kneading compaction methods generally apply forces to a portion of afree face of an otherwise confined asphalt mix. Compactive forces are applieduniformly around the free face. The partial free face allows particles tomove relative to each other, creating a kneading action that densifies themix. This method was devised by the State of California Materials and Re-search Laboratory.
% % rz?-a..rr. ~r 6-V'
B. GENERAL COMPACTION BEHAVIOR OF PAVING MIXTURES
Compaction behavior of geotechnical materials is generally expressed in adensity-fluid content curve. When working with paving mixtures, a density-asphalt content plot is generated. Individual densities can either be shownin terms of total mixture or aggregate only unit weight. The relationship be-tween the two densities is:
ag = y(100 - AC)/100 (1)
where
Yag aggregate density, pcf
7- total mix density, pcf
AC - asphalt content in percent (i.e. 4 percent - 4.0), defined as weightof mix.
For a given compactive effort, compaction behavior across a range of as-phalt contents can be analyzed with the aid of a generalized cubic or third-order regression model
Yag + a (AC) + a2 (AC)2 + a3 (AC)
3 (2)
where ao, al, a 2, a 3 are regression constants.
Differentiating Equation (2) and setting it equal to zero allows the de-termination of asphalt contents where aggregate density is either a maximum orminimum value; the following equation allows determination of those asphaltcontents.
-a + a2 - 3a aAC 2 (3)3a3
Two solutions are found from this equation; each represents one of threepossible conditions: (1) An asphalt content at a relative minimum aggregatedensity, (2) An asphalt content at a relative maximum aggregate density, or(3) An asphalt content that is higher or richer than that required for maximumaggregate density. An overly rich asphalt content may be computed if initialcompaction data is more representative of a parabolic or second-order compac-tion curve.
Similarly, the volume of voids in the mineral aggregate (VMA) (same asporosity in soil terminology) is also an indicator of relative maximum andminimum aggregate density. From the fundamental relationships of Table 5, the
volume of voids in the aggregate matrix, as a decimal fraction of total vol-ume, is
VMA - 1 - ag (4)Gsy w
9
I 00
w-L 00 c
0.4 0 4. - .to 00000
z UI. I cc 0H H
41 -. 0
c0 4.i
u 00 u0 u cC
CD uU cc a ccw 4 w 40 s50 0 csw 0o
a- cc 30r 4.4 00e 4.0-c A ;0 ? cco &
1 00 1 1
x-z- - x
04
- @2 W
o- -+2
4-4 .IUD ""G I
- 0C C ?-0 0
4%. 0-A
1 0 &@2
0 0- ~ Ua0 ? 0 -?. - I a2
@.200 0 -0 0j >0
00 -r4 "4. w L"08 %6-d C - 0C u-
O-4 -4 4. 4) eJld
(A m2 0 C K C
CC U~~ CC 0 y
- .
Differentiating with respect to asphalt content gives
d(VMA) G1 w d(y a (5)d_(AC) - Gy
Figure 2 and Equation (5) show that, as AC increases, the volume of poresin the mix decreases on the lean side of maximum aggregate density. At maxi-mum aggregate density, there is no change in the volume of total voids for anincremental change in asphalt content. As the asphalt content increases be-yond the point of maximum density, asphalt begins to interfere with compactionof the aggregate particles. Asphalt displaces aggregate particles and causesthe volume of voids in the aggregate matrix to increase on the rich side ofthe aggregate density curve.
AGGREGATE VOIDS IN THE MINERALDENSITY AGGREGATE
I I III I I II AC. ASPHALT CONTENT•I,, II I
LEAENNRICH1LEAN RICH_III I
+ +d (VMA) 1
d(AC) d(C
I iIIIFigure 2. General Compaction Behavior of Paving Mixtures.
a.I
L11
SECTION III
MIX DESIGN METHODS, CRITERIA, AND ANALYSIS
A. MARSHALL MIX DESIGN METHOD
Currently, within the Department of Defense, the Marshall Method is usedto design asphalt concrete hot mixes for aircraft usage. Bruce Marshall ofthe Mississippi State Highway Department developed a procedure during the1930s that was later modified by the Corps of Engineers into its present form.Modifications or changes to the original procedure were made based on per-formance under aircraft traffic conditions. The Marshall Method is empiricaland based on past experience. Guidance on the method is given in TM 5-822-8/AFM 88-6 Chapters 2 and 9, and Military Standard 620A (References 2 and 11).
1. Impact Hand Hammer
Two levels of laboratory compactive effort are used with an impacthand hammer. Both are based on the 10-pound manually operated hammer (impactcompaction) with an 18-inch fall. The first level of effort is used in de-signing mixtures for traffic with low-pressure tires such as streets and park-ing areas subject to traffic contact pressures up to 100 psi. It consists of50 blows on each face of a representative sample of asphalt concrete mix. Thesecond level of effort uses 75 blows on each face of a sample, and is used fordesigning asphalt mixes where contact pressures exceed 100 psi, up to a maxi-mum of about 250 psi. Aircraft pavements are typically designed with the75 blow per side compactive effort.
2. Gyratory Compactor
A second method of laboratory compaction that can be used for Marshallmix design is gyratory compaction. Equipment and procedures were developed atWES. With this procedure, an asphalt mix is placed in a steel mold, put intothe gyratory compactor, loaded to a preselected normal pressure which repre-sents the anticipated contact pressure and gyrated through an angle of I de-gree for a number of revolutions of the roller assembly (Figure 3). MilitaryStandard 620A (Reference 11) has suggested equivalency of the following typesof compaction and compactive efforts.
Gyratory Compaction Impact Compaction
100 psi, 1-degree angle, 30 revolutions 50 blow per side
200 psi, 1-degree angle, 30 revolutions 75 blow per side
After specimens have been compacted at various asphalt contents, fun-damental average weight-volume properties are determined for each asphalt con-tent. Properties include density, air voids in the mix, voids filled with as-phalt, and sometimes voids in the mineral aggregate. Specimens made withasphalt cements are heated to 140 *F in a water bath before performing Mar-shall stability and flow testing with a Marshall compression machine. Maximumload is recorded as the Marshall stability, and the amount of specimen defor-mation, in hundredths of an inch, is recorded as the flow.
12
ROLLER ASSEMBLIES ROTATEABOUT THIS AXIS
5,cl*
1 t
S'-GYRATOR MOTION
,-MIXTURE BECOMES
U UNSTABLE
GYRATIONANGLE
NUMBER OF REVOLUTIONS!
Figure 3. Schematic of the Gyratory Compactor.
Criteria used to determine optimum or design asphalt contents for
mixes made with either compaction method are summarized in Tables 6 and 7.
B. GYRATORY MIX DESIGN METHOD
The gyratory method of mix design is documented in Method 102 of MilitaryStandard 620A (Reference 11) and ASTM Method D3387 (Reference 12). Thismethod's procedure is simple and does not require many computations to deter-mine a design asphalt content; it is based on indicated mix stability as shownby the gyrograph trace of mix behavior during compaction.
The mix is placed into a mold, a confining pressure equivalent to that ex-pected by traffic is applied to the mix, and it is compacted by rotating the
13
TABLE 6. DESIGN CRITERIA FOR USE WITH ASTM APPARENT SPECIFIC GRAVITY.
A. PROCEDURE FOR DETERMINING OPTIMUM BITUMEN CONTENTPoints o uv
Marshall 500 lb or 1,800 lb orstability higher higher
Total unit Not used Not usedweight
Flow 20 or less 16 or less
Percent voids 3-5 3-5total mix
Percent voids 75-85 70-80filled withbitumen
aFor use with aggregate blends showing water absorption up to
2.5 percent.
14
TABLE 7. DESIGN CRITERIA FOR USE WITH BULK<-IMPREGNATED SPECIFIC GRAVITY.
A. PROCEDURE FOR DETERMINING OPTIMUM BITUMEN CONTENT
Points on curve50 Blows 75 Blows
Test property normal-duty heavy-duty
Marshall Peak of curve Peak of curvestability
Total unit Peak of curve Peak of curveweight
Flow Not used Not used
Percent voids 3 3total mix
Percent voids 85 80filled withbitumen
B. PROCEDURE FOR DETERMINING SATISFACTORINESS OF MIX
Criteria50 Blows 75 Blows
Test property normal-duty heavy-duty
Marshall 500 lb or 1,800 lb orstability higher higher
*Total unit Not used Not usedweight
Flow 20 or less 16 or less
Percent voids 2-4 2-4total mix
Percent voids 80-90 75-85filled withbitumen
a For use with aggregate blends showing water absorption greater than
2.5 percent.
15
roller assembly through 30 revolutions. As the mix is compacted, a gyrationgraph is generated by the compactor. This graph is used to indicate the re]-ative stability behavior of the mix during compaction.
When the gyrograph spreads or widens during mix compaction, the mix isindicated as unstable (Figure 4). However, if it does not spread, the mix isindicated as stable under given conditions of compaction. The gyrograph showsthe response of the mix to the compactive effort induced by the compactor.From the gyrograph trace, the ratio of final width to intermediate width iscalled the gyratory stability index (GSI). Most mixes show this unstable be-havior or widening of the gyrograph on the rich or more saturated side of theaggregate density-asphalt content curve. The amount of asphalt in the mixtureis so high that all applied external forces are resisted by the asphalt, caus-ing plastic deformation of the sample.
The design asphalt content is simply the maximum asphalt content where themix has a GSI value of 1.0 (stable behavior). Design density is also given bythe stable mix with the highest asphalt content.
C. GYRATORY COMPACTION: ANALYSIS OF TRAFFIC-INDUCED DENSIFICATION
Two studies (References 13 and 14) and many WES analyses of airfieldasphalt concrete performance have indicated that 200 psi gyratory compactioncan reasonably approximate mix densification under traffic. However, thesestudies were based on aircraft traffic that seldom exceeded 250 psi contactpressures and used mixes that were designed and constructed to 75 blow perside or high-pressure tire mix design.
An early study of the effects of B-52 aircraft traffic on surface coarsemixes used the WES-developed gyratory compactor to help analyze traffic-induced densification (Reference 13). Surface mixes were designed and con-structed using 75 blow per side compactive efforts. Full-load, full-scaletraffic was applied to several test areas at contact pressures ranging from220-290 psi. The comparison of before- and after-traffic density data showedthat traffic had further densified the mixes. Data also indicated that gyra-tory compaction at 200 and 300 psi normal pressures produced mix densitiesthat were close to after-traffic densities in the traffic areas.
A later study of in-service pavements examined the effects of T-38 air-craft traffic on asphalt concretes (Reference 14). Core samples of pavementwere removed from 23 taxiways at several Air Force bases where T-38 trainingaircraft, with 240 psi contact pressures, provided most of the traffic. Gyra-tory recompactions of core samples were found to produce densities similar tothose of the traffic-densified mixes. The recompactions were performed onsamples that had been heated to approximately 250 °F and then compacted in agyratory compactor set at 200 psi normal pressure, 1-degree gyration angle,and 30 revolutions of the machine.
16
I
' ' ]
ISO
IIII
30 as M~ CO.0 N i-S &0RC&N
Figure 4. Gyrographs and Effects of Increased CompactiveEffort with the Gyratory Compactor.
17
Ky VIA g
SECTION IV p
SUPPLEMENTAL TESTS: BACKGROUND, THEORY, AND EQUATIONS
The stability and flow tests used with the Marshall Mix Design Method are-empirical. Recently, tests have been developed and are being used by engi-neers to determine more fundamental properties of geotechnical constructionmaterials and pavement mixes. Several tests were considered for this study;however, the list was reduced to the following as fundamental indicators ofmix elasticity, strength, durability, and rutting potential:
*Indirect Tensile Test.
*Direct Shear Test.
*Accelerated Aging Test.
*Creep Test.
A. INDIRECT TENSILE TEST
The indirect tensile test is a tool used by geotechnical and structural .
engineers to compute fundamental properties of materials. Reference 15 pro-vides a comprehensive general summary of the test. References 16-19 providespecific equations for application of the test to asphalt concrete mixes andmaterials. ASTM methods C 496 and D 4123 provide guidance on testing concreteand bituminous mixes, respectively (Reference 12).
In 1953, a procedure for indirectly determining tensile strengths of mate-rials was developed simultaneously in both Brazil and Japan (Reference 15). Acylinder of material is placed horizontally between two plane-loading sur-faces; load is applied to the specimen across its diameter until the materialsplits or fails in tension. Since its development, this procedure has beenused to test concrete, soils, cement-stabilized materials, and asphalt con-crete materials. Figure 5 illustrates the basic test arrangement.
1. Theory of the Indirect Tensile Test
Mathematical analyses of stresses and strains within a circular disc
of material, loaded across its diameter, have been studied by many people. In1883, Hertz first examined the problem; Frocht, Timoshenko and Coodier,IMuskhelishvilli, and Hondros also contributed to the analysis (Reference 17).
Hondros's contribution has been used since the 1960s to analyzecement-stabilized materials and asphalt concretes (References 16 and 17). Hiswork showed that both plane stress and plane-strain conditions can be given byone set of equations for stresses across vertical and horizontal diameters of
aspecimen with a circular cross section. Compressive loads are applied toIthe specimen in the vertical direction along a diameter. The center of thespecimen, intersecting vertical and horizontal diameters, is the origin of thecoordinate system. From Reference 18, Hondros's equations were summarized asfollows.
18
wi I N'iI inRlarfl J .MM kno mmxw = ON IIM19Mxmwt A W
p
LOADING STRIP
SPECIMEN
-FAIL URE* SURFACE
p
Figure 5. Schematic of the Indirect Tensile Test.
19
a. Stress along the Vertical Diameter
a 2P (1 - r 2/R 2) sin 2a0ey at [i-(2r 2/R 2 coB 2a + r 4/R 4]
-tan- (+ r R tan a] (6)
I~ 22
-2P (1I r 2/R 2) sin 2a0ry - rat [i- (2r 2/R 2) cos 2ax + r 4 /R 4
+ tan- +( r- r2/R 2) tan a (7)
Te r6o (8)
b. Stress along the Horizontal Diameter
--2P (1 - r 2/R 2) sin 2aOex r7rat II+ (2r 2 /R 2) cos 2a + r 4/R 4]
+ tan- [(1 r2/2)tan a] (9)
2P (1 - r 2/R 2) sin 2a0rx -irat [1 +- (2r 2/R 2) cos 2a + r 4/R 4]
- tn- [1 -r /R 2) tan all10- a 1+ r 2/R 2)(0
T O (01
20
where
ay - tangential stress along the y or vertical axis
P - applied load
a - load strip width
t = specimen thickness or height
r - radial distance from specimen center
R = radius of specimen
- radian measure of angle due to loading strip
aR
a -radial stressry
- shear stresses along principal planes (vertical and horizontaldiameters)
oex - tangential stress along the x or horizontal axis
a - radial stressrx
Figure 6 shows these typical stresses and their distribution on hori-zontal and vertical principal axes; stresses shown on the figure are one-halfof the actual values.
For disc-shapes such as those of Marshall specimens, plane stress con-ditions apply; that is, there is no applied stress in the Z or thicknessdirection. From the theory of elasticity, the following strain equations aretrue for this geometry.
1, (o - u) (12)x= E rx OX)
ry Vy) (13)
Rearranging the equations and integrating along the diameters gives
Figure 6. Stress Distribution along Principal Axes of Specimen duringIndirect Tensile Test (Stresses Shown are One-Half ofActual Values).
22
4, W I-
E - ( ar dr - u a a~dr (15)H = ry ey
where
E - strain in the x or horizontal axisx
E = modulus of elasticity or Young's modulus (in either thex- or y-direction)
u = Poisson's ratio
= strain in the y or vertical axisY
H - horizontal diameter deformation during testing
2. Static and Repetitive Load Tensile Testing
The indirect tensile test is performed in either a static or repeti-tive mode. The static mode is performed by increasing the applied load untilthe specimen fails in tension. From the static test, the tensile stress iscalculated at the maximum load and the tensile strength is defined as thetensile stress at this maximum or failure load. Similaily, the static modulusof elasticity is found by using failure conditions.
The resilient test mode provides estimates of resilient moduli ofelasticity when loads from 10 to 50 percent of the splitting load are applied.Figure 7 shows how loads and deformations are determined from recorded data.The total resilient modulus is based on an applied load and deformationsoccurring during loading. The instantaneous resilient modulus is based onresilient deformations that occur on unloading or on instantaneous rebound ofthe specimen.
3. Equations Developed for this Study
Numerical integration of Equations (14) and (15) and other mathemati-cal operations produce the following approximate equations for 4-inch-diameterMarshall specimens loaded with a strip 1/2 inch wide (R = 2 inches anda - 1/2 inch).
23
N l-'4) W ? # ? P O .
TIME
LOAD-TIME PULSE
aDURATION OF LOADING DURING ONE LOAD CYCLEb - RECOVERY TIMEc - CYCLE TIME
TIME
HORIONAL DEFORMATION VERSUS TIME
FiueloeiletIdrc TnieTae
Fig ~ n Maurem iin et (Rfene 12).e
24
E - -3. 54 ( Lt) (16)
u - -3.55 (E -0.27 (17)
at 0.156 (Et) (18)
G - 0.474 (19)~ ()
where
V - vertical diameter deformation during testing
a - tensile stress at the specimen center when loaded to failure* t
a - compressive stress at the specimen centerc
U, t, P, E, and H have been previously explained in this section
Equations (16) and (17), the Young's modulus, and the Poisson ratioequations developed for this study can be used for both resilient and statictesting. These equations are not the same as those recommended in ASTM D 4123and Reference 19. They are similar, however, to those used at Purdue Univer-sity.* Equations (18) and (19) are the familiar equations for tensile andcompressive stresses at the center of the specimen.
B. DIRECT SHEAR TEST
Direct shear tests, although routinely performed on materials such assoils and rock, are not common in asphalt pavement work. Generally, eachspecimen is placed in a shearing apparatus, a normal load is applied to thespecimen, and the specimen is sheared. The normal and shear loads and sheardeformation are recorded. Loads are converted into average stresses by divid-ing by contact area.
For this study, shear testing was performed on Marshall sized specimens ofasphalt mix. All specimens were disc shaped with diameters equal to 4 inchesand approximate heights of 2-1/2 inches.
Equations used for this testing were as follows:
ST - (20)
iTR
* Personal communication between E. R. Brown of WES and Professor LeonardWood of Purdue University, March 1985.
25
Y N (2 1)rR2
where
T shear stress on the failure plane
S = maximum shearing load
R = specimen radius
a = normal stress on the failure plane
N - normal load on the test specimen
C. ACCELERATED AGING TEST
Asphalt mixes age or harden with time after exposure to the environment.Actually, the asphalt cement ages from loss of volatiles, exposure to sun-light, and other natural forces. In a previous study (Reference 20), anaccelerated aging test was developed for laboratory use on mixes either tosupplement conventional Marshall mix designs or to aid in selecting an asphaltcement providing better resistance to age hardening. An asphalt cement main-taning a high percentage of its unaged consistency, after aging, isdesirable.
The penetration test (ASTM D5) performed on recovered aged asphalt was thebasis for determining damage caused by aging. As shown in Figure 8, asphaltcement has a known or identifiable penetration when delivered from a refinery.Heating and mixing with aggregate causes a loss in penetration or hardening.After pavement construction, environmental forces cause additional hardening
PORIG "4HARDENING FROM HEATING & MIXING - PORIG - PMIX
0 MIX
HARDENING FROM AGING- PIMIX - PAGE
IWzUjC.
SPAGE
I-I
I I.
MIX AGE/EXPOSURE TIME
Figure 8. Asphalt Hardening as a Result of Age.
26
W, R % .A Lk
0e z?,L4-L " .Si- r 4
or aging. At varying times after pavement construction, this aging can benoted by decreasing values of asphalt penetration.
Figure 9 illustrates the use of a ratio of asphalt penetrations to showchanges in asphalt mix durability with environmental exposure. The durabilityindex is a ratio of asphalt penetration after accelerated aging to its origi-nal unaged penetration. The figure shows that this accounts for the constantheating and mixing penetration loss which is a function of mix prod,,ction, anda variable aging loss which is a function of exposure conditions afterconstruction.
1.0 1 PORIG PMIX PMIX
HEATING & MIXING COMPONENT = * 1 - -- - - - t P ORIG PORIGX
~PMIX - PAGE
w
IDURABILITY PAGEI INDEX = OPORIG
I-I
MIX AGE/EXPOSURE TIME
Figure 9. Asphalt-Hardening Indices Based on Penetration.
Reference 20 showed that an asphalt mix exposed to 7 days of constant225 *F oven heat would produce aging equivalent to about 10 to 15 years of en-vironmental exposure in moderate climates of this country.
This concept of asphalt mix durability index and accelerated aging wasalso used in this study. Basically, a lower durability index indicates anincreased amount of asphalt age-hardening, assuming a constant amount of hard-ening as a result of heating and mixing.
D. CREEP TEST
During the service life of flexible pavements, rutting can occur. When itoccurs, it can be placed into one of the following categories:
1. Deep-Seated Rutting in Lower Pavement Layers
This occurs in the base, subbase, or subgrade. The ca,,se can belinked to overload, inadequate compaction, or seasonal periods of low strength,such as spring thaw.
27
a, \ ' 'f
2. Shallow Rutting in Upper Pavement Layers
These movements can be traced to nonrecoverable, traffic-induceddeformations in the asphalt surface layers. This latter type of rutting isthe primary focus of this study.
A study of shallow rutting caused by T-38 aircraft traffic indicated arelationship between mix properties used in design and observed rutting in
surface mixes (Reference 14). Paving mixes from taxiways at seven Air Forcebases were sampled and studied. All mixes had been designed with the 75 blowper side hammer-compactive effort and had experienced high-volume 240 psi con-tact pressure traffic. A visual rutting classification was used to supplementfield sampling and laboratory test results. Laboratory recompaction results,with the gyratory compactor, showed that in-place after-traffic densities intraffic lanes could be approximated.
Figure 10 shows a bar graph of data taken from this study pointing outthat observed rutting potential can be indicated by average voids filled withasphalt of the two uppermost recompacted pavement layers. Averages of about71-, 76-, and 80-percent voids filled indicated none, slight, and severe rut-ting, respectively.
Creep testing has been used by many organizations for trying to quan-tify rutting potential of asphalt concrete mixes. It is usually performedduring the design phase. The idea is to eliminate high-creep mixes that ruteasily. Creep testing is concerned with time-related deformation of asphaltmixes. Creep testing can be divided into two groups, dynamic and static test-ing, each with confined and unconfined subgroups. The dynamic-confined testsare the most complicated but seem to more closely represent behavior undertraffic. They require complex testing equipment, procedures, and dataanalysis.
The static-unconfined test was used in this study for simplicity ofmethod and equipment.
During the past few years, the creep test has been used to predictpermanent deformations and to rank mix behavior. The Shell InternationalPetroleum Company of Amsterdam, The Netherlands, developed a pavement designprocedure that includes creep testing of bituminous mixes. Results are usedin conjunction with nomographs, charts, formulas, and computations to estimateor predict permanent deformations in the asphalt layers (Reference 21).
Most users of creep tests recommend that data be used only to providerelative measures of mix behavior. One user, the North Dakota State HighwayDepartment, has reported extensive laboratory testing of old and new asphaltmixes. Based on the Shell procedure and rut-depth data, North Dakota foundthat actual and predicted permanent deformations did not correlate well.North Dakota, however, reported its planned adoption of the creep test as a
supplement to routine Marshall mix design and evaluation work (Reference 22).
28
_ 11 f , . . -
90 -
900
85
0• * VALUES AVERAGED FOR* 2 UPPER PAVEMENTz LAYERS. FIELD
75. SAMPLES WERE: ,RECOMPACTED WITH A
75 GYRATORY COMPACTOR
* SET TO 200 PSI.*A I-DEGREE ANGLE.
-J AND 30 REVOLUTIONS
U. t70 .9 % -
> 706• 70 0
• • DATA POINTS REPRESENTPAVEMENT SAMPLES
UJ FROM 23 TAXIWAYS> WHERE 240 PSI
0 AIRCRAFT TRAFFIC* PREDOMINATED.
65
60NONE SLIGHT SEVERE
0-1/2 INCH >1/2 INCH
OBSERVED DEGREE OF RUTTING
Figure 10. Surface Rutting of Taxiway Mixes Subjected
to T-38 Aircraft Traffic.
29
- V&'
S
SECTION V
EQUIPMENT AND PROCEDURES
Several types of test procedures were required for this study. In addi-tion to the standard laboratory equipment and procedures used to perform Mar-shall mix designs, more sophisticated and complex equipment and fundamentaltesting schemes were needed, including use of the gyratory compactor to pro-duce test specimens, modulus of elasticity, shear and tensile strength evalua-tion, accelerated aging, and creep testing of the specimens.
The following paragraphs outline equipment and procedures used in thisinvestigation. Apparatus and procedures are given, based on the type of test-ing performed.
A. MARSHALL AND GYRATORY TESTING
Marshall and gyratory testing procedures and equipment have been discussedin Section III of this report. Marshall procedures are followed after labora-tory mixing and compacting with the 10-pound manually operated hammer. Forthis investigation, the 75 blow per side compactive effort was used as thecontrol because of its current standardization for high-contact pressure,heavy-duty asphalt mixes.
Previous experience with gyratory compaction (References 13 and 14) suR-gests that laboratory tests, when performed on mixes compacted at stressessimilar to anticipated field traffic conditions, simulate field behavior undertraffic. Based on these experiences, a gyratory compactor, Model 4-C, modi-fied to exert in excess of 400 psi normal stress, was used to produce testspecimens. Compactive efforts on the gyratory compactor were varied by chang-ing normal compaction stresses from 100 to 400 psi in 100 psi increments. Allcompaction was done at 1-degree gyration angle for 30 revolutions of themachine. Figure 11 shows the modified gyratory compactor.
B. INDIRECT TENSILE TESTING
Static and repeat-load indirect tensile tests were performed, using thesame basic equipment. Figures 12 and 13 show overall and closeup views of thetesting equipment. A closed-loop MTS® electro-hydraulic testing system wasused. Disc-shaped specimens of asphalt mix 4 inches in diameter, normally2-1/2 inches thick, were loaded through 1/2 inch wide loading strips. Loadsand vertical and horizontal deformations were recorded for each test on appro-priate recording equipment.
The choice of recording equipment depended on the type of test performed.
1. Repeated Load Testing
Repeated-load testing required the use of at least a three-channelstrip chart recorder. Load was measured on one channel, vertical deformationfrom actuator movement was recorded on a second channel, and total horizontal
30
Figure 11. Modified Model 4C Gyratory Compactor.
31!
S
S
IF
Figure 13. Closeup of Indirect Tensile Apparatus.
deformation from spring-loaded linear variable differential trans-formers (LVDTs) was recorded on the third channel. Each specimen was testedat two positions, an initial position (0 degrees) followed by a position atright angles (90 degrees) to the original position. A total of three speci-mens were tested at each asphalt content; reported results were the averagevalues of six measurements.
2. Static Testing
Static testing to failure in tension required use of either two X-Yplotters or one X-Y-Y plotter. Both types were used at various times duringthis study. The two X-Y plotters, with single pens, produced two data sheetswith load versus vertical deformation and load versus horizontal deformation.The X-Y-Y plotter, with two pens, produced separate plots of load versus ver-tical deformation and horizontal deformation on a single data sheet. Thetwo-pen plotter was more efficient for data storage purposes. All recorderswere Hewlett-Packard equipment. A total of three specimens was similarlytested at each asphalt content; reported results were averages of threemeasurements.
The same load cell and hydraulic actuator were used for both types oftesting. A 5,000-pound load cell was mounted on the end of a 3,300-pound MTS®actuator; the actuator's internal LVDT was used to monitor verticaldeformation.
Specimens were tested at two temperatures for each type of test. Thefirst tests were performed at room temperature, 77 *F. Elevated temperaturetests were performed by heating asphalt mix specimens to 104 °F for at least
32
*2 hours before testing. Specimens were removed from an oven and tested inambient temperature for a maximum of 4 to 5 minutes to minimize any coolingeffects on test results.
In general, resilient testing followed techniques outlined inASTM D 4123 (Reference 12) with exceptions, as previously noted. A loadingduration to recovery time interval of 0.1 to 0.9 second was used throughoutthe resilient testing (see Figure 7). Load was applied using a ramp functiontriggered by a function generator. A linearly increasing load for 0.05 secondwas followed by a linearly decreasing load for 0.05 second. This schemeresulted in one load pulse per second. A total of 50-55 loading cycles wasapplied to each specimen prior to measuring loads and deformations.
C. DIRECT SHEAR TESTING
Direct shear tests were performed with the equipment shown in Figures 14and 15. The shear testing device consisted of several separate units, asfollows.
1. A normal pressure assembly was made of several units designed to main-tain a constant normal pressure on specimens during testing. A pressurized
* tank of nitrogen was used to preset relief pressure on a hydraulic accumula-*tor. A Greer LaerO hydraulic accumulator was placed in line between an* EnerpacO Hydraulic Pump (Model P39) and an Enerpace 10-ton capacity load
piston (Model RC 102 AAA). The accumulator allowed the normal hydraulic pres-sure to remain constant when aggregate particles tended to override each otherduring application of the shearing load.
2. The simple shear assembly was a platform for testing either4- or 6-inch diameter disc-shaped asphalt mix specimens. Inserts were used to
=test 4-inch specimens. Two plates connected by screws formed an interior re-action frame to resist normal forces on the specimen. The device was designedfor vertical application of the shear load (Figure 15).
3. A shear deformation measuring device, an LVDT with a total travel of1/2 inch, was mounted parallel to the direction of shear load application.
4. Shear load measurement was done with a 50,000-pound capacity load cellcalibrated and set to 20,000-pound maximum load range. Load was appliedthrough the load cell by a crosshead moving at 1/2 inch per minute.
5. The load-deformation recorder was an X-Y plotter connected to the load* cell and the LVDT.
Direct shear tests were conducted at 77 *F. Two normal stresses wereused. Stress levels in the vicinity of the 400 psi contact stresses were de-sirable; however, the very high nitrogen pressures required to preset the ac-
* cumulator made this dangerous. Instead, 100 and 200 psi normal pressures wereused. Test results were averaged from three individual tests at each normalstress level.
33
-2q
-2.
Figure 14. Overall View of Direct Shear Test Equipmnent.
34-
D. ACCELERATED AGING TESTING
A previously developed method of laboratory-accelerated aging of asphalticmixes was used (Reference 20). Marshall-sized specimens were placed in aforced air oven set to 225 *F and aged for 7 days. The aged asphalt was ex-tracted from the mixes and recovered using ASTM Methods D2172 and D1856, re-spectively (Reference 12). Penetration tests, ASTM D5 (Reference 12), wererun on the recovered aged asphalt and compared to original unaged penetrationvalues.
Durability indices, the ratios of aged penetration to unaged penetration,
were computed from these test results.
E. CREEP TESTING
The MTS® electro-hydraulic testing system, described previously, was usedto perform creep tests; however, it worked in conjunction with an MACSYM 2Cdata-acquisition and reduction-computer system. A multichannel strip chartrecorder was also used to record data in the event of computer malfunction.
A testing procedure was developed for this study since no standard proce-dure was found in the literature. This procedure was based on the use ofthree disc-shaped mix specimens of measured height, stacked vertically, andloaded without confinement as shown in Figures 16 and 17. Creep tests wereconducted at 770 F.
The table of the load frame was liberally coated with silicone greasebefore vertically stacking the specimens. Another liberal coat of siliconegrease was applied in a 4-inch diameter polished steel loading plate before itwas placed on top of the typical 7-1/2-inch high specimen. Silicone greasewas used to minimize the effect of end restraint.
A 50- to 60-pound preload or 4 to 5 psi vertical stress was applied toseat the cap on the specimen prior to the application of test loads. Load wasapplied to the specimens through a steel ball placed on the top loading plate;this avoided any loading eccentricity. The test started with application of astep load to the specimen. Loads corresponding to either 200, 100, 75, or50 psi vertical stress were applied and held constant throughout the testingperiod for up to 60 minutes. Vertical loads were held constant without cor-rection for increasing cross-sectional area.
Load and actuator movement (vertical deformation) were monitored and re-*corded continuously by the strip recorder and intermittently by the computer-
ized data system. Loads and deformations were monitored by the computersystem at preselected times after load application; they were converted tostresses and strains simultaneously by the data system. Data sampling timeswere set at 1, 2, 4, 8, 15, 30, and 60 seconds, continuing similarly untileither 60 minutes had elapsed or the specimens had experienced excessive de-formation. Excessive deformations are defined as swiftly occurring verticalcompression accompanied by tensile cracking and severe bulging of the testspecimen.
35
--
,S K
Figure 16. Creep Test Specimen Ready for Testing.
MT
Figure 17. Closeup of Creep
Test Specimen.
36
SECTION VI
RESULTS AND DISCUSSION
A. PRELIMINARY MIX CURVES, PROPERTIES, AND BEHAVIOR
Average results of preliminary specimen fabrication and testing are givenin Table 8. Marshall stabilities, flow values, and gyratory stability indi-ces (GSIs) are also shown. Data indicate that Marshall stabilities increasedwith levels of compaction, at least to the 300 psi level of gyratory compac-tion. Overall Marshall stabilities for specimens compacted at 400 psi were upto 44 percent higher than those compacted at standard hammer effort. One-inchmaximum aggregate mixes showed up to a 27-percent increase at higher compac-tive efforts and 3/4-inch mixes showed 39-44 percent increased stability.
Table 9 gives best-fit compaction curve constants for the mixes ofTable 8. Most of the data had a high correlation coefficient, indicating agood fit to the cubic compaction model presented in Section II. Maximum ag-gregate densities and corresponding asphalt contents are also given inTable 9.
Figures 18-21 show these aggregate density-asphalt content compactioncurves supplemented by zero air voids curves and 85-percent voids filled withasphalt curves. The dashed supplemental curves were computed using the rela-tionships given in Table 5. Compaction stability behavior showed that at the
time approximately 85 percent of voids in the mineral aggregate were filledwith asphalt, mixes generally became unstable in the gyratory compactor pro-
ducing GSIs greater than 1.0.
The effects of increased compactive effort can be seen in Figures 18-21.Higher compactive efforts generally decreased the asphalt content required toproduce maximum aggregate densities; densities also increased with compactiveeffort.
Design asphalt contents were determined by using current criteria forheavy-duty mixes (indicated under the 75-blow column of Table 6) with non-
absorptive aggregate. Using data in Table 8 for each combination of grada-tion, asphalt type, and compactive effort, design optimum asphalt contentswere determined by avcraging the individual asphalt contents satisfying thefour criteria given in Part A of Table 6 and checking the mix at the averagedoptimum against requirements of Part B. Table 10 lists these heavy-duty opti-
mums along with those optimums indicated by gyratory compactor GSIs.
Comparisons of optimum asphalt contents can be seen in Figures 22 and 23.The figures show that mixes conforming to heavy-duty criteria (currently ap-plied only to 75-blow per side laboratory compacted mixes) are generallyleaner than mixes giving maximum aggregate density. This is a reasonablefinding because pavements compacted on the lean side of maximum aggregate den-sity are expected to be more tolerant to traffic-related densification thanthose at higher asphalt contents.
37
p
0-4 0 0 - -' - 0 0 - n - -% - 0 - C - % - N
I.m 0-
m 0 u.00 ~ 0 go 0a e, 4 , 'D w~ w m, ' C ' t 4
a 6 >- ----- ----- - - - - - - - c
00 66 C N N 4% C 'C 4% 0% 'C 'C Cs0~ 4% 'C C 4, 0~ n 4, N 4 ~ 0 'C C N , I 04
0- 0 'C -, - - 'C -C I - 0 - C 4 n N -
IV-.
4%1
a% 6
6c e;6 W6W .
V% 4
a C6% 6 r
0 r
a a
38U
IC 6 .- n , C In ' I C C n 'C ' C % - C 4
0.0N 0 0000 0
0 > 00 In 'T
> ,.,t
6. 0
C4 0
.00 -* - 7 5 7 0 0 0 N - C, % 7
fa U N-.7 . - m ccINcq
.0 . 1! C, . % 0 N , - N - C, 0 ' Ni0a -C cc C 0N O C , - I. 0 00 '
I.S
31 .aWUt
-C
za C
C.)
IIn
@39
a% -X 0
0-x 0 :% a, N C! C C% C C OO CC- 0 0 0 0- - -- - -0 -~ 0- C - 0
10
w , 0
- 00
00> - - - - - - - - - -
- 0r 0
10
... 4 0r - % a C C , 0 a 7
CL. . -? ' 0 C N " % 'C ~ 0 a
01
z -0 a
0 40
G1 00 0 0 0 00cC 4
1.'00 k%
- y 006y 13
0 10
00 0 - 1 I - 4 - - - -0 N6.?6
6.0
m. N D N F N 0 N l DN , 1 I (N I
I.,.
*0
0
u 0 AD
I~ ~ -go 4 0 0 00 -N0 0 N 0' C N N Oz ~I~g
.41
0 x 0 00 0 iN 00'0 0 I iI
x 00
41
* - - - - E ENIN>. 0
at 0
ba> - - - - - - - - - - - - - --- - -
F -C- c 0 Go Ch 0 00 0 c - i N n
W .0 U O-M-P Y.0 O 0.0.ow 1
~00
v6 0
- 442
0 0 0 D 0 D en CD 0 00 (N0 00 0r-
-~ 0 0 0 0-- - 0 0 0 0- - -- -0 0- -
"a 1 . .O i C
t4 ~
>' 4 - - --- - - - - - - -
w- r
Z 00
60 0 - -~ - - -N -n 0-0 0 - n - 0 -0 -n - - 0-
'40m
0 N
01
-C
14 0
41
u fU -E-.~ ~ ~~ w' rn 0 N 0 n 4 N n N 4 7 I 1 n 0 I
aGSI is taken from the gyratory compactor and used as an indicator of
mix stability during compaction.
50
.',..j
L INE OF EQUA LITY /
U. S ACM -ACD-O0.143
r2 .962A Z
-ft 3.2 COMPACTIVE
X>SYMBOL EFFORT
* 4 £400 PSI/ U 300 PSI
/ 0 200 PSI
/ Y 5 BLOW
3 4 5 6
ASPHALT CONTENTFOR MAXIMUM AGGREGATE DENSITY.
% WEIGHT
Figure 22. Comparison of Optimum AsphaltContents, 3/4-Inch Maximum-
Sized Aggregate Mixes.
7
LINE OF EQUALITY
Z~2 ACm - 0.565 (ACD) +I 1.75T ~ r2 -0.8422
I-w&U1S
* ZL
Z> SYMBOL EFFORT
3 00 PSI- S200OPSI
% WEIGHTDESY,7LO
Figure 23. Comparison of Optimum AsphaltContents, 1-Inch Maximum-SizedAggregate Mixes.
51
iP
16
These figures show a difference in required asphalt content that appar-ently is a result of aggregate gradation. Figures 18-21 also show that mixesmade with the coarser gradation have flatter density-asphalt content curves;they are similar to those of free-draining gravels and sands. Low surface-area-to-volume ratios of the coarser mixes allow them to be compacted tohigher densities at lower asphalt contents than finer mixes. A lesser amount ;
of asphalt is required to coat and lubricate the coarser 1-inch aggregatemixes.
To infer mix behavior from preceding preliminary data, assume that a3/4-inch aggregate and AC 20 mix designed using heavy-duty criteria and75-blow compactive effort is to be constructed and trafficked with 400 psicontact pressure traffic. The asphalt content of a mix that satisfies re-quirements of the heavy-duty criteria (Table 6) is determined first. Then,other weight-volume properties are approximated by interpolating curves oftotal density, air voids, voids in mineral aggregate, and voids filled withasphalt plotted as functions of asphalt content. Each value is found at theindicated optimum asphalt content. The following is selected as a satisfac-tory asphalt concrete mix for construction.
Asphalt content: 5.2 percent AC 20Total mix density: 152.2 pcfVolume of asphalt (percent of total volume): 12.3Volume of air voids (percent of total volume): 3.9Voids in aggregate matrix (percent of total volume): 16.2Asphalt-filled voids (percent voids in aggregate matrix): 76.0
If this compacted mix is trafficked by aircraft with 400 psi pressures, it isassumed that its properties would, as a result of traffic, approach those ofthe gyratory specimens compacted at 400 psi at the same asphalt content. Thisassumption is based on the B-52 and T-38 studies (References 13 and 14).Therefore, after traffic simulation, the mix properties are:
Total mix density: 155.4 pcfVolume of asphalt (percent of total volume): 12.5Volume of air voids (percent of total volume): 1.9Voids in aggregate matrix (percent of total volume): 14.4Asphalt-filled voids (percent voids in aggregate matrix): 87.2GSI value: approximately 1.3; indicates instability
If the 400 psi gyratory compaction is analogous to 400 psi tire traffic, thisanalysis indicates that a 5.2-percent mix would densify under traffic a totalof about 2 percent. Its constant asphalt volume would fill more of the voids,as expected. The gyratory stability index indicates that the mix would becomeunstable when subjected to some unknown volume of 400 psi traffic. Ruttingand other plastic movements would probably occur during traffic. It is notpossible from this laboratory data to estimate the volume of traffic to causeplastic or rutting failure of a surface mixture constructed to the precedingspecifications.
The above assumptions and analyses lead to the position that the use ofboth the current heavy-duty criteria and current field compactive effort(equivalent to 75-blow laboratory compaction) is not recommended to design
52
mixes that will resist aircraft contact pressures in the 400 psi range; insta-bility and rutting occur. Some type of modification has to be made either tothe mix selection criteria or to the compactive effort applied during design
* and construction. Higher initial densities and lower asphalt contents are in-dicated for mixes to remain stable and resist rutting at these high contactpressures.
B. SUPPLEMENTAL NONCONVENTIONAL TESTING: UNMODIFIED ASPHALT CEMENT MIXES
Table 11 shows average properties of mixes made with unmodified asphaltcements AC 20 and AC 40. The mixes were produced at the previously used com-pactive efforts with the same aggregates and gradations. Three asphalt con-tents (1/2 percent less, estimated optimum, and 1/2 percent greater, byweight) were used with 3/4-inch aggregate mixes. The 1-inch aggregate mixeswere produced at the estimated optimum. The average properties of groups of14 specimens are given in this table; 14 specimens were made at each asphaltcontent. These specimens were made for studying mix properties that cannot beevaluated by use of Marshall stability and flow tests.
5., 1. Modulus Behavior
Table 12 presents average moduli from static and resilient indirecttensile testing at 77 and 100 OF. Static testing was performed by loadingspecimens to failure by splitting. Resilient testing was nondestructive.Specimens were repeatedly loaded and unloaded. The total resilient modulus isbased on the mix's response to loading, and the instantaneous resilient modu-lus is based on the response to unloading.
% Analyses of variance and Fisher's least significant difference tests(Reference 23) were performed on data from this table at the optimum asphaltcontents for each aggregate-asphalt combination and compactive effort. Two-way analyses of variance were performed with type of mix (asphalt-aggregatecombination) and compactive efforts as variables. Specific findings are givenin Table 13. Generally, mixes made with 3/4-inch aggregates and AC 20 asphaltand compacted with efforts greater than 100 psi produced the highest moduli at77 OF. At 100 OF, moduli differences between mixes became less significant;however, mixes made at the lowest (100 psi) compactive effort maintained thelowest ranking.
Test data indicated that the resilient indirect tensile test was moresensitive to differences in moduli at 77 OF.
2. Strength Behavior
Strength of asphalt mixes was studied at two levels. The lower levelwas concerned with the tensile behavior, and the higher level involved theshear strength measured with the direct shear apparatus.
a. Tensile Behavior
Tensile strength data from indirect tensile testing are given inTable 14. Observation of tensile strengths with 3/4-inch aggregate indicates
.5 53
j .,
En "aCa
'U C'-4 0 --)ITc0 0* C ~ r 00 -- MCD m 0 0\0 .c - joaC400 c 0I
z
4)E
E- >.4J
W 4J r
S -4 r- C- r aUC4 Tr 0N~~ c1 -.Tt~r r- 0 M J I r"C N Oc 0- IT " M-
C U) 0
co)
wi "V 4. .~ . - .~O- C .C . . . . -~ .L~ . . . . .
~. w W ~~~Wd W I 4 W16 W- - 'VWU ' I. UPi M2IL Wr 1L. WhR X71a'U'S. j ~ ' . ra. ~~.
different trends with each asphalt type. AC 20 mixes showed decreasing ten-sile strengths with increased asphalt contents, whereas AC 40 mixes showedeither almost constant values or mixed trends. This indicates that the moreviscous AC 40 grade is better for providing consistent high tensile strength.
Figure 24 shows a relationship developed from tensile strengthdata from Table 14. Based on 64 data entries from all the gyratory-compactedspecimens, the regression shows that mix tensile strength is primarily a func-tion of compactive effort and temperature with asphalt content having a lessereffect. The relationship suggests that mixes designed to meet heavy-duty cri-teria would possess higher tensile strengths when higher compactive effortsare required.
b. Direct Shear Behavior
Results of direct shear testing are given in Table 15; testing wasdone at 77 'F. Data shown are usually averaged from three tests. As ex-pected, shear stresses on the failure plane increased with the level of ap-plied normal stress. Shear strengths given in Table 15 are from forcesrequired to move aggregate particles relative to each other along the failuresurface. The applied forces generate crushing and shearing of aggregates andmove particles up and over each other. In some cases, deformations amountingto about 11 percent of specimen diameter (up to about 0.44 inch) were neededto develop maximum shear loads.
Analyses of variance and least-significant-difference techniquesindicated that 3/4-inch gradation mixes compacted at the 75-blow hammer andthe 100 psi gyratory efforts were consistently lower in strength than thosecompacted at 200, 300, and 400 psi stress levels in the gyratory compactor.The 200-400 psi compacted mixes were tighter and more physically stable. The
300 psi gyratory effort consistently produced mixes with the highest shearstrengths.
The data indicate that, at similar asphalt contents, mixes com-pacted to higher efforts (200-400 psi) with more viscous AC 40 asphalt cementdeveloped higher shear strengths that were independent of gradation.
c. Combined Tensile - Direct Shear Behavior
Indirect tensile strengths and direct shear data from Tables 14and 15 were combined and used to define mix behavior at 77 °F in terms of
friction and cohesion. The analysis implicitly assumes that the tensilestrength determined with the indirect tensile test is identical to that foundin a uniaxial tension test. Tensile strengths were plotted as points on thenormal stress or X-axis, and direct shear results were plotted as combinedstresses on both axes. The best-fit line through these points defined mixbehavior.
Typical values of friction and cohesion are given in Table 16.Figures 25-28 show the combined strength envelopes of mixes at optimum asphaltcontents. Friction angles ranged from 55 to 74 degrees and were general!,.
independent of asphalt content.
61
N %
160TEMPERATURE
150 -77 'F
140
130 - ASPHALT
4%
120 5%6%r
110 APAT"
100
6%
z = 367 + 0.10(GP) -3.18(T) -2.76(AC)0oR 2 =0.9490
90us-j
zI- 80
so - 4"70 6
60
30 I I I I
100 200 300 400
GYRATORY COMPACTION PRESSURE. PSI
Figure 24. General Tensile Strength Rel.ationshipfor Gyratory-Compacted Mixes.
62
~~~~~~~~~~~ v At k:* ~ .~,. V/~.ff.~ 4W.S.4. ..
TABLE 15. DIRECT SHEAR DATA SUMMARY, 77 -F.
Average results a
Asphalt Normal ShearCompactive content stress strength Deformation
Figure 27. Combined Strength Envelope, I-Inch and AC 20Mixes at Optimum Asphalt Contents.
70
%I
S.
-- 1100 -4.5% 5 5 7%'i!?- ,,o 3% .
1000 - 1.9%
/ i/4.5%
'b /
700
/00= C + oTAN 0
COMPACTION A.C. C 0 SYMBOL
400 3.9 326 66
300 4.5 323 67 0500 200 4.3 283 67 0
758 4.5 215 58 V
100 5.7 244 68 9
400
300
200
100
0-200 -100 0 100 200 300 400 500
TENSION- -f--COMPRESSIONNORMAL STRESS, a, PSI
Figure 28. Combined Strength Envelope, I-Inch and AC 40Mixes at Optimum Asphalt Contents.
d
71
Figures 29 and 30 show the effects of gradation, compaction, and
asphalt grade on the cohesion of mixes. The lines drawn on the figures arebest-fit relationships between cohesion and voids in the mineral aggregate.Trends in the data show that the coarser 1-inch gradation allowed the mixes tobe compacted into tighter configurations. The effect of increased compactiveeffort can be seen as increasing values of cohesion and decreasing voids in
the mineral aggregate. From these results, the 3/4-inch gradation and AC 40asphalt mixes had the highest strengths at 77 *F.
3. Asphalt-Aging Behavior
Tables 17 and 18 give results of accelerated asphalt-aging tests per-formed on all mixes. These mixes were subjected to 225 *F temperatures for7 days.
Two-way analyses of variance, comparing all compactive efforts andlevels of asphalt content (heavy-duty optimum, 1/2 percent lean of optimum,and 1/2 percent rich of optimum), were conducted. Least significant differ-ences were also computed at the 95-percent level. The following conclusionswere reached.
a. 3/4-Inch and AC 20 Mixes
(1) Levels of compactive effort did not significantly affect
durability indices of the mixes.
(2) Mixes that were made on the rich side of optimum had signifi-cantly higher durability indices than those at optimum or slightly lean ofoptimum.
b. 3/4-Inch and AC 40 Mixes
(1) There were no significant differences between mean durabilityindices in either terms of levels of compactive effort or level of asphaltcontent. This means that the range of asphalt contents investigated did notprovide enough differenc, in durability index to definitely select a best mix
for long-range mix durability.
(2) The data could also imply that penetration results are not asdependable or consistent with harder asphalts after laboratory extraction andrecovery procedures.
A regression was performed on data from mixes made with AC 20 asphaltand 3/4-inch gradation. Figure 31 shows that the resistance to age-hardening,expressed as durability index, is a function of the volume of air voids withinthe mixes. These results illustrate that age resistance depends on the volumeof mix that is permeable to air or water (this volume can be called effectiveporosity). The figure shows that the resistance to aging increases as the ef-fective porosity decreases. This suggests that mixes having high asphalt con--tents are best for resisting the effects of aging.
It is reasonable to assume that mixes made with the more viscous AC 40asphalt are similarly affected by aging. Results of this study did not
72
%1
'D
I,
400 -
375
GRADATION350 -1 INCH 3/4 INCH COMPACTION
A £ 400 PSI
3250 300 PSI
0 0 200 PSI
0 0 100 PSI
300 75 BLOWz0
O 275U 0
250
3/4-INCH\-INCH MIXES
225 - MIXES
qI200 Y
175 I I I I I I I12 14 16 18 20
VOIDS IN MINERAL AGGREGATE. % VOLUME
Figure 29. Cohesion of AC 20 Mixes.
'73
4%4%-
n "6WV - -.f_- - -Il V T "w - "V V- -- - - . . -
- .1
400 a-
375 - GRADATION
INCH 3/4 INCH COMPACTION
350 - 6 400 PSI%
£0 300 PSI
0.300 .0
z0
Uj 0ox 275 - 1-INCH
MIXES3/4-INCH
250 -MIXESD
225
200
175 S.
12 14 is 18 20
VOIDS IN MINERAL AGGREGATE. % VOLUME
Figure 30. Cohesion of AC 40 Mixes.
74
%
TABLE 17. ACCELERATED AGING TEST RESULTS FOR AC 20 MIXES.
After aging*Penetration DurabilityCompactive Asphalt content a
Figure 31. Accelerated Aging Results, 3/4-Inch Aggregateand AC 20 Mixes
indicate good trends for these mixes. Either the penetration test was notsensitive enough to indicate changes in the asphalt because of aging or theextraction and recovery procedures also tended to affect the AC 40.
4. Creep Behavior
Creep tests were among the last tests performed during this study. Bythis time, trends in previous test data had indicated the 300 psi gyratorycompacted mixes were adequately compacted and possessed high strengths.These general observations and a belief that the 400 psi effort was pushingthe limits of the gyratory compactor led to the position that a modified lab-oratory compactive effort with the Model 4C compactor should be limited to300 psi. The following efforts were selected for use during creep specimenpreparation:
Compactiveeffort Description
Standard 75-blow per side with a 10-pound manuallyheavy-duty operated compaction hammer
Modified 300 psi normal pressure, 1-degree
heavy-duty gyration angle, for 30 revolutionsin the gyratory compactor
The supply of AC 40 asphalt cement was depleted before a full set of mixes wasfabricated for testing; this series of tests did not include 3/4-inch aggre-gate and AC 40 mixes.
77
Results of unconfined creep testing at laboratory room temperature aregiven in Table 19. Creep stiffnesses given in the table were computed as sim-ple vertical stress to vertical strain ratios I second after step load appli-cation. Values of initial creep were computed as the difference in verticaldeformation between the first and second 1-second time interval after load ap-plication; values shown are in percent per minute. Vertical strains are shownin percent at the end of a 60-minute loading period. If significant vertical -
strain was noted during testing, tests were halted; vertical strains and test-ing times, in minutes, were recorded. Only the 200 psi tests were haltedbecause of excessive deformation. Figures 32-39 show deformation-time curvesfor the mixes tested.
Based on the data, it seemed reasonable to expect that a good indica-tor of mix creep behavior would be the time needed to reach a constant verti-cal strain under the most severe load. The amount of time to reach 2 percentvertical strain under the 200 psi load was chosen as the creep behavior indi-cator. Table 20 summarizes results for this severe loading. ".
The data infer that high compactive effort on coarse mixes at orslightly lean of optimum asphalt content will produce better creep resistance.Ranking by creep resistance can be accomplished by ordering mixes by decreas-ing creep times. When this was done for each gradation, mixes compacted bythe modified 300 psi compactive effort ranked higher. They are expected toprovide better creep resistance under traffic than mixes compacted to standard
airfield compactive efforts.
C. SUPPLEMENTAL NONCONVENTIONAL TESTING: CHEMKRETE®-MODIFIEDASPHALT-CEMENT MIXES %
This part of the study was intended to examine the effects of a modifier %on the behavior of heavy-duty mixes. Chemkrete®, a proprietary asphalt modi-fier, was added to AC 20 asphalt cement to produce a 4 percent by weight mix-ture. The modified asphalt was mixed with 3/4-inch limestone aggregate blendsto produce a total of about 200 specimens. The Chemkrete® manufacturer recom-mends a curing period for the modifier to develop its full effectiveness.Half the mixes were not cured; the other half were placed in an oven at 140 *F
for a 7-day cure.
Penetration tests were performed on the modified asphalt cement. Penetra-tions increased 68 percent, from 75 (the unmodified asphalt) to 126 at ambient
laboratory temperature (penetration is expressed as 1 unit = 1/10 mm).
Mix designations were abbreviated according to the following format.
Description of Chemkrete®-ModifiedMix AC 20 Mixes
A 4.6 percent by weight -- 400 psi gyratory compaction
B 4.6 percent by weight -- 300 psi gyratory compaction -
C 4.9 percent by weight -- 200 psi gyratory compaction
D 5.2 percent by weight -- 75 blow per side hammer effort
Data of Table 21 show that those mixes containing modified AC 20 asphaltgenerally showed unstable behavior during compaction. The GSIs were above1.0. At each compactive effort, modified mixes were compacted to denser, moresaturated internal structures; this can be seen by comparing total density,voids in the mineral aggregate, and voids filled values from this table withthose of Table 11 for unmodified mixes. Obviously, Chemkrete® lowered the re-sistance of the mix to compaction." However, this also means that a separatemix design has to be performed on modified asphalt mixes; proper design as-phalt contents should be lower than unmodified mixes.
1. Resilient Elastic Moduli
Resilient elastic moduli are summarized in Table 22. At 100 °F, load-ing and unloading moduli (total and instantaneous moduli, respectively) wereindependent of compactive effort. However, at 77 *F, the unloading responseof the 400 psi, gyratory-compacted, uncured mix was higher than other mixes.A general comparison of these data with unmodified mix data showed that modi-fied asphalt mixes had about one-half to two-thirds the resilient modulus ofnonmodified mixtures.
2. Direct Shear Data
Direct shear data of Table 23 show that the mixes produced at thehighest effort had the highest shear strength. Strengths at the highesteffort were about the same as unmodified mixes. As compactive effort de-creased and asphalt contents increased, the modified asphalt mixes showed lessshear strength than comparable unmodified mixes.
3. Creep Data
Creep data are shown in Table 24. Due to an error in scale factorduring these creep tests, the higher vertical stresses used (270 and 150 psi)were not the same as used with unmodified asphalt mixes; creep time responsescan not be directly compared with unmodified asphalt mix data in the higherstress ranges. Based on the 75 psi creep responses, the mixes at 300 psi and
aspecimens were cured 7 days in a 140 F oven before testing.
I90 1
TABLE 23. DIRECT SHEAR DATA SUMMARY (77 OF),CHEMKRETE@-MODIFIED MIXES.
Normal Shear Deformation
a stress strength percentMix Cured /Uncured psi psi diameter
A U 100 408.9 3.58
200 556.9 3.60
C 100 351.1 3.22
200 533.0 3.92
B U 100 381.9 3.30
200 519.7 3.60C 100 311.9 5.09
200 451.9 5.85
C U 100 329.4 3.69
200 471.1 4.82
C 100 363.9 3.85
200 475.8 4.36
D U 100 319.3 4.93
200 407.1 5.36
C 100 327.8 4.77
200 425.8 4.28
aSpecimens were cured 7 days in a 140 °F oven before testing.
91
.J M p. pw~ v -a.-J.. .~ w.. tV' '7':W .M~~ -~parmrJr. n mn m x IW nWm V .WIn~ nw
TABLE 24. UNCONFINED CREEP DATA SUMMARY (77 oF),CHEMKRETEO-MODIFIED MIXES.
Creep Initial creep Time to 2 percentstress stiffness vertical strain
Mix psi Cued/Uncured psi minutes
A 270 U 21,060 0.25
C - -
150 U 48,570 16+
C 19,030 11
75 U 45,910 60+
C 20,540 60+
B 270 U 19,410 0.15
C 18,870 0.07
150 U 51,780 8+
C 15,250 2
75 U 11,550 60+
C 270 U 20,970 0.09
C 21,172 0.17
150 U 20,020 2.3
C 15,100 2.3
75 U 11,160 60+
C 12,490 60+
D 270 U 40,150 0.18
C 20,290 0.07
150 U 10,580 0.09
C 20,580 1
75 U 10,060 30
C 26,793 60
a Specimens were cured 7 days in a 140 *F oven before testing.
92
mane. ~ ~ ~ MT&nW min.- rwe ,~ - .. i
75-blow efforts had very similar creep responses: more than 60 minutes toreach 2-percent vertical strain. Cured mixes performed similarly to unmodi-fied asphalt mixes. However, a definite statement cannot be made about thegeneral creep behavior of uncured modified asphalt mixes.
In summary, it appears that modified AC 20 mixes can be compacted tohigher densities and will have similar shear strengths, similar creep behav-ior, and lower elastic moduli than will regular AC 20 mixes, if allowed tocure before traffic.
93
SECTION VII
CONCLUSIONS AND RECOMMENDATIONS
Based on results of this study, a number of conclusions and recommenda-tions were developed. These are based on the use of one type of aggregate,
two gradations of the aggregate, three different asphalt types, five compac-Itive efforts, and numerous asphalt contents.
A. CONCLUSIONS
The following conclusions were justified:
" A modified laboratory mix design procedure for surface courses sub-jected to heavyweight F-15 aircraft traffic is feasible. This studyshowed that asphalt concrete mixtures, designed using conventionalhigh-contact pressure design criteria and conventional compactive
effort, will further densify after construction. The high contactpressures (up to 400 psi) exerted by a heavyweight fighter aircraftIwere roughly simulated in the laboratory. Test results indicated thatinstability, leading to rutting, would probably occur in mixes con-structed to current heavy-duty compactive efforts.
"Higher compactive efforts than the current 75 blow per side produceIstronger surface mixtures. This was found to be valid at asphalt con-tents lean of standard optimum conditions.
* A satisfactory asphalt concrete mixture can be designed with the gyra-tory testing machine._
" Mixes made with AC 40 asphalt cement provided greater strength thanthose made with AC 20 asphalt. To minimize rutting, an AC 40 would bea good choice; however, a stiff asphalt like this may produce signifi-cant temperature cracking in areas with wide variations in temperature.
" The 1-inch coarse gradation mixtures performed better under very highcompaction pressures (300-400 psi) than did the 3/4-inch graded mix-tures. This indicated that, after construction, coarser mixes may notrut as easily from heavy F-15 traffic.
" The use of asphalt cement modifiers, such as Chemkretee, may assist inthe production of mixes with higher construction densities. These
types of mixtures may also be more plastic.IB. RECOMMENDATIONS
Based on this study, the following recommendations are made:
*Use a gyratory testing machine to design asphalt mixtures that will be
subjected to heavyweight F-15 aircraft traffic. A 300 psi normal pres- *sure should be used to compact specimens in the laboratory.
94
* Require all aggregates to be crushed. The use of natural sand shouldnot be allowed.
a Use either a 1-inch or a 3/4-inch maximum sized aggregate gradation(see Table 2). Test results indicated that a 1-inch coarse gradationhad an advantage in not showing as much unstable behavior during com-paction in the gyratory testing machine.
* Select the lowest asphalt content satisfying heavy-duty mix criteriasince a high asphalt content is detrimental to good mix performanceunder very high contact pressures.
* Perform additional work to study other aggregate gradations and otherasphalt modifiers. Both natural and man-made asphalts and modifiersneed to be evaluated to see if their use could improve mix performanceduring both hot and cold weather.
1. Recommended Mix Design Methods
Two modified methods of mix design are recommended for asphalt surfacecourses subject to heavyweight F-15 aircraft traffic. Both methods are basedon increased compactive efforts and the heavy-duty mix design criteria.Mcthod I is preferred.
a. Method I: Modified Gyratory Mix Design
The preferred modified method of mix design is based on the use ofa gyratory compactor capable of exerting 300 psi normal pressures during spec-imen preparation. At least three specimens shall be fabricated at eachasphalt content across a range of asphalt contents. Steps in the procedureare as follows:
(1) Compact mixes at a 300 psi normal pressure setting and a1-degree angle of gyration for 30 revolutions of the roller assembly.
(2) Record gyrograph traces of compaction behavior for each spec-imen. Traces will be used to compute average gyratory stability indices(GSIs) at each asphalt content.
(3) Measure and record average Marshall stabilities and flows.
(4) Compute average weight-volume properties at each asphalt con-tent. Equations from Table 5 can be used.
(5) Select the mix for construction using high-pressure/heavy-duty criteria of Table 6 and average GSI (the ratio of final to intermediatewidth, from the gyratory trace) values; a GSI of 1.0 shall not be exceeded.Record the following:
a Asphalt content.@ Total mix density.a Asphalt weight-volume properties.• Average Marshall stability and flow.
95
Dr
b. Method II: Modified Hand-Hammer Mix Design
When a gyratory compactor is not available, a modified hand-hammermethod shall be used to select a mix for construction. This method usesstandard 75 blow per side compactive effort and heavy-duty criteria; however,construction density and design asphalt contents are adjusted. Steps in thisdesign procedure are as follows:
(1) Compact mixes using 75 blow per side. At least three speci-
mens per asphalt content shall be compacted over a range of asphalt contents.
(2) Measure and record average Marshall stabilities and flows.
(3) Compute average weight-volume properties at each asphalt con-tent. Equations from Table 5 can be used.
(4) Select the best mix satisfying heavy-duty criteria (Table 6)and note the following:
* Total mix density.* Asphalt content.* Average weight-volume properties.* Average Marshall stability and flow.
(5) Determine modified asphalt content and density of theselected mix as follows:
e Determine modified asphalt content by taking 90 percent ofthe asphalt content of the second step of (4).
* Compute a modified total density corresponding to theabove modified asphalt content. The following equation (modified fromTable 5) will be used to select the modified density:
w GsG BKYmm Gs (AC) + GB(I - ACm)K
where
ymm - total modified unit weight of mix
y - unit weight of waterG - apparent specific gravity of aggregate
s
GB specific gravity of asphalt cement
K Voids filled with asphalt; this value is held constant and must beequivalent to that of the mix selection in the third step of (4)(i.e. 70 percent = 0.70).
AC m -modified asphalt content = 0.90 x (standard optimum asphalt contentm by weight (i.e. 4 percent = 0.04)
96
Figure 40 illustrates use of this modified hand-hammer proce-dure with 75-percent voids filled with asphalt (K = 0.75).
2. Recommended Mixes for Traffic Testing
The following mixes are recommended for evaluation in the proposedtest section at the Engineering and Services Center at Tyndall AFB, Florida.
a. Mix 1: A 1-inch maximum sized aggregate mixture with AC 20 as-phalt cement, designed with a gyratory testing machine set to 300 psi pressure(modified design).
b. Mix 2: A 1-inch maximum sized aggregate mixture with AC 20 as-phalt cement, designed with the Marshall Method for high-pressure applications(standard design).
c. Mix 3: A 3/4-inch maximum sized aggregate mixture with AC 20 as-phalt cement, designed with a gyratory testing machine set to 300 psi pressure(modified design).
d. Mix 4: A 3/4-inch maximum sized aggregate mixture with AC 20 as-phalt cement, designed with the Marshall Method for high-pressure applications(standard design).
170
100 VOIDS
100.9 STADARDFILLEDEFFORTWITH
,- | ASPHALT
o 152.1 PCF 100 STANDAR EFOT 10
- 15 I 70%r
~ ISOI-
70%
140 -
90% (ACTS) - 4.7% I AC 7 5.2%I II II I
3 4 S 6 7ASPHALT CONTENT, % WEIGHT
Figure 40. Modified Mix Design Using 75-Blow perSide Hammer Effort.
97
rips
e. Mix 5: A 3/4-inch maximum sized aggregate with modified AC 20,treated with Chemkrete®, designed with the Marshall Method for high-pressureapplications (standard design).
f. Mix 6: A 1-inch maximum sized aggregate with modified AC 20,treated with Chemkrete®, designed with the Marshall Method for high-pressureapplications (standard design).
g. Mix 7: A 3/4-inch maximum sized aggregate with AC 40 asphalt ce-ment, designed with the Marshall Method for high-pressure applications (stan-dard design).
h. Mix 8: A 3/4-inch maximum sized aggregate with AC 40 asphalt ce-ment, designed with a gyratory testing machine set to 300 psi pressure (modi-fied design).
i. Mix 9: A 1-inch maximum sized aggregate with AC 40 asphalt ce-ment, designed with the Marshall Method for high-pressure applications(standard design).
J. Mix 10: A 1-inch maximum sized aggregate with AC 40 asphalt ce-ment, designed with a gyratory testing machine set to 300 psi pressure (modi-fied design).
98
,REFERENCES
1. Chou, Y. T., Engineering Behavior of Pavement Materials: State of theArt, Technical Report S-77-9, US Army Engineer Waterways Experiment Sta-tion, Vicksburg, Mississippi, February 1977.
2. Department of the Army, Technical Manual TM 5-822-8, Bituminous PavementsStandard Practice, December 1971.
3. Department of the Army, Corps of Engineers Guide Specification, MilitaryConstruction CEGS-02556, "Bituminous Intermediate and Wearing Courses forAirfields, Heliports, and Heavy Duty Pavements (Central-Plant Hot-Mix),"September 1984.
4. Brown, E. R., "Experiences of Corps of Engineers in Compaction of Hot As-phalt Mixtures," ASTM Symposium-Placement and Compaction of Asphalt Mix-tures, Philadelphia, Pennsylvania, December 1982, ASTM Special TechnicalPublication 829, pp. 67-79, 1984.
5. Shockley, W. G., "Correlations of Laboratory and Field Data," Symposium onAsphalt Paving Mixtures, Research Report No. 7-B, Highway Research Board,Washington, D.C., pp. 65-76, 1949.
a 6. Dillard, J. H., "Comparison of Marshall Specimens and Pavement Cores,"Proceedings, Association of Asphalt Paving Technologists, Vol 24,pp. 178-209, February 1955.
7. Ortolani, L., and Sandberg, H. A., "The Gyratory Shear Method of MoldingAsphaltic Concrete Test Specimens; Its Development and Correlation withField Compaction Methods. A Texas Highway Department Standard Procedure,"Proceedings, Association of Asphalt Paving Technologists, Vol 24,pp. 280-293, February 1955.
8. McRae, J. L., Compaction of Bituminous Concrete, Miscellaneous Pa-per 4-210, US Army Engineer Waterways Experiment Station, Vicksburg, Mis-sissippi, March 1955.
9. McRae, J. L. and Foster, C. R., Theory and Application of A Gyratory Test-
ing Machine for Hot-Mix Bituminous Pavement, Miscellaneous Paper 4-333,US Army Engineer Waterways Experiment Station, Vicksburg, Mississippi,April 1959.
10. Development of the Gyratory Testing Machine and Procedures for TestingBituminous Paving Mixtures, Technical Report 3-595, US Army EngineerWaterways Experiment Station, Vicksburg, Mississippi, February 1962.
11. Department of Defense, MIL-STD-620A, Military Standard Test Methods ofBituminous Paving Materials, 13 January 1966.
12. American Society for Testing and Materials, 1985 Annual Book of ASTMStandards, Vol 04.03, Philadelphia, Pennsylvania, 1985.
99
13. Pavement Mix Design Study for Very Heavy Gear Loads Pilot Test Section,Technical Report 3-594, US Army Engineer Waterways Experiment Station,Vicksburg, Mississippi, February 1962.
14. Brown, E. R., "Evaluation of Asphaltic Concrete Pavement Subjected toT-38 Aircraft Loadings," Master of Science Thesis, Mississippi State Uni-versity, 1974.
15. AL-Hussaini, M. M. and Townsend, F. C., Tensile Testing of Soils A Liter-ature Review, Miscellaneous Paper S-73-24, US Army Engineer Waterways Ex-periment Station, Vicksburg, Mississippi, May 1973.
16. Hudson, W. R., and Kennedy, T. W., An Indirect Tensile Test for Stabi-lized Materials, Research Report 98-1, Center for Highway Research, Uni-versity of Texas at Austin, January 1968.
17. Hadley, W. 0., Hudson, W. R., and Kennedy, T. W., An Evaluation of Fac-tors Affecting the Tensile Properties of Asphalt-Treated Materials, Re-search Report 98-2, Center for Highway Research, University of Texas atAustin, March 1969.
18. Hadley, W. 0., Hudson, W. R., and Kennedy, T. W., A Method of EstimatingTensile Properties of Materials Tested in Indirect Tension, Research Re-port 98-7, Center for Highway Research, University of Texas at Austin,July 1970.
19. Kennedy, T. W., "Characterization of Asphalt Pavement Materials Using theIndirect Tensile Test," Proceedings, Association of Asphalt Paving Tech-nologists, Vol 46, pp. 132-149, 1977.
20. Bush, A. J., Gunkel, R. C., Regan, G. L., and Berg, R. L., Design of Al-ternate Launch and Recovery Surfaces for Environmental Effects, ESL-TR-83-64, Engineering and Services Laboratory, Air Force Engineering andServices Center, Tyndall AFB, Florida, July 1984.
21. The Shell Pavement Design Manual, Koninklijke/Shell-Laboratorium, Amster-dam, 1977.
22. Braver, M. G., "An Evaluation of the Shell Creep Test Procedure to Pre-dict Rutting in Asphalt Pavements - Final Report on Phase II," FHWA/RD-ND-82, North Dakota State Highway Department, Materials and ResearchDivision, Bismarck, North Dakota, for the US Department of Transporta-tion, Federal Highway Administration, January 1982.
23. Ott, L., An Introduction to Statistical Methods for Data Analysis,Duxbury Press, North Scituate, Massachusetts, pp. 384-388, 1977.

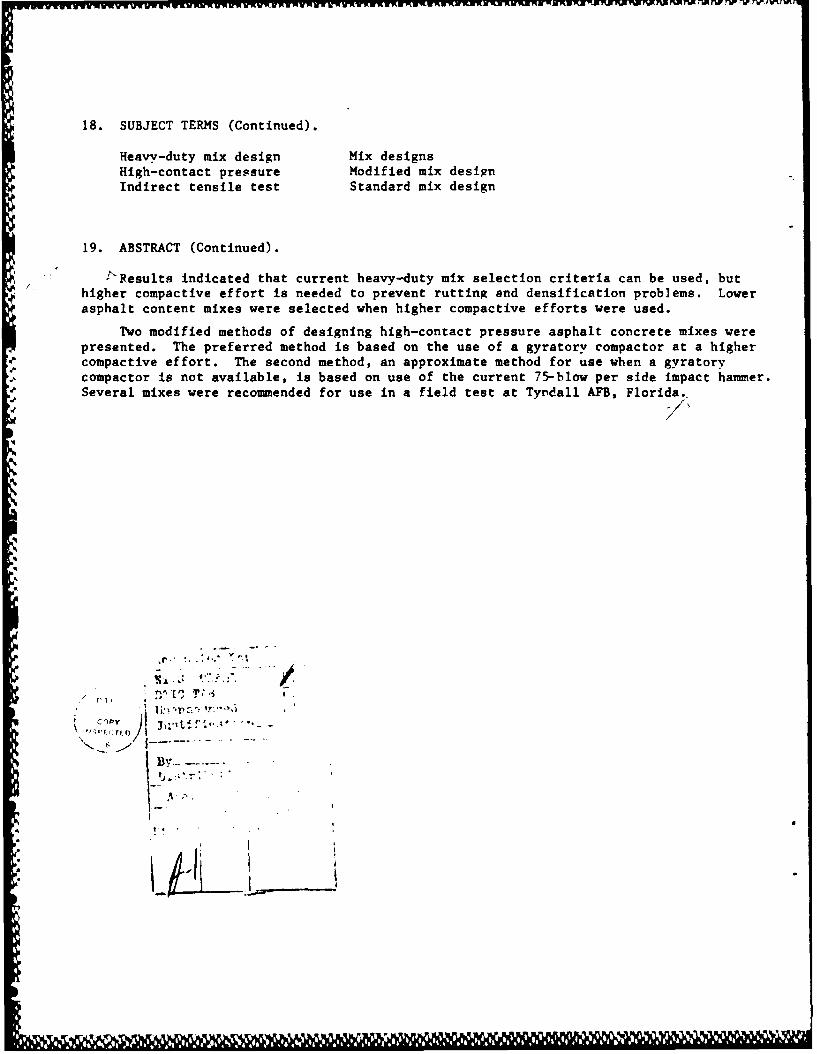

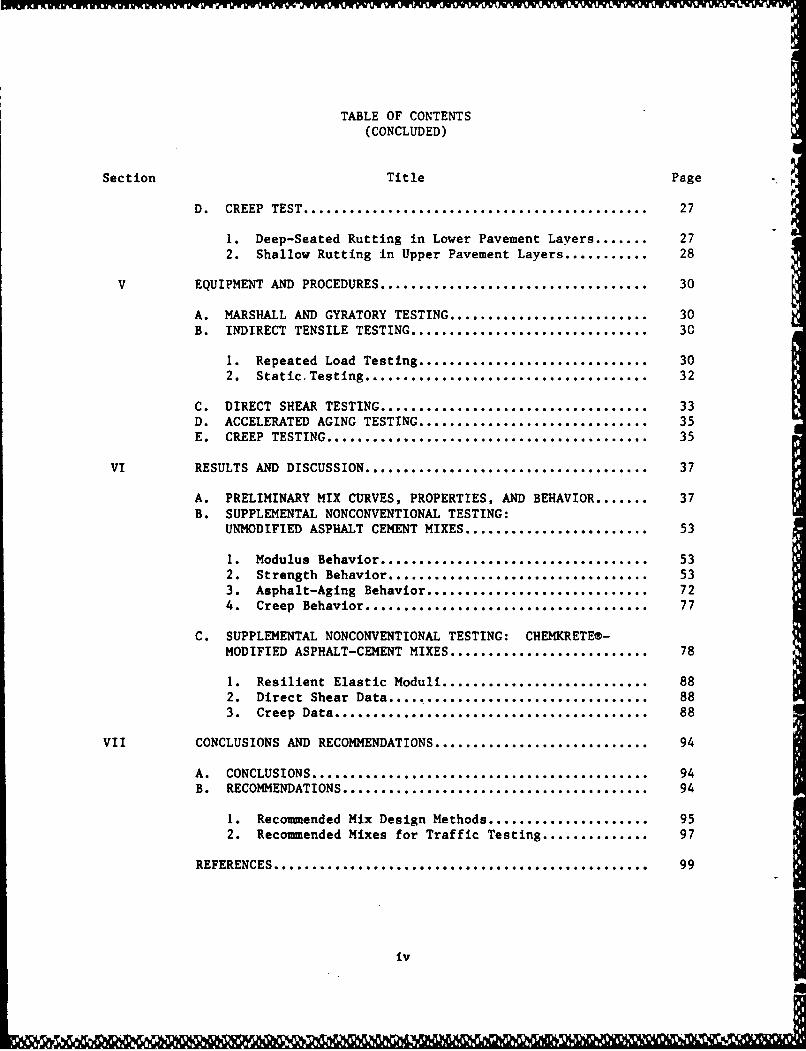

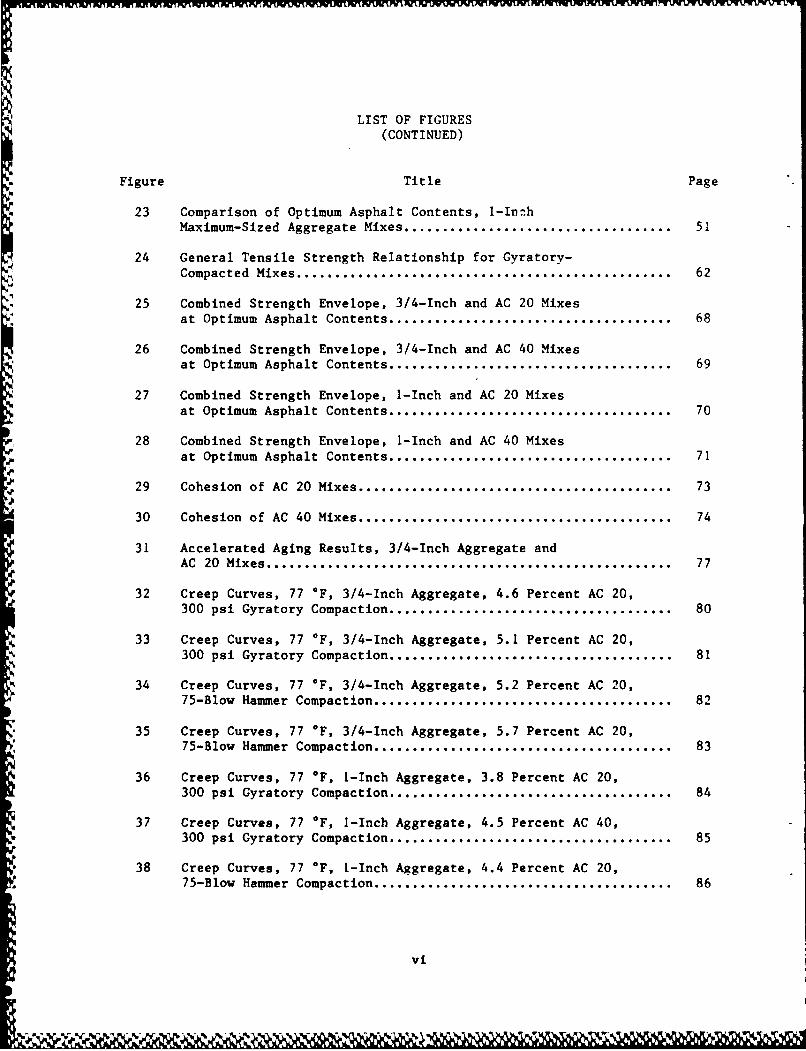

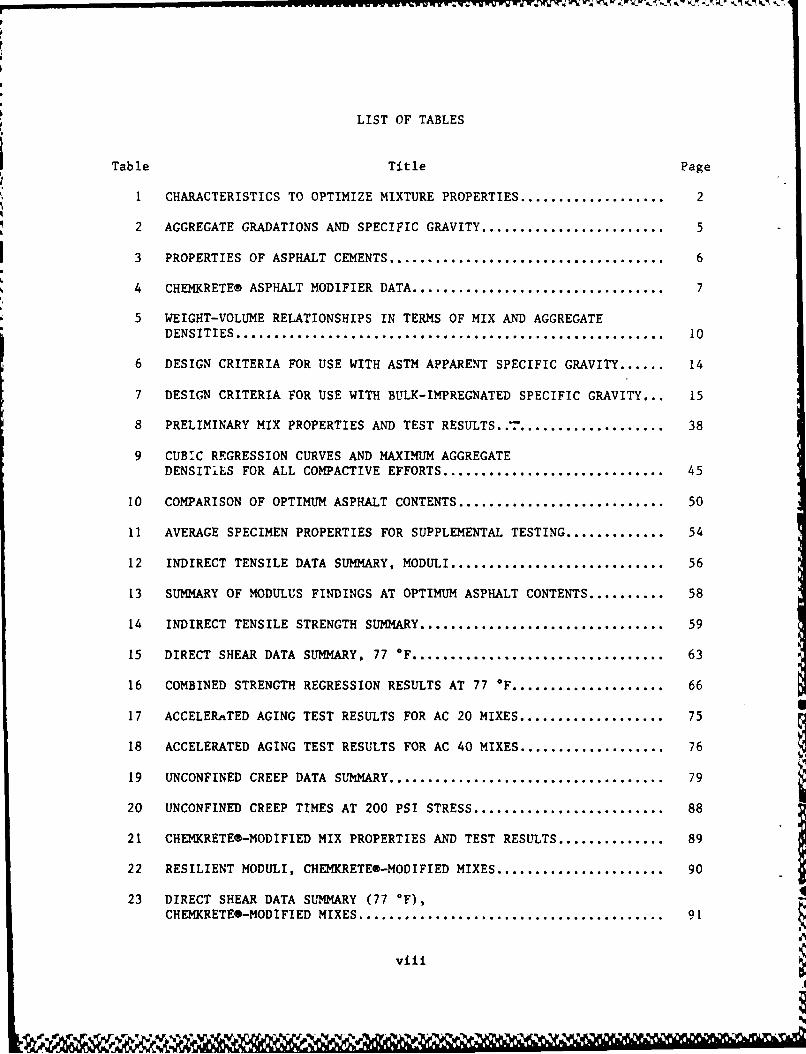
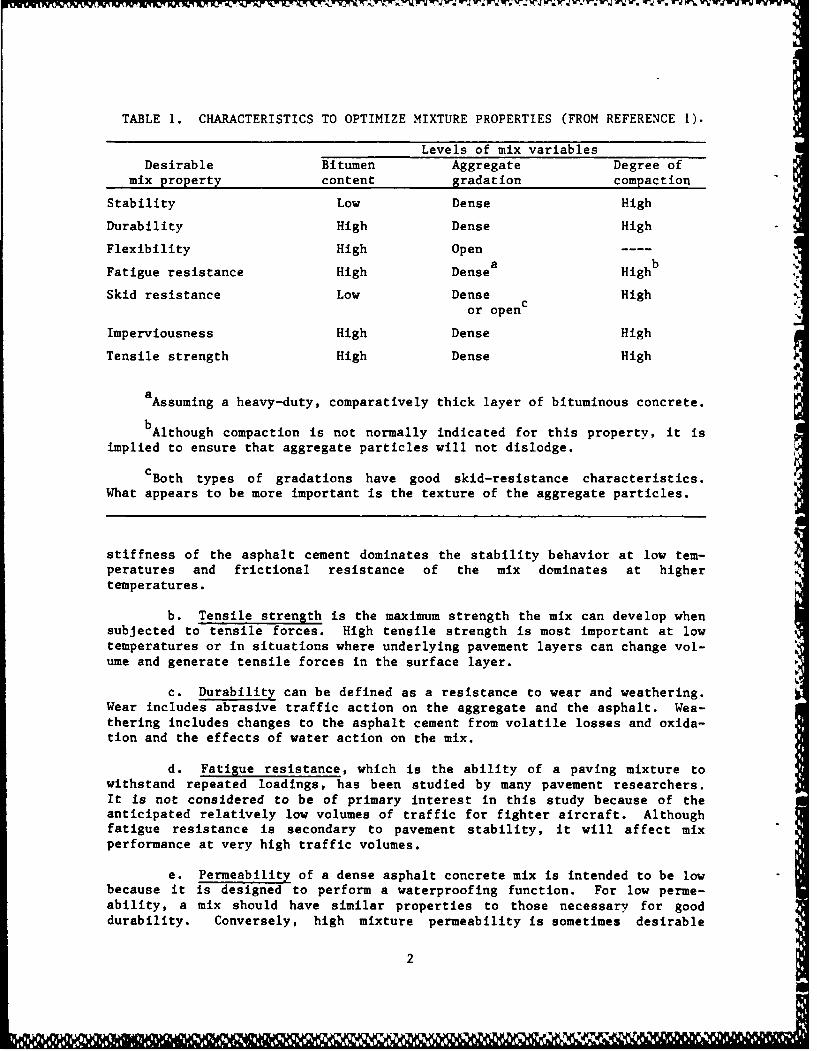

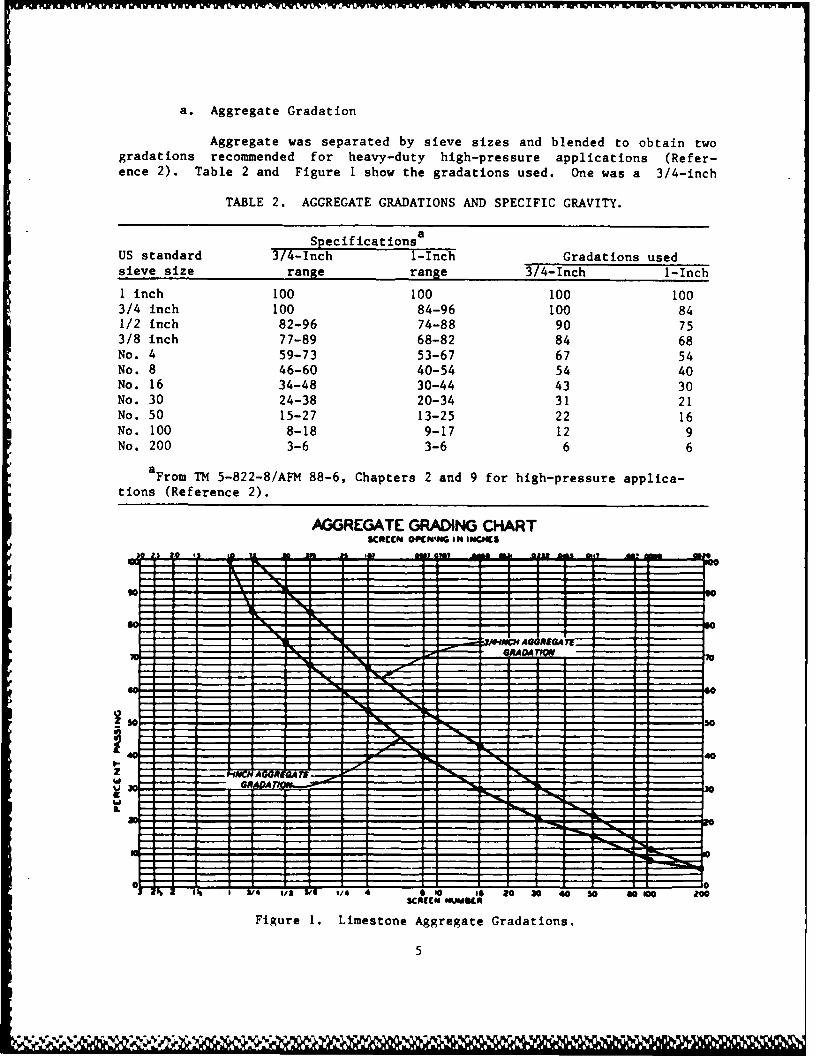


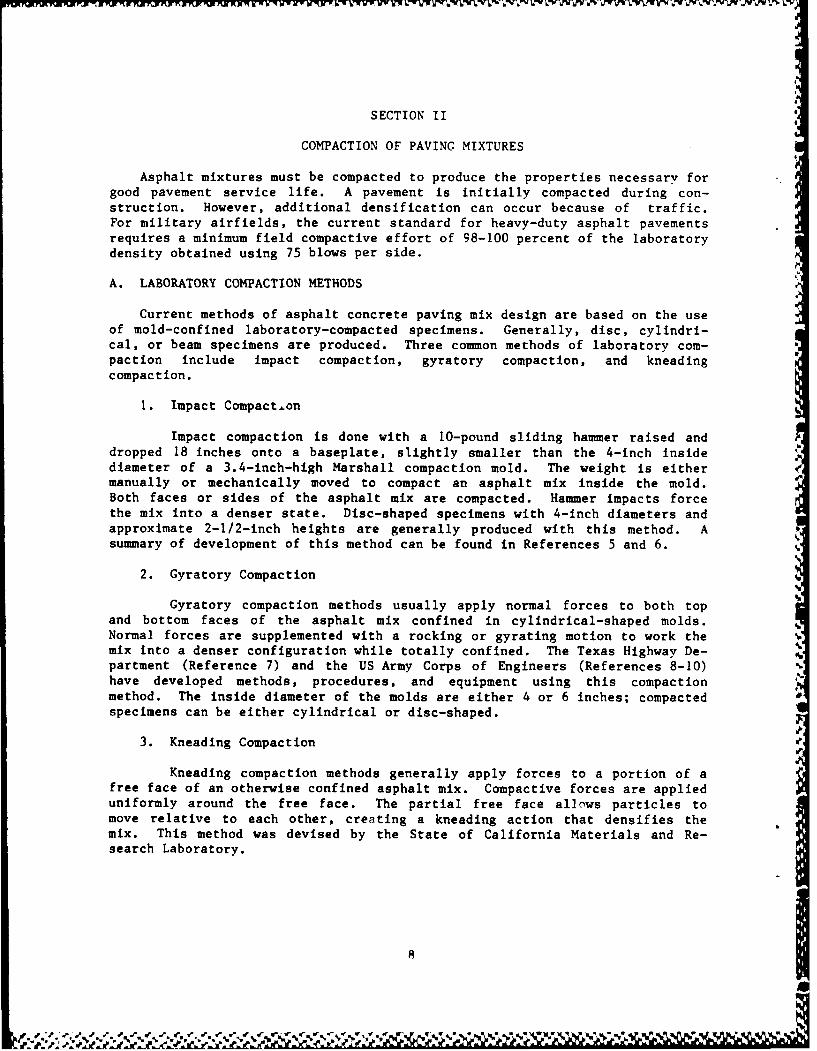


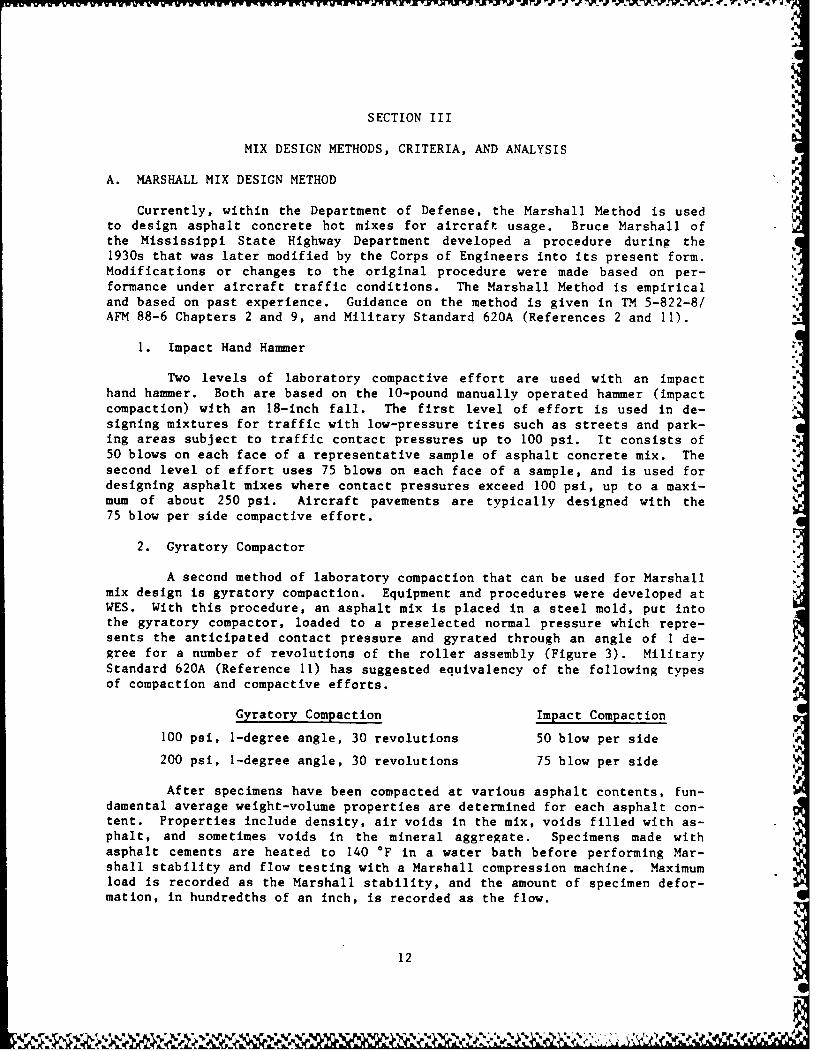
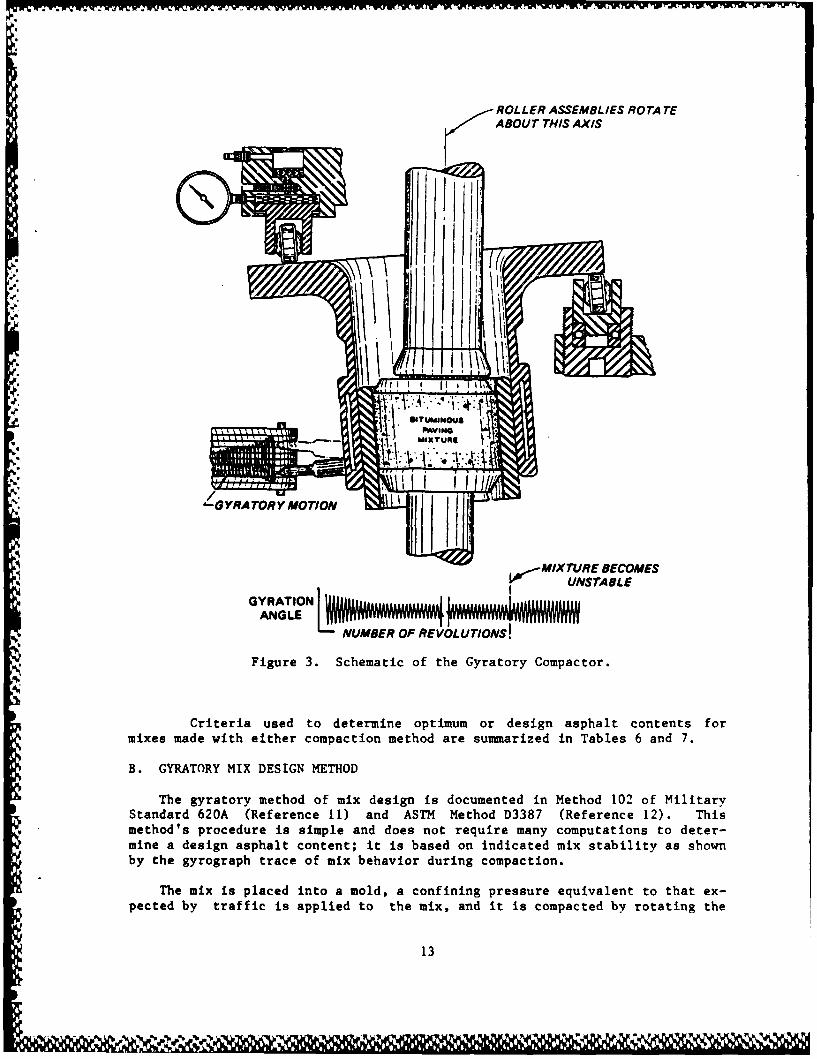
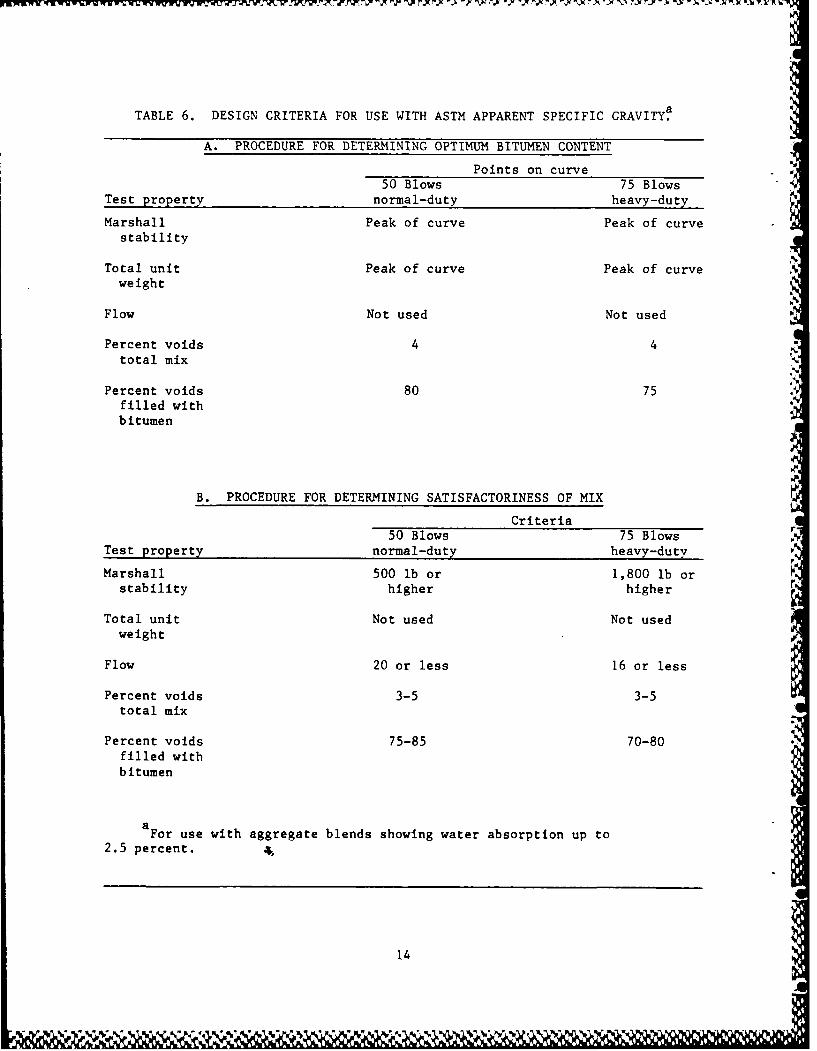


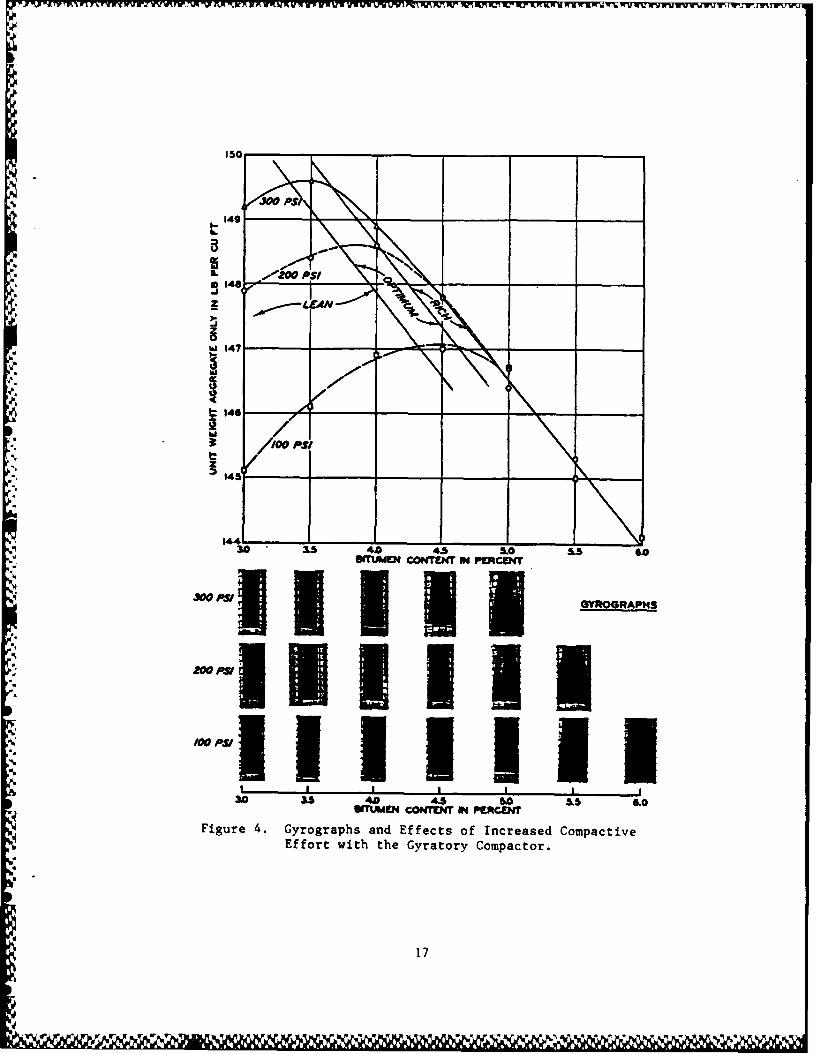


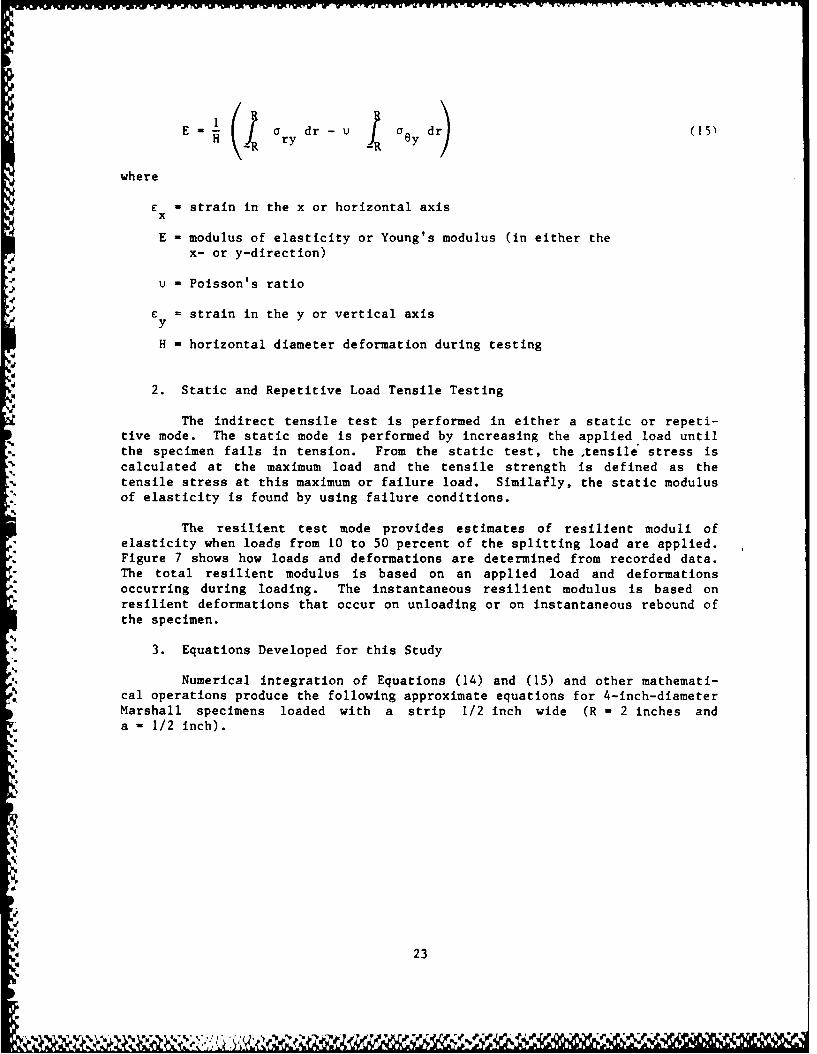


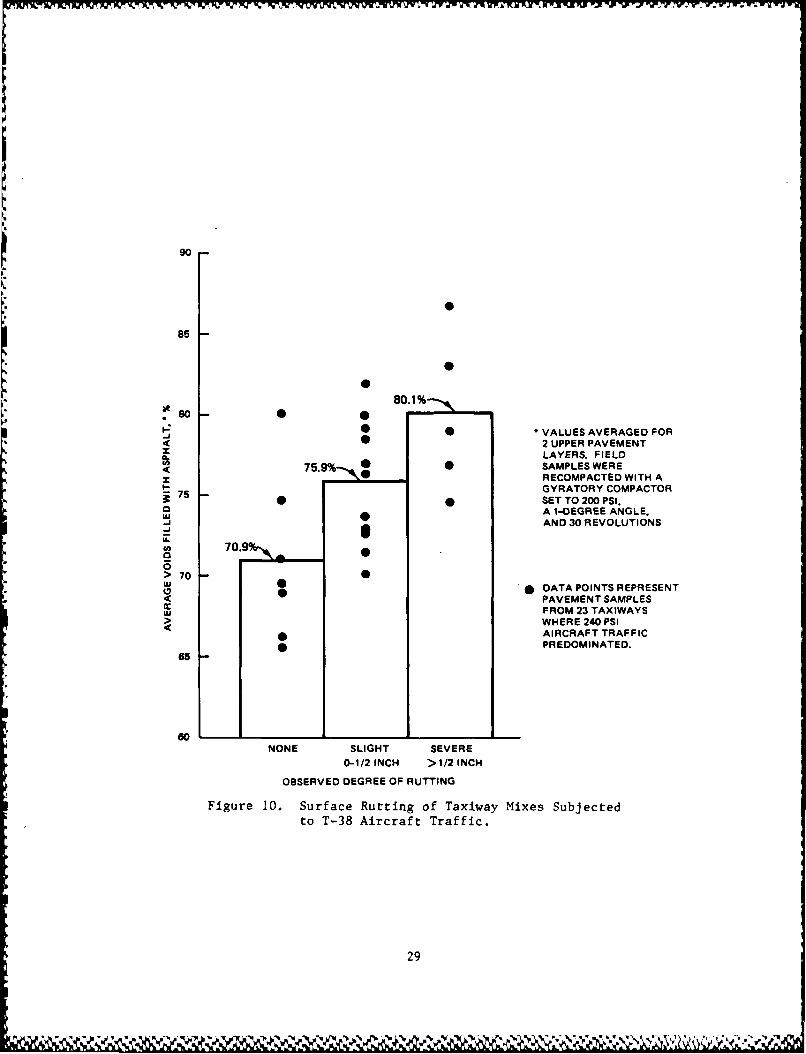


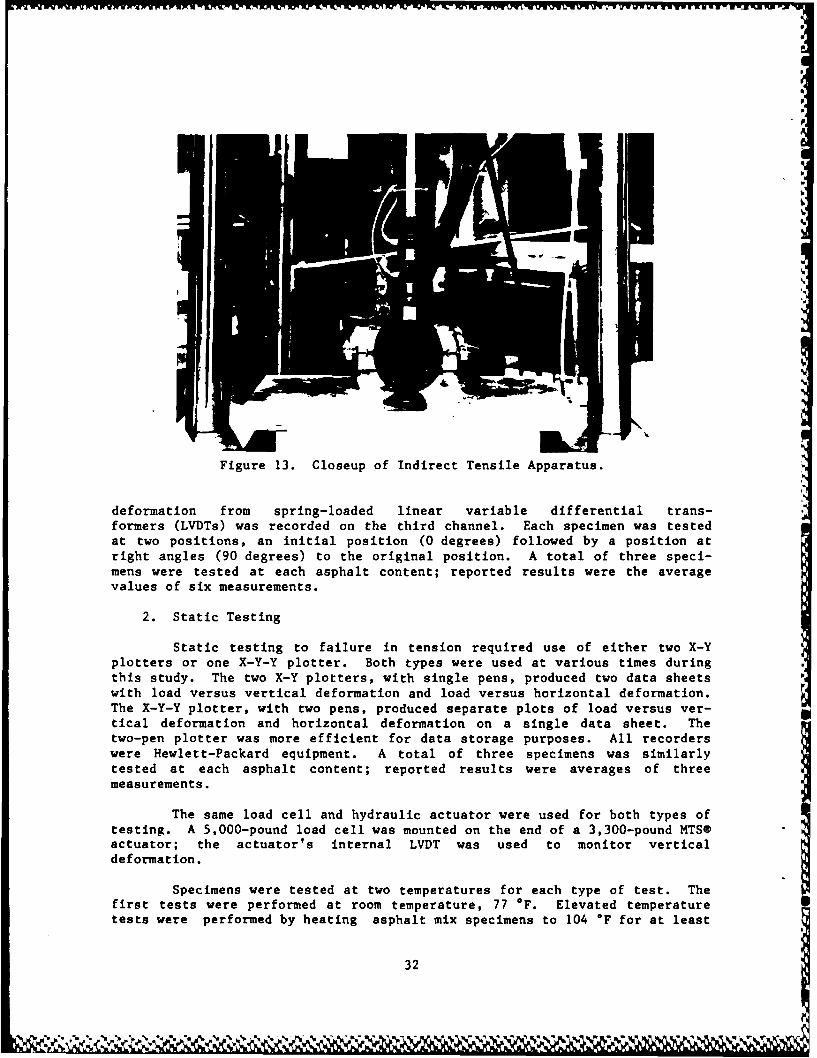

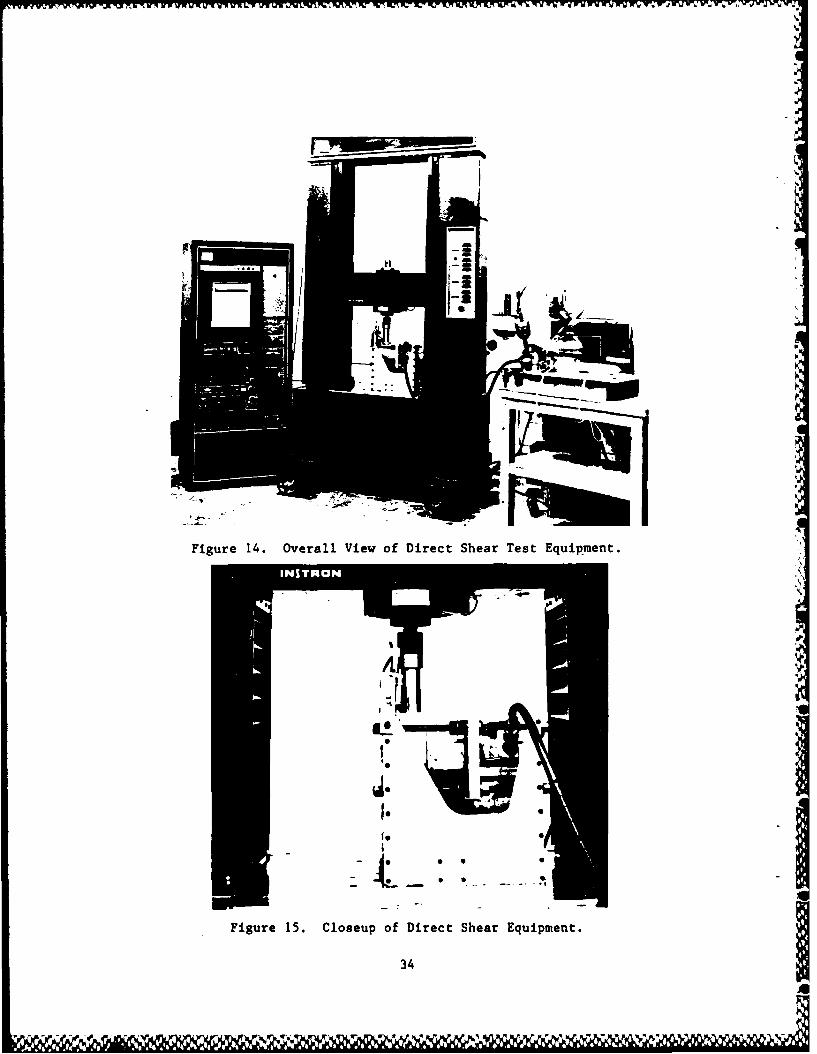

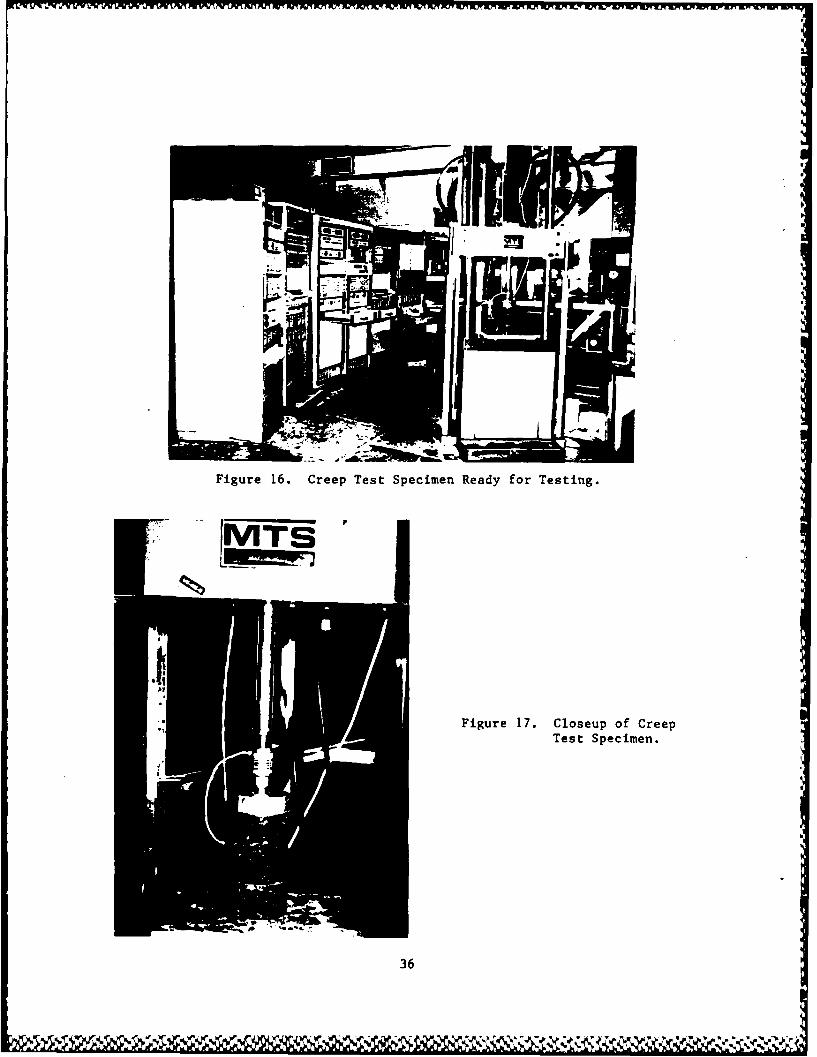

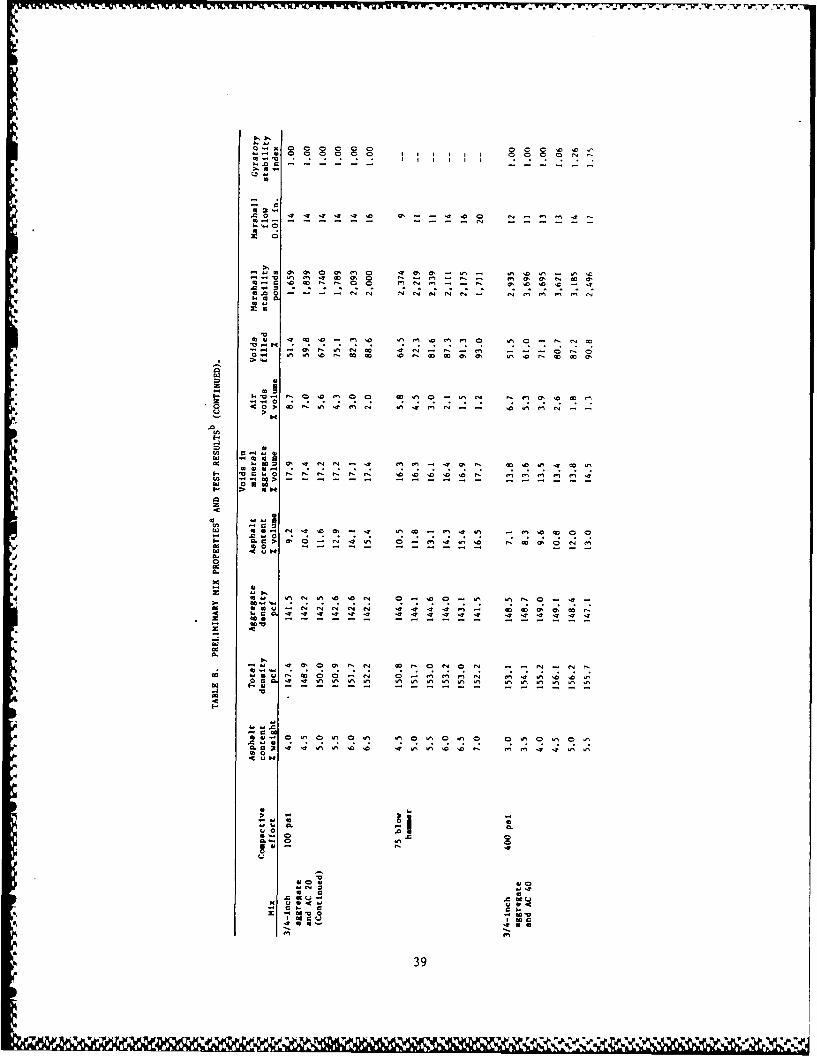

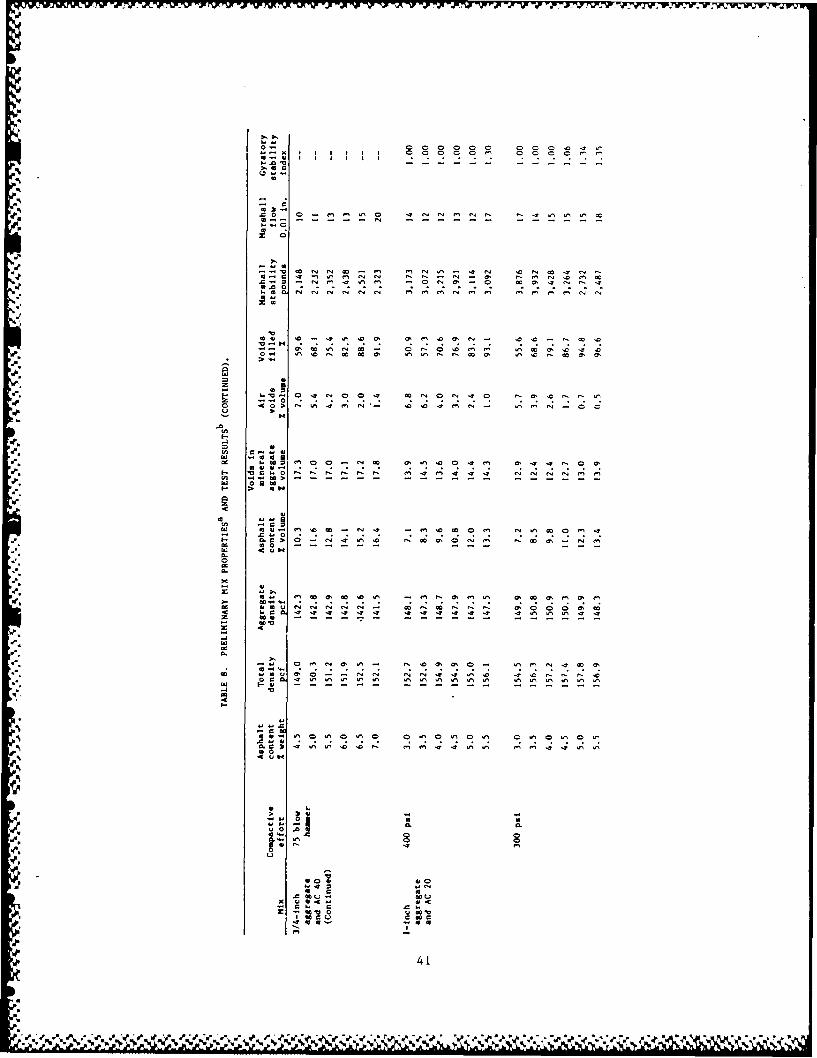
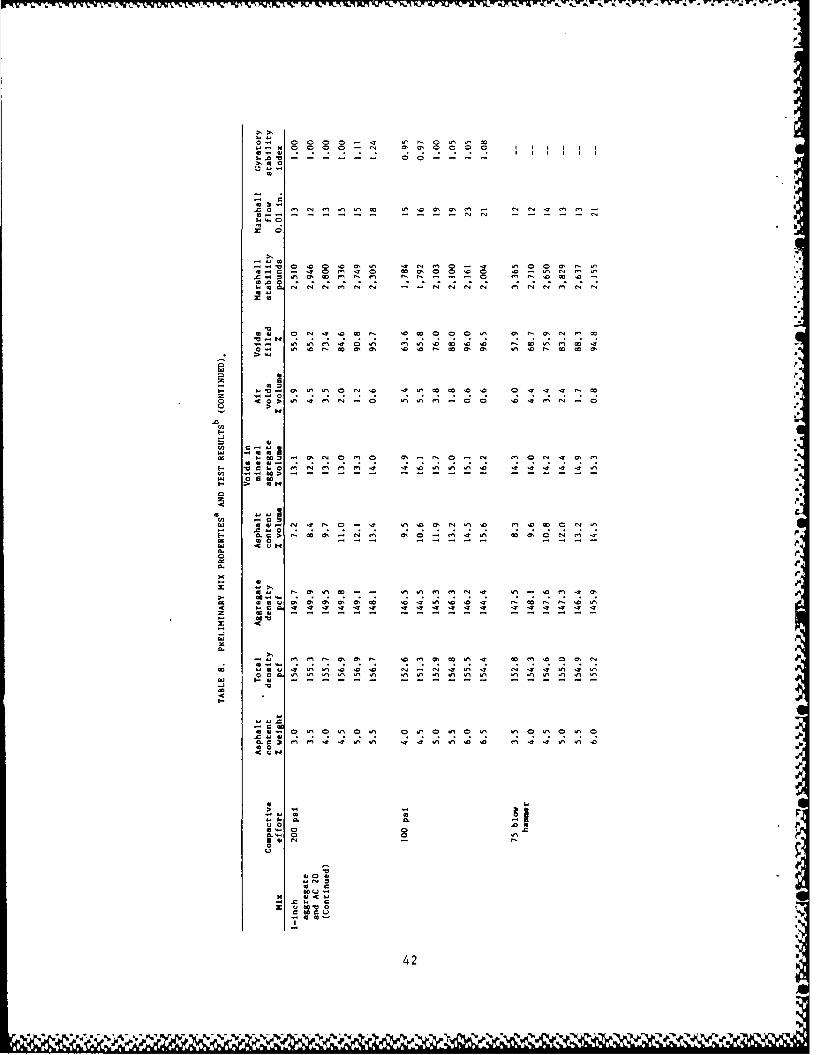
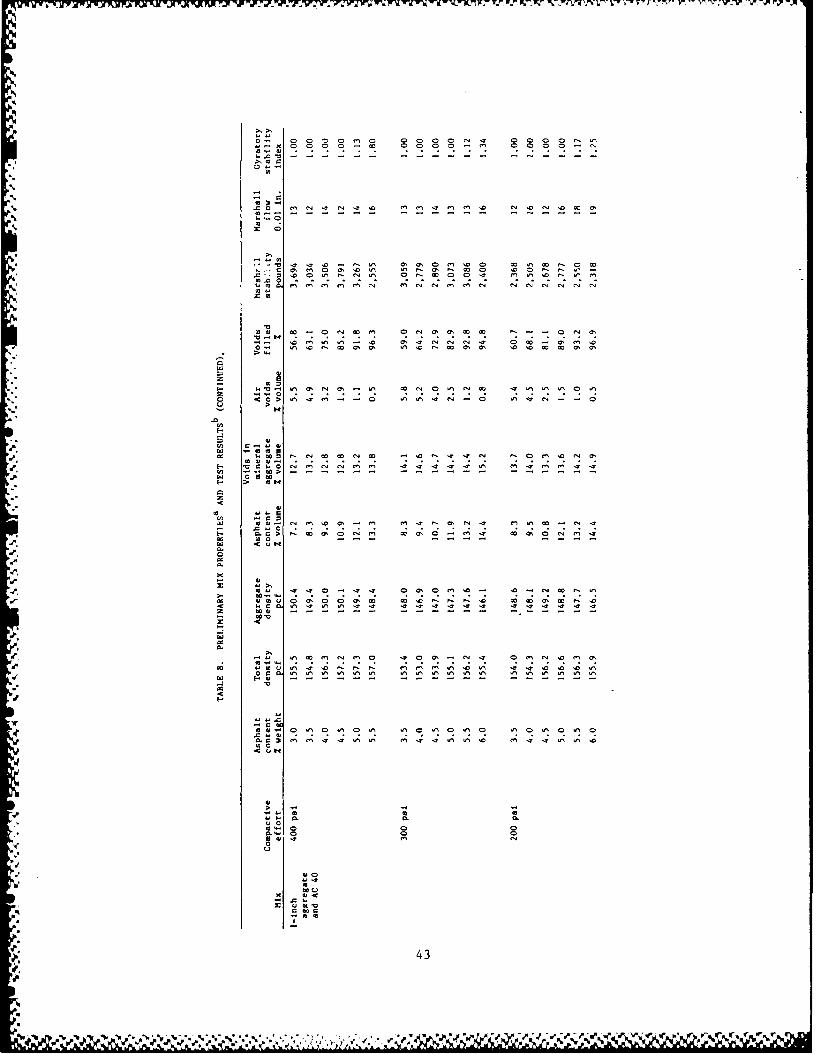
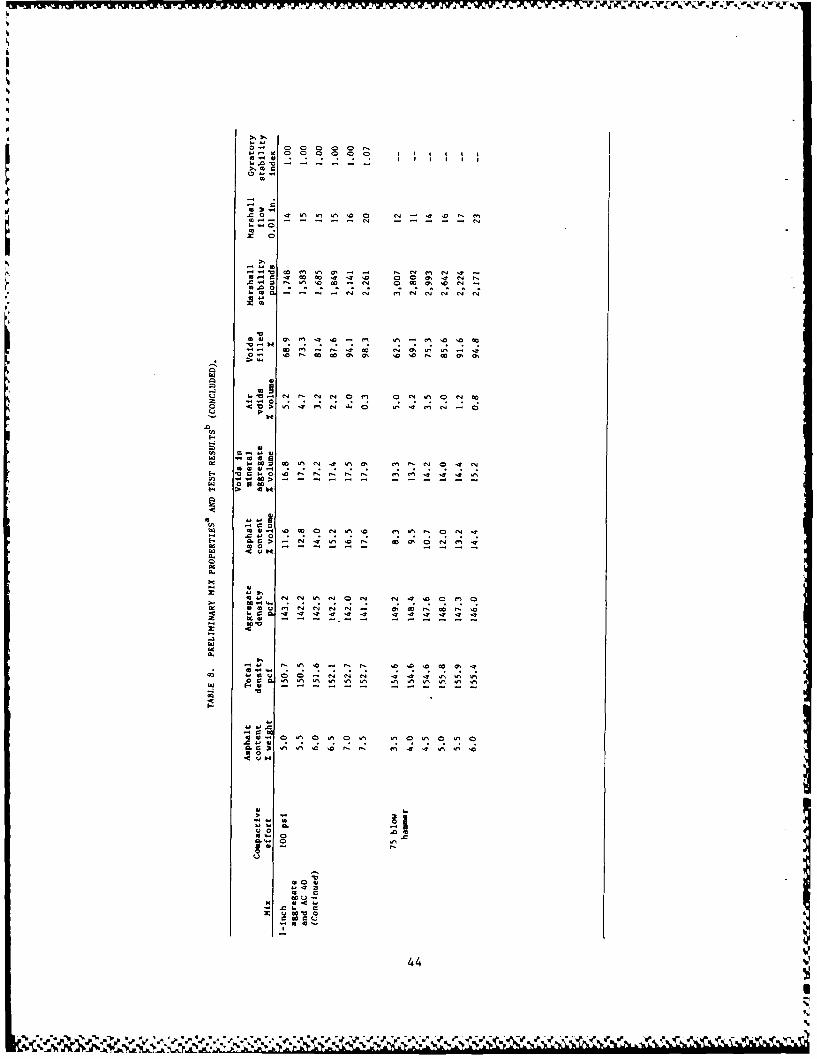
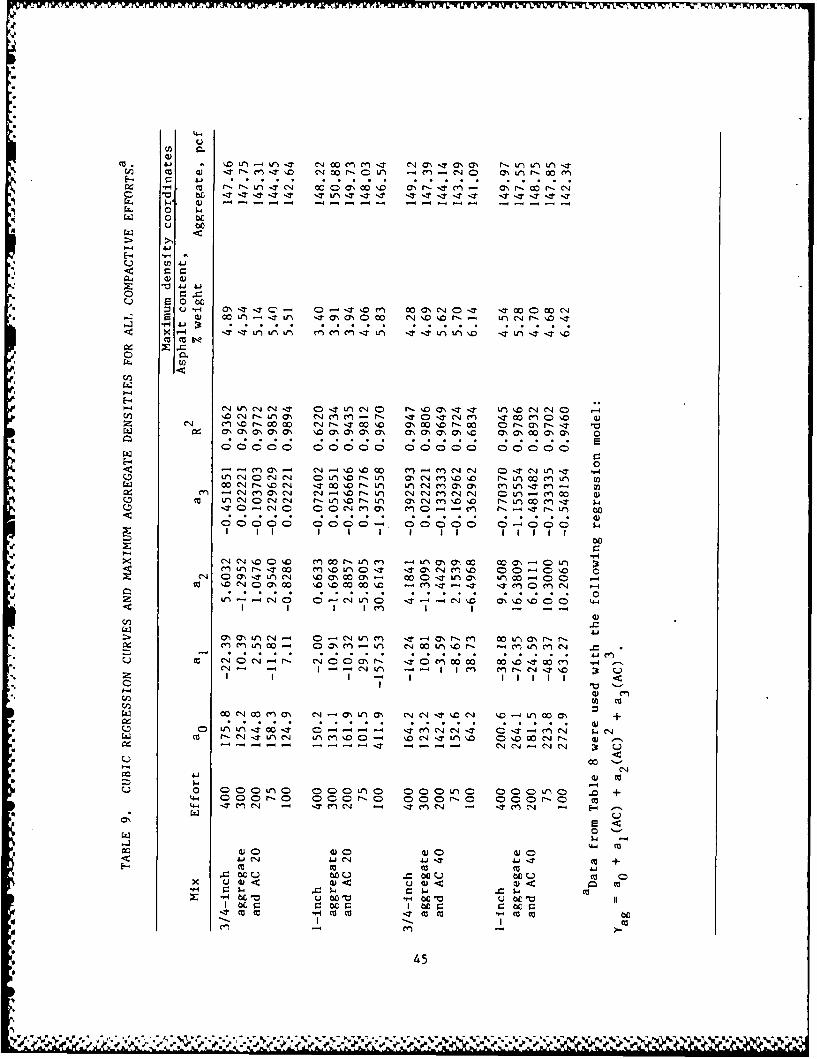
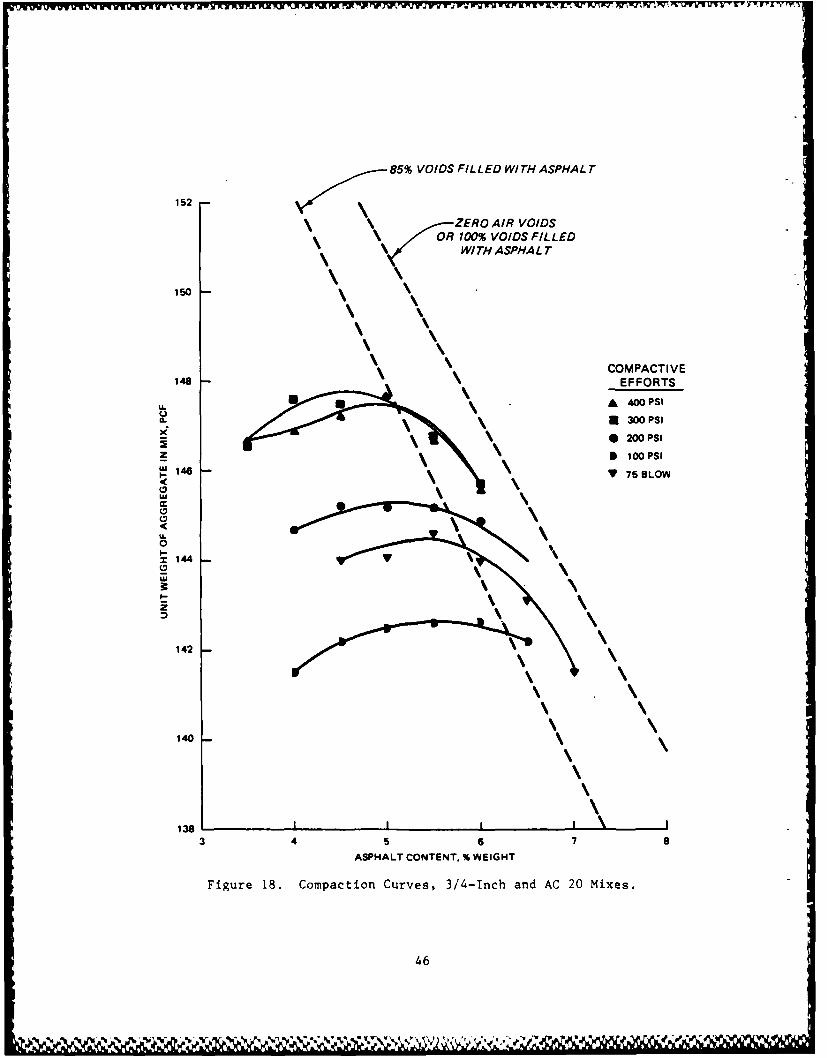
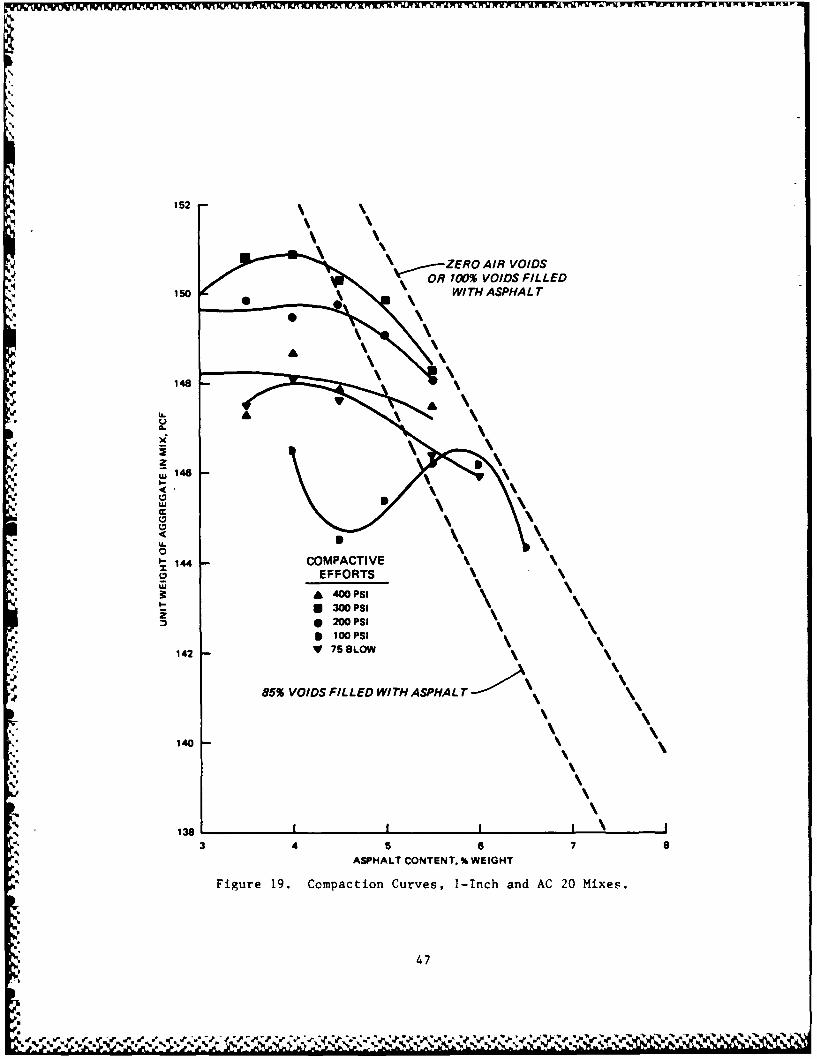
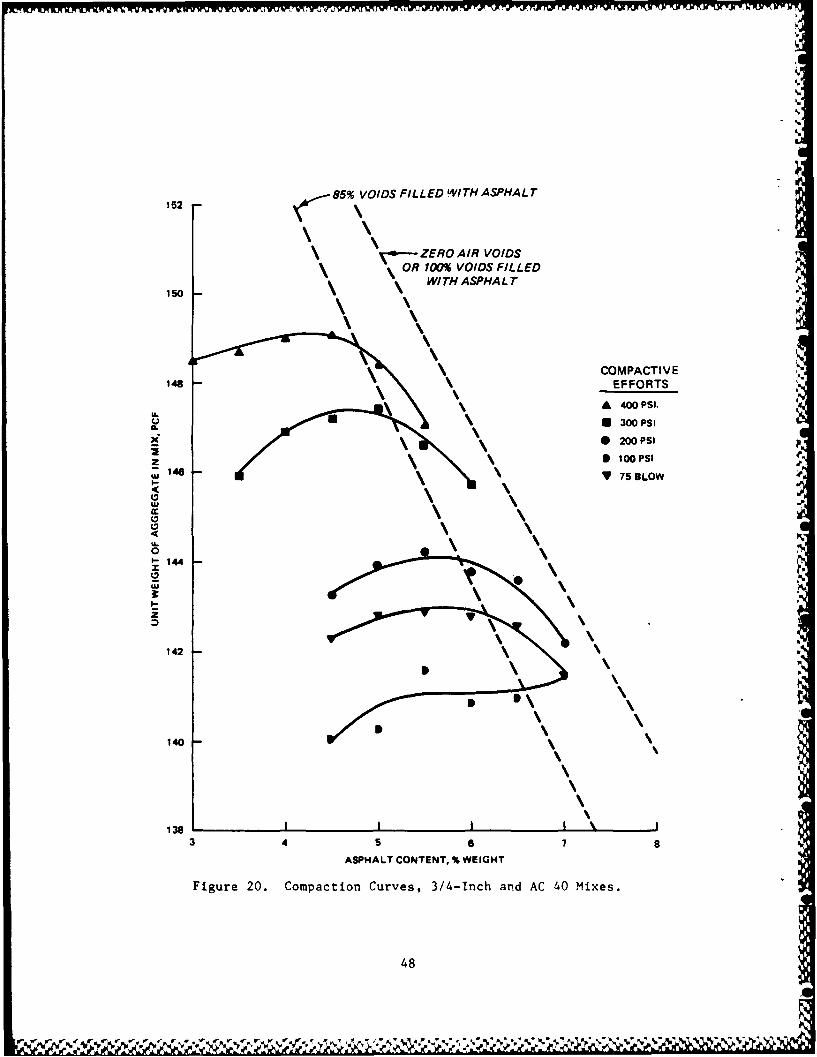

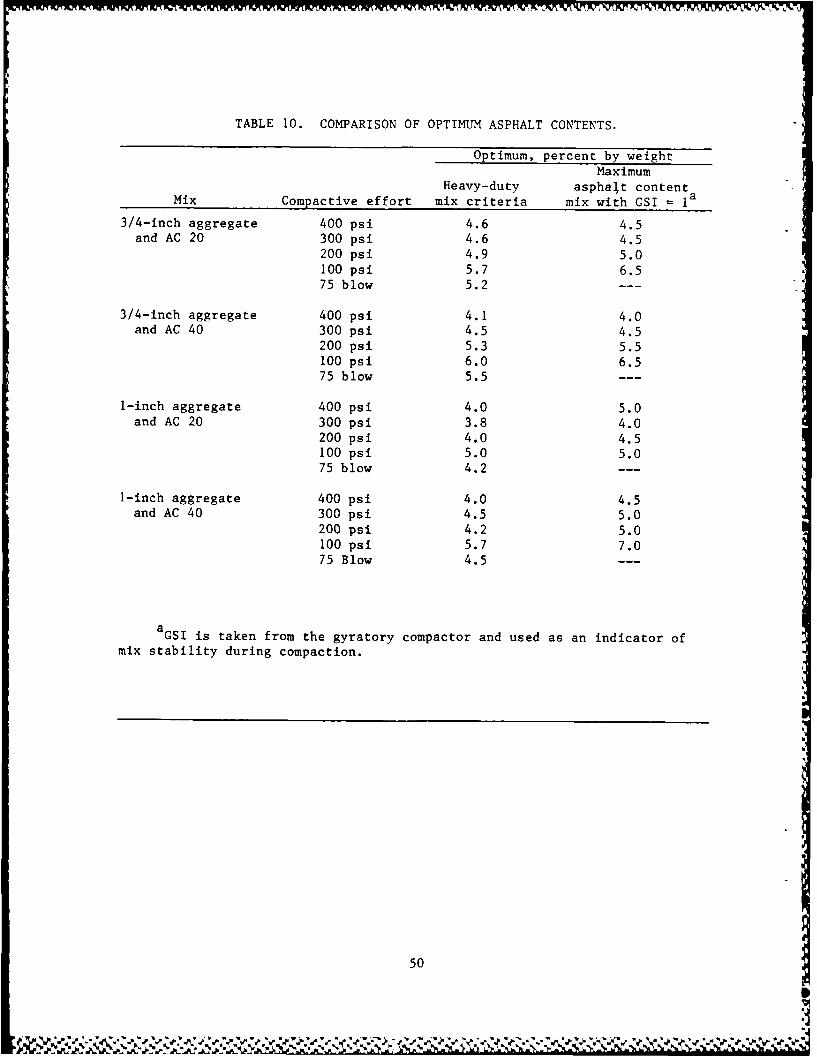


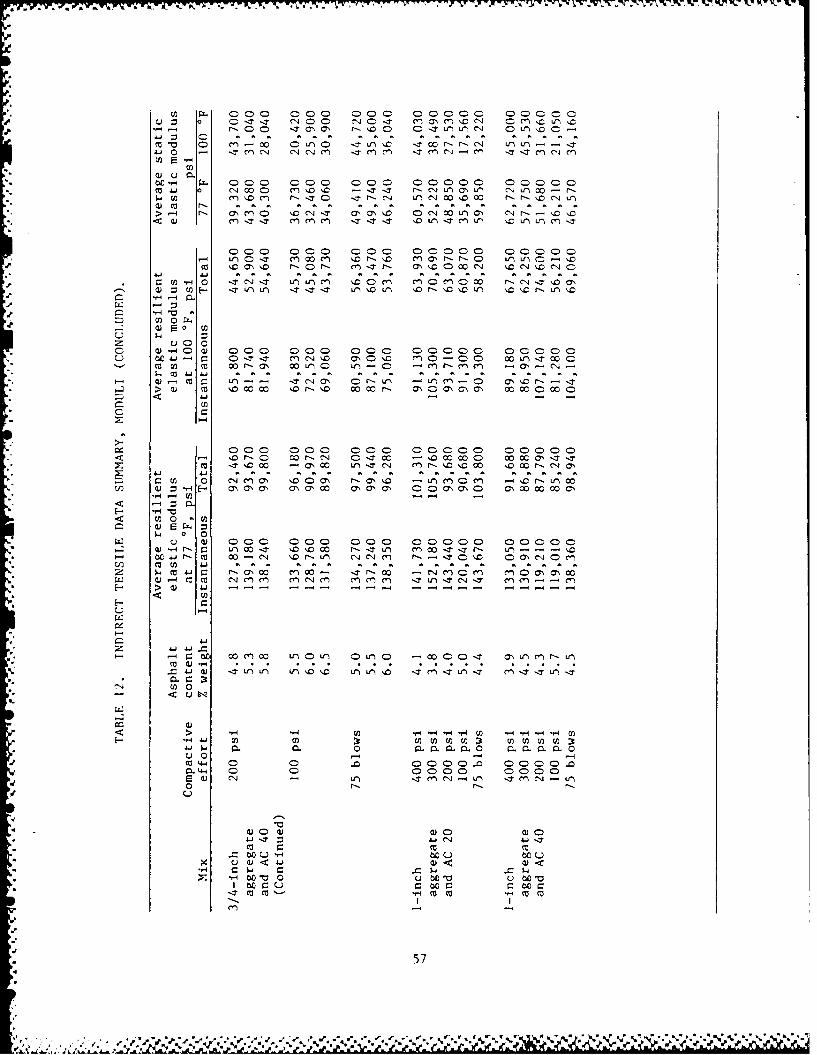
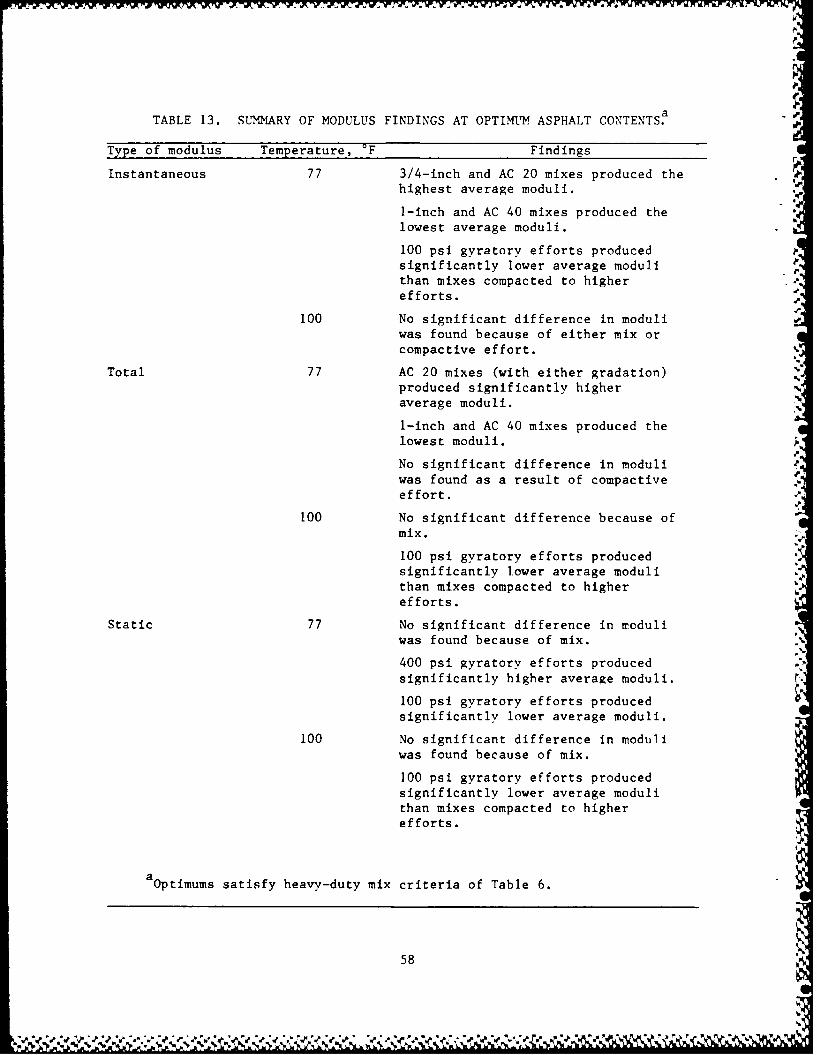

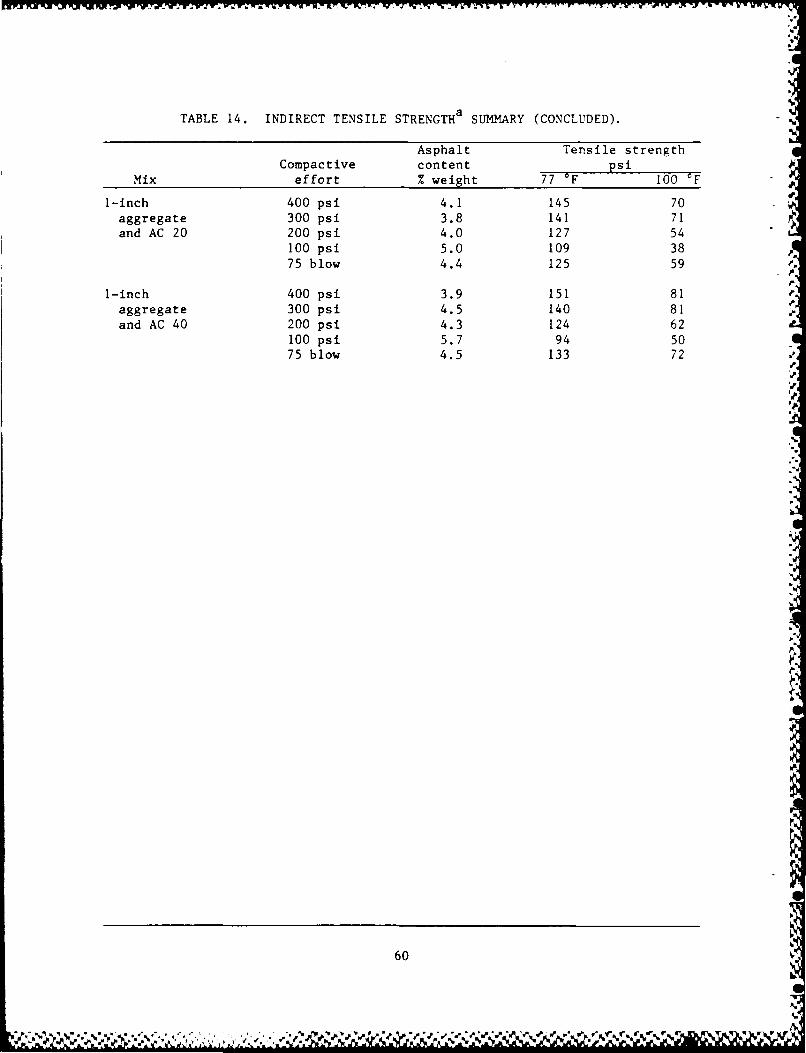


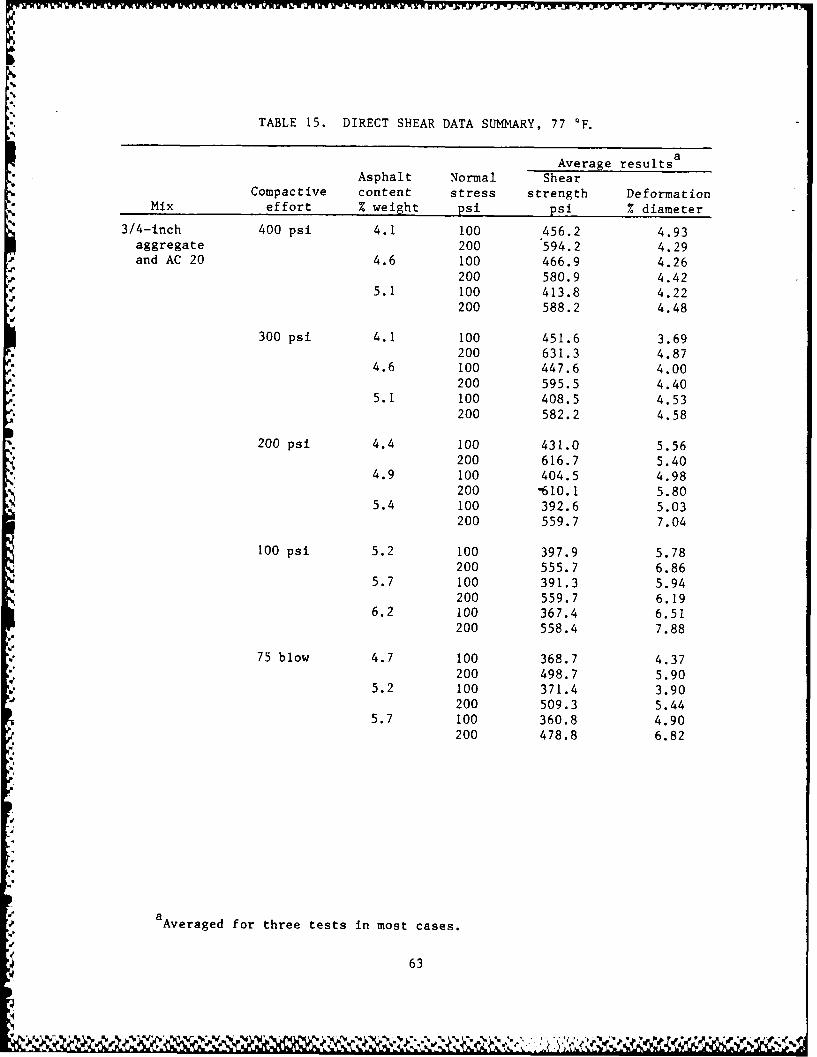
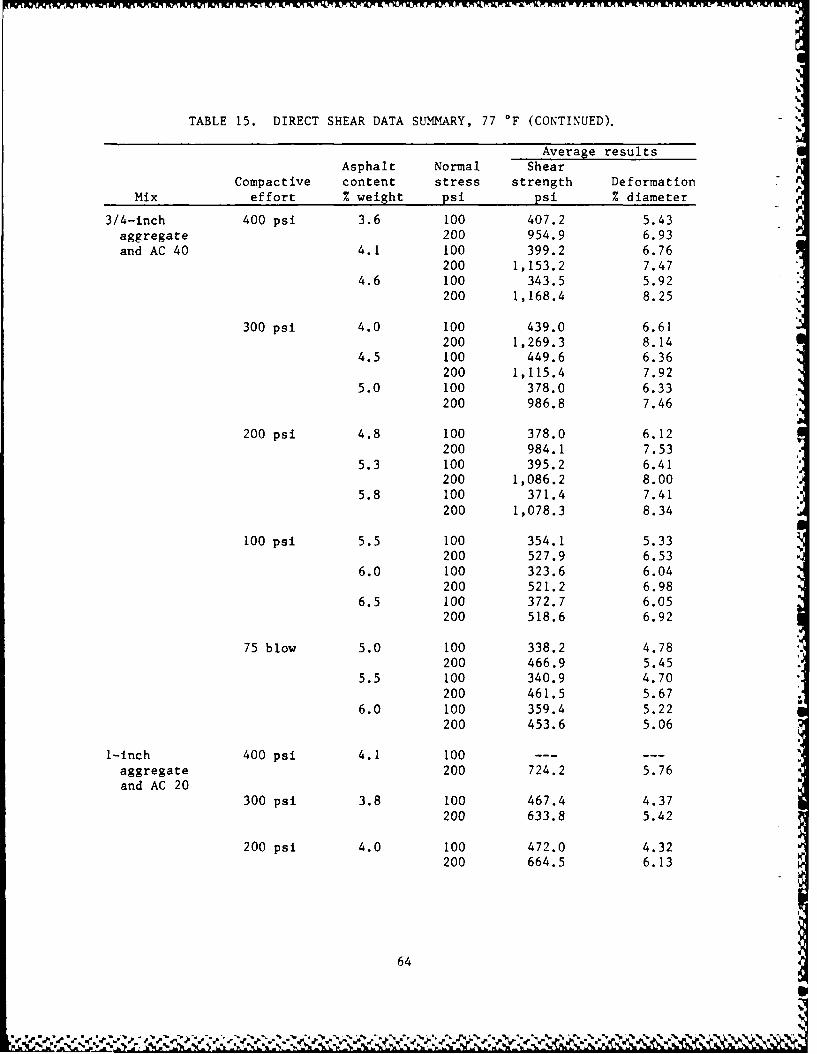

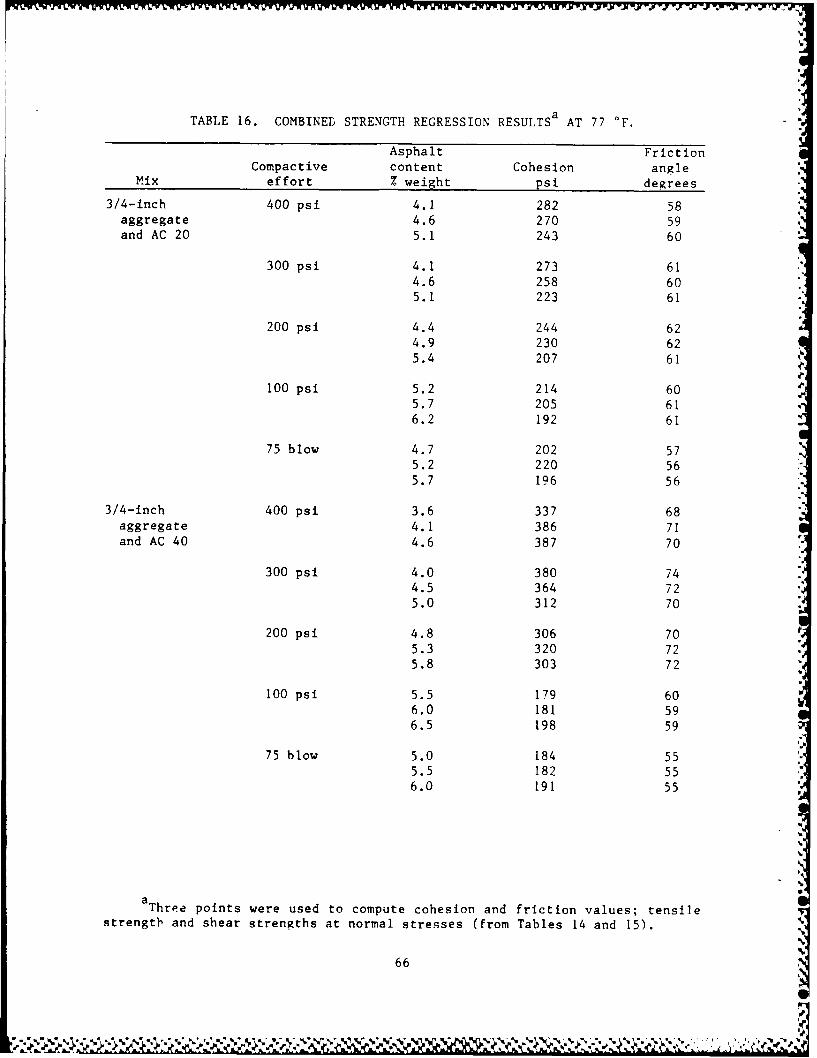
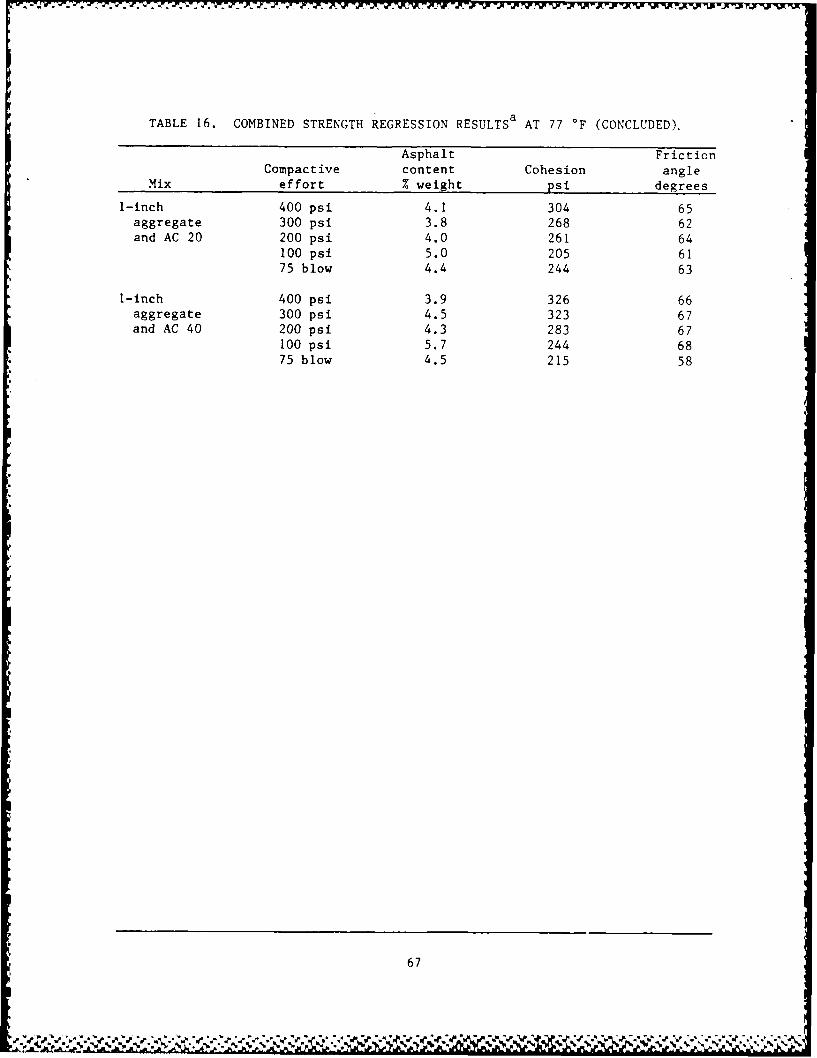
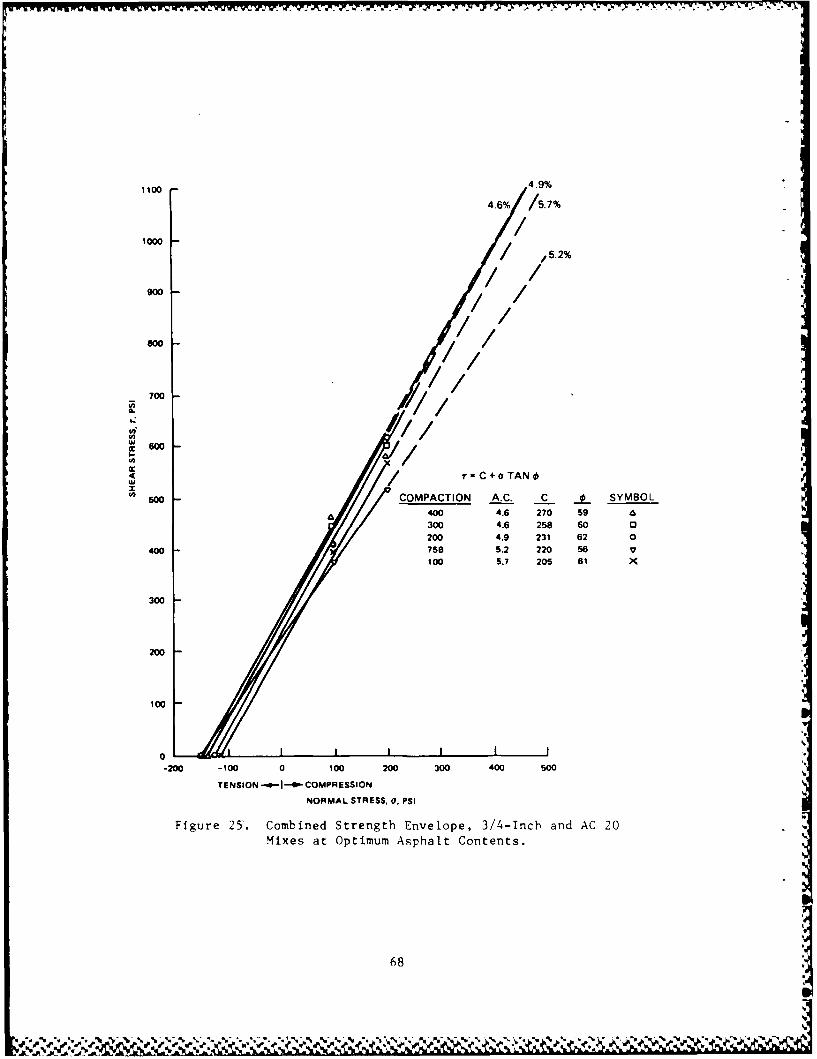
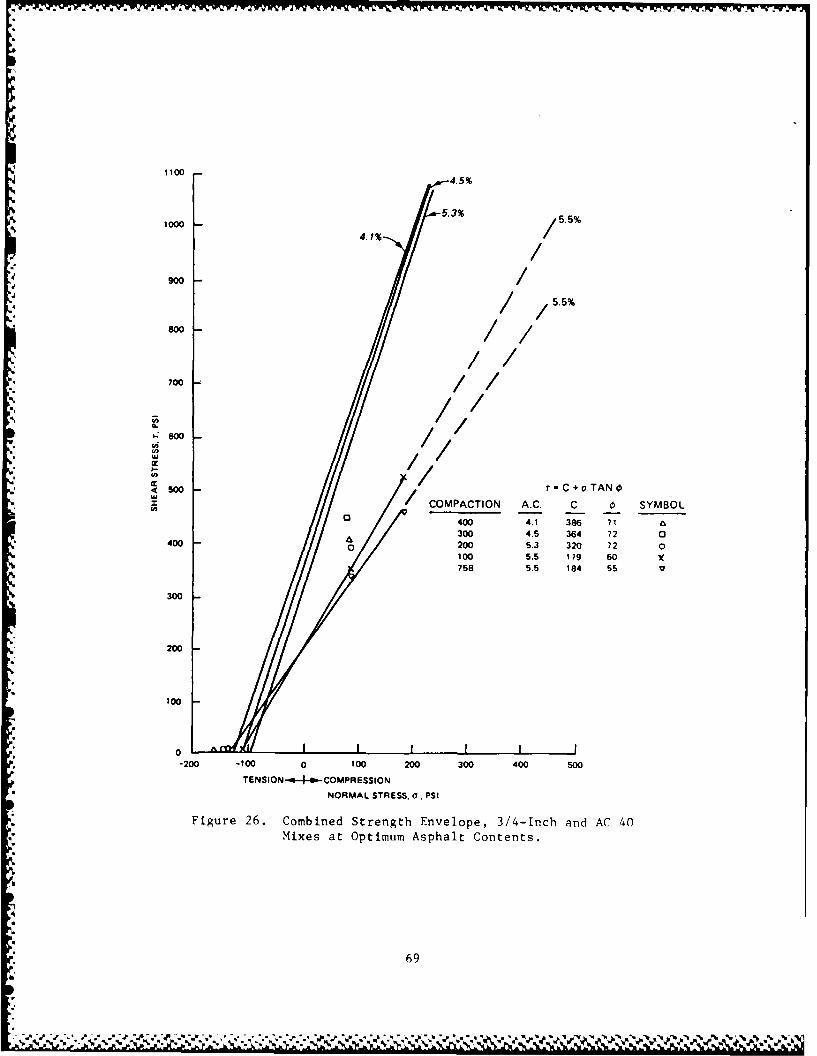
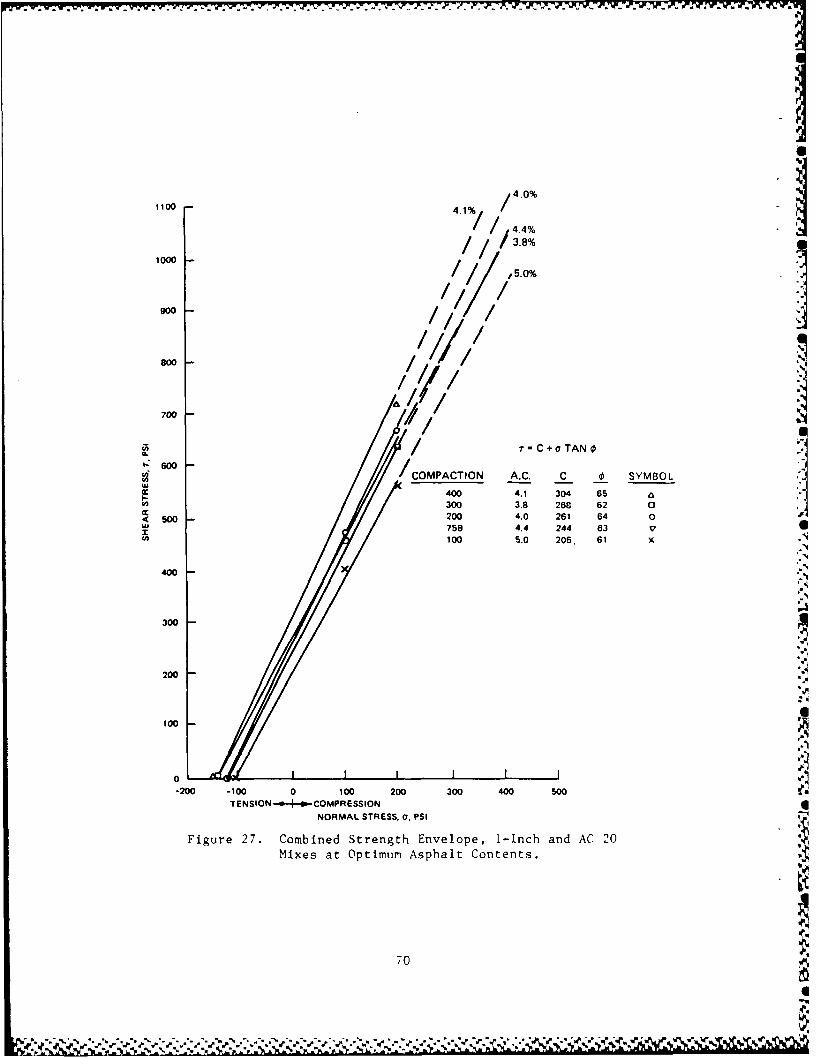
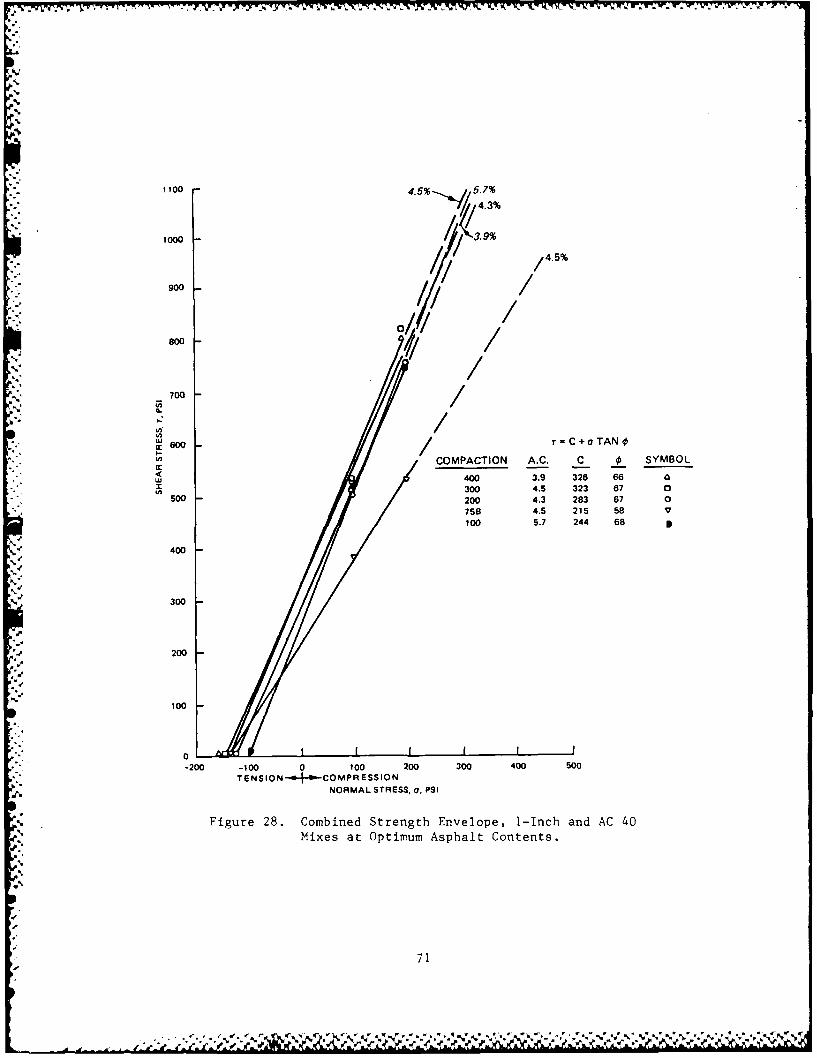


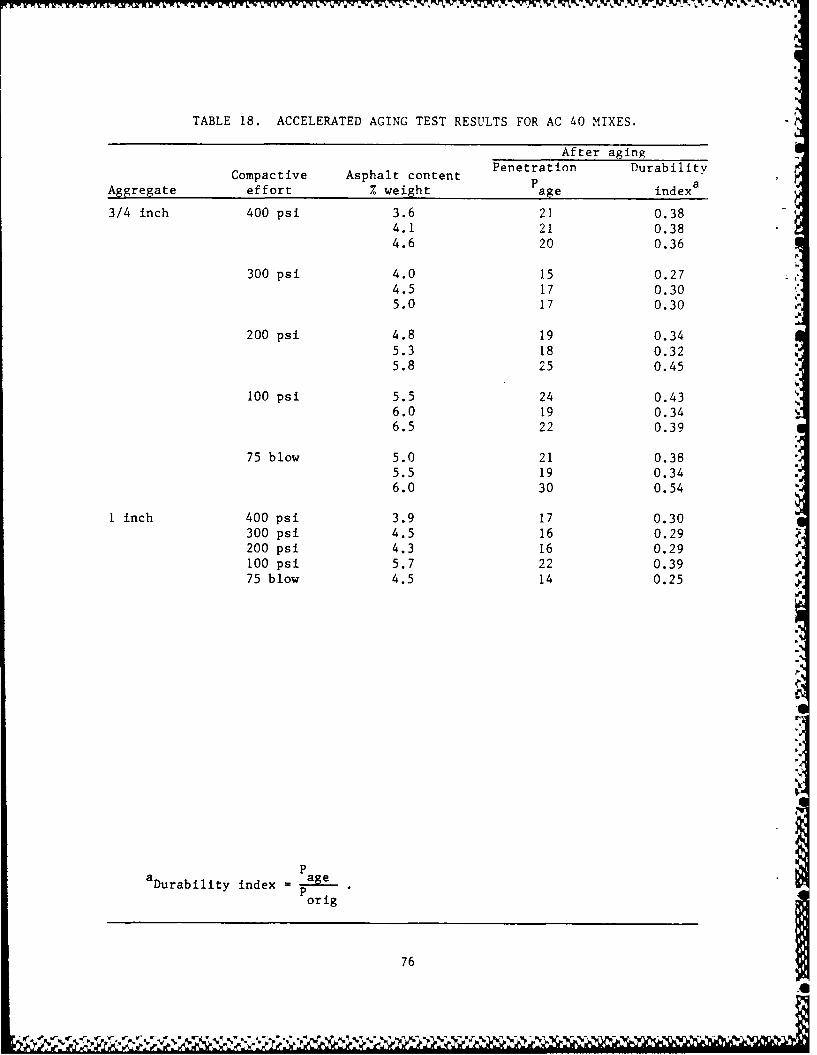
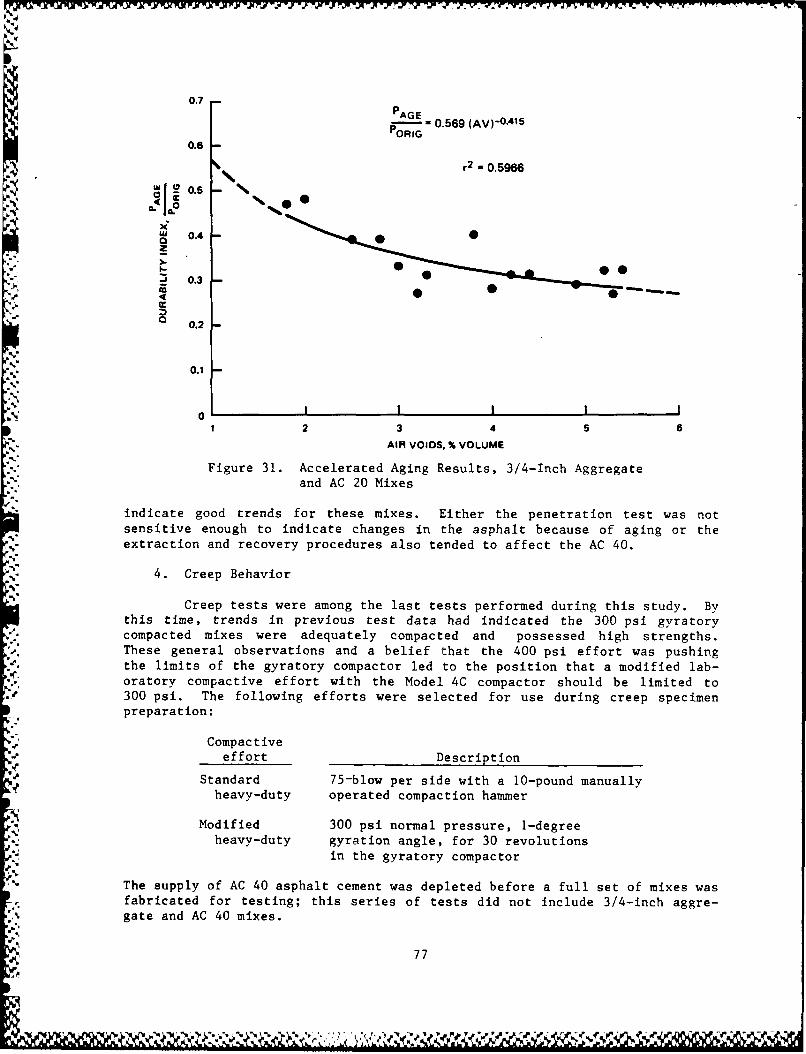


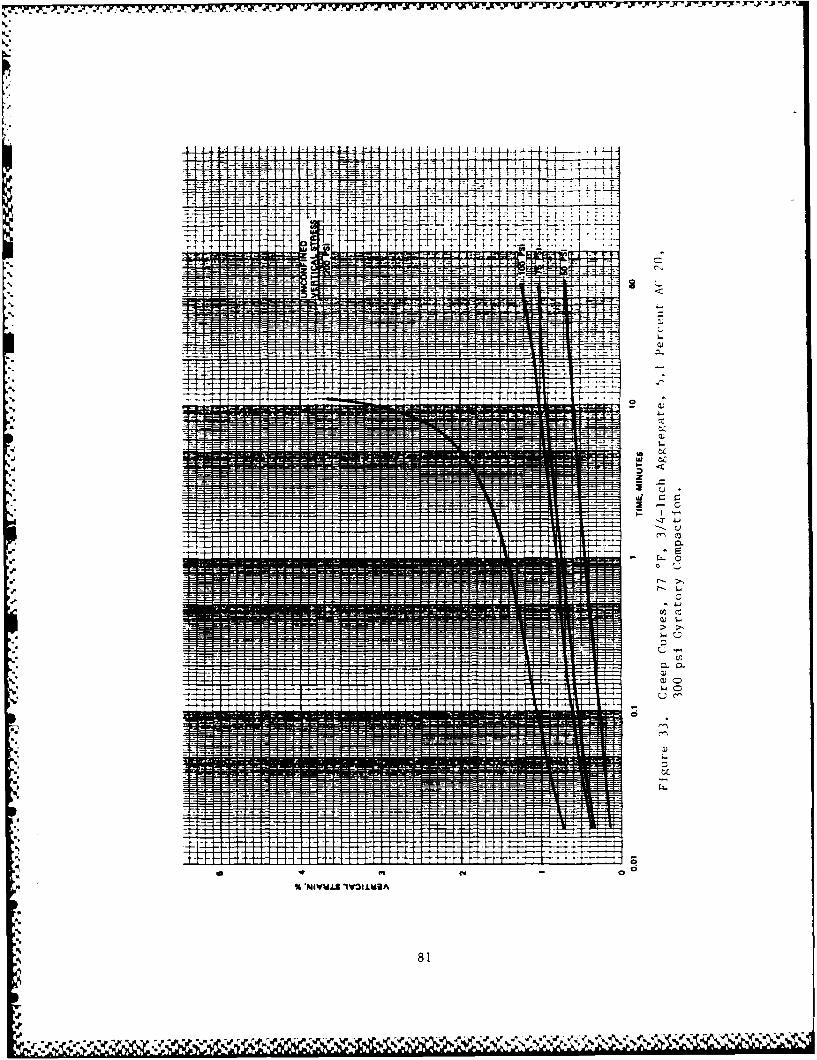


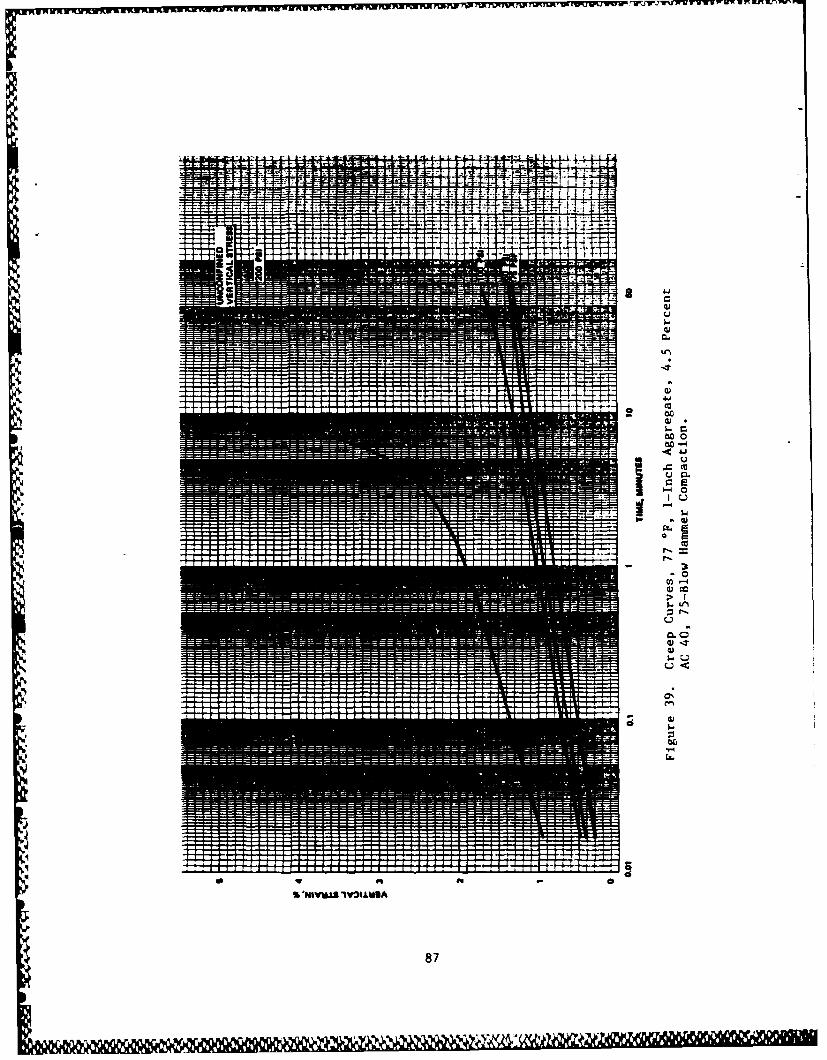

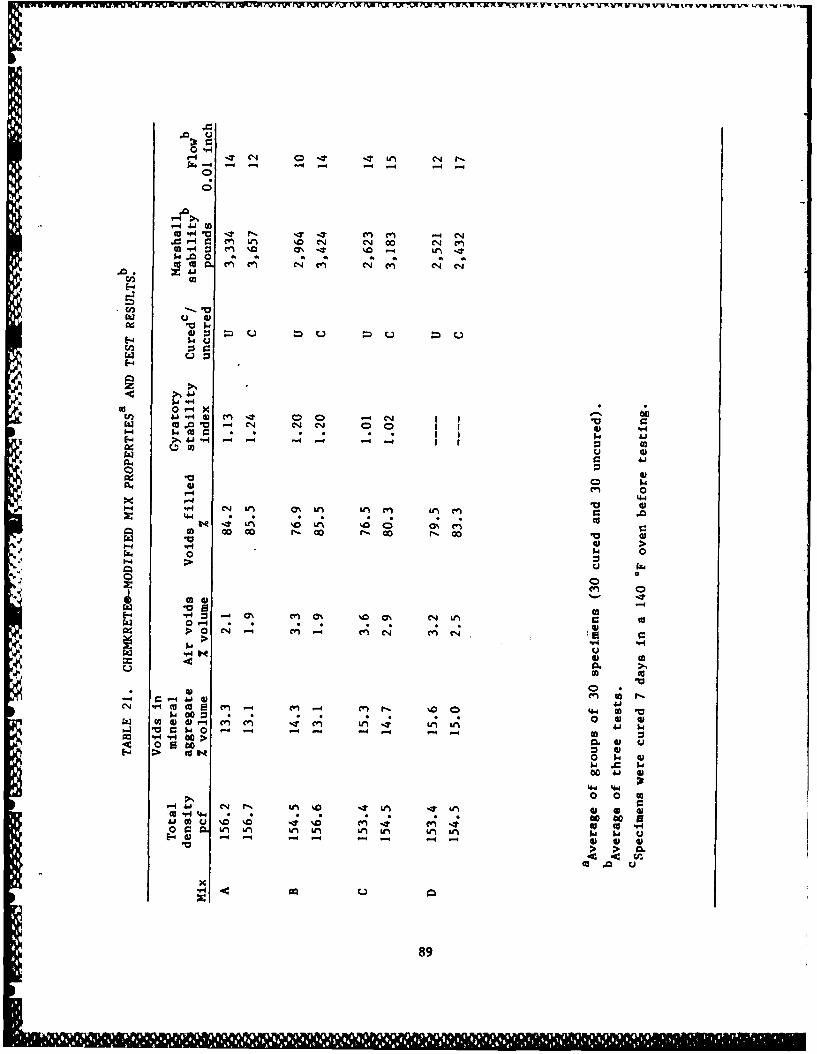

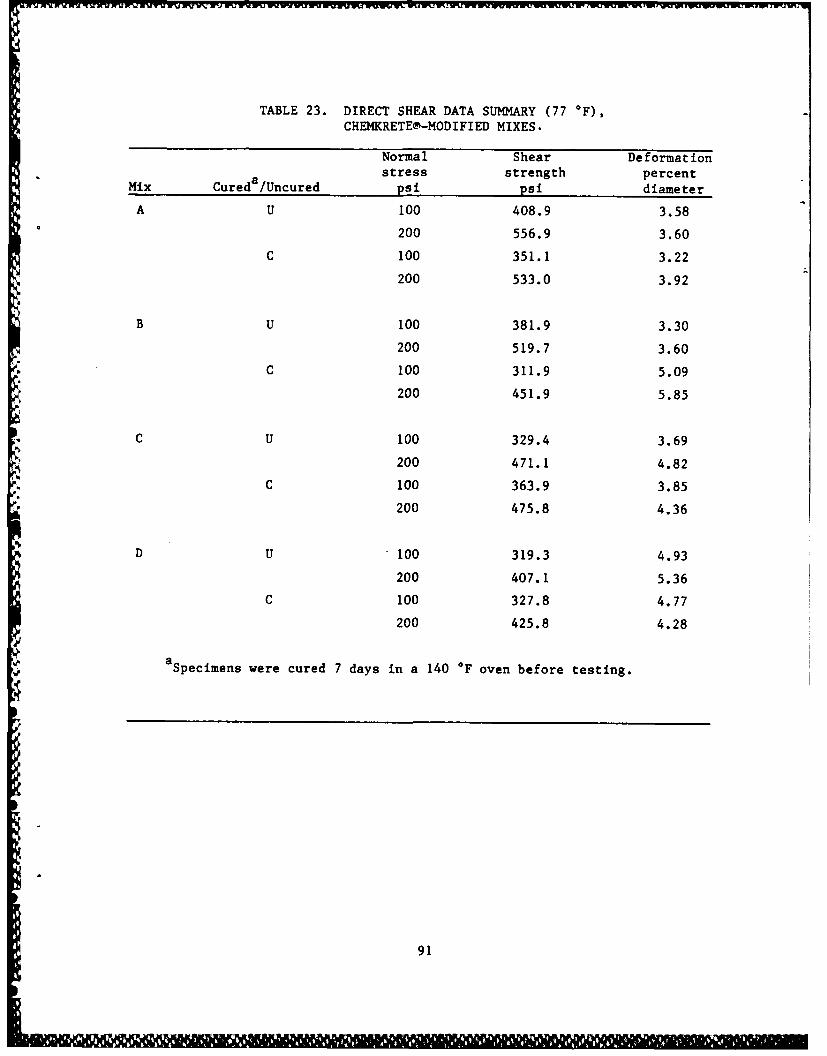


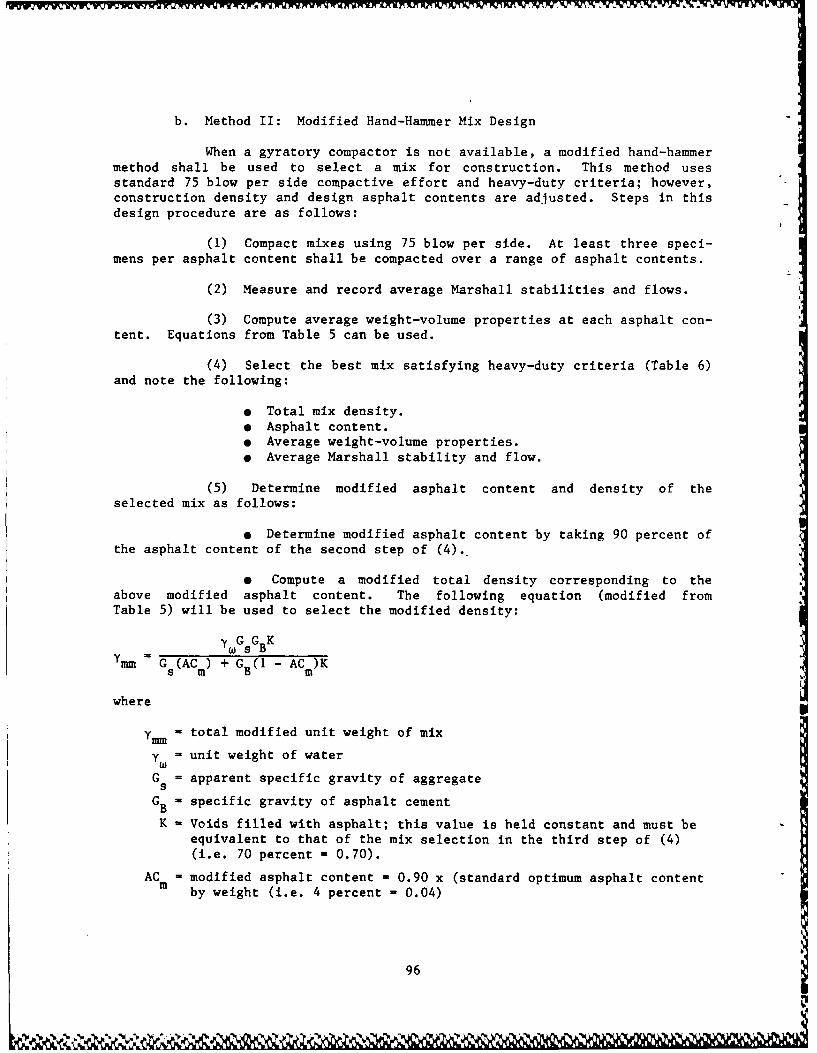
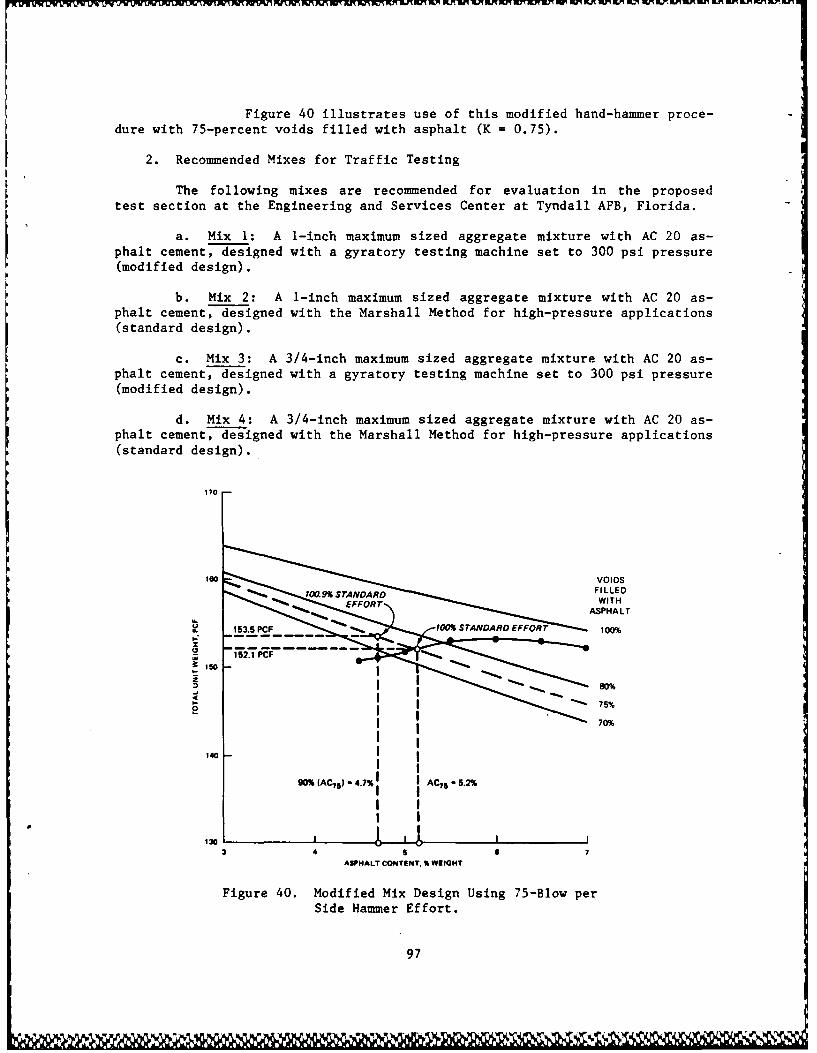


![V ]S - wonet.tistory.comwonet.tistory.com/attachment/cfile1.uf@9958F03D5BF3B2FA10847F.pdf · rases C] emotional fuel Indy E sap [2 charger drain damage . P ACTICE 8439-0070 Art is](https://static.documents.pub/doc/80x56/5c03643409d3f219408bf57f/v-s-wonet-9958f03d5bf3b2fa10847fpdf-rases-c-emotional-fuel-indy-e-sap.jpg)

