Health at a Glance 2011: OECD Indicators 1 WHY IS HEALTH SPENDING IN THE UNITED STATES SO HIGH? 1. Health spending in the United States is much higher than in other OECD countries The United States spends two-and-a-half times more than the OECD average health expenditure per person (Chart 1). It even spends twice as m uch as France, for example, a cou ntry which is generally accepted as having very good health serv ices. At 17.4% of GDP in 2009, US h ealth spending is half as much again a s any other country, and nearly twice t he average. Chart 1: Health expenditure per capita, public and private, 2009 (or nearest year) 7 9 6 0 5 3 5 2 5 1 4 4 4 9 1 4 4 8 0 8 4 3 6 3 4 3 4 8 4 2 8 9 4 2 1 8 3 9 7 8 3 9 4 6 3 7 8 1 3 7 2 2 3 5 3 8 3 4 8 7 3 4 4 5 3 2 3 3 3 2 2 6 3 1 3 7 3 0 6 7 2 9 8 3 2 8 7 8 2 7 2 4 2 5 7 9 2 5 0 8 2 1 6 5 2 1 0 8 2 0 8 4 1 8 7 9 1 5 1 1 1 3 9 4 1 3 9 3 1 1 8 6 1 0 3 6 9 4 3 9 1 8 9 0 2 8 6 2 3 0 8 1 3 2 9 9 0 2000 4000 6000 8000 U n i t e d S t a t e s N o r w a y S w i t z e r l a n d N e t h e r l a n d s L u x e m b o u r g ² C a n a d a D e n m a r k A u s t r i a G e r m a n y F r a n c e B e l g i u m ³ I r e l a n d S w e d e n I c e l a n d U n i t e d K i n g d o m A u s t r a l i a O E C D F i n l a n d I t a l y S p a i n N e w Z e a l a n d J a p a n G r e e c e S l o v e n i a P o r t u g a l I s r a e l C z e c h R e p u b l i c S l o v a k R e p u b l i c K o r e a H u n g a r y P o l a n d E s t o n i a C h i l e R u s s i a n F e d . B r a z i l M e x i c o T u r k e y S o u t h A f r i c a C h i n a I n d i a I n d o n e s i a USD PPP Public expendi tu re on he alth Private expendi t ur e on heal th 1. In the Netherlands, it is not possible to clearly distinguish the public and private share related to investments. 2. Health expenditure is for the insured populatio n rather than the resident population. 3. Total expenditure excluding invest ments. Note: Information on data for Israel: http://dx.doi.org/10.1787/888932315602 .Source: OECD Health Data 2011.
Transcript
7/29/2019 Oecd Why is Health Spending in the United States So High
WHY IS HEALTH SPENDING IN THE UNITED STATES SO HIGH?
1. Health spending in the United States is much higher than in other OECD countries
The United States spends two-and-a-half times more than the OECD average health expenditure per person(Chart 1). It even spends twice as much as France, for example, a country which is generally accepted ashaving very good health services. At 17.4% of GDP in 2009, US health spending is half as much again asany other country, and nearly twice the average.
Chart 1: Health expenditure per capita, public and private, 2009 (or nearest year)
7 9 6 0
5 3 5 2
5 1 4 4
4 9 1 4
4 8 0 8
4 3 6 3
4 3 4 8
4 2 8 9
4 2 1 8
3 9 7 8
3 9 4 6
3 7 8 1
3 7 2 2
3 5 3 8
3 4 8 7
3 4 4 5
3 2 3 3
3 2 2 6
3 1 3 7
3 0 6 7
2 9 8 3
2
8 7 8
2 7
2 4
2 5 7
9
2 5 0
8
2 1 6 5
2 1 0 8
2 0 8 4
1 8 7 9
1 5 1 1
1 3 9 4
1 3 9 3
1 1 8 6
1 0 3 6
9 4 3
9 1 8
9 0 2
8 6 2
3 0 8
1 3 2
9 9
0
2000
4000
6000
8000
U n i t e d S t a t e s
N o r w a y
S w i t z e r l a n d
N e t h e r l a n d s ¹
L u x e m b o u r g ²
C a n a d a
D e n m a r k
A u s t r i a
G e r m a n y
F r a n c e
B e l g i u m ³
I r e l a n d
S w e d e n
I c e l a n d
U n i t e d K i n g d o m
A u s t r a l i a
O E C D
F i n l a n d
I t a l y
S p a i n
N e w Z e a l a n d
J a p a n
G r e e c e
S l o v e n i a
P o r t u g a l
I s r a e l
C z e c h R e p u b l i c
S l o v a k R e p u b l i c
K o r e a
H u n g a r y
P o l a n d
E s t o n i a
C h i l e
R u s s i a n F e d .
B r a z i l
M e x i c o
T u r k e y
S o u t h A f r i c a
C h i n a
I n d i a
I n d o n e s i a
USD PPP
Public expenditure on health Private expenditure on health
1. In the Netherlands, it is not possible to clearly distinguish the public and private share related to investments.2. Health expenditure is for the insured population rather than the resident population.3. Total expenditure excluding investments. Note: Information on data for Israel: http://dx.doi.org/10.1787/888932315602 . Source: OECD Health Data 2011.
Chart 2: Total health expenditure as a share of GDP, 2009 (or nearest year)
1 7 . 4
1 2 . 0
1 1 . 8
1 1 . 6
1 1 . 5
1 1 . 4
1 1 . 4
1 1 . 0
1 0 . 9
1 0 . 3
1 0 . 1
1 0 . 0
9 . 8
9 . 7 9 . 6 9 . 6 9 .
6
9 . 5 9 . 5 9 . 5
9 . 3
9 . 2 9 . 1 9 . 0
8 . 7
8 . 5 8 . 5 8 . 4
8 . 2
7 . 9 7 . 8
7 . 4
7 . 4
7 . 0
6 . 9
6 . 4
6 . 1
5 . 4
4 . 6
4 . 2
2 . 4
0
2
4
6
8
10
12
14
16
18
20
U n i t e d S t a t e s
N e t h e r l a n d s ¹
F r a n c e
G e r m a n y
D e n m a r k
C a n a d a
S w i t z e r l a n d
A u s t r i a
B e l g i u m ²
N e w Z e a l a n d
P o r t u g a l
S w e d e n
U n i t e d K i n g d o m
I c e l a n d
G r e e c e
N o r w a y
O E C D
I r e l a n d
I t a l y
S p a i n
S l o v e n i a
F i n l a n d
S l o v a k R e p .
B r a z i l
A u s t r a l i a
J a p a n
S o u t h A f r i c a
C h i l e
C z e c h R e p .
I s r a e l
L u x e m b o u r g ³
H u n g a r y
P o l a n d
E s t o n i a
K o r e a
M e x i c o
T u r k e y
R u s s i a n F e d .
C h i n a
I n d i a
I n d o n e s i a
% of GDP Public Private
1. In the Netherlands, it is not possible to clearly distinguish the public and private share related to investments. 2. Totalexpenditure excluding investments. 3. Health expenditure is for the insured population rather than the resident population. Note: Information on data for Israel: http://dx.doi.org/10.1787/888932315602 . Source: OECD Health Data 2011.
Rich countries spend more than poor countries. Chart 3 shows that for nearly every country, if you knowhow rich they are, you can predict their health spending per person per year to within a few hundreddollars. The United States is an exception – Americans spend nearly $3000 per person per year more than
Swiss people, even though Swiss people have about the same level of income.
Chart 3: Total health expenditure per capita and GDP per capita, 2009 (or nearest year)
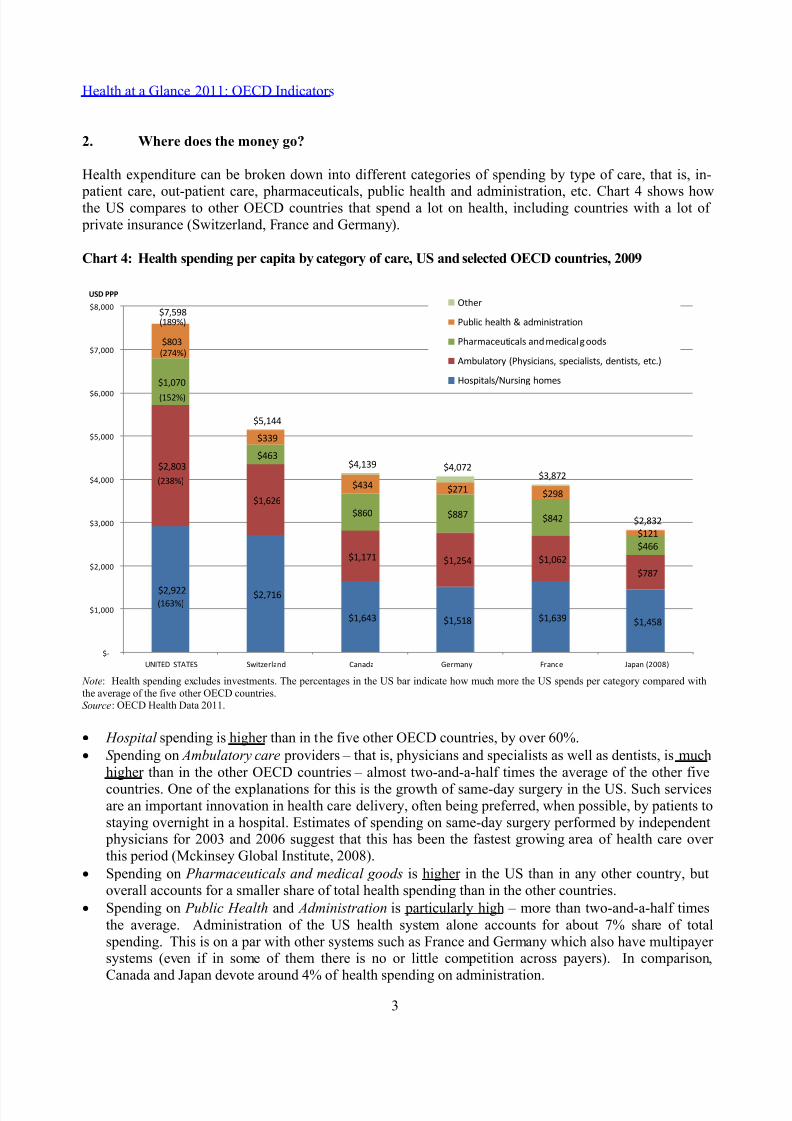
Health expenditure can be broken down into different categories of spending by type of care, that is, in-
patient care, out-patient care, pharmaceuticals, public health and administration, etc. Chart 4 shows howthe US compares to other OECD countries that spend a lot on health, including countries with a lot of private insurance (Switzerland, France and Germany).
Chart 4: Health spending per capita by category of care, US and selected OECD countries, 2009
$2,922 $2,716
$1,643 $1,518 $1,639 $1,458
$2,803
$1,626
$1,171 $1,254 $1,062
$787
$1,070
$463
$860 $887 $842
$466
$803
$339
$434 $271 $298
$121
$7,598
$5,144
$4,139 $4,072$3,872
$2,832
$-
$1,000
$2,000
$3,000
$4,000
$5,000
$6,000
$7,000
$8,000
UNITED STATES Switzerland Canada Germany France Japan (2008)
Note: Health spending excludes investments. The percentages in the US bar indicate how much more the US spends per category compared withthe average of the five other OECD countries.Source: OECD Health Data 2011.
Hospital spending is higher than in the five other OECD countries, by over 60%.
S pending on Ambulatory care providers – that is, physicians and specialists as well as dentists, is muchhigher than in the other OECD countries – almost two-and-a-half times the average of the other five
countries. One of the explanations for this is the growth of same-day surgery in the US. Such servicesare an important innovation in health care delivery, often being preferred, when possible, by patients tostaying overnight in a hospital. Estimates of spending on same-day surgery performed by independent physicians for 2003 and 2006 suggest that this has been the fastest growing area of health care over this period (Mckinsey Global Institute, 2008).
Spending on Pharmaceuticals and medical goods is higher in the US than in any other country, butoverall accounts for a smaller share of total health spending than in the other countries.
Spending on Public Health and Administration is particularly high – more than two-and-a-half timesthe average. Administration of the US health system alone accounts for about 7% share of totalspending. This is on a par with other systems such as France and Germany which also have multipayer systems (even if in some of them there is no or little competition across payers). In comparison,
Canada and Japan devote around 4% of health spending on administration.
Leaving aside spending on administration, the high level of spending in the United States may be due to:
The cost (or price) of health care being higher in the United States than elsewhere The United States providing more health care – more doctors’ appointments, more surgery, more
drugs, more diagnostic tests, longer stays in hospital – than in other countries
Some combination of the two.
Evidence suggests that prices are high (see next section) and some (but not all) quantities of services provided are high.
3. Are US health prices high?
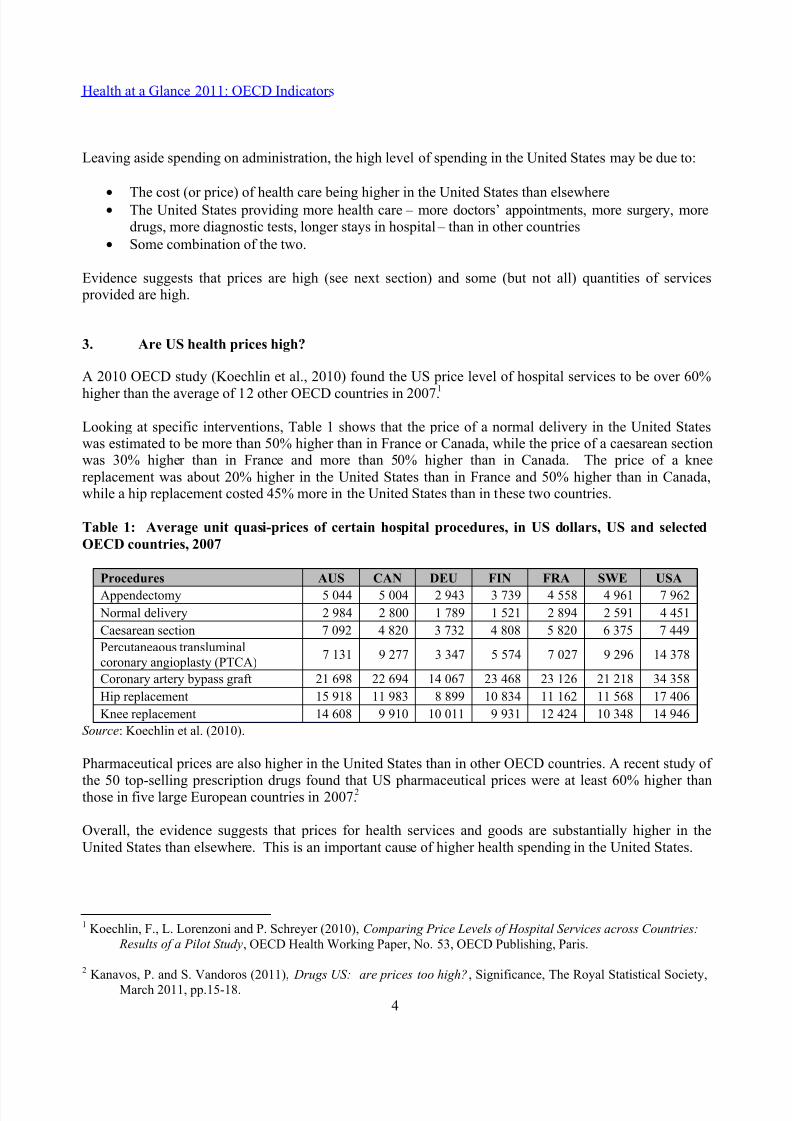
A 2010 OECD study (Koechlin et al., 2010) found the US price level of hospital services to be over 60%
higher than the average of 12 other OECD countries in 2007.1
Looking at specific interventions, Table 1 shows that the price of a normal delivery in the United Stateswas estimated to be more than 50% higher than in France or Canada, while the price of a caesarean sectionwas 30% higher than in France and more than 50% higher than in Canada. The price of a kneereplacement was about 20% higher in the United States than in France and 50% higher than in Canada,while a hip replacement costed 45% more in the United States than in these two countries.
Table 1: Average unit quasi-prices of certain hospital procedures, in US dollars, US and selected
Pharmaceutical prices are also higher in the United States than in other OECD countries. A recent study of
the 50 top-selling prescription drugs found that US pharmaceutical prices were at least 60% higher thanthose in five large European countries in 2007.2
Overall, the evidence suggests that prices for health services and goods are substantially higher in theUnited States than elsewhere. This is an important cause of higher health spending in the United States.
1 Koechlin, F., L. Lorenzoni and P. Schreyer (2010), Comparing Price Levels of Hospital Services across Countries:
Results of a Pilot Study, OECD Health Working Paper, No. 53, OECD Publishing, Paris.
2 Kanavos, P. and S. Vandoros (2011), Drugs US: are prices too high?, Significance, The Royal Statistical Society,March 2011, pp.15-18.
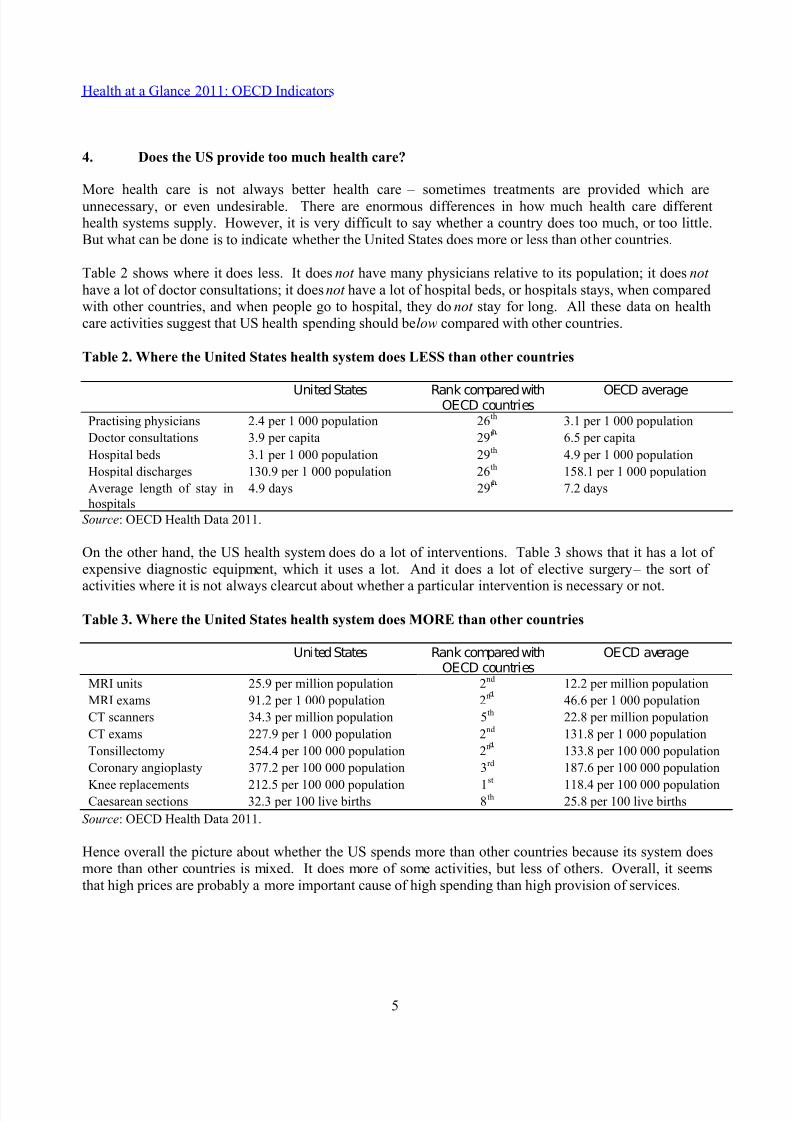
More health care is not always better health care – sometimes treatments are provided which areunnecessary, or even undesirable. There are enormous differences in how much health care differenthealth systems supply. However, it is very difficult to say whether a country does too much, or too little.But what can be done is to indicate whether the United States does more or less than other countries.
Table 2 shows where it does less. It does not have many physicians relative to its population; it does not
have a lot of doctor consultations; it does not have a lot of hospital beds, or hospitals stays, when comparedwith other countries, and when people go to hospital, they do not stay for long. All these data on healthcare activities suggest that US health spending should be low compared with other countries.
Table 2. Where the United States health system does LESS than other countries
United States Rank compared withOECD countries
OECD average
Practising physicians 2.4 per 1 000 population 26th
3.1 per 1 000 population
Doctor consultations 3.9 per capita 29t 6.5 per capita
Hospital beds 3.1 per 1 000 population 29th
4.9 per 1 000 population
Hospital discharges 130.9 per 1 000 population 26th
158.1 per 1 000 population
Average length of stay inhospitals
4.9 days 29t 7.2 days
Source: OECD Health Data 2011.
On the other hand, the US health system does do a lot of interventions. Table 3 shows that it has a lot of expensive diagnostic equipment, which it uses a lot. And it does a lot of elective surgery – the sort of
activities where it is not always clearcut about whether a particular intervention is necessary or not.
Table 3. Where the United States health system does MORE than other countries
United States Rank compared withOECD countries
OECD average
MRI units 25.9 per million population 2nd
12.2 per million population
MRI exams 91.2 per 1 000 population 2n
46.6 per 1 000 population
CT scanners 34.3 per million population 5th 22.8 per million population
CT exams 227.9 per 1 000 population 2nd
131.8 per 1 000 population
Tonsillectomy 254.4 per 100 000 population 2n
133.8 per 100 000 population
Coronary angioplasty 377.2 per 100 000 population 3rd 187.6 per 100 000 population
Knee replacements 212.5 per 100 000 population 1st
118.4 per 100 000 populationCaesarean sections 32.3 per 100 live births 8th 25.8 per 100 live births
Source: OECD Health Data 2011.
Hence overall the picture about whether the US spends more than other countries because its system doesmore than other countries is mixed. It does more of some activities, but less of others. Overall, it seemsthat high prices are probably a more important cause of high spending than high provision of services.
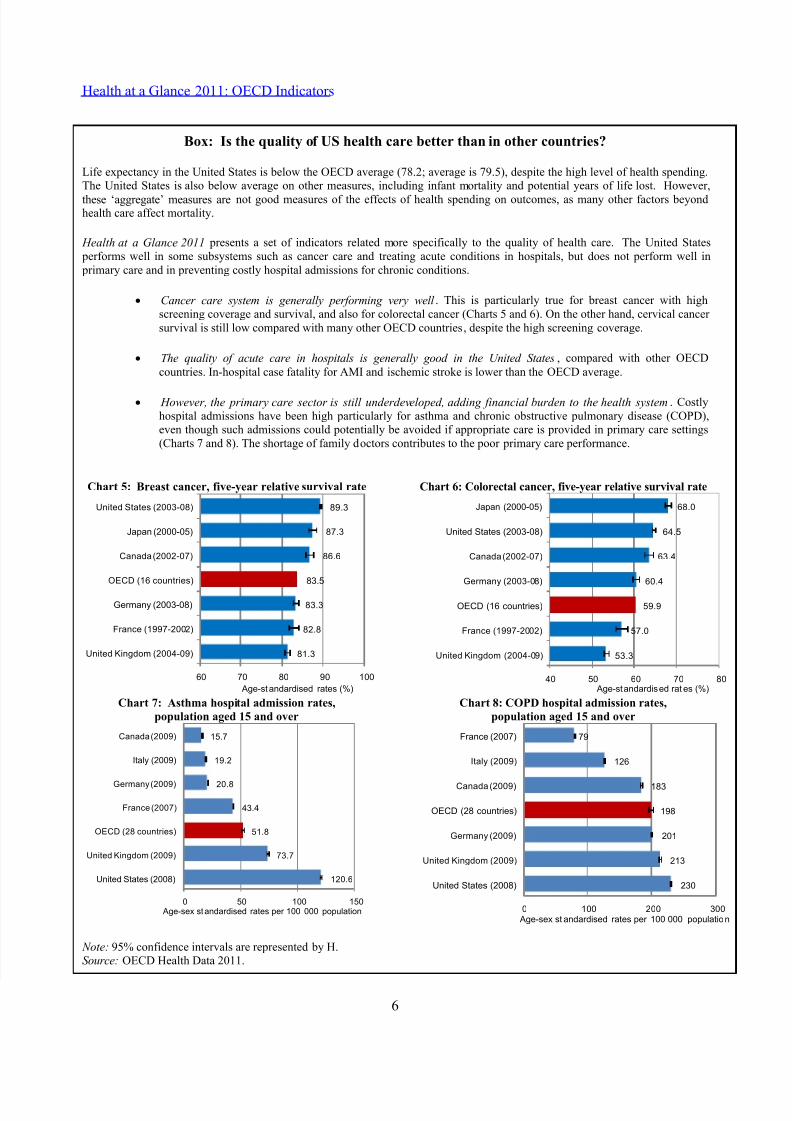
Box: Is the quality of US health care better than in other countries?
Life expectancy in the United States is below the OECD average (78.2; average is 79.5), despite the high level of health spending.The United States is also below average on other measures, including infant mortality and potential years of life lost. However,
these ‘aggregate’ measures are not good measures of the effects of health spending on outcomes, as many other factors beyondhealth care affect mortality.
Health at a Glance 2011 presents a set of indicators related more specifically to the quality of health care. The United States performs well in some subsystems such as cancer care and treating acute conditions in hospitals, but does not perform well in primary care and in preventing costly hospital admissions for chronic conditions.
Cancer care system is generally performing very well . This is particularly true for breast cancer with highscreening coverage and survival, and also for colorectal cancer (Charts 5 and 6). On the other hand, cervical cancer survival is still low compared with many other OECD countries, despite the high screening coverage.
The quality of acute care in hospitals is generally good in the United States, compared with other OECD
countries. In-hospital case fatality for AMI and ischemic stroke is lower than the OECD average.
However, the primary care sector is still underdeveloped, adding financial burden to the health system. Costlyhospital admissions have been high particularly for asthma and chronic obstructive pulmonary disease (COPD),even though such admissions could potentially be avoided if appropriate care is provided in primary care settings(Charts 7 and 8). The shortage of family doctors contributes to the poor primary care performance.
Chart 5: Breast cancer, five-year relative survival rate