38
© OECD/IEA 2010
© OECD/IEA 2010

© OECD/IEA 2010 © OECD/IEA 2011
Overview
1. The cutting edge
2. Getting the infrastructure right
3. Evolved system operation
4. Opening up the power market
5. Integration economics

© OECD/IEA 2010 © OECD/IEA 2011
Germany
50Hertz Amprion EnBW TNG TenneT Germany
Date & time
01/01/1
1
06:00
07/09/1
1
14:00
25/04/11
13:00
08/05/1
1
13:00
08/05/11
13:00
Wind 6 383 2 404 54 5 034 8 070
PV 0 1 517 1 793 5 987 12 627
Load (MW) 5 145 11 082 4 617 6 876 34 435
Max ratio 124% 35% 40% 160% 60%
Share of wind in 2011: 6%
Share of solar PV: 2%
Instantaneous share of wind and PV in Germany
© OECD/IEA 2010 © OECD/IEA 2011
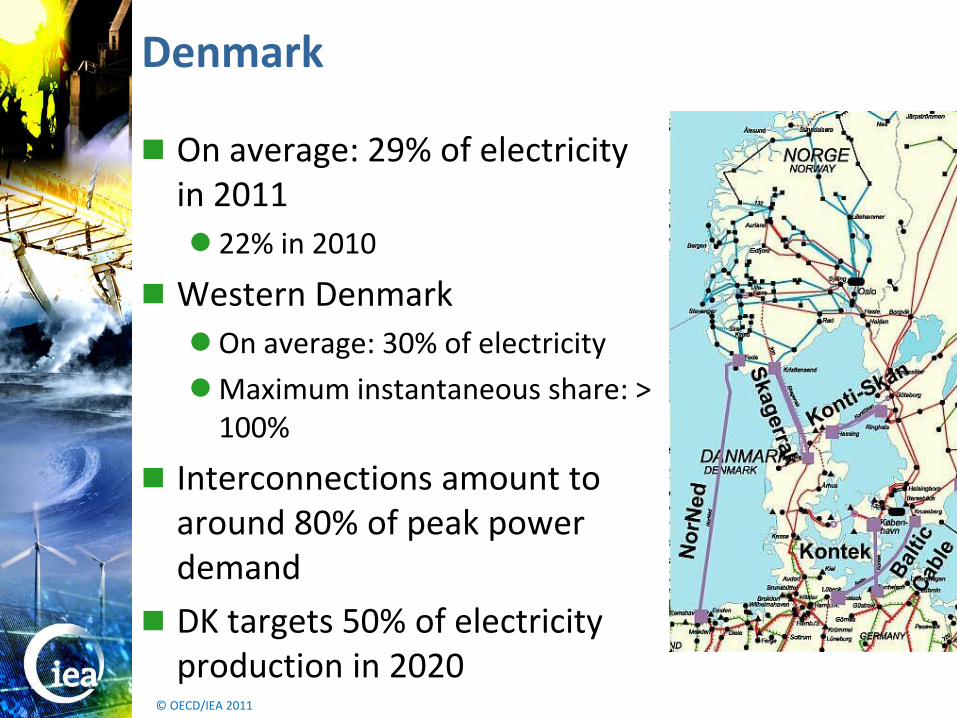
Denmark
On average: 29% of electricity in 2011
22% in 2010
Western Denmark
On average: 30% of electricity
Maximum instantaneous share: > 100%
Interconnections amount to around 80% of peak power demand
DK targets 50% of electricity production in 2020
© OECD/IEA 2010 © OECD/IEA 2011
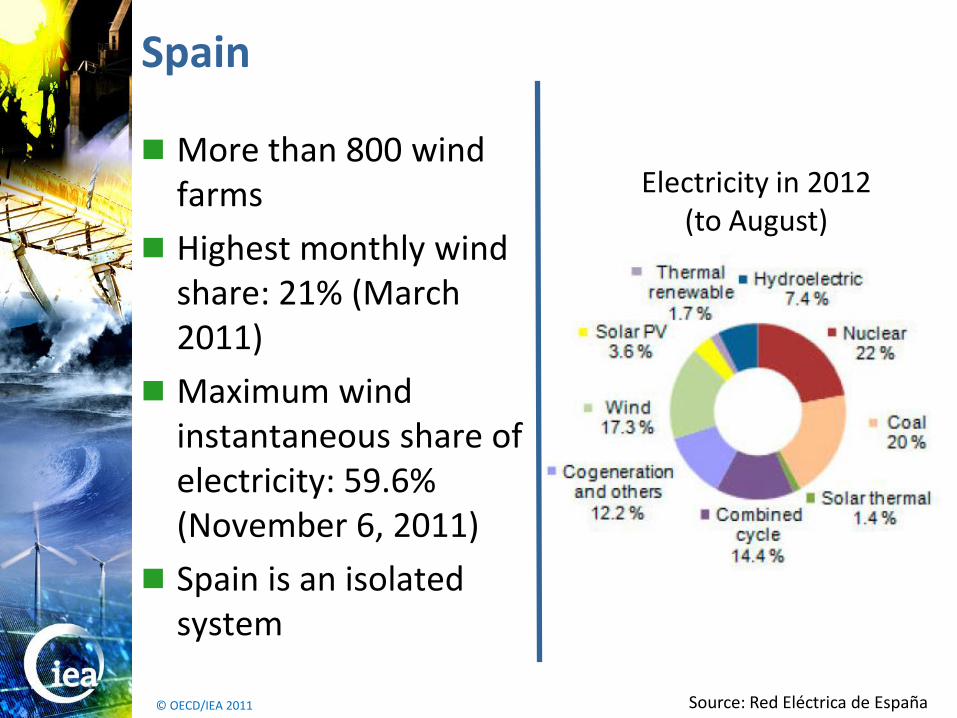
Spain
More than 800 wind farms
Highest monthly wind share: 21% (March 2011)
Maximum wind instantaneous share of electricity: 59.6% (November 6, 2011)
Spain is an isolated system
Source: Red Eléctrica de España
Electricity in 2012 (to August)
© OECD/IEA 2010 © OECD/IEA 2011
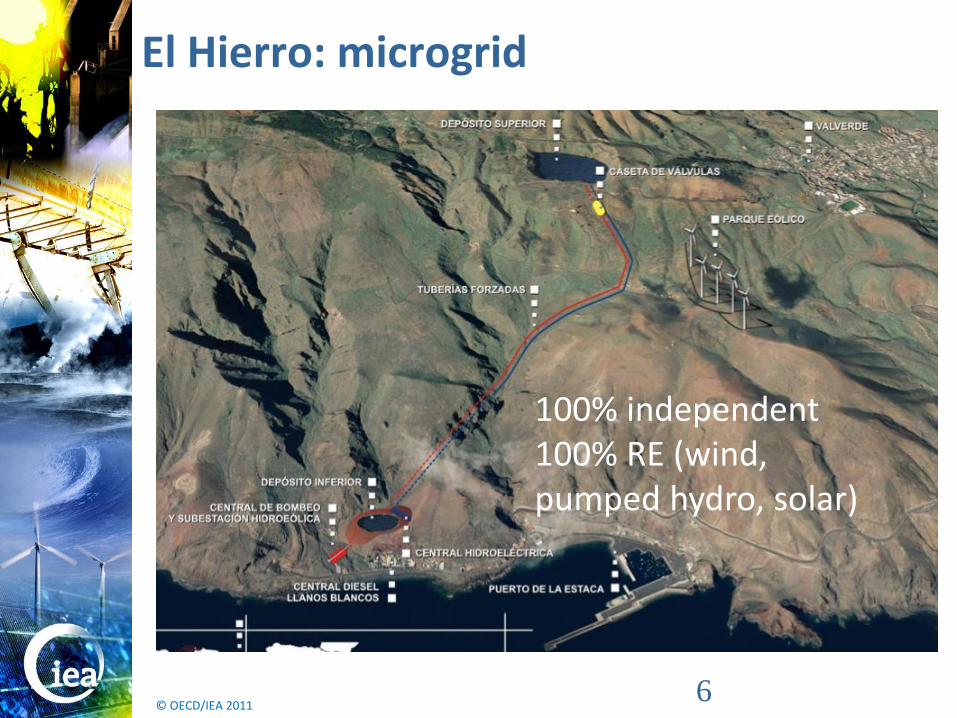
El Hierro: microgrid
100% independent 100% RE (wind, pumped hydro, solar)
6

© OECD/IEA 2010 © OECD/IEA 2011
Overview
1. The cutting edge
2. Getting the infrastructure right
3. Evolved system operation
4. Opening up the power market
5. Integration economics
© OECD/IEA 2010 © OECD/IEA 2011
Grid planning at continental scale
EU: 10 year Network Development Plan of all European system operators
Advance warning of bottle necks

© OECD/IEA 2010 © OECD/IEA 2011
European transmission drivers
Source: ENTSOE 2012: 10 year network development plan 2012
© OECD/IEA 2010 © OECD/IEA 2011
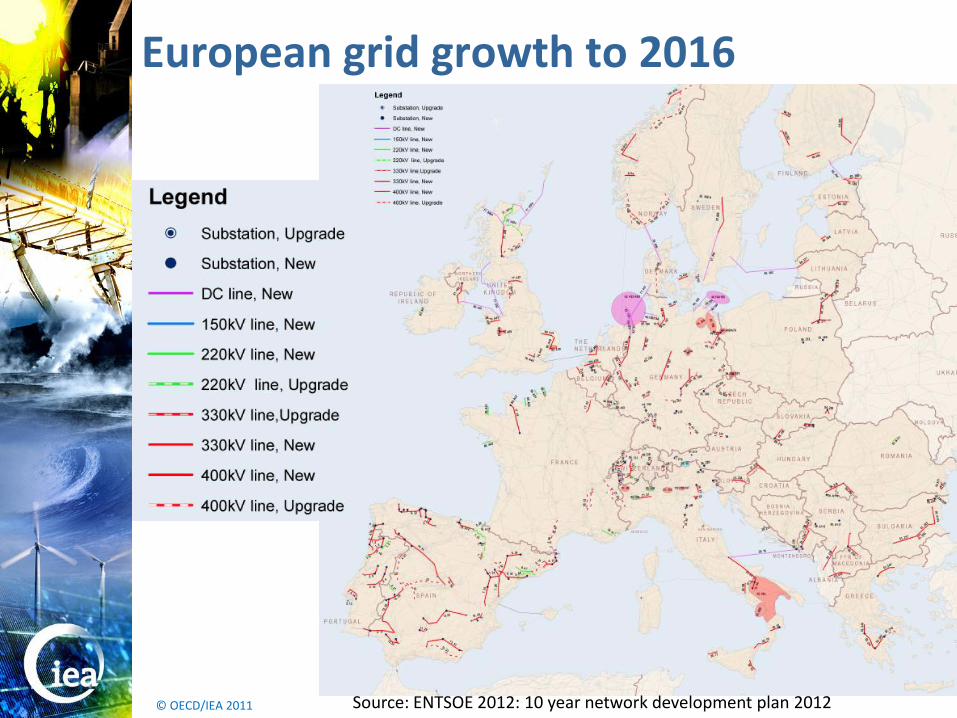
European grid growth to 2016
Source: ENTSOE 2012: 10 year network development plan 2012

© OECD/IEA 2010 © OECD/IEA 2011
European grid growth from 2017
Source: ENTSOE 2012: 10 year network development plan 2012

© OECD/IEA 2010 © OECD/IEA 2011
Germany transmission planning
2009 Power Grid Expansion Act
HV electricity highways to manage congestion
DE: 2010 Energy Concept: system-wide planning
Wind no longer in isolation Conventional and renewable plants
Extension, reinforcement
Additional flexibility
2011 Grid Expansion Acceleration Law
Reduced delays in planning and permitting From 10 years at present to max 4 years
Federal Plan for Transmission Networks
Informed by EU-wide Ten Year plan

© OECD/IEA 2010 © OECD/IEA 2011
Texas CREZ
Which comes first: wind plant or transmission?
Objective: to move 18.5 GW of wind power from West Texas and the Panhandle to metropolitan areas
Source: PUCT 2012

© OECD/IEA 2010 © OECD/IEA 2011
Mexico consolidation
Baja California’s 2 grids are isolated from the the SEN
The north is connected to WECC
CFE plans to interconnect by 2015
And to increase trade with USA
?

© OECD/IEA 2010 © OECD/IEA 2011
Public support for transmission
German population environmentally aware, relatively wealthy
But who really wants new transmission pylons?
Public support campaign in Energy Concept
To Build understanding that more VRE = more grid.
New website launched by TSOs
Range of new-build scenarios
Presentation of first grid development plan in June
Compensation for new-build hosts?
10 year delays not uncommon in Europe
© OECD/IEA 2010 © OECD/IEA 2011
Innovative transmission technology
Flexible line management based on line temperature monitoring
Coincidence of need for carrying capacity and wind output
High temperature aluminium conductors
More capacity on the same pylon size
Cables instead of overhead lines
Danish Cable Action Plan 2009 Undergrounding of entire 132kV – 150kV grid by 2030
All new 400 kV (highest voltage) lines
Probably all distribution network too

© OECD/IEA 2010 © OECD/IEA 2011
Overview
The cutting edge
Getting the infrastructure right
Evolved system operation
Opening up the power market
Integration economics

© OECD/IEA 2010 © OECD/IEA 2011
Spain: CECRE
Real time monitoring of every grid-connected wind and solar PV power plant in the country

© OECD/IEA 2010 © OECD/IEA 2011
Denmark: System operator
Single grid entity
Merger of ELTRA and ELKRAFT
East and west recently connected
100% state-owned
Controlled by Ministry of Climate and Energy Key driver towards government target of 50% wind by 2020
No conflict of interest Extension / reinforcement delays minimal
Energinet has responsibility for market operation (with other Nordic TSOs)
Can develop market to reflect needs of VRE
Can address congestion signaled by the market

© OECD/IEA 2010 © OECD/IEA 2011
Germany: Supportive RE
Distribution (low voltage) grids are usually not actively managed… But more and more plant is installed at this level
DE 2011: remote curtailment ceiling lowered from 100 kW to 30 kW – mainly due to PV proliferation
From village orphan… to pillar of the community
New German wind and PV plants are required to support the grid; Incentives to refurbish older plants too
In Denmark since 1999 on HV grid
© OECD/IEA 2010 © OECD/IEA 2011
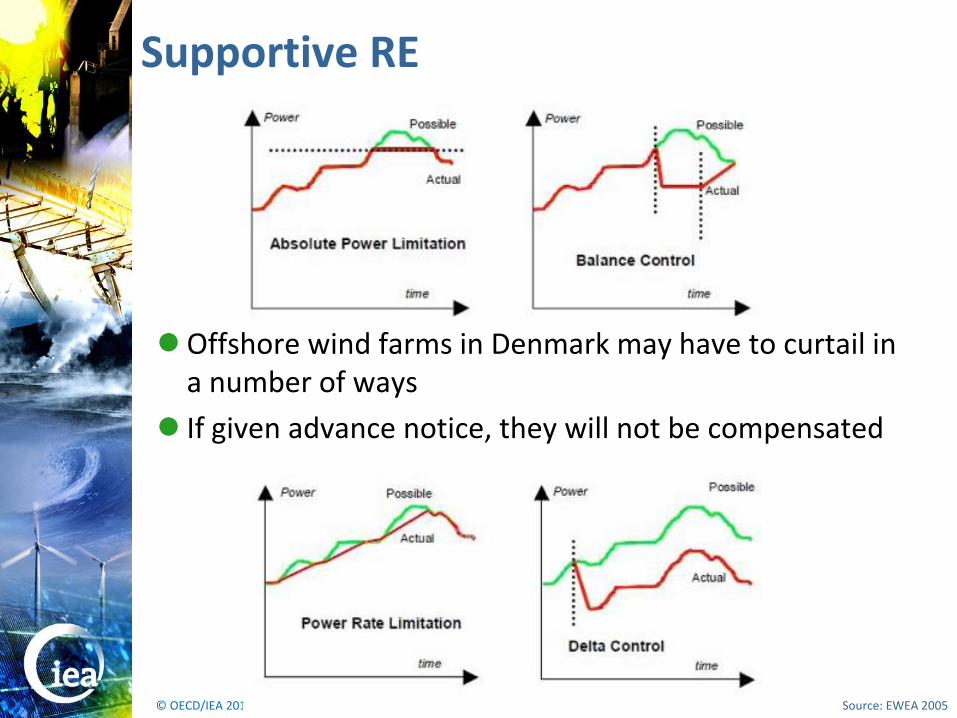
Supportive RE
Source: EWEA 2005
Offshore wind farms in Denmark may have to curtail in a number of ways
If given advance notice, they will not be compensated

© OECD/IEA 2010 © OECD/IEA 2011
Flexible resources
German fund encourages new-build fossil plants to use most flexible available technology
New generation of super flexible gas plants – GE Siemens, Alstom
To be more complementary with VRE output
CHP plants
Larger heat storage – to decouple heat and power production
Electric heaters can take advantage of surplus cheap electricity Danish tax on electricity use in CHP reduced in 2008
© OECD/IEA 2010 © OECD/IEA 2011
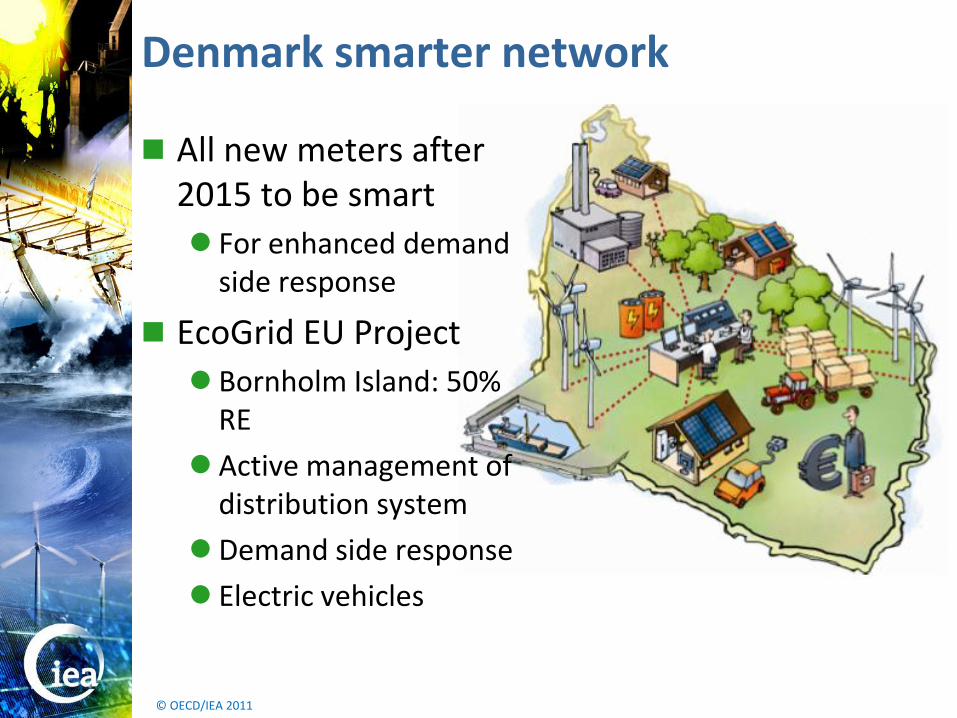
Denmark smarter network
All new meters after 2015 to be smart
For enhanced demand side response
EcoGrid EU Project
Bornholm Island: 50% RE
Active management of distribution system
Demand side response
Electric vehicles

© OECD/IEA 2010 © OECD/IEA 2011
Overview
The cutting edge
Getting the infrastructure right
Evolved system operation
Opening up the power market
Integration economics
© OECD/IEA 2010 © OECD/IEA 2011
The mechanics of trading electricity
Electricity is a commodity, much like any other But it is difficult to store: as soon as it is produced it must be
consumed
A lot of wind capacity in one place can lead to unmanageable surplus, or lulls (deficit) Surpluses need to be pushed elsewhere, and deficits supplied
from elsewhere
I.E.: TRADE!
But interconnections between historically separate markets are bottlenecks They need to be carefully managed, and expanded
New interconnectors need to be built

© OECD/IEA 2010 © OECD/IEA 2011
Balancing through trade
Netherlands
Interconnection turns surplus into income
Enables aggregation (smoothing) of output over the connected area
E.G.: Planned Denmark – Netherlands COBRAcable
As weather front moves
south, flow is reversed

© OECD/IEA 2010 © OECD/IEA 2011
European market couplings
Nordic market splitting
DE
Central and West European Market Coupling Interim Tight
Volume Market Coupling
NO
FR
SE
© OECD/IEA 2010 © OECD/IEA 2011
Managing the trade bottlenecks
Old approach: trade required subsequent, “explicit” auction of transmission capacity To transport it from producer to buyer
Many separate transactions: slow
New: system operators collaborate to manage cross-border transfers as a whole Cheap (e.g. wind) electricity flows more easily to higher price
areas
This appear to be easier in an “open” market (pool / exchange), where there is greater liquidity, rather than in OTC markets Transmission capacity implicit in spot market price

© OECD/IEA 2010 © OECD/IEA 2011
Flexible power market
EPEX (FR,DE,AT,CH): 33% of European power 25% of German power
Intra-day trading grew 500% in the three years to 2010.
Needs resulting from wind forecast uncertainty to be traded on the intra-day since 2011
Gate closure times reduced to 45 minutes ahead in both day ahead and intra-day markets
Balancing market (after EPEX closes) Now all tenders disclosed through online platform
Secondary reserves common across all 4 areas
© OECD/IEA 2010 © OECD/IEA 2011
Flexible power market 2
75% of Scandinavian electricity traded through Nord Pool (45% in 2006) Day ahead and intra-day
Negative prices (20 – 100 hours pa) Permitted since 2009, replacing floor at zero
Producers reduce or pay to generate
Large consumer incentive to consume accordingly
Nordic Operational Information System (Outside Nord Pool market)
Immediately needed flexibility (up to 15 minutes ahead) can be traded over the whole Nordic area
Offers are managed by the TSOs
© OECD/IEA 2010 © OECD/IEA 2011
Overview
The cutting edge
Getting the infrastructure right
Evolved system operation
Opening up the power market
Integration economics

© OECD/IEA 2010 © OECD/IEA 2011
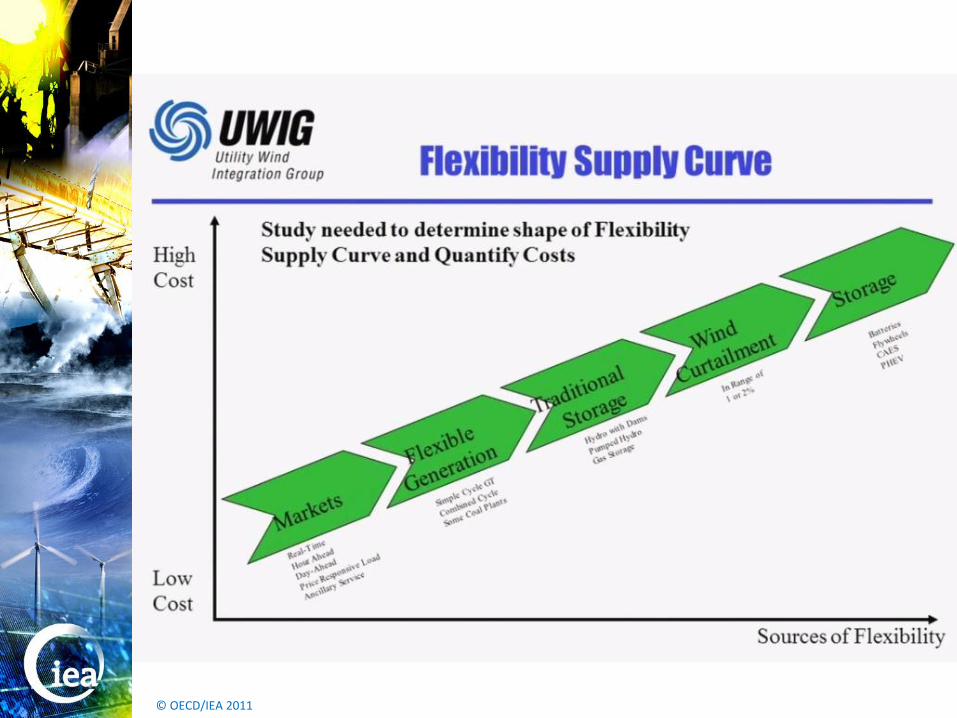
Balancing costs
Differences: conventional portfolio, geospread, interconnection, storage, market design, system operation…
© OECD/IEA 2010 © OECD/IEA 2011
© OECD/IEA 2010 © OECD/IEA 2011
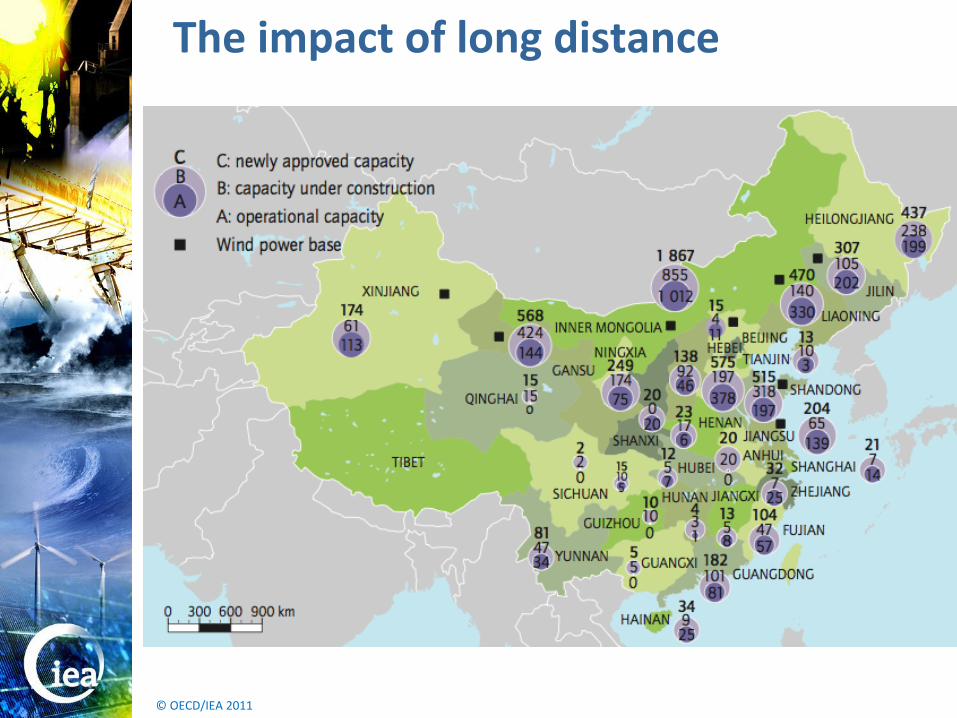
The impact of long distance

© OECD/IEA 2010 © OECD/IEA 2011
Chinese costs without transmission
The gradient of the curve reflects where the cheapest wind is

© OECD/IEA 2010 © OECD/IEA 2011
… and with transmission
The gradient of the curve reflects where the cheapest wind is

© OECD/IEA 2010 © OECD/IEA 2011
In summary…
Variability is not stopping deployment
There may be a massive grid building / renewal task But transmission of RE should not be viewed in isolation
Governments can reduce investment risk by “leading” with the grid
Long distance transmission has a major impact on cost
An able system operator is a priceless ally
Wind and solar can help support the grid
The search for additional flexibility is on
Open markets enable optimal use of variable and flexible power plants
Balancing costs are more modest than expected

© OECD/IEA 2010 © OECD/IEA 2011
Seminar follow-up: Hugo Chandler [email protected] London +44 207 287 1288


