69
/-7//~? Office of National Drug Control Policy Data Snapshot: r~ 'ug Abuse zn Amerzca, 1998 L~ P~

/-7//~?
Office of National Drug Control Policy
Data Snapshot: r~ 'ug Abuse zn Amerzca, 1998 L~
P~

Office of National Drug Control Policy
Data Snapshot: Drug Abuse in America, 1998
PROPERTY OF National Criminal Justice Reference Service (NCJRS) Box 6000 Rockville, MD 20849-6000
ONDCP MAY98
.~,. - , L -:
. i ' - -."
. j . -.
For sale by the U.S. Government Printing Office Superintendent of Documents, Mail Stop: SSOP, Washington, DC 20402-9328
ISBN 0-16-049612-8

Table of Contents:
Plate 2 - 9 Key Elements of the National Drug Control Strategy
Plate 10- 19 Budget Information
Plate 20 - 30 Performance Measurement System
Plate 31 - 95
31- 42
43- 58
59 - 65
66 - 82
83- 95
Demand Reduction Policy
Current Drug Use Situation
Youth Drug Use
Media Campaign/Drug Free Communities Act
Consequences of Drug Use
Drug Treatment
Plate 96 - 116 Supply Reduction Policy and Successes, Drug Supply, Price and Purity
ONDCP MAY98
Table of Contents:
Plate I - 8 Key Elements of the National Drug Control Strategy
Plate 9 - 18 Budget Information
Plate 1 9 - 29 Performance Measurement System
Plate 30 - 64 Plate 30 - 41 Plate 42 - 57 Plate 58- 64
Plate 65 - 76 Plate 82 -949
Demand Reduction Policy Current Drug Use Situation Youth Drug Use Media Campaign/Drug Free Communities Act Consequences of Drug Use
Drug Treatment
Plate 95 - 115 Supply Reduction Policy and Successes/Drug Supply/Price
and Purity
ONDCP MAY98

• J
L ~ k L m ~P
, i f
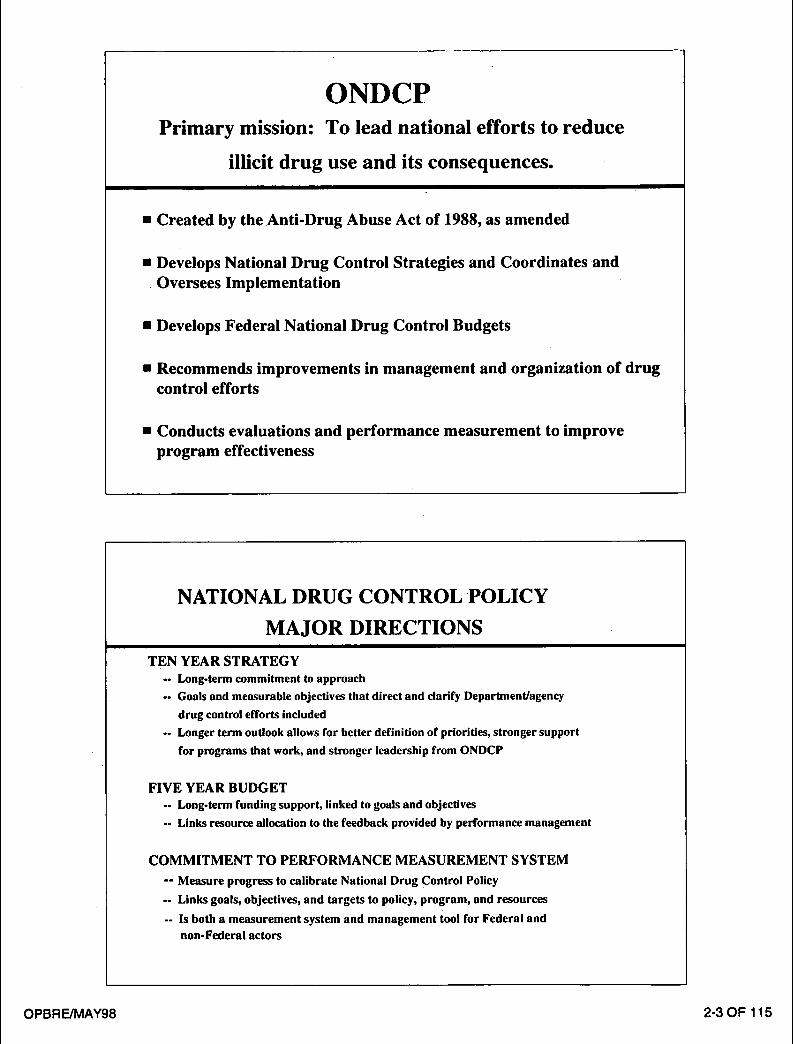
ONDCP Primary mission: To lead national efforts to reduce
illicit drug use and its consequences.
• C r e a t e d b y t h e A n t i - D r u g A b u s e A c t o f 1988, as a m e n d e d
• D e v e l o p s N a t i o n a l D r u g C o n t r o l S t r a t e g i e s a n d C o o r d i n a t e s a n d
• O v e r s e e s I m p l e m e n t a t i o n
• D e v e l o p s F e d e r a l N a t i o n a l D r u g C o n t r o l B u d g e t s
• R e c o m m e n d s i m p r o v e m e n t s in m a n a g e m e n t a n d o r g a n i z a t i o n o f d r u g
c o n t r o l e f f o r t s
• C o n d u c t s e v a l u a t i o n s a n d p e r f o r m a n c e m e a s u r e m e n t to i m p r o v e
p r o g r a m e f f e c t i v e n e s s
NATIONAL DRUG CONTROL POLICY
MAJOR DIRECTIONS
TEN YEAR STRATEGY .. Long-term commitment to approach -- Goals and measurable objectives that direct and clarify Department/agency
drug control efforts included -- Longer term outlook allows for better definition of priorities, stronger support
for programs that work, and stronger leadership from ONDCP
FIVE YEAR BUDGET -- Long-term funding support, linked to goals and objectives -. Links resource allocation to the feedback provided by performance management
COMMITMENT TO PERFORMANCE MEASUREMENT SYSTEM
-- Measure progress to calibrate National Drug Control Policy
.. Links goals, objectives, and targets to policy, program, and resources
-- Is both a measurement system and management tool for Federal and non-Federal actors
OPBRE/MAY98 2-3 OF 115
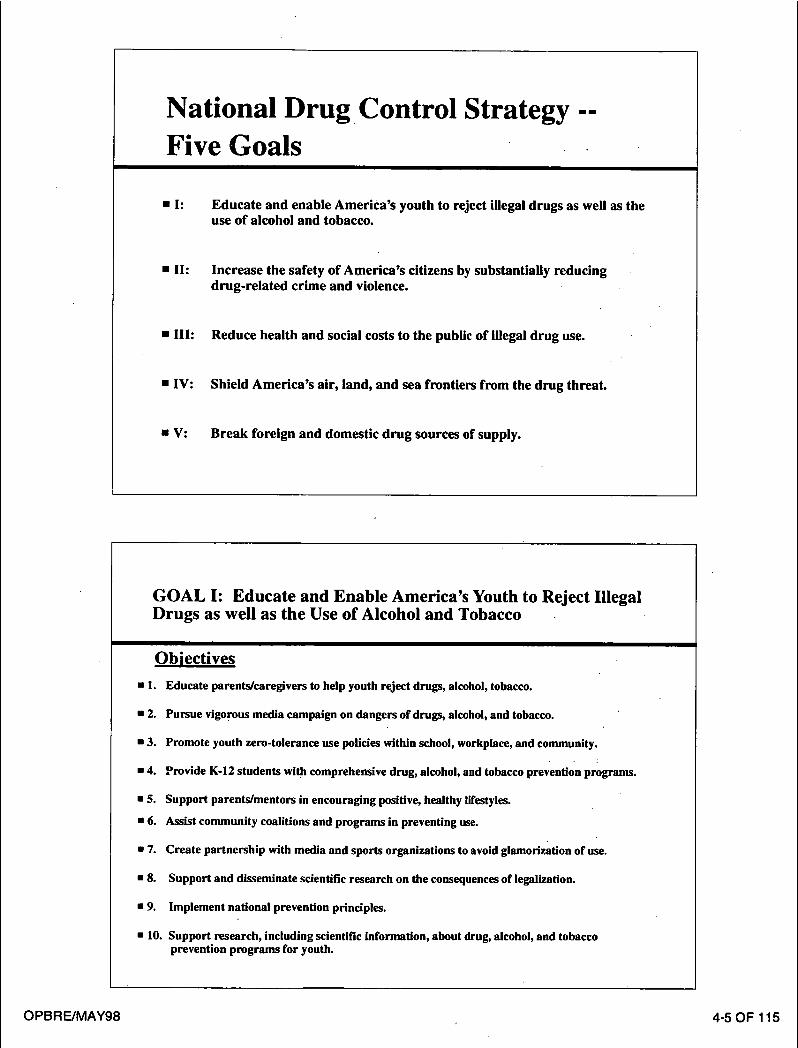
National DrugControl Strategy Five Goals
• h
• II:
• Il l :
• IV:
• V:
Educa te and enable A m e r i c a ' s you th to reject illegal d rugs as well as the use o f alcohol and tobacco.
Inc rease the safe ty o f A m e r i c a ' s citizens by substant ial ly reducing d rug - r e l a t ed c r ime and violence.
Reduce heal th and social costs to the public of illegal d rug use.
Shield A m e r i c a ' s air , land, and sea f ront iers f rom the d rug threa t .
B r e a k fore ign and domest ic d r u g sources of supply.
GOAL I: Educate and Enable America's Youth to Reject Illegal Drugs as well as the Use of Alcohol and Tobacco
Objectives
• 1. Educate parents/caregivers to help youth reject drugs, alcohol, tobacco.
• 2. Pursue vigorous media campaign on dangers of drugs, alcohol, and tobacco.
• 3. Promote youth zero-tolerance use policies within school, workplace, and community.
• 4. Provide K-12 students with comprehensive drug, alcohol, and tobacco prevention programs.
• 5. Support parents/mentors in encouraging positive, healthy lifestyles.
• 6. Assist community coalitions and programs in preventing use.
• 7. Create partnership with media and sports organizations to avoid glamorization of use.
• 8. Support and disseminate scientific research on the consequences of legalization.
• 9. Implement national prevention principles.
• 10. Support research, including scientific information, about drug, alcohol, and tobacco prevention programs for youth.
OPBRE/MAY98 4-5 OF 115

GOAL II: Increase Safety of America's Citizens by Substantially Reducing Drug-related Crime and Violence
" Objectives
• 1. Strengthen !awenforcemen t, incl. task forces, to combat violence, d isrupt organizations, and arrest their leaders.
• 2. Improve the ability of High Intensity Drug Trafficking Areas (HIDTAs), to counter drug use, production, trafficking, and crime.
• 3. Help law enforcement disrupt money laundering and seize criminal assets.
• 4. Implement effective rehabil i tat ive programs at all stages in the criminal ' justice system.
• 5. Break cycle of drug abuse and Crime.
=6. Suppor t research, including information, to inform law enforcement, prosecution, incarceration, and t reatment of offenders.
GOAL HI: Reduce Health and Social Costs to the Public of Illegal Drug Use
Objectives
• 1. Support effective, efficient, accessible, drug treatment responsive to emerging trends.
• 2. Reduce drug-related health problems, emphasis on infectious diseases.
• 3. Promote adoption of drug-free workplace programs that emphasize drug-testing as key component in a comprehensive program.
• 4. Support research into the development of medications & treatment protocols to prevent/reduce dependence and abuse.
• 5. Promote credentialing of professionals who work with substance abusers.
• 6. Support research and technology, incl. scientific data, to reduce health and social costs of illegal drug use.
OPBRE/MAY98 6-7 OF 115
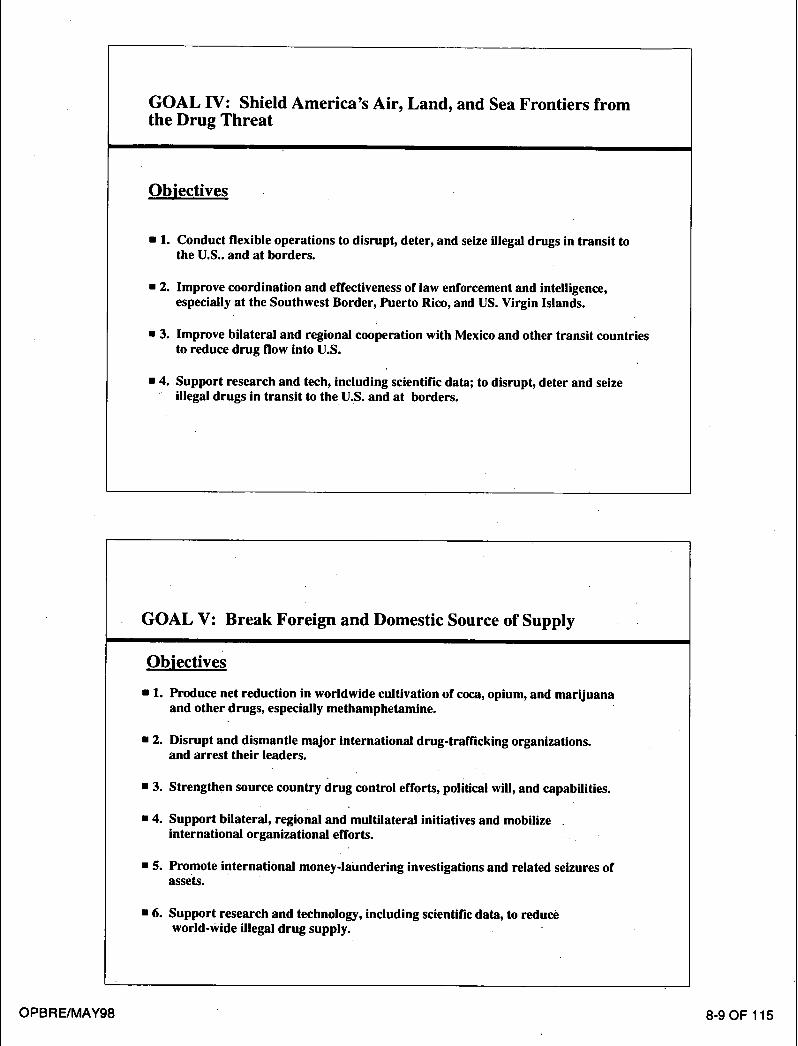
GOAL IV: Shield America's Air, Land, and Sea Frontiers from the Drug Threat
Objectives
• 1. Conduct flexible operations to disrupt, deter, and seize illegal drugs in transit to the U.S.. and at borders.
• 2. Improve coordination and effectiveness of law enforcement and intelligence, especially at the Southwest Border, Puerto Rico, and US. Virgin Islands.
• 3. Improve bilateral and regional cooperation with Mexico and other transit countries to reduce drug flow into U.S.
• 4. Support research and tech, including scientific data; to disrupt, deter and seize illegal drugs in transit to the U.S. and at borders.
GOAL V: Break Foreignand Domestic Source of Supply
Objectives
• 1. Produce net reduction in worldwide cultivation of coca, opium, and marijuana and other drugs, especially methamphetamine.
• 2. Disrupt a n d dismantle major international drug-trafficking organizations. and arrest their leaders.
• 3. Strengthen source country drug control efforts, political will, and capabilities.
• 4 . Support bilateral, regional and multilateral initiatives and mobilize international organizational efforts.
• 5. Promote international money-laundering investigations and related seizures of assets.
• 6. Support research and technology, including scientific data, to reduce world-wide illegal drug supply.
O P B R E / M A Y 9 8 8-9 O F 115
The Federal Drug Control Budget has more than doubled since 1989
20.[
15
10
Budget Authority; Billions of Dollars
81 82 83 84 85 76 87 88 89 90 91 92 93 94 95 96 97 98 99 Request
Demand Reduction and Domestic Law Enforcement account for the bulk of Federal Drug Control Spending
20 Fiscal Year 1986-1999 $17.1B
I0
0 FY86 FY8'7 FY88 FY89 FY90 FY91 FY92 FY93 FY94 FY95 FY96 FY97 FY98 FY99
B Demand Reduction B DomestlcLaw Enforcement l International ~ Interdiction
OPBRE/MAY98 10-11 OF 115

Fiscal Year 1999 Spending Requested,
by Goal (dollars in millions)
.Totai Resources:
Goal 5:$2,928 1
Reduce Sources of Supply
$17.1 Billion
1 0 . 5 % c, o a i l : $ z , o 1 6 . . . : : ' Reduce.Youth Drug Use "." ~ " "
Goal 4:$1 ,669 9 . 9 %
Stop Flow of Drugs at Borders
• G o a l 3:$3,732 Reduce Con.sequences of Drug Use
40.0%
Goal 2:$6,724 Reduce Drug-Related Crime and Violence
Key Facts About Fiscal Year 1999 Spending
By FY 1999, the total Federal drug control budget will grow to $17.1 billion -- a level almost six times its size in FY 1986. -
* Domestic Law Enforcement ~ the la'rgest component of the Federal drug control budget,- with $8.8 billion (52%) in FY 1999. ~ -
Demand reduction, as a percent of the total, has increased from'30 percent to 34pe.rcent from FY 1986 to FY 1999. . : ~ " ~ " " '
Largest increase is in Goal 1 with $256 million more (14.5%) than'FY 19.98 enacted levels.
Goal 2 domestic law enforcement funding increases $21)2 million (3.1%) over FY 1998.
Funding for Goal 3 treatment programs increases $245 million (7%) over FY !~)98.
Goal 4 interdiction programs increase $142 million (9.3%) over FY 1998.
Funding for Goal 5 programs to reduce foreign and domestic sources of supply increases $247 million (-9.2%) over FY 1998. ~
OPBRE/MAY98 12-13 OF 115
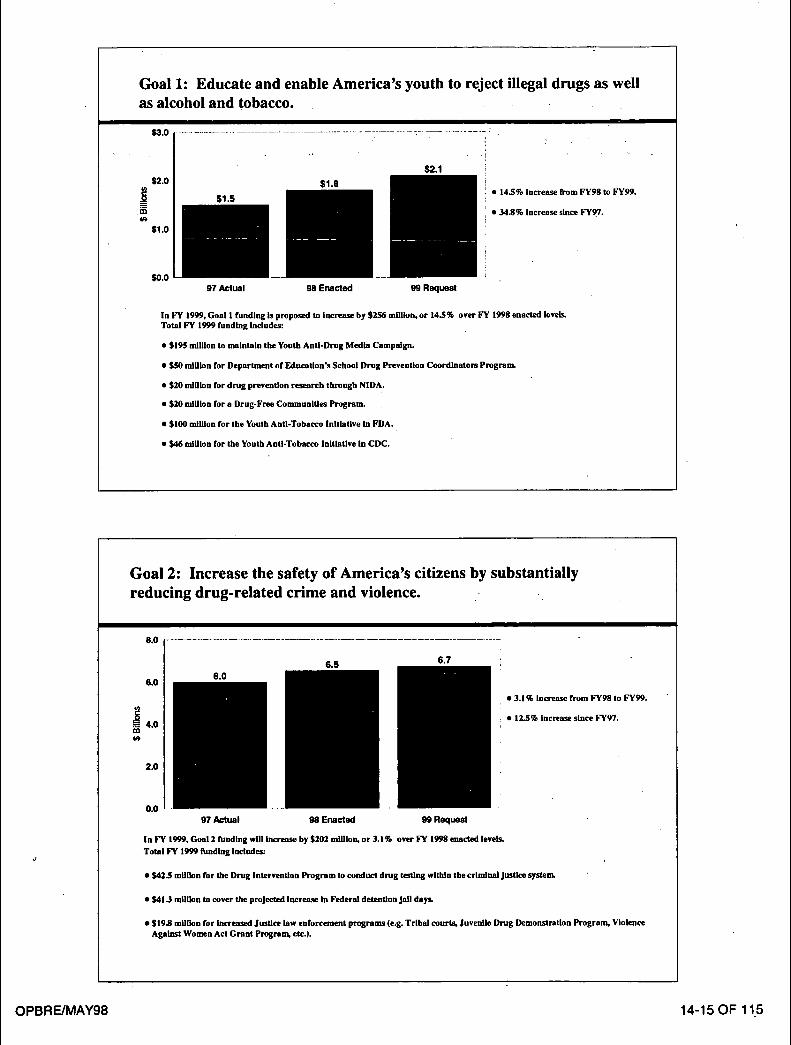
Goal 1: Educate and enable America's youth to reject illegal drugs as well as alcohol and tobacco.
J (X) ¢/k
$3.0
$2.0
$1.0
$0.0
14.$% Increase from FY9g to FY99.
M.8% Increase since FY97.
97 Actual 98 Enacted 99 Request
In FY 1999, Goal 1 funding is proposed to Increase by $2S6 million, or 14.5% over FY 1998 enacted levels. Total I;'Y 1999 funding includes:
• $195 million to maintain the Youth Anti-Drug Media Campaign.
• $50 million for Department of Education's School Drug Prevention Coordinators Program.
• $20 million for drug prevention research through NIDA.
• $20 million for a Drug-Free Communities Program.
• $100 udlUon for the Youth Anti-Tobacco Initiative in FDA.
• $46 million for the Youth Anti-Tobacco Initiative In CDC.
Goal 2: Increase the safety of America's citizens by substantially reducing drug-related crime and violence.
8.0
6.0
--= 4.0 ¢z)
2.0
0.0
6.0 6.5 6.7
• 3.1% increase from FY98 to FY99.
• 12.$% increase since FY97.
97 Actual 98 Enacted 99 Request
In VY 1999, Goal 2 funding will increase by $202 million, or 3.1% over P l 1998 enacted leveb. Total FY 1999 funding includes:
n $42.5 million for the Drug Intervention Program to conduct drug testing wltidn the criminal Justice system.
• $41.3 million to cover the projected Increase in Federal detention Jail days.
• $19.8 million for increased Justice law enforcement programs (e.g. Tribal courts. Juvenile Drug Demonstration Program. Violence Against Women Act Grant Program, etc.).
OPBRE/MAY98 14-15 OF 115

Goal 3: Reduce health and social costs to the public of illegal drug use.
5.0 . . . . . . . . . . . . . . . . . . . . . . . . . . . . . . . . . . . . . . . . . . . . . . . . . . . . . . . . . . . . . . . . . . . . . . . . .
4.0
3.0 O F- 03
2.0
1.0
0.0
3.3 3.5 3.7
97 Actual 98 Enacted 99 Request
• 7% increase from !;'Y98 to FY99.
• 12.3% increase since FY97.
In FY 1999, Goal 3 fundIng will Increase by $245 million, or 7% over FY 1998 enacted leveis. Total FY 1999 funding Includes:
• $200 million to Close the Public System Treatment Gap (of this amount. $143 million is drug-related and the remaInder is for alcohol treatment).
• $29 million for drug treatment research through N1DA.
• $42.5 million to Implement a comprehensive drug treatment program within the criminal Justice system.
Goal 4: Shield America's air, land, and sea frontiers from the drug threat.
oD
1 .5
0 . 5
1 . 6 9 '1.67
97 Actual 98 Enacted 99 Request
• 9.3% increase from FY98 to FY99.
• 1.1% decreaso since FY97.
• ..,..
In FY 1999, Goal 4 funding will Increase by $142 million, or 9.3% over FY 1998 enacted levels. Total FY 1999 funding Includes: •
• $163 million ($24.5 million drug-related) to add 1,000 new border patrol agents, prlmarBy for the southwest border.
• $66 million to enhance Customs' Ports-of.Entry operations; of this amount, $54 million wig fund non-Intrusive inspection technologies.
• $36 million to expand Coast Guard's Interdiction capabilities, particularly In the Caribbean.
• $12.5 m~llon to increase DaD's Interdiction support to the Caribbean countries and Mexico.
O P B R E / M A Y 9 8 16-17 O F 115
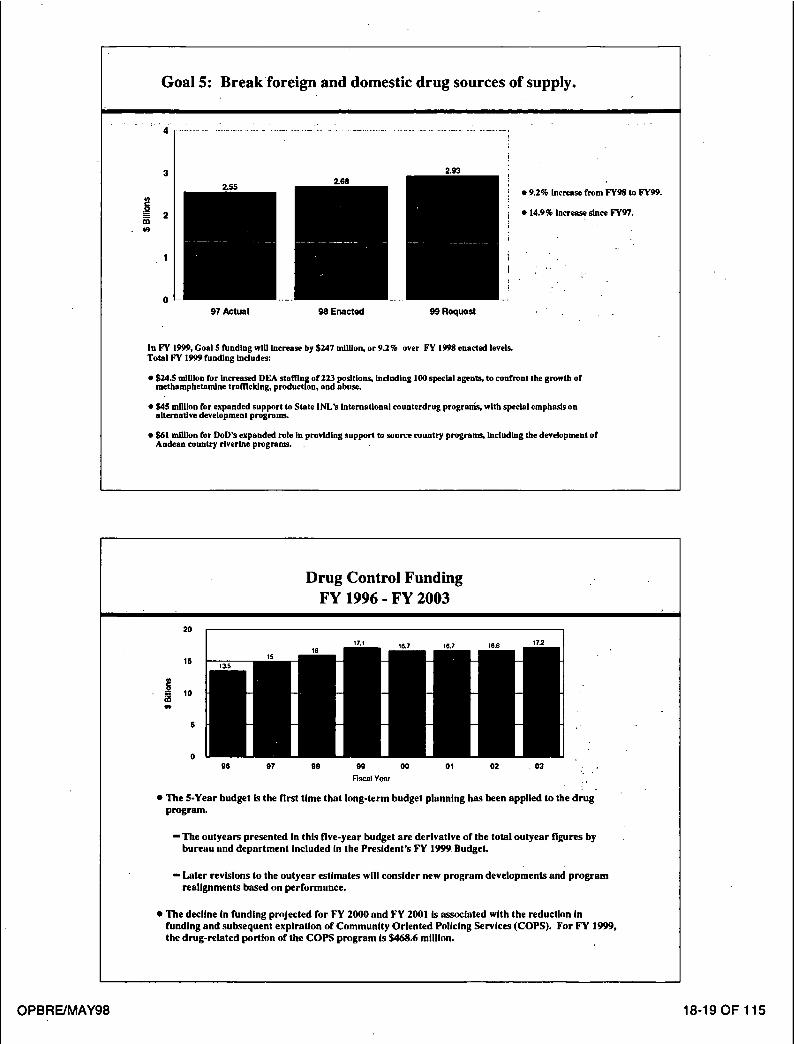
Goal 5: Break foreign and domestic drug sources of supply.
4
=_ rt~
2.93
97 Actual 98 Enacted 99 Request
• 9.2% Increase from FY98 to !;'Y99.
• 14.9% Increase since FY97.
In FY 1999, Goal 5 funding will Increase by $247 million, or 9.2% over FY 1998 enacted levels. Total FY 1999 funding Includes:
• $2,1.5 million for Increased DEA staffing of 223 positions, Including 100 special agents, to confront the growth of methamphetamine trafficking, production, and abuse.
• $45 million for expanded support to State INL's International counterdrug progratfis, with special emphasis on alteraaUve development programs.
• $61 million for DoD's expanded role In providing support to source country programs, IncludIng the development of Andean country riverIne programs.
20
Drug Control Funding FY 1996 - FY 2003
lS
10
S
O 96 97 98 99 O0 01 02 , 03
Fiscal Year
• The 5-Year budget is the first time that long-term budget planning has been applied to the drug program.
--The outyears presented In this five-year budget are derivative of the total outyear figures by bureau and department included in the President's FY 1999 Budget.
-- Later revisions to the outyear estimates will consider new program developments and program realignments based on performance.
• The decline In funding proJected for FY 2000 and FY 2001 is ~ l a t e d with the reduction in funding and subsequent expiration of Community Oriented Policing Services (COPS). For F¥ 1999, the drug-related portion of the COPS program is $468.6 millhm.
OPBRE/MAY98 18-19 OF 115
PERFORMANCE MEASUREMENT
SYSTEM
ONDCP'S MISSION
ONDCP's statutory mission is to Reduce Drug Use and Its Consequences
Strategy seeks to achieve this mission through Supply Reduction and Demand Reduction programs
1997 Strategy reflected in 5 Goals and 32 Objectives
Youth drug use is targeted by Goal 1; hardcore drug use is addressed through treatment targeted by Goal 3
Drug availability is targeted though Goals 4 and 5
Drug-related consequences (crime, health and other social costs) are targeted through Goals 2 and 3
OPBRE/MAY98 20-21 OF 115
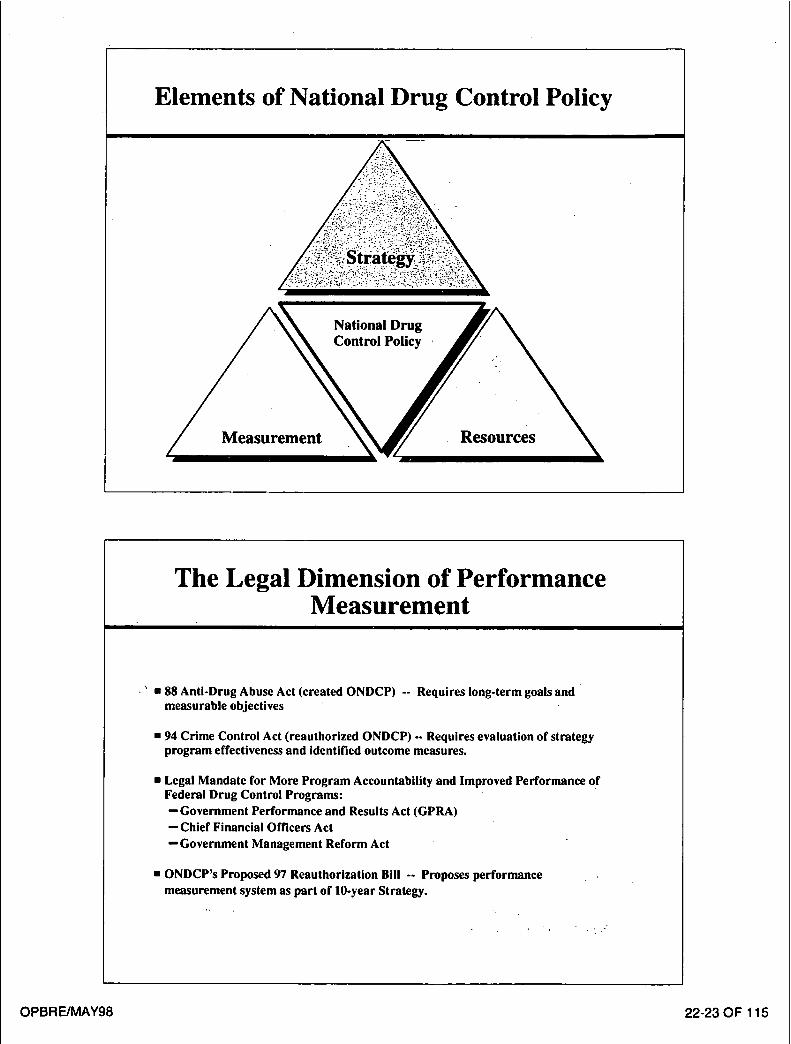
Elements of National Drug Control Policy
The Legal Dimension of Performance Measurement
' • 8 8 Anti-Drug Abuse Act (created ONDCP) -- Requires long-term goals and measurable objectives
• 94 Crime Control Act (reauthorized ONDCP) -- Requires evaluation of strategy program effectiveness and identified outcome measures.
• Legal Mandate for More Program Accountability and Improved Performance of Federal Drug Control Programs: -- Government Performance and Results Act (GPRA) -- Chief Financial Officers Act - - Government Management Reform Act
• ONDCP's Proposed 97 Reauthorization Bill -- Proposes performance measurement system as part of 10-year Strategy.
OPBRE/MAY98 22-23 OF 115
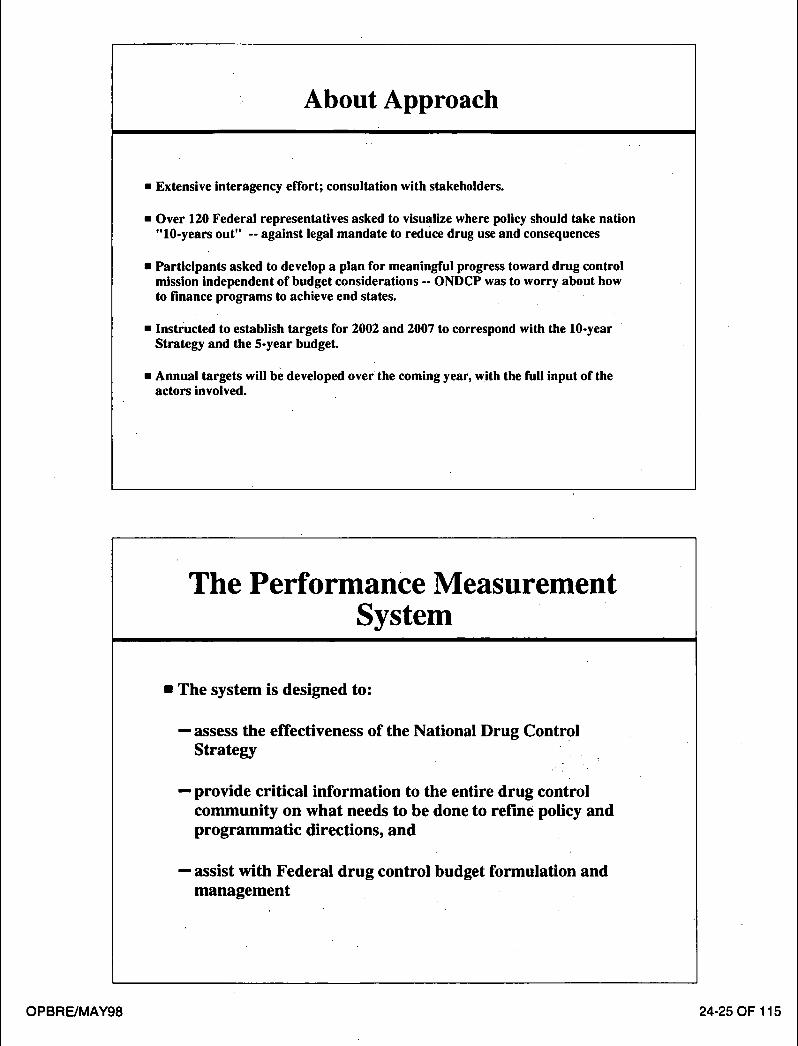
About Approach
• Extensive interagency effort; consultation with stakeholders.
• Over 120 Federal representatives asked to visualize where policy should take nation "10-years out" -- against legal mandate to reduce drug use and consequences
• Participants asked to develop a plan for meaningful progress toward drug control mission independent of budget considerations -- ONDCP was to worry about how to finance programs to achieve end states.
• Instructed to establish targets for 2002 and 2007 to correspond with the 10-year Strategy and the 5-year budget.
• Annual targets will be developed over the coming year, with the full input of the actors involved.
The Performance Measurement System
• The system is designed to:
--assess the effectiveness of the National Drug Control Strategy
-- provide critical information to the entire drug control community on what needs to be done to refine policy and programmatic directions, and
-- assist with Federal drug control budget formulation and management
O P B R E / M A Y 9 8 24-25 O F 115

Performance Measurement Framework
The Mission of the National define Major Targets reflect impact on the Measures represen4 means (variables /
Drug Control Strategy is to Goals define the Lines of five Strategy. Goals; the and events) for / reduce drug use (demand), Major Directives Action to remaining Performance tracking progress [ drug availability (supply), and or Directions achieve the Targets show progress towards targets. / the consequences, of the Strategy. desired Goal. towards the 32 Objectives. ] ,,
More About the Framework
• The nucleus of the system consists of 12 "impact targets."
• The Impact Targets are the performance targets that define a desired end state (or outcome) for the Strategy's Goals.
• Another 82 performance targets reflect progress toward the 32 supporting Objectives.
- - Impact targets determine the Strategy's overall success.
--Performance Targets provide program accountability and information on what needs to be done to refine programs.
OPBRE/MAY98 26-27 OF 115
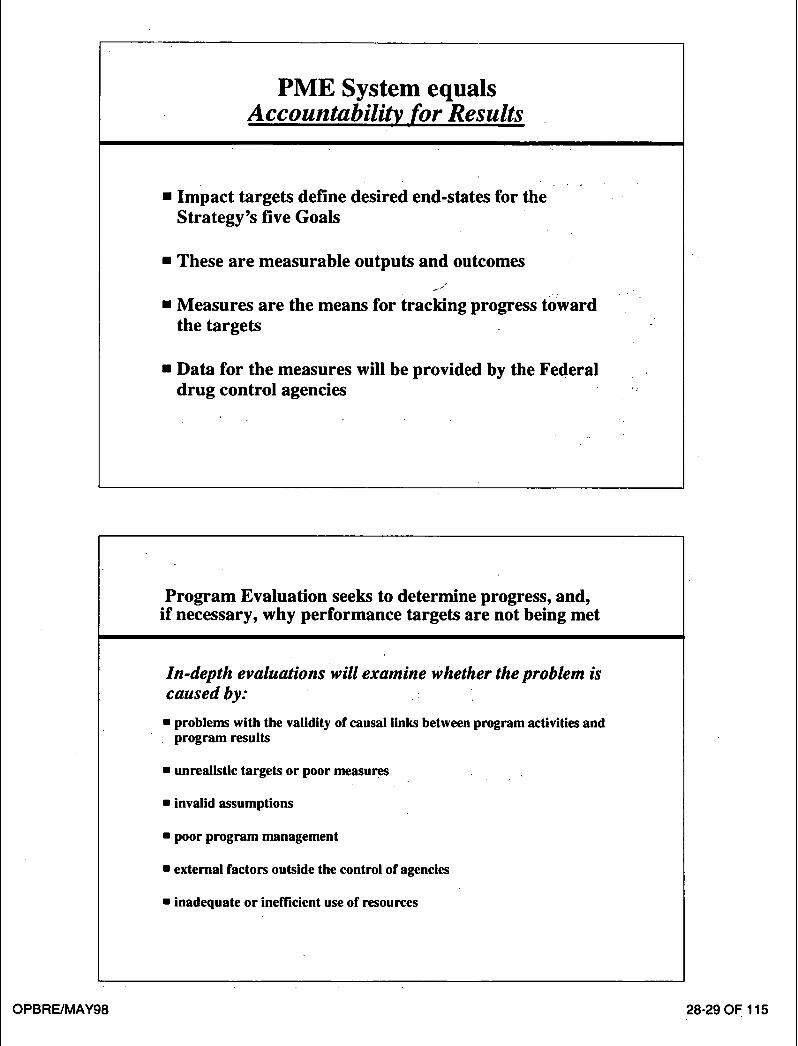
PME System equals Accountability,for Results
• Impact targets define desired end-states for the Strategy's five Goals
• These are measurable outputs and outcomes
• Measures are the means for tracking progress toward the targets
• Data for the measures will be provided by the Federal drug control agencies
Program Evaluation seeks to determine progress, and, if necessary, why performance targets are not being met
In-depth evaluations wil l examine Whether the problem is caused by: . ~.
• prob lems with the validity of causal links between p r o g r a m activities and p r o g r a m results
• unreal is t ic t a rge t s o r poor measures
• invalid assumpt ions
• poor p r o g r a m m a n a g e m e n t
• external fac tors outside the control of agencies
• inadequa te o r inefficient use of resources
OPBRE/MAY98 28-29 OF 115
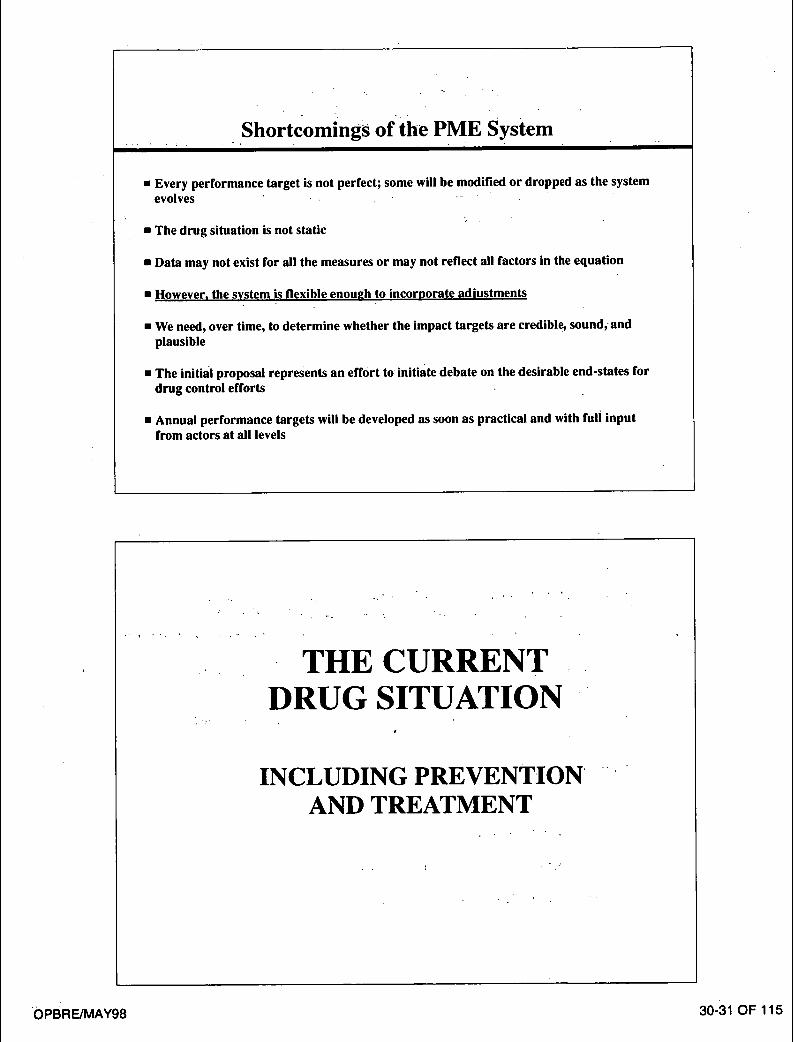
Shortcomings ofthe PME System
• Every performance target is not perfect; some will be modified or dropped as the system evolves "
• The drug situation is not static
• Data may not exist for all the measures or may not reflect all factors in the equation
• However~ the system is flexible enough to incorporate adiustments
• We need, over time, to determine whether the impact targets are credible, sound,and plausible
• The initial proposal represents an effort toinitiate debate on the desirable end-states for drug control efforts
• Annual performance targets will be developed as soon as practical and with fuli input from actors at all levels
T H E C U R R E N T :
D R U G S I T U A T I O N
I N C L U D I N G P R E V E N T I O N '~ A N D T R E A T M E N T
OPBRE/MAY98 30-31 OF 115
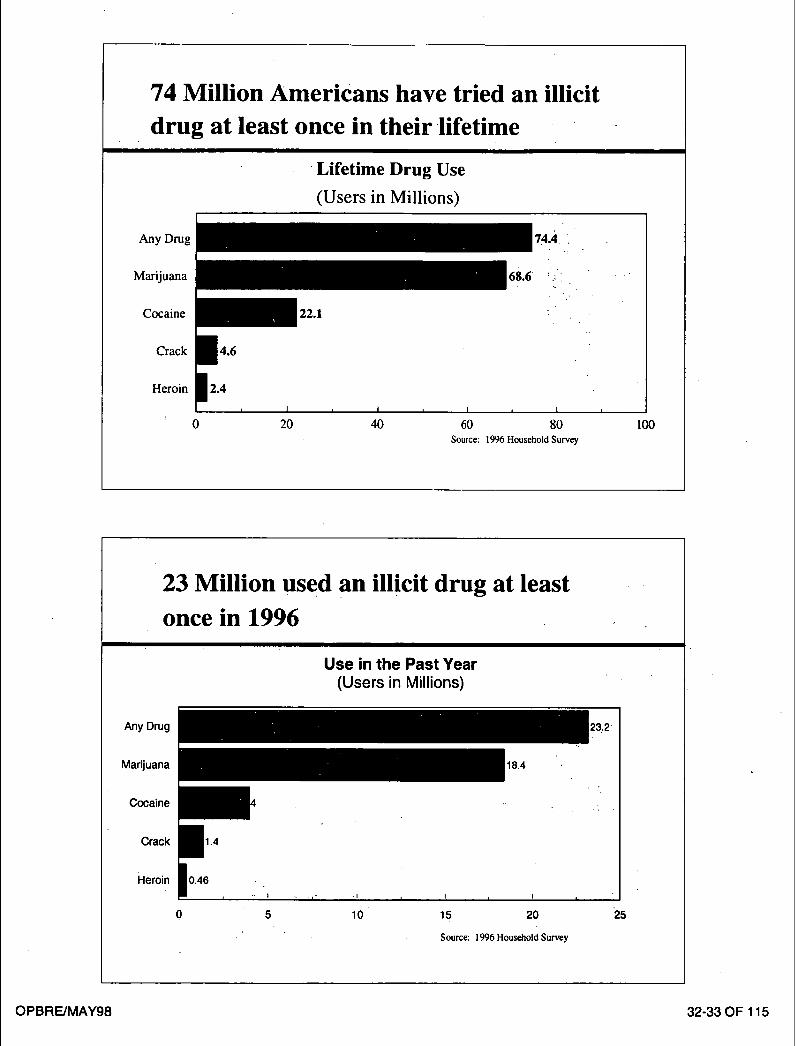
74 Mil l ion Americans have tried an illicit
drug at least once in their lifetime
Lifetime Drug Use
(Users in Millions)
Any Drug
Marijuana
Cocaine
Crack
Heroin
/ 22.1
4.6
J 2 . 4 , I , I ,
0 20 40
7.4.4
68.6 '.~ i
I i I
60 80 Source: 1996 Household Survey
100
23 Mil l ion used an illicit drug at least
once in 1996
Use in the Past Year (Users in Millions)
Any Drug
Marijuana
Cocaine
Crack
Heroin
5 10
I I I
15 20
Source: 1996 Household Survey
i
25
OPBRE/MAY98 32-33 OF 115
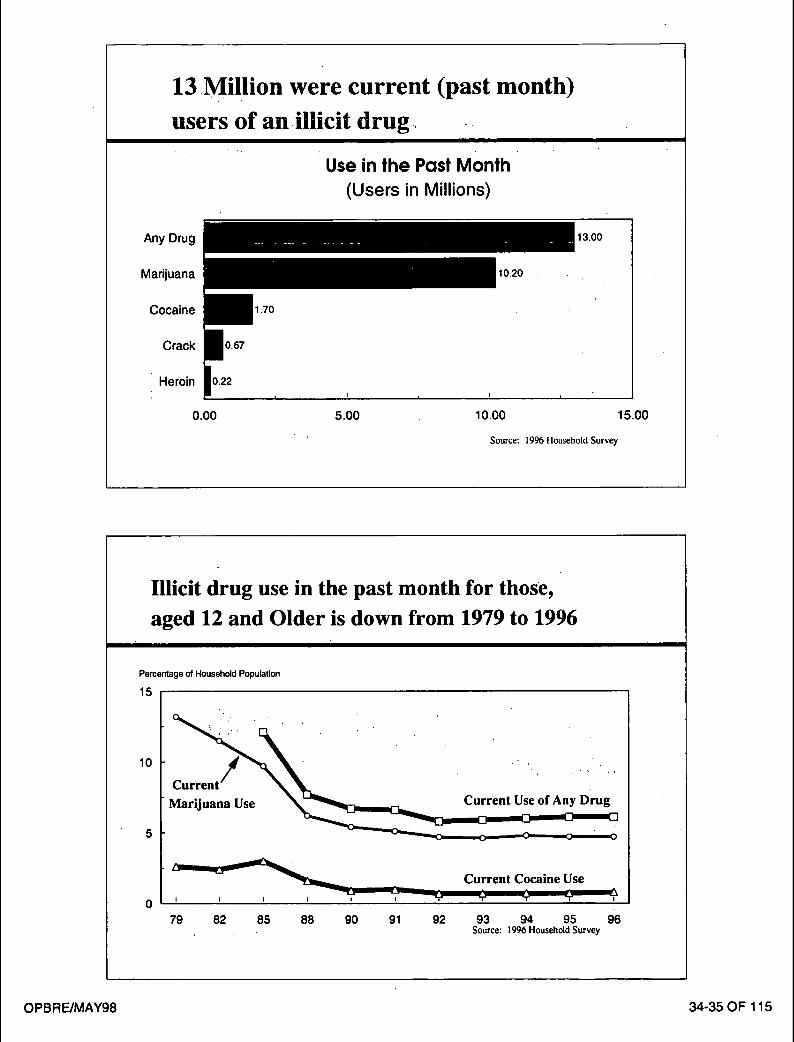
13 Mil l ion were current (past month)
users of an illicit d r u g
Use in the Past Month (Users in Millions)
Any Drug
Marijuana
Cocaine 1 . 7 0
1 3 . 0 0
Crack lo67
L Heroin 0.22
0.00 5.00 10.00 15.00
Source: 1996 Household Survey
Illicit drug use in the past month for those,
aged 12 and Older is down from 1979 to 1996
P e r c e n t a g e o f H o u s e h o l d P o p u l a t i o n
15
10
5
Marijuana Use
L-- ~ ~ Current Cocaine Use I I l I I I "r" "r" i ~i
79 82 85 88 90 91 92 93 94 95 96 Source: 1996 Household Survey
OPBRE/MAY98 34-35 OF 115
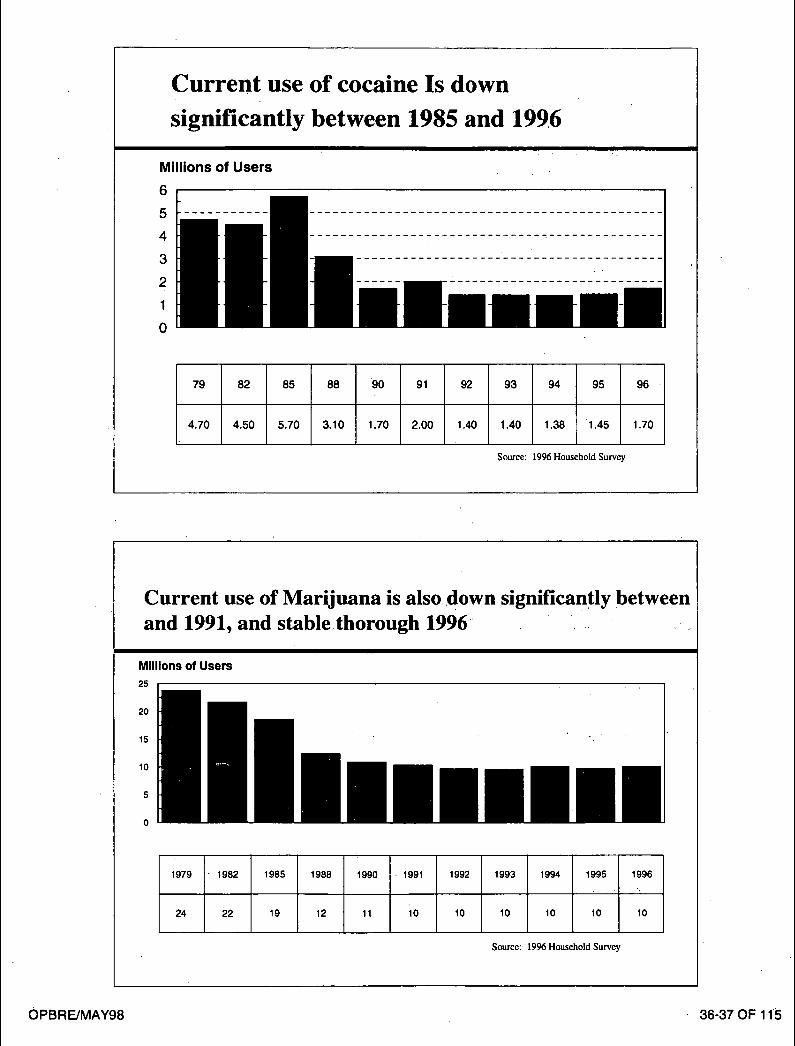
Current use of cocaine Is down
significantly between 1985 and 199.6
Millions of Users
6
5
4
3
2
1
0
79 82 85
4.70 4.50 5.70
88 90 91 92 93 94 95 96
3.10 1.70 2.00 1.40 1.40 1.38 1.45 1.70
Source: 1996 Household Survey
Current use of Marijuana is also ,down significantly between and 1991, and stable.thorough 1996 ,.
Millions of Users 25
20
15
10
5
0
1979 1982 1985 1988 1990 . 1991 1992
24 22 19 12 11 10 10
1993 1994 1995 1996
10 10 10
Source: 1996 Household Survey
10
OPBRE/MAY98 36-37 OF 1t5
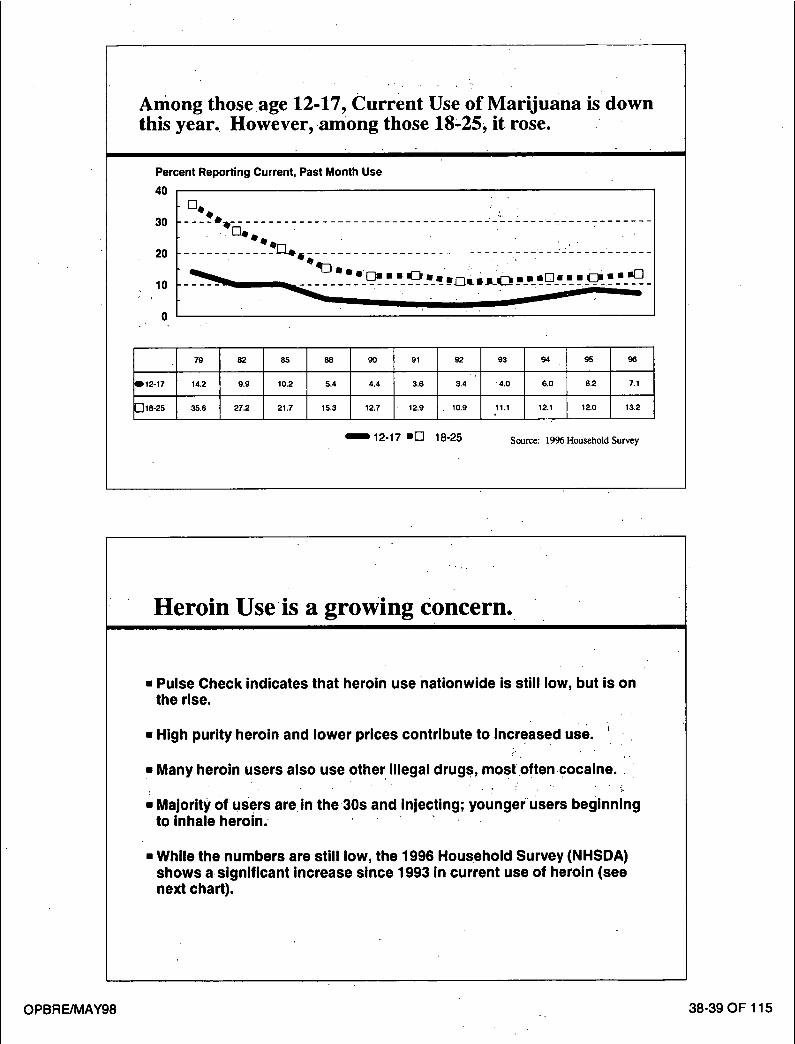
Among thoseage 12-17, Current Use of Marijuana is down this year. However, among those 18-25, it rose.
P e r c e n t R e p o r t i n g C u r r e n t , P a s t M o n t h U s e
4 0
D e : " 3 0 _ _ _ ~ a l , . ~ . . ; . . . . . . . . . . . . . . . . . . . . . . . . . : - . . . . . . . . " - - : . . . . - . . . . - . . . . . . .
• - C ~ i I " . - . . . ,
20 . . . . . . . . . . . . - " ~ . ; , - - - - . . . . . . . . . . . . . . . . . . . . . . - - - - - : ' : : - : - . . . . . .
% 0 1 1 . I L l , • F - l i . . ; l d ~ ! i l i l l - - l l l l l l i C Z l i l l 1 0 . . . . . . . . . . . . . . . . - - - - - . . . . _l . . . . . . . . ": . . . . . . • . . . . . . . . . .
, . . , • . .
112-17
D18-2s
79 82 85 88 90 91 92 93 94 95 96
14.2 9.9 10.2 5.4 4,4 3:6 3.4 " 4.0 6.0 8.2 7.1
35.6 27,2 21.7 15.3 12.7 12.9 10.9 11.1 12.1 12.0 13.2
12-17 "i '-I 18-25 Source: 19% Household Survey
Heroin Use is a growing Concern.
Pulse Check indicates that heroin use nationwide is still low, but is on the rise.
• High purity heroin and lower prices contribute to increased use.
• Many heroin users also use other illegal drugs, mostoften •cocaine. : ' , ? : , ':
• Majority of users are in the30s and injecting; younger Users beginning to inhale heroin. •
While the numbers are still low, the 1996 Household Survey (NHSDA) shows asignificant increase since 1993 in current use of heroin (see next chart).
OPBRE/MAY98 38-39 OF 115
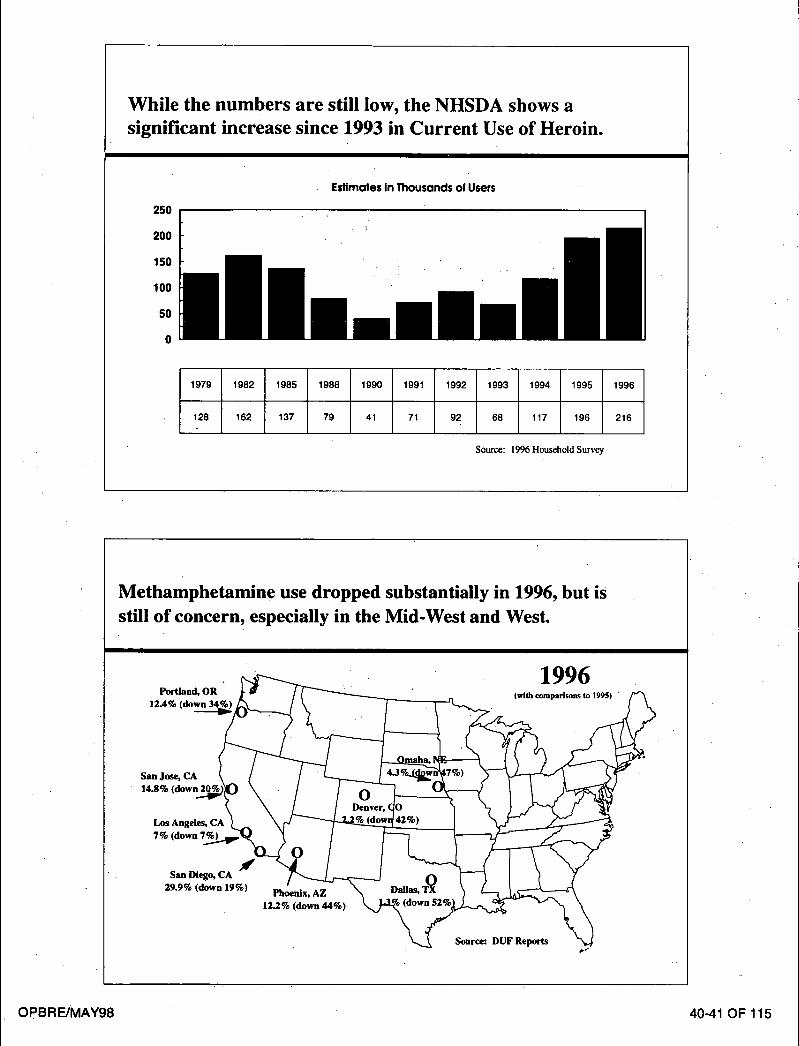
While the numbers are still low, the NHSDA shows a significant increase since 1993 in Current Use of Heroin.
250
200
150
100
50
0
Estimates In Thousands of Users
1979 1982 1985 1988 1990 1991 1992 1993 1994 1995 1996
128 162 137 79 41 71 92 68 117 196 216
Source: 1996Household Survey
Methamphetamine use dropped substantially in 1996, but is still of concern, especially in the Mid-West and West.
14.8% (down 2 ~ ~ • ~ / De?ver, 0 ~ ~
29.9% (down 19%)Pl~nJx, AZ N D(doaSowTn~$, %
1996 (with comparisons to 1995)
I
Source: DUF Reports
O P B R E / M A Y 9 8 40-41 OF 115
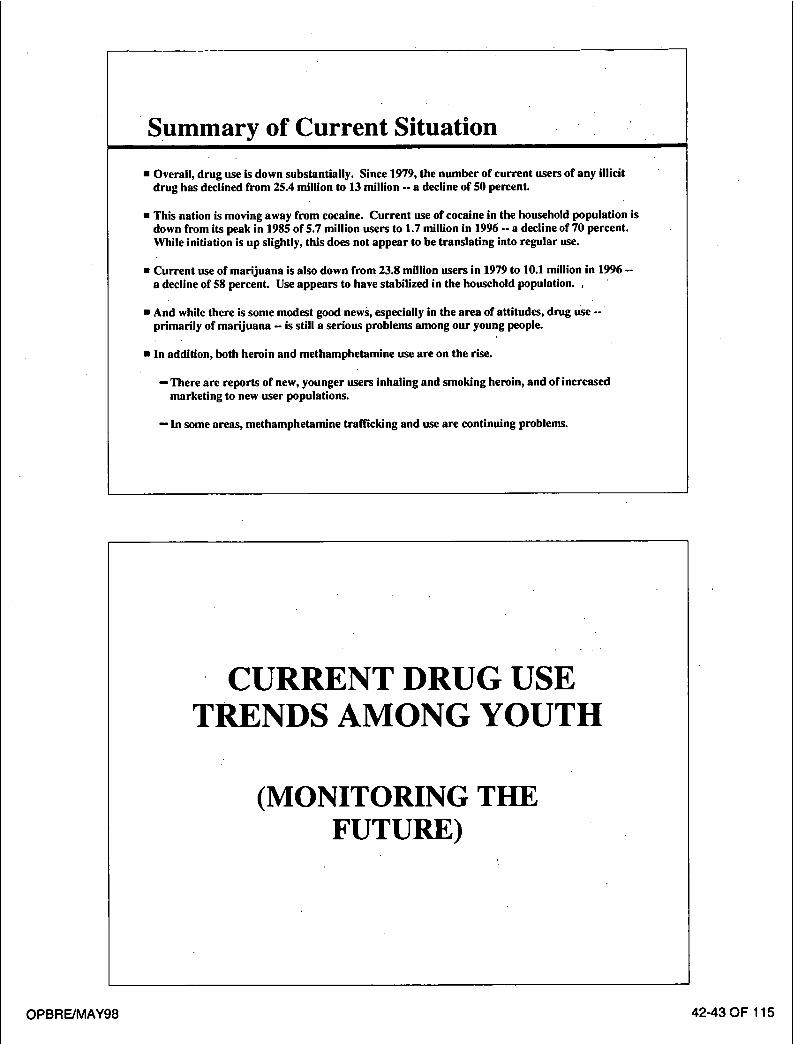
Summary of Current Situation
• Overal l , d rug use is down substant ia l ly . Since 1979, the n u m b e r of cu r r en t users of any illicit d r u g has declined f rom 25.4 million to 13 million -- a decline of 50 percent .
• This nat ion is moving away f rom cocaine. C u r r e n t use of cocaine in the household popula t ion is down f rom its peak in 1985 of 5.7 million users to 1.7 million in 1996 -- a decline of 70 percent . While ini t iat ion is up slightly, this does not a p p e a r to be t rans la t ing into regular use.
• C u r r e n t use of m a r i j u a n a is also down f rom 23.8 million users in 1979 to I0.1 million in 1996 -- a decline of 58 percent . Use appea r s to have stabil ized in the household population. , "
• And while there is some modest good news, especially in the a rea of at t i tudes, d rug use - - pr imar i ly of m a r i j u a n a -- is still a serious problems among ou r young people.
• In addit ion, both hero in and m e t h a m p h e t a m i n e use a re on the rise.
-- There are repor ts of new, younger users inhal ing and smoking heroin, and of increased marke t ing to new user populat ions.
-- In some areas, m e t h a m p h e t a m i n e traff icking and use are cont inuing problems.
CURRENT DRUG USE TRENDS AMONG YOUTH
(MONITORING THE FUTURE)
OPBRE/MAY98 4243 OF 115
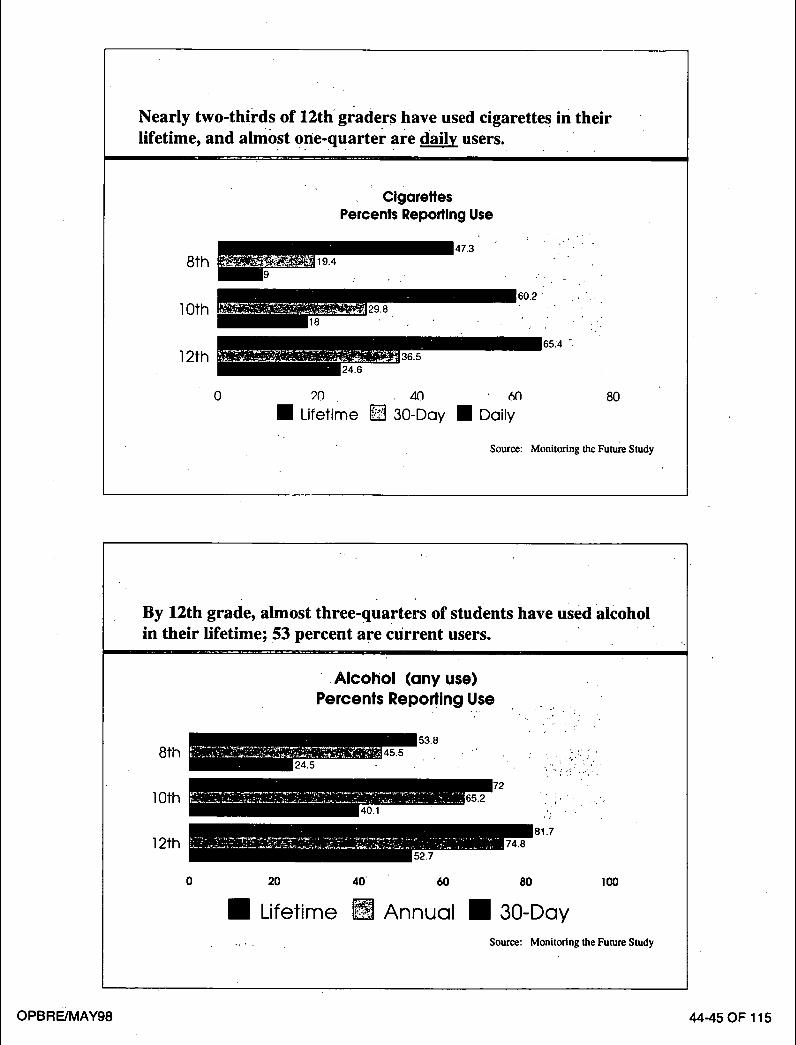
Nearly two-thirds of 12th graders have used cigarettes in their lifetime, and almost 0ne-quarter are ~ users.
8th
10th
12th
'C igaret tes Percents Reporting Use
47.3
• . /
60.2 , • ' , .
65.4
0 ?0 40 6n 8O I Lifetime [ ] 30-Day l Daily
Source: Monitoring the Future Study
By 12th grade, almost three-quarters of students have used •alcohol in their lifetime; 53 percent are current users.
8 t h
• Alcohol (any use) Percents Reporting Use
. .~' •
: , / / : ~ .
10th
12 th
" " i . , . ,
81.7
2 0 4 0
I Lifetime
60
Annual
80 I00
30-Day Source: Monitoring the Future Study
OPBRE/MAY98 4445 OF 115

Drug use i s highest among 12th graders . More than 50 percent of them have tr ied an illicit drug, and more than one in four are cu r ren t users.
Any Illicit Drug Percents Reporting Use
8th
10th
12th
29.4
47.3
54,3
0 10 20 30 40 50 60
1 Li fe t ime 1 3 0 - D a y
I Annual
70
Source: Monitoring the Future Study
By the time they are seniors, almost 1 in 4 are current marijuana users and 1 in 20 use every day.
I
Marijuana Percents Reporting Use
23.1
8th
39.8
10th
12th 44.9
0 10 20 30 40 50 60
1 Lifetime 1 30-Day PJm Annual ~! Daily
Source: Monitoring the Future Study
OPBRE/MAY98 46-47 OF 115

Cocaine use is less prevalent, but 9 percent of seniors have used cocain¢ during their l ifetime and 2 percent are current users. .
Cocaine Percents Reporting Use
8th
10th
4 4.4
~ 7 1
12th
2. 4 6
Lifetime ~ Annual
3.7
8 10 i2 "
1 30-Day Source: Monitoring the Future Study
Heroin use a m o n g students is also low, but use among 8th graders equ: or exceeds use in 10th and 12th grades.
8th
10th
12th
0.0
0.6
Heroin
1,4
1.2
0.5
0.5 1.0 1.5
l Lifetime [] Annual
2.1
2.1' --
I I
2.0 2.S
30-Day Source: Monitoring the Future Study
OPBRE/MAY98 48-49 OF 115

Drug use among 8th and 10th graders has shown some decline,
but use by 12th Graders is still increasing + •.
30-Day Use of Any Illicit Drug Percent who report use.
30
25
20
15
10
5
0
1991 1992 1993 1994 1995 1996 1997
F}Sth Grade 6 7 8 11 12 15 13
O lOth Grade 12 11 14 19 20 23 23
t~ 12~ Grade 16 14 18 22 24 25 26
Source: Monitoring the Future Study
The use of Mari juana among 12th Graders fuels much of the increase
Percent who report use.
25
30-Day Marijuana Use Up
20
15
10
5
0 • o
1991 1992 1993 1994 1995 1996 1997
[-I 8th Grade 4 4 5 8 9 11 10
O 10th Grade 9 8 11 16 17 20 21
I~ 12th Grade 14 12 16 19 21 22 24
Source: Monitoring the Future Study
OPBRE/MAY98 50-51 OF 115
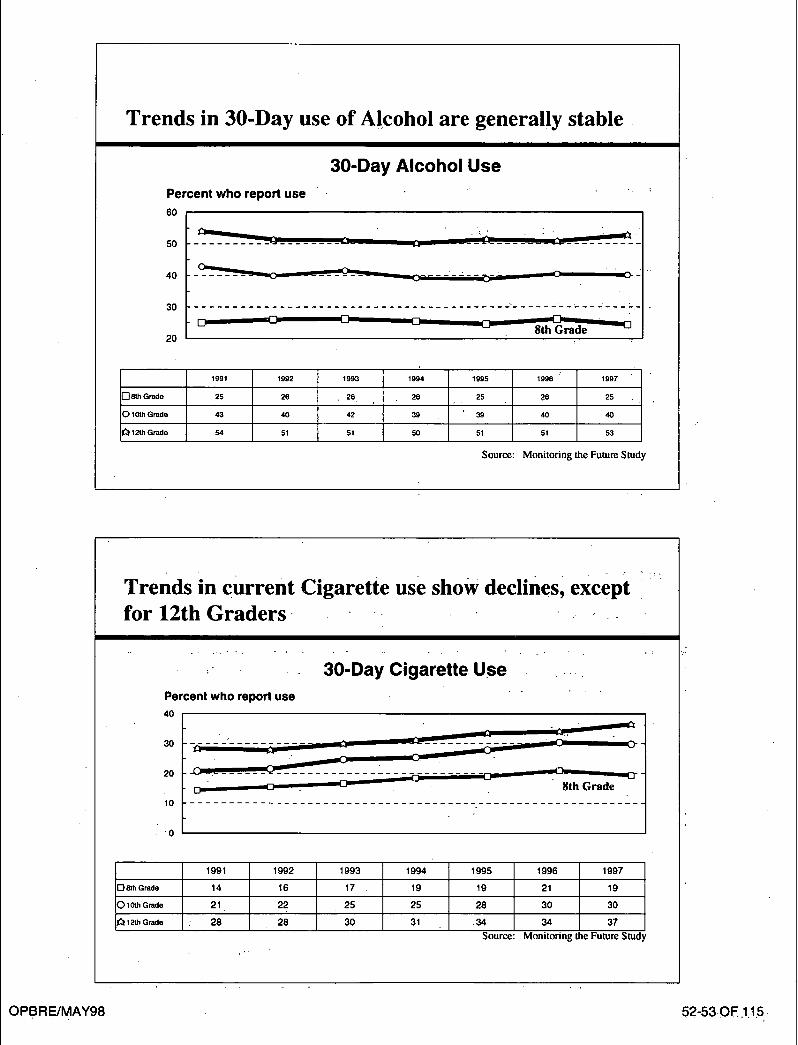
Trends in 30-Day use of Alcohol are generally stable
Percent who report use 6O
30-Day Alcohol Use
50
40
30
20
__~___:__:_~_:___ -?
. . . . . . . - - - o . . . . . . . . ~ : , = - " - ' ~ o -
. . . . . . . . . . . . . . . . . . . . . . . . . . . . . . . . . . . . . . . . _- . . . . . . ' _ _ ~ - _ _ . ~ _ _ _ -
D - - ~ D ~ ~ 8 ~ t h L ; r a d e ~
1991 1992 1993 1994 1995 1996 : 1997
"-18th Grade 25 26 26 26 25 26 25
0 t0 th Grade 43 40 42 39 39 40 40
~11201 Grade 54 51 51 50 51 51 53
Source: Monitoring the Future Study
Trends in current Cigarette use show declines, except ~:~: for 12th Graders.
• . 30-Day Cigarette, Use . . . .
Percent who report use 40
3 0 . . . . . . . . . . . . . . . . . . . . . . . . . . . . . .
20 ~ . . . . : . . . . - - - . . . . . . .
• . 8 t h G r a d e
1 0 . . . . . . . . . . . . . . . . . . . . . . . . . . . . . . . . . . . . . . . . . . . . . . . . . . . . . . . . . . .
0
1991 1992 1993 1994 1995 1996 1997
r-~ 8~h Grade 14 16 17 19 19 21 19
O 10th Grade 21 22 25 25 28 30 30
I~ 12th Grade : 28 28 30 31 .34 34 37
Source: Monitoring the Future Study
O P B R E / M A Y 9 8 5 2 - 5 3 0 F 1.15.
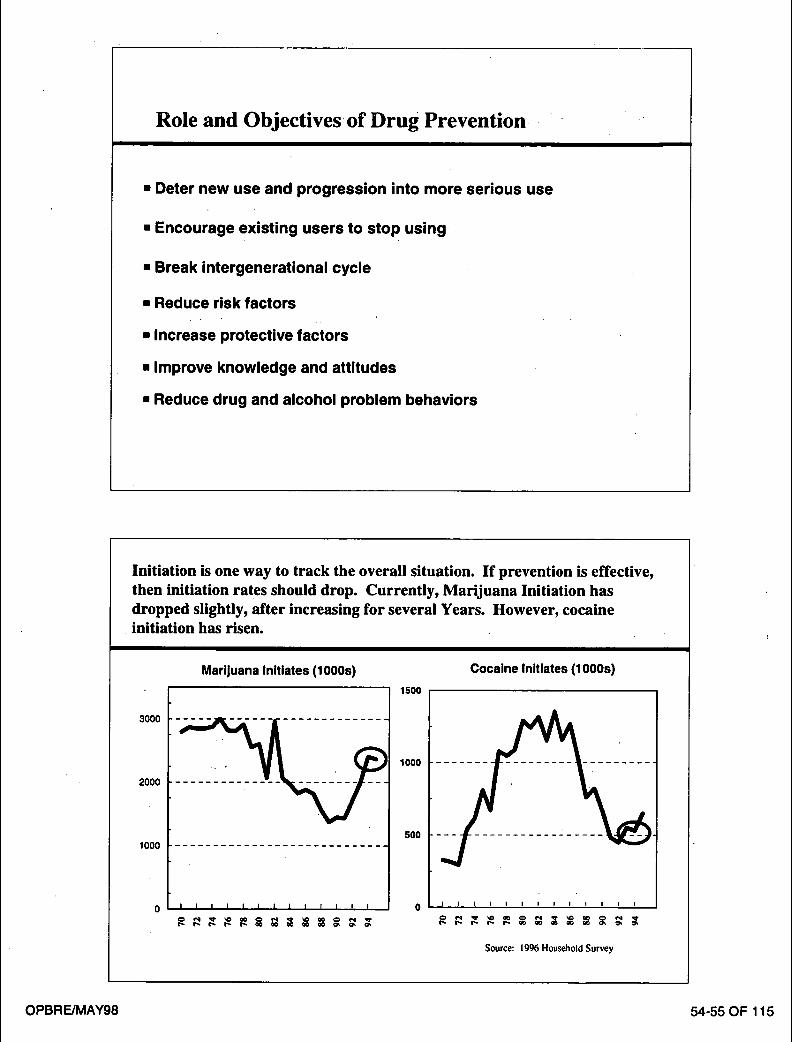
Role and Objectives of Drug Prevention
• Deter new use and progression into more serious use
• Encourage existing users to stop using-
, Break intergenerational cycle
• Reduce risk factors
• Increase protective factors
• Improve knowledge and attitudes
• Reduce drug and alcohol problem behaviors
Initiation is one way to track the overall situation. If prevention is effective, then initiation rates should drop. Currently, Marijuana Initiation has dropped slightly, after increasing for several Years. However, cocaine initiation has risen.
Marijuana Initiates (10005) Cocaine Initiates (1000s) 1500
3000
1000
2000
500 - , - - , , , 1000
0 I I I I I f I I I I I ~ ~ 0 i , , ~ I , I
Source: 1996 Household Survey
OPBRE/MAY98 54-55 OF 115

Initiation Rates for both Heroin and Hallucinogens are lower, but they are rising dramatically. We must do a better job with prevention.
Heroin Initiates (lO00s) Hallucinogen Initiates (1000s) 1 5 0
1200. i
lOO 8OO
5 0 4 0 0 . . . . . . . . . . . . . . = - = . . . . . . . . . . .
0 0 , , , I ~ , , , , , , '
Source: 1996 Household Survey
Rising youth drug use can be l inked to changes i n attitudes about risk and social acceptability.
90
8O
i L .
~' 60
Disapproval of drug use begins to drop after 1990
Perceptio~nb~ of the risk of drug use ~ b e g i n s to • w_eaken alter 1991 /
I I I I I I I I I
89 90 91 92 93 94 95 96 97 S o u r c e : M o n i t o r i n g t h e F u r o r e Study
20
10
OPBRE/MAY98 56-57 OF 115

Possible Factors Affecting Weakening Risk Perception
• What hypotheses seem most promising to account for the observed changes [in drug use] ?
• Rise in delinquency • Increased use of gateway drugs (cigarettes) • Decline in perceived harmfulness of drug use
Mass culture (e.g., media) • Reduction in informal learning about risks of drug Use • Decline in Executive Leadership (Federal, State, local,
civic) • Increased il l icit drug availability & lower price (e.g.,
Marijuana)
Source: ONDCP Report on the Meeting of the Ann Arbor Group, June 1994.
ONDCP YOUTH MEDIA CAMPAIGN
A KEY COMPONENT IN THE PREVENTION ARENA
OPBRE/MAY98 58-59 OF 115

The National Youth Anti-Drug Media Campaign is key to changing attitudes and reducing drug use.
• Time donated for anti-drug public service announcements 0PSAs) has dropped more than $100 million since 1991.
• Youth drug use has increased as perception of risk and social disapproval has decreased.
• Anti-drug experts emphasize the need to overcome "generational forgetting" after the drug crises of previous decades.
A multi-faceted communications campaign can "de-normalize" drug use in the minds of youth and empower parents to help their children with this critical problem.
CAMPAIGN PHASES
Plan Advance Campaign Procurement
Implement ] ""~Phase I ] . _ ~ P h ~ ~
Evaluate
MA~/OCT 97 97
12-city Test
Phase 1 Evaluation
tw * • t t Vahdatwn
ase 3 Eval
JAN FEB JUL OCT FY 98 98 98 98 2002
OPBRE/MAY98 60-61 OF 115
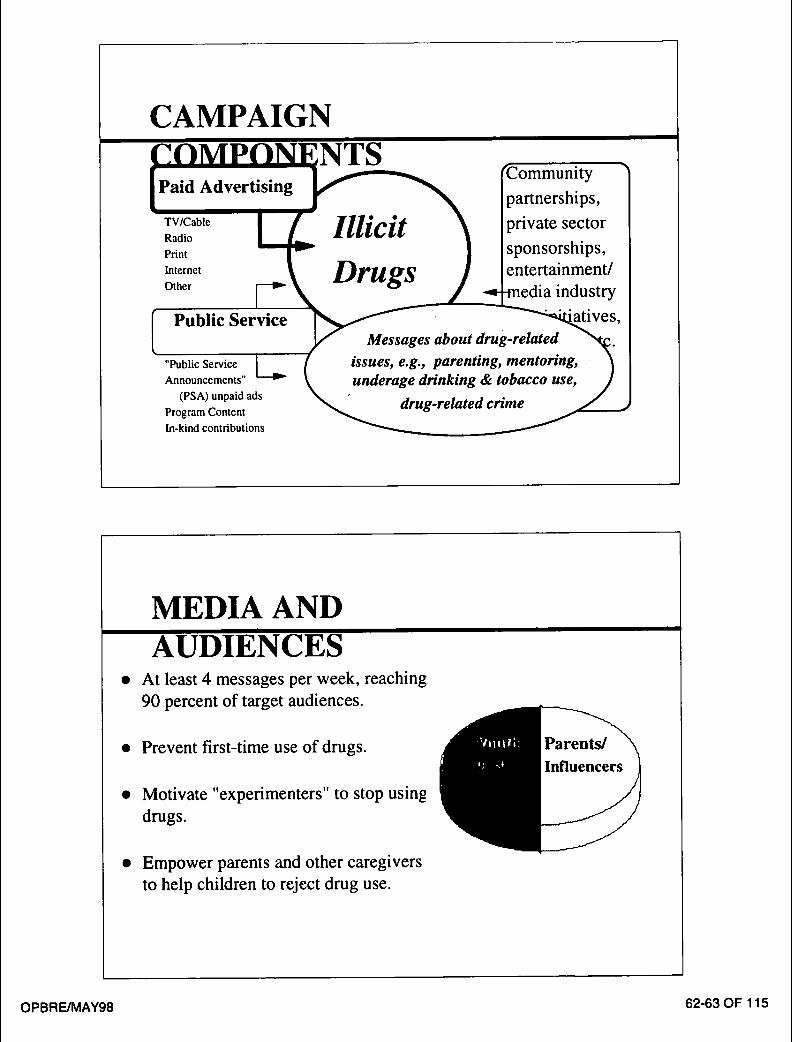
CAMPAIGN
Paid Advertising
TV/Cable Radio Print Internet Other
Public Service
"Public Service L Announcements"
(PSA) unpaid ads Program Content In-kind contributions
Illicit Drugs
Community
partnerships,
private sector
sponsorships, entertainment/ media industry
Messages about drug-related
issues, e.g., parenting, mentoring, underage drinking & tobacco use,
drug-related crime ~,
MEDIA AND AUDIENCES
At least 4 messages per week, reaching 90 percent of target audiences.
• Prevent first-time use of drugs.
• Motivate "experimenters" to stop using drugs.
• Empower parents and other caregivers to help children to reject drug use.
OPBRE/MAY98 62-63 OF 115
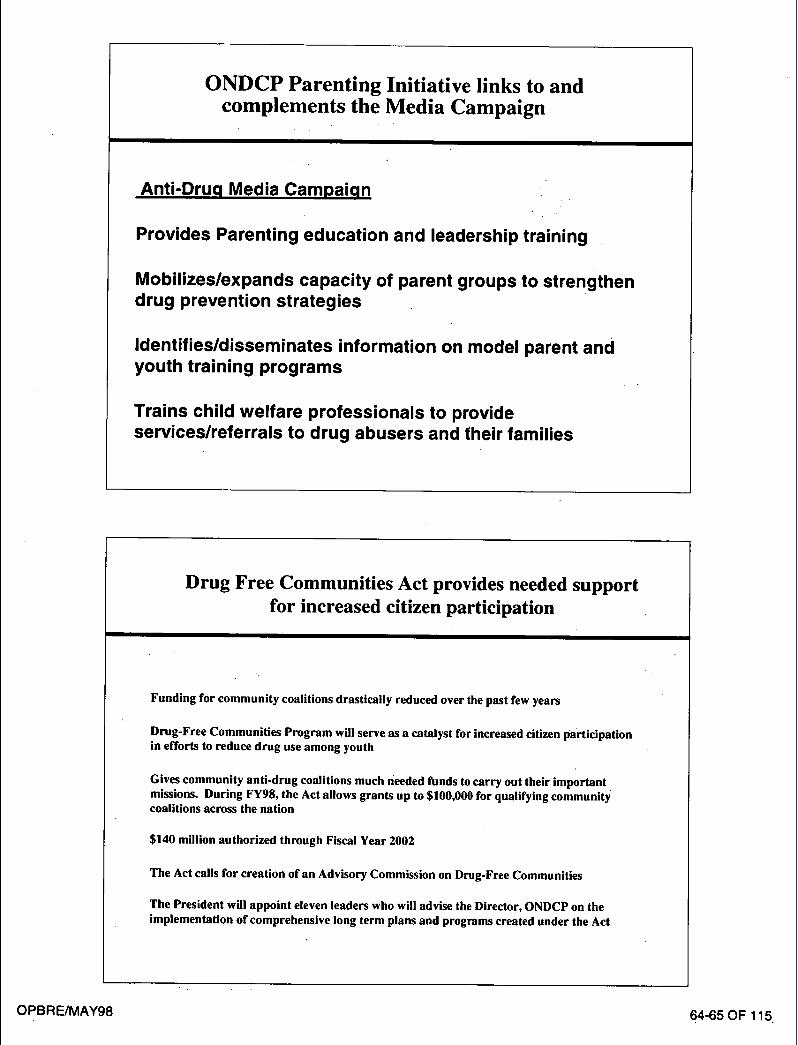
ONDCP Parenting Initiative links to and complements the Media Campaign
Anti-Drug Media Campaign
Provides Parenting education and leadership training
Mobilizes/expands capacity of parent groups to strengthen drug prevention strategies
Identifies/disseminates information on model parent and youth training programs
Trains child welfare professionals to provide services/referrals to drug abusers and their families
Drug Free Communities Act provides needed support for increased citizen participation
Funding for community coalitions drastically reduced over the past few years
Drug-Free Communities Program will serve as a catalyst for increased citizen participation in efforts to reduce drug use among youth
Gives community anti-drug coalitions much needed funds to carry out their important missions. During FY98, the Act allows grants up to $100,000 for qualifying community coalitions across the nation
$140 million authorized through Fiscal Year 2002
The Act calls for creation of an Advisory Commission on Drug-Free Communities
The President will appoint eleven leaders who will advise the Director, ONDCP on the implementation of comprehensive long term plans and programs created under the Act
L
OPBRE/MAY98 64-65 OF 115
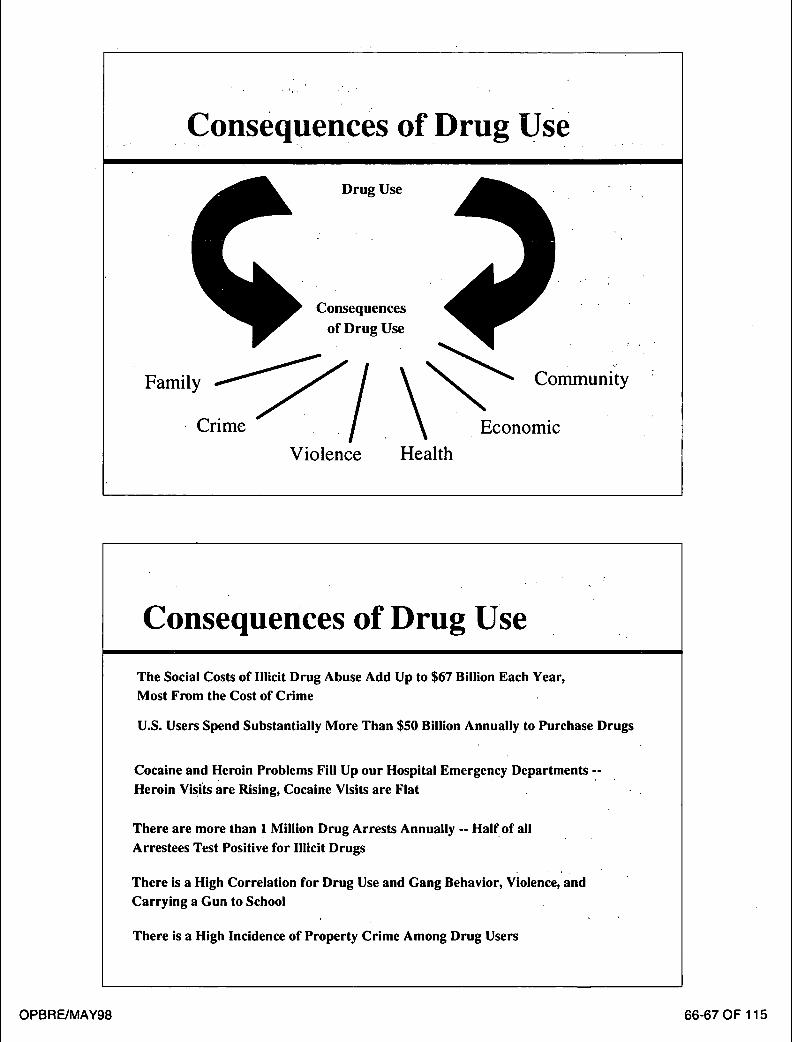
Consequences of Drug Use
Drug Use
Consequences
of Drug Use q
Family Crime ~ ' I / ~ ~ ~
Violence Health
Communiiy " Economic
Consequences of Drug Use
The Social Costs of Illicit Drug Abuse Add Up to $67 Billion Each Year,
Most From the Cost of Crime
U.S. Users Spend Substantially More Than $50 Billion Annually to Purchase Drugs
Cocaine and Heroin Problems Fill Up our Hospital Emergency Departments --
Heroin Visits are Rising, Cocaine Visits are Flat
There are more than 1 Million Drug Arrests Annually -- Half of all
Arrestees Test Positive for Illicit Drugs
There is a High Correlation for Drug Use and Gang Behavior, Violence,and
Carrying a Gun to School
There is a High Incidence of Property Crime Among Drug Users
OPBRE/MAY98 66-67 OF 115

The money 'spent to buy drugs saps
the economic power of the Nation
50.0
U.S. Users Spend $57 Billion Annually Billions of Dollars
40.0
30.0
20.0
10.0
0.0
38.0
. 6
7.0
2.7
Cocaine Heroin Marijuana Other Source: ONDCP Paper, What America's Users Spend on Illegal Drugs
The Economic Costs relating to alcohol and drug abuse are increasing, adding • up to $377 billion in 1995
$300
$250
- f9 $200
o a $150 ¢.. ._o
m $100
$50
$0 1985 '1988 1990 1992 1995
• , , - ,
• • I--] Drugs n Alcohol Sources: Rice et al. 1990; Robert Wood Johnson Foundation, 1993; National Institute on I~'ug Abuse & National Institute on Alcohol Abuse end Alcoholism, March 1998.
O P B R E / M A Y 9 8 68-69 O F 1~15

The costs of crime that can be attributed to drug abuse are substantial
(Millions of dollars) •
Total: $59 billion
Economic Costs to Victims
Private Legal Defense
Federal Drug Traffic Control i m
Criminal Justice System i i
Lost Productivity Related to Incarceration
Lost Productivity Related to Cdme Careers
Other Lost Productivity
$0
mm
i $398
I-- $3,691
$3,486 .
s13',7~
$17,907
$19,198
$5 $10 $15 $20 $25
Source: National Institute on Drug Abuse & National Institute on Alcohol Abuse and Alcoholism, March 1998.
The economic costs of drug abuse total $98 billion, with the bulk relating to lose earning potential, ~
(Millions of dollars)
Other Imp ~','*= $18,30
18.7%
Health Care Expenditures $9,931
10.2%
st Earnings ~,o9,421
71.1%
Source: National Institute on Drug Abuse & National InatHute on Alcohol Abuse and Alcoholism, March 1998.
OPBRE/MAY98 70-71 OF 115

The productivi ty impact of drug abuse is also substantial , totaling $69 billion
(Lost earnings in billions of dollars)
Incarceration
Premature death
Impairment ;14.2
Victims of crime E $2.1
S Institutionalization ;1.s
$0.0 $5.0 $10.0 $15.0 $20.0
Source: National Institute on Drug Abuse & National Institute on Alcohol Abuse and Alcoholism, March 1998.
$25.0
The economic cost of drug abuse totals $98 billion: Government and abusers and their families bear the
brunt of this cost (B i l l ions of dol lars)
% .
Private InsS
• G0vernme • . j . ) . i
Losses tO VlCl[ImS
j . .
Abusers and their Households
Source: National Institute on Drug Abuse & National Institute on Ncohol Abuse and Alcoholism, March 1998.
OPBRE/MAY98 72-73 OF115

The economic costs of drug abuse in the United States have risen over the years.
$120 [ S11ol • ' 2 $10o
$80
$60
$40
$20 1985 1988 1990 1992 1995
1992 Dol lars ' - " - - C u r r e n t Dol lars
Sources: Rice et al. 1990; Robert Wood Johnson Foundation, 1993; National Institute on Drug Abuse & National Institute on Alcohol Abuse and Alcoholism, March 1998.
Drug-related murders are declining
# of Deaths
1500 ~-
1000
1402
Murders Related to Narcotic Drug Laws
1 ~ R 7 4 ~ c , J
500
1988 1989 1990 1991 1992 1993 1994 1995 Source: FBI, Uni~rm Crime R¢~.
1996
OPBRE/MAY98 74-75 OF 115
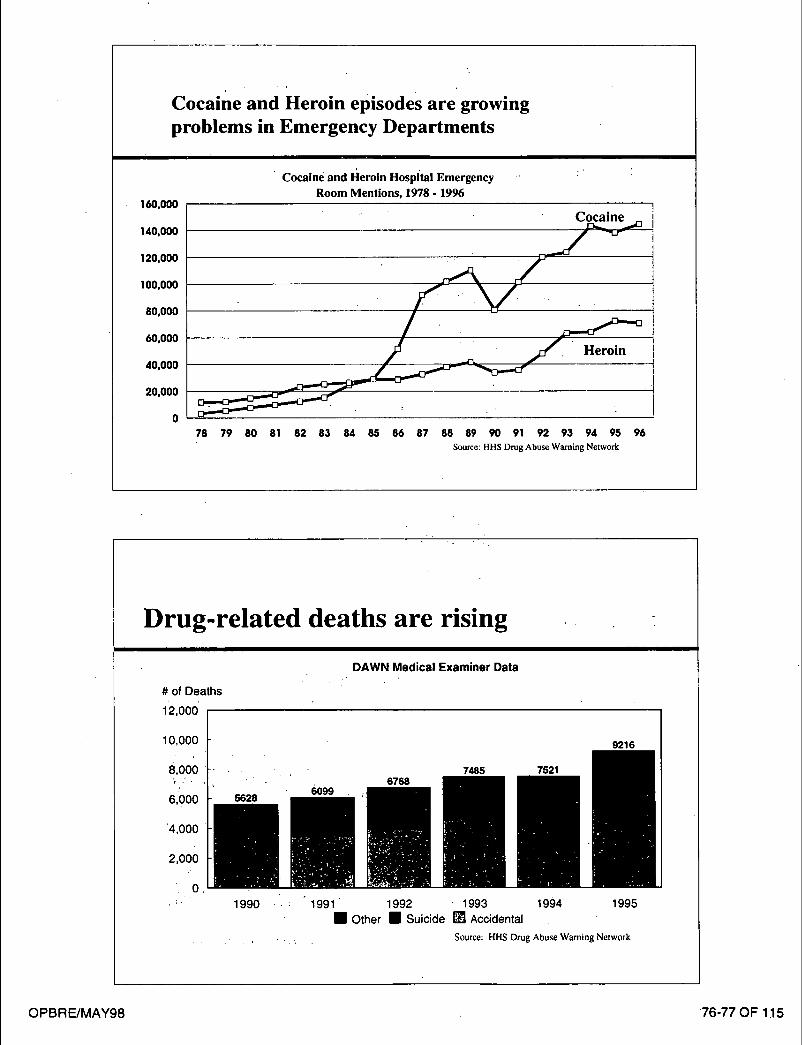
Cocaine and Heroin episodes are growing problems in Emergency Departments
160,000
Coca ine a n d He r o in Hosp i ta l E m e r g e n c y
R o o m M e n t i o n s , 1978 - 1996
,,o.ooo - ~ , . o o o
100,000
80,000
.ooo
20°000
78 79 80 81 82 83 84 85 86 87 88 89 90 91 92 93 94 95 96 Source: HHS Drug Abuse Warning Network
% ' *
Drug-relateddeaths are rising
# of Deaths
12,000
10,000
8,000
6:000
'4,000
2,000
.0 1990
DAWN Medical Examiner Data
1991 1992 1993 1994 1995 • Other • Suicide [ ] Accidental
. : _ Source: HHS Drug Abuse Warning Network
OPBRE/MAY98 76-77 OF 115

Drug-related criminal activity is a " problem serious
• NIDA s tudy of drug use r s not in t rea tment found:
• 46 percent report legal-only s o u r c e s of income
10 percent report illegal-only s o u r c e s of income
• 42 percent report both legal and illegal sou rces
• 2 percent report no income.
• 30 percent of il legal income was generated from property crimes; 42 percent was from commercial sex.
Source: NIDA, Drug Procurement Study.
Drug-related arrests are rising
Arrests for Drug Abuse Violations (in millions)
"1.5
0.5
1988 1989 1990 1991 1992 1993 1994 1995 1996
Source: Uniform CrirncRepons, FBI.
I OPBRE/MAY98 78-79 OF 115
Reason For Drug Arrest
Arrests for Drug Abuse Violations, 1996
HerolnlCacalno Pos 25.6%
. . . . . . . . "la Sale/Manufacture 6.3%
Heroln/Cocalne Sale/Manufacture 14.2°/o-
MarlJuana Posse 36.3%
Other Possession 13.3%
Sole/Manufacture 4.3%
Source: Uniform Crime Reports, FBI.
Marijuana cases make up only a small percentage of
Felony Drug Trafficking Convictions in State Courts
200,000
150,000
100,000 108,815
166,430
50,000
0 Possession Trafficking
Source: BJS Report, January 1997
Breakdown of Trafficking Convictions, by Drug
45,318
B 15,931 I Marijuana Unspecified
104,181
Other
OPBRE/MAY98 80-81. OF 115
The number of people in Jail or Prison rose to an
all-time high of more than 1.7 Million at Midyear, 1997
1800
1500
1200
900
600
300
0 1985 1987 1989 . 1991 1993 1995
Federal Prisons
Source: Bureau of Justice Statistics, 1998
1 State Prisons 1 Local Jails
1997
Midyear
DRUG TREATMENT . . . .
. ' ~ . .
OPBFIE/MAY98 82-83 OF 115
Almost I million persons are in treatment, every day
1,200,000
1,000,000
800,000
600,000
400,000
200,000
0
Clients in Specialty Treatment for Drugs and Alcohol
(one-day census of active clients)
1,00g,127
80 82 87 89 90 91 92 93 94 95 96
Source: Uniform Facility Data Set, DHHS/SAMHSA, Dec 97
More than half of the clients are being treated in
outpatient settings
Clients in Treatment, by Facility Setting
Free-Standing/Outpatient
Mental Health Services
Physical Health Services
Community Settings 4.1
l Correctional Settings I
0.0
8.3
12.8
J
20.0 40.0 60.0 80.0 100.0
Source: Uniform Facility Data Set, DHHS/SAMHSA, Dec 97
oPBRE/MAY98 84-85 O# ~ii 5
Illicit drug problems are present in 65 percent of those in treatment
940,141 Clients In Treatment, 1996
Drugs Only 29.1%
hol Only
1.9%
ohol
43.1%
Source: Uniform Facility Data Set, DHHS/SAMHSA, Dec 97
Almost 80 percent of clients in treatment are 25 years of age or more
Age Group
2! 3C
18 & under 8.2%
~,5÷ ~.1%
Source: Uniform Facility Data Set, DHHS/SAMHSA, Dec 97
OPBRE/MAY98 86-87 OF 115

Almost 60 percent of those in treatment are white
His
14.6
Other 3.3
Black White 22.6 59.8
Source: Uniform Facility Data Set, DHHS/SAMHSA, Dec 97
Most cocaine users in treatment have had less than three admission to treatment, in their lifetime
N u m b e r of Admiss ions to Treatment , Ufetlme
40
30
20
10
0 None I 2 3 4 5 or more
Source: Subszaao~ Abuse a~l Mental Hr.alth Scrvice.s Admi~su~on, 1997
OPBRE/MAY98 88-89 OF 115

Almost half of heroin users currently in treatment have been in treatment three of more times in their lifetime
N u m b e r of Admiss ions to T r e a t m e n t , U f e t l m e
35
30
25
20
15
10
5
0 None 1 2 3 4 5 or more
Source: Substance Abuse and Mental Health Scrviocs Administration, 1997
M a r i j u a n a users in t r e a t m e n t g e n e r a l l y have not b e e n in t r e a t m e n t be fore
N u m b e r of Admiss ions to Treatment , L i fet ime
70 r-
60
50
40
30
20
10
0
59.5
None
22.4
8.2 3.4 1.5
2 3 4 5 or more Source: Substance Abuse and Men~l H~Ich Services Adm/nis~ration, 1997
OPBRE/MAY98 90-91 OF 115
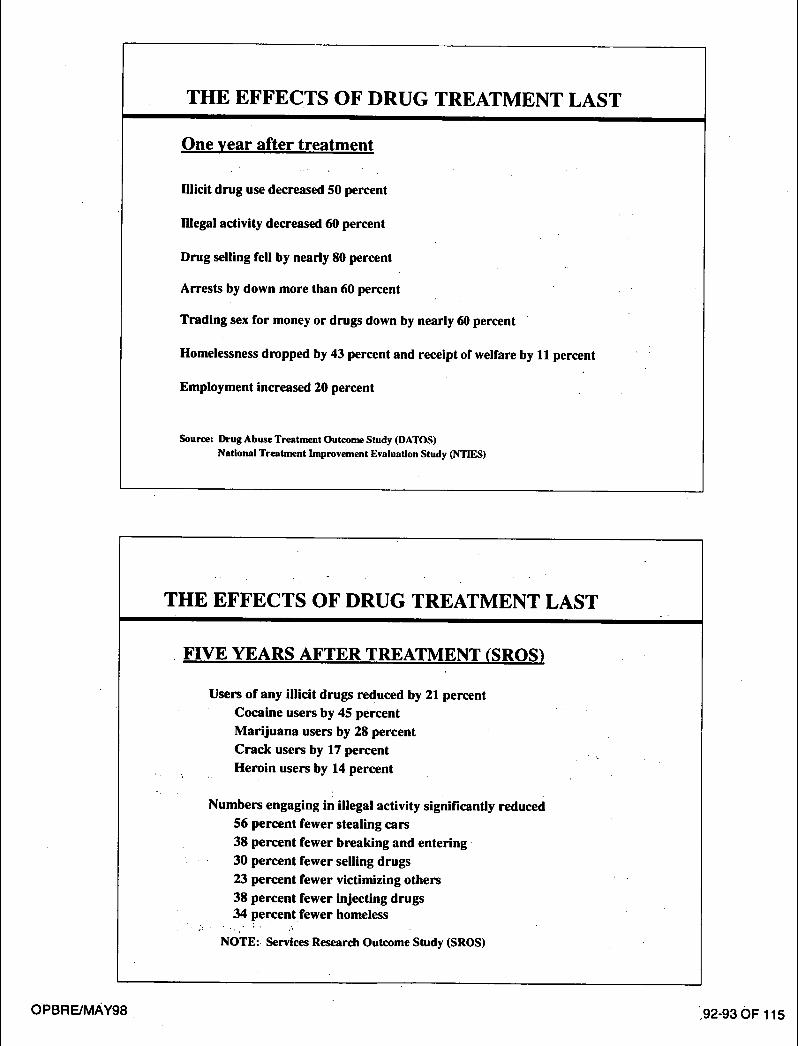
THE EFFECTS OF D R U G TREATMENT LAST
One year after treatment
Illicit drug use decreased 50 percent
Illegal activity decreased 60 percent
Drag selling fell by nearly 80 percent
Arrests by down more than 60 percent
Trading sex for money or drugs down by nearly 60 percent
Homelessness dropped by 43 percent and receipt of welfare by 11 percent
Employment increased 20 percent
Source: Drug Abuse Treatment Outcome Study (DATOS) National Treatment Improvement Evaluation Study (NTIES)
THE EFFECTS OF DRUG TREATMENT LAST
FIVE YEARS AFTER TREATMENT (SROS)
Users of any illicit drugs reduced by 21 percent Cocaine users by 45 percent Marijuana users by 28 percent Crack users by 17 percent Heroin users by 14 percent
Numbers engaging in illegal activity significantly reduced 56 percent fewer stealing cars 38 percent fewer breaking and entering
' . 30 percent fewer selling drugs 23 percent fewer victimizing others 38 percent fewer injecting drugs 34 percent fewer homeless
NOTE:, Services Research Outcome Study (SROS)
OPBRE/MAY98 ~92-93 OF 115
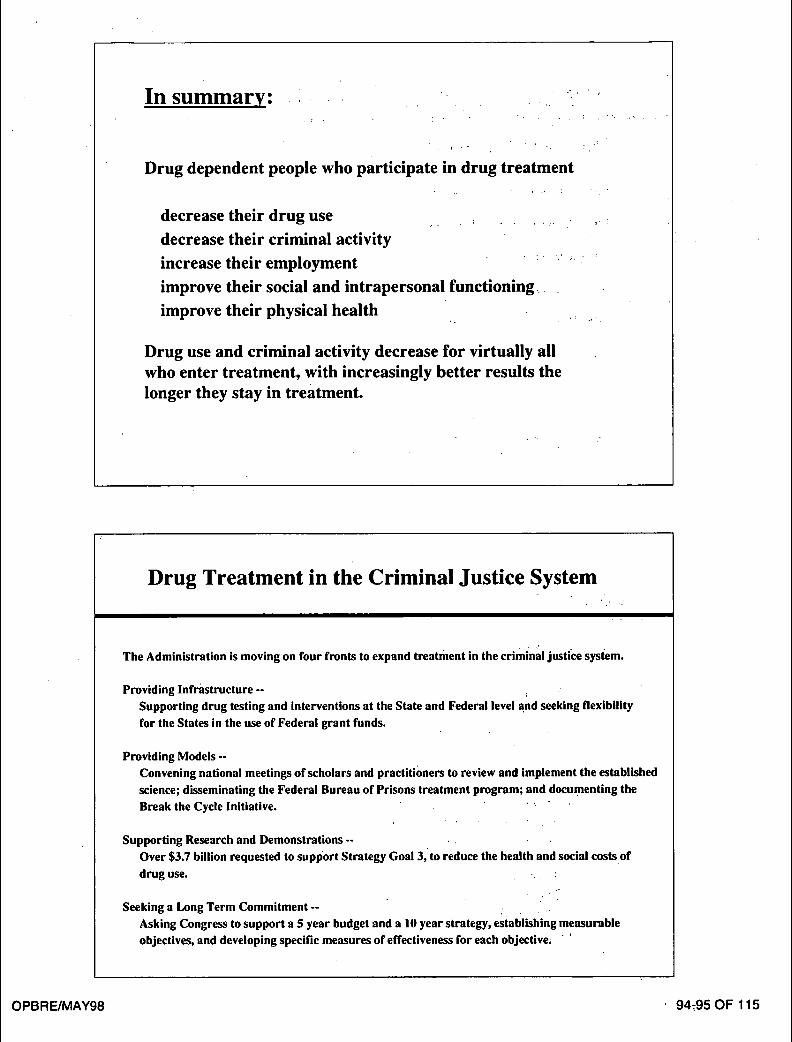
In summary: . . . . t
Drug dependent people who participate in drug treatment
decrease their drug use : .... decrease their criminal activity increase their employment improve their social and intrapersonal functioning improve their physical health
Drug use and criminal activity decrease for virtually all who enter treatment, with increasingly better results the longer they stay in treatment.
Drug Treatment in the Criminal Justice System
The Administration is moving on four fronts to expand treatment in the criminal justice system.
Providing Infrastructure - -
Supporting drug testing and interventions at the State and Federal level and seeking flexibility for the States in the use of Federal grant funds.
Providing Models -- Convening national meetings of scholars and practitioners to review and implement the established science; disseminating the Federal Bureau of Prisons treatment program; and documenting the Break the Cycle Initiative. ' "
Supporting Research and Demonstrations - -
Over $3.7 billion requested to support Strategy Goal 3, to reduce the health and social costs of drug use. .
Seeking a Long Term Commitment - -
Asking Congress to support a 5 year budget and a 10 year strategy, establishing measurable objectives, and developing specific measures of effectiveness for each objective, ~ '
OPBRE/MAY98 94;95 OF 115
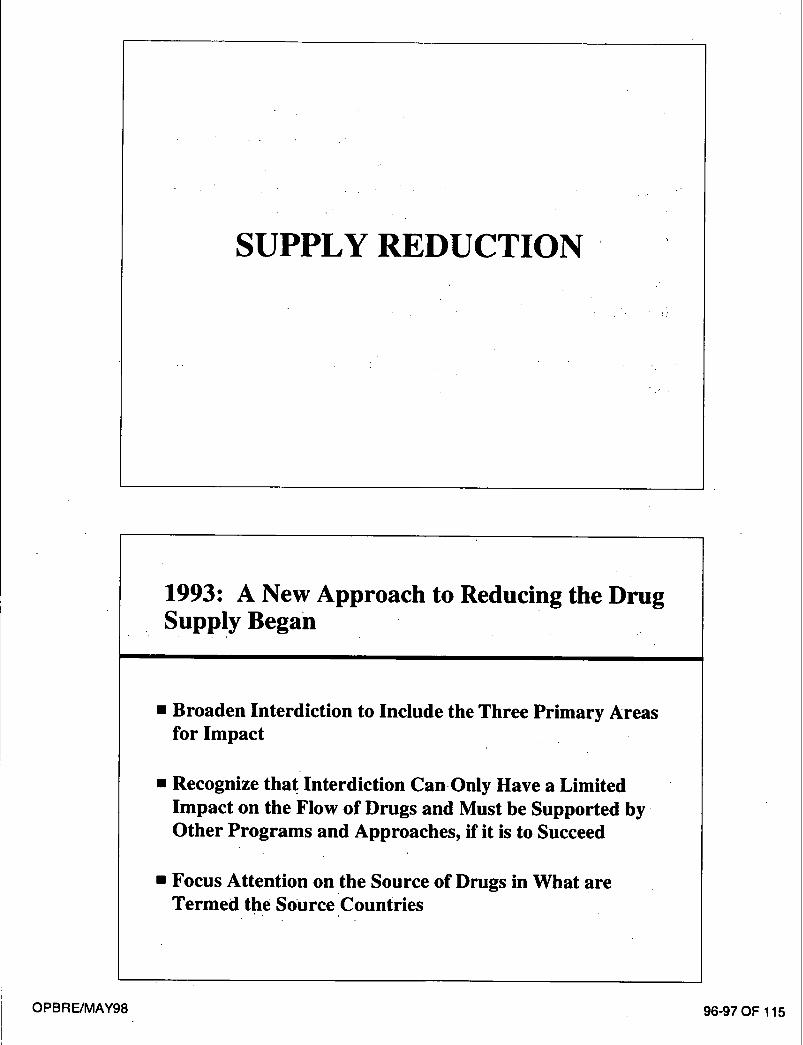
SUPPLY REDUCTION
1993: A New Approach to Reducing the Drug Supply Began
• Broaden Interdiction to Include the Three Primary Areas for Impact
• Recognize that Interdiction Can-Only Have a Limited Impact on the Flow of Drugs and Must be Supported by Other Programs and Approaches, if it is to Succeed
• Focus Attention on the Source of Drugs in What are Termed the Source Countries
OPBRE/MAY98 96-97 OF 115

Interdiction Strengths and Weaknesses
• I n t e r d i c t i o n a lone c a n n o t g r e a t l y i m p a c t the d r u g flow. I t
m u s t be a p a r t of a n overa l l a p p r o a c h t h a t inc ludes
p r e v e n t i o n , t r e a t m e n t , a n d l aw e n f o r c e m e n t .
• W i t h o u t p r o d u c t i o n co n t ro l a t t he source , wi th each
i n t e r d i c t i o n , p r o d u c e r s c an s i m p l y p r o d u c e m o r e
• T a r g e t e d i n t e r d i c t i o n , b a s e d on sol id in te l l igence d a t a , ha s
the g r e a t e s t c h a n c e of success
TheSource Country Focus
• Provides for better intelligence, so interdiction assets can be strategically placed and efficiently used
• Focuses attention close to where drugs are produced, increasing the leverage from each action
• Limits production to maximize the impact from interdiction.
• Interdiction is most effective when it occurs closest to the source because alternative supplies of coca leaf and base are limited
• Thus, stopping the flow of drugs before it can be moved out into the broader expanse of the transit zone is the most effective strategy
OPBRE/MAY98 98-99 OF 115
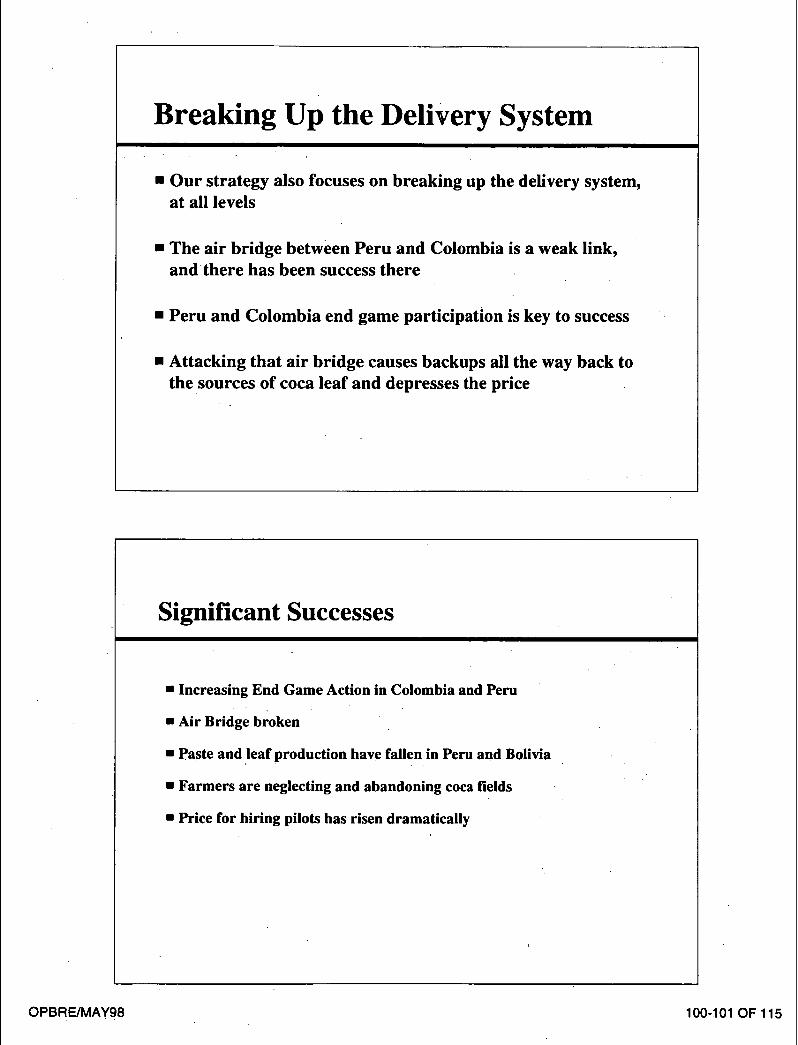
Breaking Up the Delivery System
• Our strategy also focuses on breaking up the delivery system, at all levels
• The air bridge between Peru and Colombia is a weak link, and the re has been success there
• Peru and Colombia end game participation is key to success
• Attacking that air bridge causes backups all the way back to the sources of coca leaf and depresses the price
Significant Successes
• Increasing End Game Action in Colombia and Peru
• Air Bridge broken
• Paste and leaf production have fallen in Peru and Bolivia
• Farmers are neglecting and abandoning coca fields
• Price for hiring pilots has risen dramatical ly
OPBRE/MAY98 100-101 OF 115

Action Against Cartel Leadership :
• Attacking the cartel leadership structure is key to disruption of business •
• Focus on arresting and prosecuting leaders
• Requires substantial political will by source countries
Current Successes and Results
• Seven Cali Cartel leaders are neutralized -- six arrested, the seventh killed resisting arrest
• Traffickers are scrambling for alternative delivery methods as flight paths are blocked
• Transit Zone interdiction is increasingly effective
• Worldwide, interdiction cooperation and coordination are improving
• We are getting better results, overall
• We are more effective in attacking the structure
OPBRE/MAY98 102-103 OF 115
The Southwest Border Presents an incredible challenge for drug control
• Estimates are that 50 to 70 percent of drugs entering United States enter across the Southwest Border
• Southwest Border extends 2,000 miles, with 39 border crossings and 24 Ports of Entry (POEs)
• $149 billion in Mexico/U.S. bi-lateral trade
• Annually 3.3 million trucks, 84 million cars, and 280 million people cross the Southwest Border
Changes needed to improve situation along the Southwest Border (SWB)
Improve accountability -- Assign direct responsibility for coordinating all Federal drug control efforts along the SWB to one federal official and designate an "in-charge" Federal official at each Port of Entry
Expand cooperation with Mexico
Develop a comprehensive intelligence architecture
Develop a system that matches resources with threats and integrates counter-drug technology
Build infrastructure to support the rule of law
Encourage private sector support of our efforts
Implement a systems approach to drug control efforts.
Strengthen the High Intensity Drug Trafficking Area Program
Continue DOD's impoi'tant support role
OPBRE/MAY98 104-105 OF 115
FEDERAL-WIDE DRUG SEIZURE SYSTEM ANNUAL SEIZURES, BY FISCAL Y E A R
COCAINE (METRIC
TONS)
HEROIN (KILOS)
CASSAStS (METRIC
TONS)
1990
107.3
815.0
227
1991
111.7
1,374.4
307.2
1992
137.6
1993
110.8
1994
140.5
1995
• 106.2
1,157.2
357.6
1,594.8
362.1
1,309.6
473.1
1,165.1
607.9
1996
115.3
1,533.7
663.4
1997"
108.5
1362
696.4
Source: DEAN FDSS Report (Historical and 316/98) FY 1997 figures are preliminary and subject to updating.
1997 Federal Cocaine Seizures at Ports-of-Entry . . . .
I U I A L ~I~IZUKI~'3" M O
SUMMARY ~veyance Seized (Mr)
wmerclal vessel 19.8
~.¢ommerclal 10.7 rsel ~aM air 1.3
.merclal air 5.2
id conveyance 17.4
Conveyance WEST SOUTHWEST SOUTHEAST NORTHEAST Puerto Rico
Commercial vessel 2.3 12.3 1.$ 3.5
Non-commercial 2.3 ' 8.4 vessel
Private air 0.3 0.9 Commercial air 0.03 0.2 4.1 0.7 0.1 Land conveyance 17.4
OPBRE/MAY98 106-107 OF 115

1997 Estimate of Cocaine Flow
from South America
, e ~ t .iii-:ii,!i! ':~ ] an Corridor I
CNC 1997 A N D E A N COCA ESTIMATES
Net Cultivation (ha) Net Leaf Production (MT) Potential HCI Production (MT)
24%
15% 2 ~
- '1% 49% ~ 50%
31
*Colombian yield and alkaloid figures under review by Operation Breakthrough.
OPBRE/MAY98 108-109 OF 115
1997 Estimate of Cocaine Flow from South America
430 Metric Ton., Departs
South America
1 Metric Tons Available
w.US Market
1997 COCAINE FLOW TO OTHER KEY DESTINATIONS
(62 MT estimated)
/ / ~ A N A D A 4% ~. " ':
ASIA <1% ~ ,
~ AFRICA <'1% "~ e~-- ,"
OPBRE/MAY98 110-111 OF 115

Cocaine Average Price; 1981 - 1997
(Pr ice p e r Pure G r a m )
Dol lars
4 0 0 r
3 0 0 F . . . . ~ . . . . . . . . .
2 0 0 I- . . . . . . . . . .
• ° - ,
100
L i i i i I i i i i i i t i i i i
, -a- - 5 oz or less Source: Abt Associates for ONDCP.
1 /80Z or less
Cocaine Average Purity, 1981 - 1997..~ ..
Percent
90
(Purity for Purchases of I / 8 oz. or less)
80 ! 70
60
50
4 0 . . . . . . . . . . . . . . . . . . . . . . . . . . . . . . . . . . . . . . . . . . . . . . . . . . . . . . . . . .
3 0 . . . . . . . . . . . . . . . . . . . . . . . - . . . . . . . . . . . . . . . . . . . . . . . . . . . . . . . . . .
2 0 . . . . . . . . . . . . . . . . . . . . . . . . . . . . . . . . . . . . . . . . . . . . = " ~ - . . . . . . . . . . . .
1 0 . . . . . . . . . . . . . . . . . . . . . . . . . . . . . . . . . . . . . . . . . . . . . . . . . . . . - . . . . . . .
0 I I I I I I I I I I I I I I I I I
Source: Abt Associates for ONDCP.
O P B R E / M A Y 9 8 112-113 OF 1 t 5

Heroin Average Price, 1981-,1997
Dollars
5000 ,
(Price :)er Pure Gram)
4000
3000
2000
1000
0 I I I I I I I I I I I I
Abt AssoQates for O,,~uCP. • -B-- 5 gms or less
112 gm or less
Heroin Average Purity, 1981- 1997
Percent
60
(Purity for Purchases of I /2 grams or less)
/ 1
2 0 . . . . . . . . . . . . . . . . . . . ~ - _ J
p ,
10 - ~ . . . . . . . . . . . . . . . . . . . . . . . . . . . . . . . . . . . . = -
0 I I I I | I I f I I . I I I , , I • . I I I
Source: Abt Associates for ONDCP,
OPBRE/MAY98 114-115 OF 115
Marijuana Average Price, 1981 - 1997
( A v e r a g e Price, Only -- no Potency Data) )
Dollars
20
10
5
I I I I I I I I I I I I I I I I I
0
• , 4 - - 1 pound or less Source: Abt Associates for ONDCP,
• --e-- 1 ounce or less
OPBRE/MAY98 116-117 OF 115

PROPERTY OF National Criminal Justice Reference Service (NOJRS), Box 6000 Rockville. M!O ~0849~.600g

~.-,'i i ,
" - - .
9
ISBN 0-16-049612~8
Ifllffflllllllllllllllll ill OOOOjiiiiiiIIiIijl 7 8 0 1 6 0 4 9 6 1 2 7


