CODES AND STANDARDS ENHANCEMENT INITIATIVE (CASE) Draft Measure Information Template – Office Task Lighting Plug Load Circuit Control 2013 California Building Energy Efficiency Standards California Utilities Statewide Codes and Standards Team, March 2011 This report was prepared by the California Statewide Utility Codes and Standards Program and funded by the California utility customers under the auspices of the California Public Utilities Commission. Copyright 2011 Pacific Gas and Electric Company, Southern California Edison, Sempra Utilities. All rights reserved, except that this document may be used, copied, and distributed without modification. Neither PG&E, SCE, SoCalGas, SDG&E, nor any of its employees makes any warranty, express of implied; or assumes any legal liability or responsibility for the accuracy, completeness or usefulness of any data, information, method, product, policy or process disclosed in this document; or represents that its use will not infringe any privately-owned rights including, but not limited to, patents, trademarks or copyrights
Transcript
CODES AND STANDARDS ENHANCEMENT INITIATIVE (CASE)
Draft Measure Information Template – Office
Task Lighting Plug Load Circuit Control
2013 California Building Energy Efficiency Standards
California Utilities Statewide Codes and Standards Team, March 2011
This report was prepared by the California Statewide Utility Codes and Standards Program and funded by the California utility customers under the auspices of the California Public Utilities Commission.
Copyright 2011 Pacific Gas and Electric Company, Southern California Edison, Sempra Utilities.
All rights reserved, except that this document may be used, copied, and distributed without modification.
Neither PG&E, SCE, SoCalGas, SDG&E, nor any of its employees makes any warranty, express of implied; or assumes any legal liability or
responsibility for the accuracy, completeness or usefulness of any data, information, method, product, policy or process disclosed in this document; or
represents that its use will not infringe any privately-owned rights including, but not limited to, patents, trademarks or copyrights
Measure Information Template Page 2
2013 California Building Energy Efficiency Standards [March 2011]
Measure Information Template – Office Task
Lighting and Plug Loads Circuit Controls
2013 California Building Energy Efficiency Standards
[California Utilities Statewide Codes and Standards Team, March 2011]
3. Methodology............................................................................................................... 10 3.1 Task Lighting and Plug Load Characteristics Study ................................................................10 3.2 Market Assessment ...................................................................................................................10
3.3 Building Prototype Development .............................................................................................11 3.4 Energy Savings Analysis ..........................................................................................................11 3.5 Cost Analysis ............................................................................................................................12
4. Analysis and Results ................................................................................................. 14 4.1 Task Lighting and Plug Load Characteristics Study ................................................................14
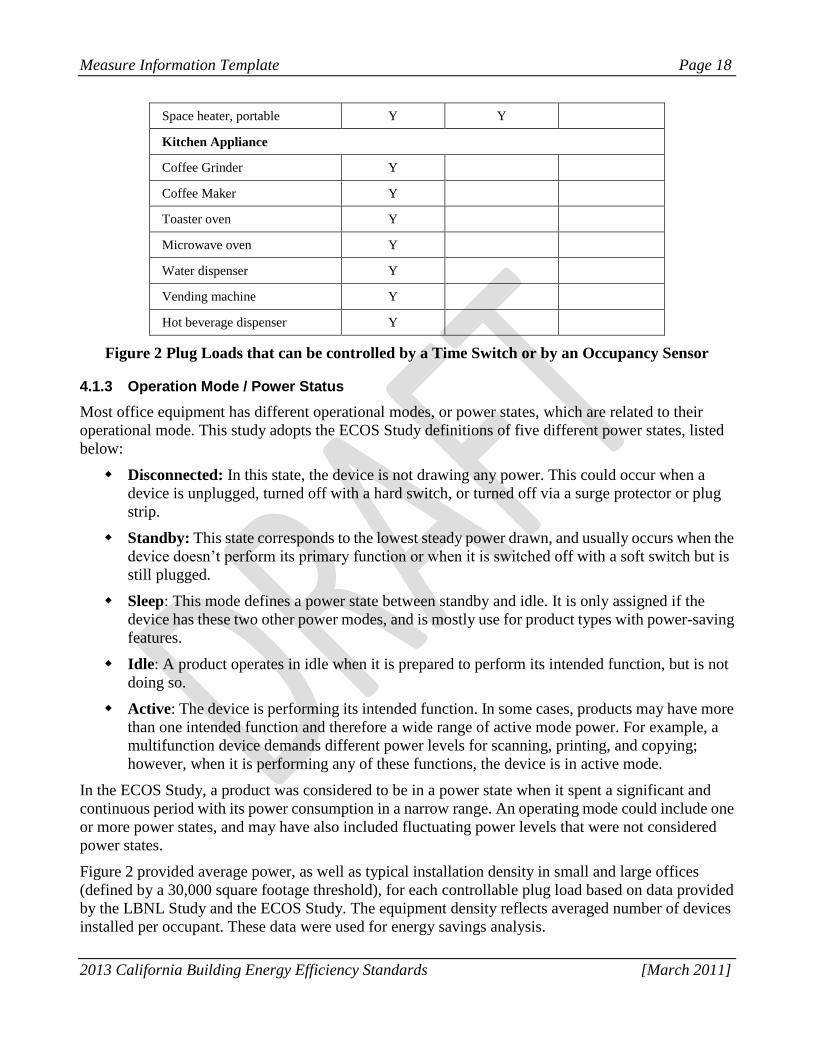
4.1.3 Operation Mode / Power Status .........................................................................................18 4.2 Market Assessment ...................................................................................................................20
4.2.1 Plug Load Control Standards .............................................................................................20 4.2.2 Control Products ................................................................................................................20
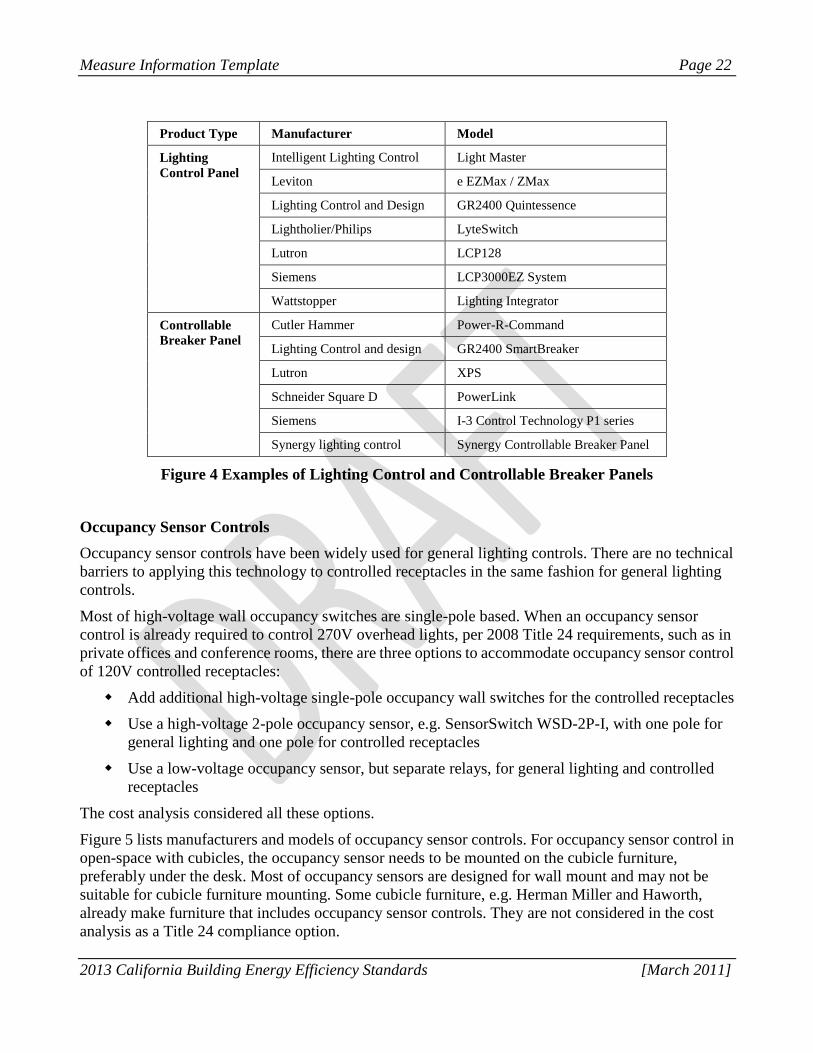
4.2.3 Level of Controls ...............................................................................................................23 4.2.4 Task Lighting and Plug Load Circuit Wiring ....................................................................23
4.3 Prototype Buildings Development............................................................................................25 4.4 Energy Savings Analysis ..........................................................................................................26
4.4.1 Energy Savings Analysis Assumptions .............................................................................26
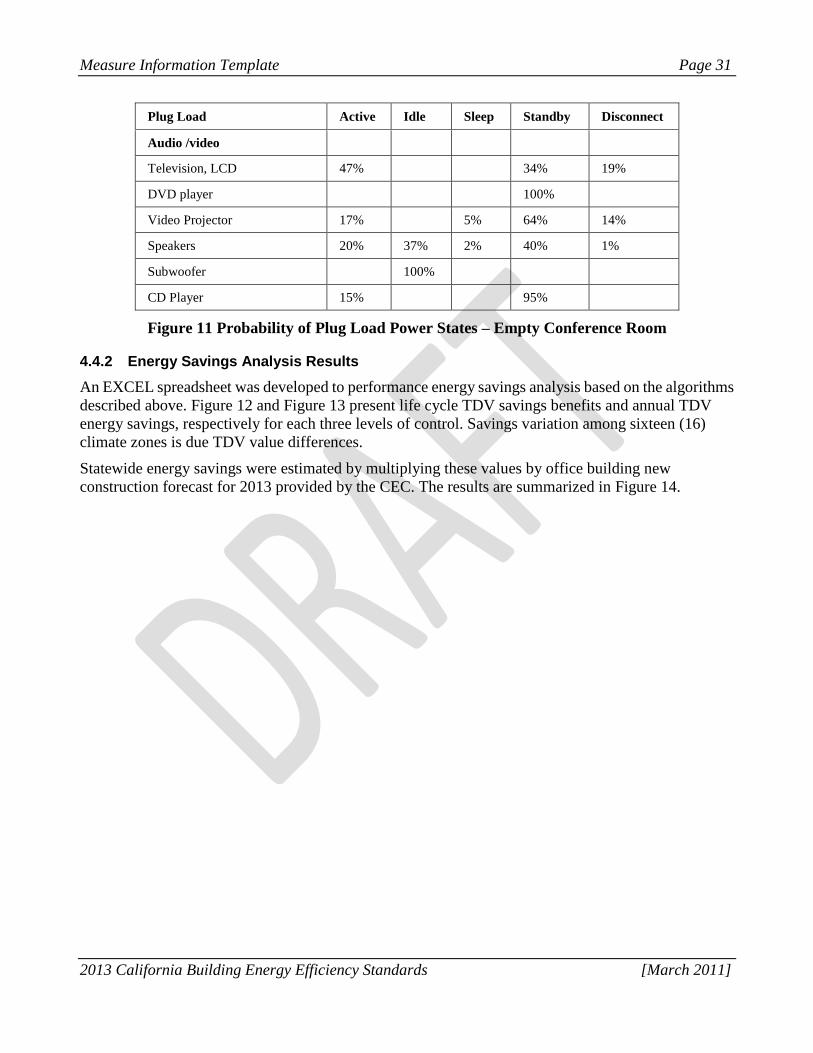
4.4.2 Energy Savings Analysis Results ......................................................................................31
4.5.1 Baselines and Compliance Options ...................................................................................34 4.5.2 Incremental Cost of Three Levels of Controls ...................................................................38
5. Recommended Language for the Standards Document, ACM Manuals, and the Reference Appendices ....................................................................................................... 48
6. Bibliography and Other Research ............................................................................ 49
Measure Information Template Page 3
2013 California Building Energy Efficiency Standards [March 2011]
7. Appendix I: ASHRAE and IgCC Plug Load Control Standards .............................. 51 7.1 ASHRAE 90.1 ..........................................................................................................................51 7.2 International Green Construction Code (IgCC) ........................................................................51
8. Appendix II: Industry Practice Survey ..................................................................... 53 8.1 CASE Office Task Lighting and Plug Loads, Designer and Contractor survey ......................53
9. Appendix III: Office Building Prototypes ................................................................. 59 9.1 Small Office ..............................................................................................................................59
9.2 Large Office ..............................................................................................................................60
FIGURES
Figure 1 Examples of Non-controllable Plug Loads............................................................................. 16 Figure 2 Plug Loads that can be controlled by a Time Switch or by an Occupancy Sensor ................ 18
Figure 3 Plug Load Power States and Typical Installation Density ..................................................... 20 Figure 4 Examples of Lighting Control and Controllable Breaker Panels ........................................... 22 Figure 5 Examples of Occupancy Sensor Controls .............................................................................. 23
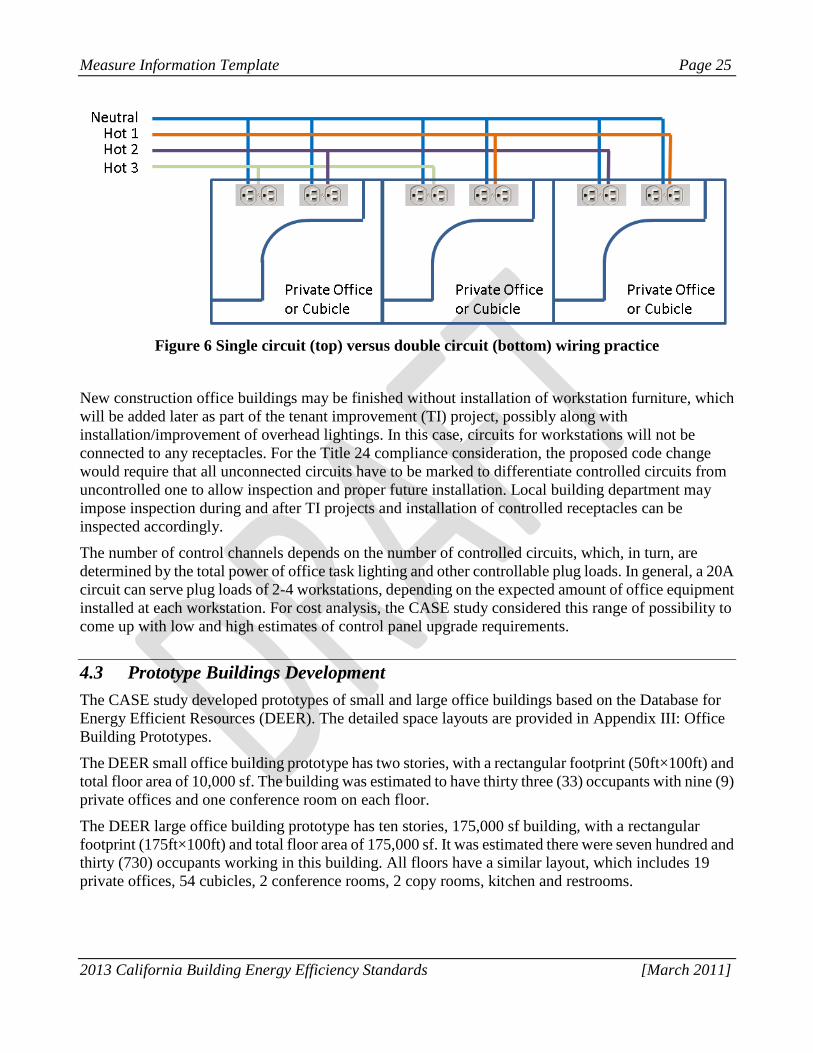
Figure 6 Single circuit (top) versus double circuit (bottom) wiring practice ....................................... 25 Figure 7 Office Building Prototype Summary ...................................................................................... 26
Figure 8 Office Operation and Occupant Working Schedule Assumptions ......................................... 27
Figure 9 Probability of Plug Load Power States –Non-Business Hours .............................................. 30
Figure 10 Probability of Plug Load Power States –Away-from-desk .................................................. 30 Figure 11 Probability of Plug Load Power States – Empty Conference Room .................................... 31
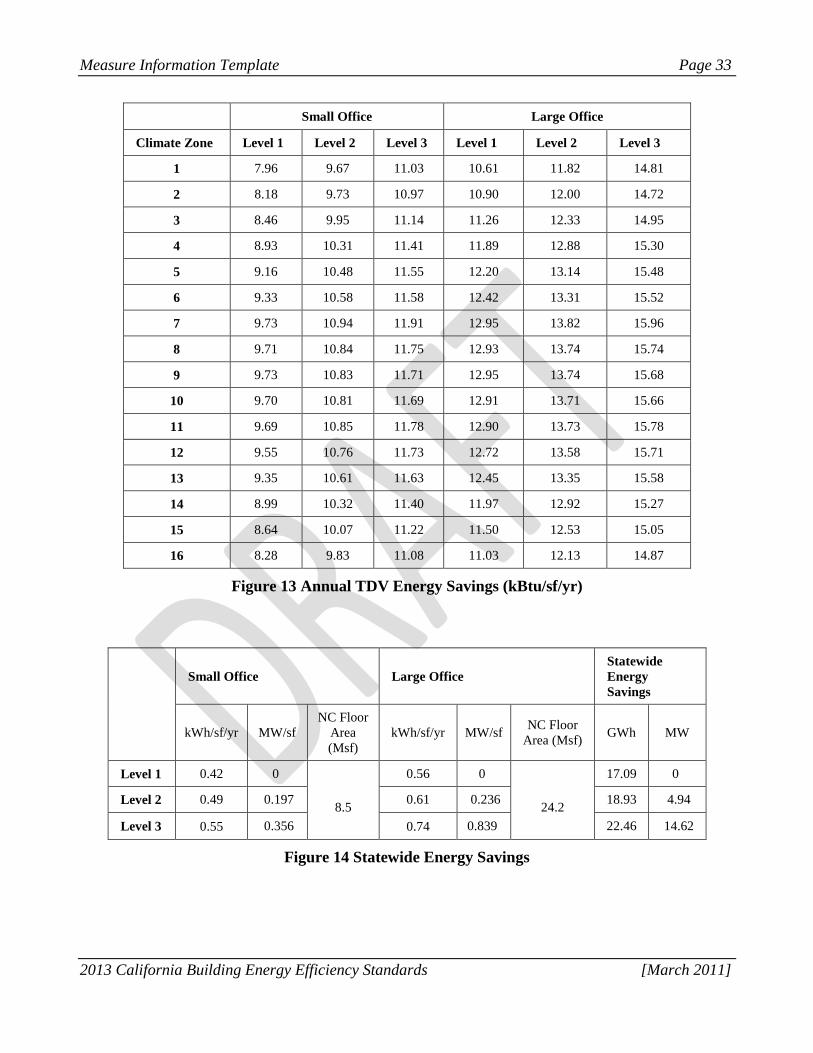
Figure 12 Present Values of Life Cycle Energy Savings ($/sf) ............................................................ 32 Figure 13 Annual TDV Energy Savings (kBtu/sf/yr) ........................................................................... 33 Figure 14 Statewide Energy Savings .................................................................................................... 33 Figure 15 Central Timer Control Baseline and Compliance Options – Design A................................ 34
Figure 16 Central Timer Control Baseline and Compliance Options – Design B ................................ 35 Figure 17 Central Timer Control Baseline and Compliance Options – Design C ................................ 36 Figure 18 Central Timer Control Baseline and Compliance Options – Design D................................ 37 Figure 19 Baselines and Compliance Options for Occupancy Sensor Controls (top: high-voltage;
Figure 20 Number of Circuits per Space Type ..................................................................................... 39
Figure 21 Central Timer Control Panel Cost ........................................................................................ 39
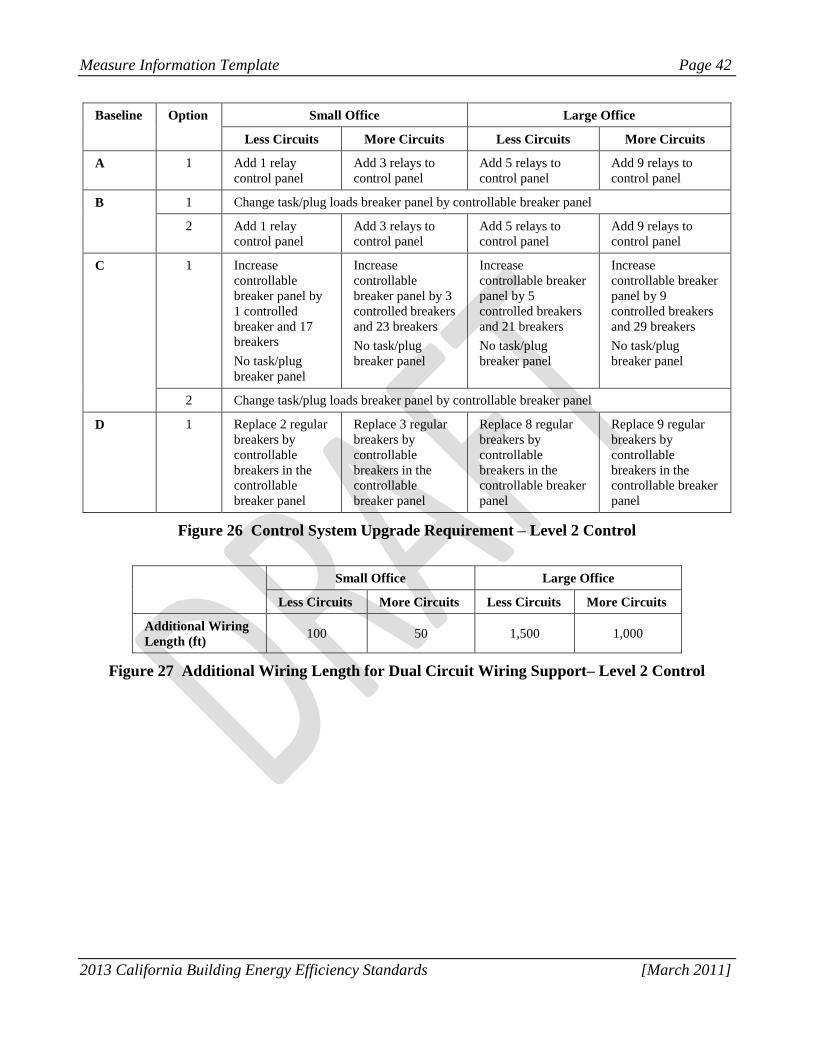
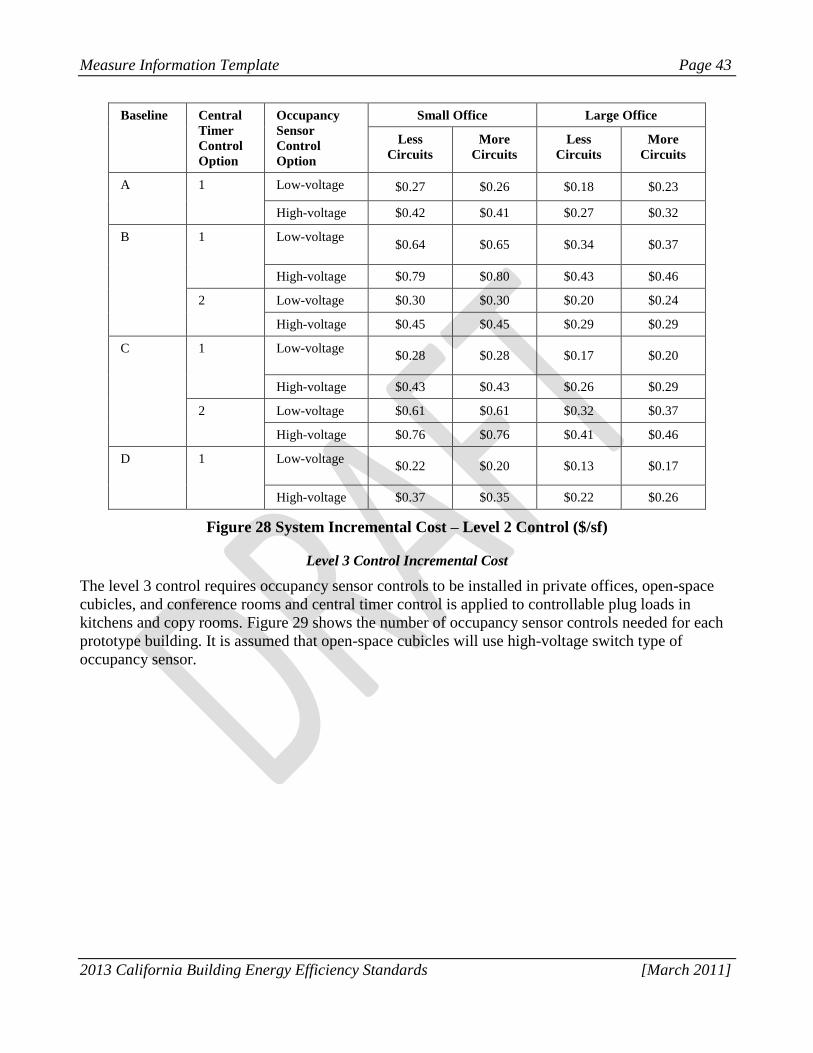
Figure 22 Occupancy Sensor Control Cost ........................................................................................... 40 Figure 23 Control System Upgrade Requirement – Level 1 Control ................................................... 40 Figure 24 Additional Wiring Length for Dual Circuit Wiring Support– Level 1 Control ................... 41 Figure 25 System Incremental Cost – Level 1 Control ($/sf) ............................................................... 41 Figure 26 Control System Upgrade Requirement – Level 2 Control .................................................. 42 Figure 27 Additional Wiring Length for Dual Circuit Wiring Support– Level 2 Control .................. 42 Figure 28 System Incremental Cost – Level 2 Control ($/sf) ............................................................... 43
Measure Information Template Page 4
2013 California Building Energy Efficiency Standards [March 2011]
Figure 29 Number of Occupancy Sensor Control – Level 3 Control .................................................. 44
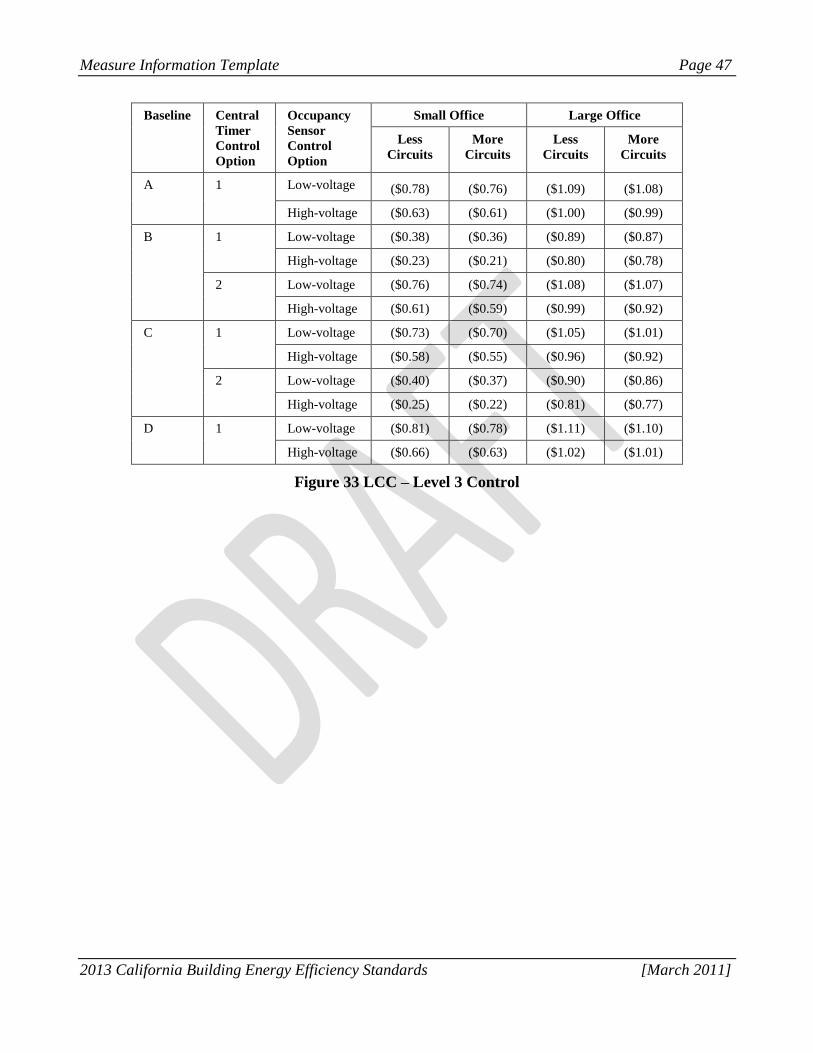
Figure 30 System Incremental Cost – Level 3 Control ($/sf) ............................................................... 45 Figure 31 LCC – Level 1 Control ......................................................................................................... 46 Figure 32 LCC – Level 2 Control ......................................................................................................... 46 Figure 33 LCC – Level 3 Control ......................................................................................................... 47 Figure 34 Small Office Area Breakdown ............................................................................................. 59
Figure 35 Small Office Floor Plan ........................................................................................................ 60 Figure 36 Large Office Area Breakdown ............................................................................................. 61 Figure 37 Large Office Floor Plan ........................................................................................................ 61
Measure Information Template Page 5
2013 California Building Energy Efficiency Standards [March 2011]
1. Purpose
This Codes and Standards Enhancement (CASE) report addresses office task lighting controls, and
associated controls of other plug loads.
Task lightings and other plug loads are becoming a major electricity end-use in office buildings. These
loads are significant in term of both power density and power consumption. This is due to both
increased practices of low ambient lighting designs, which lead to increased task lighting usage, and
increased use of computer and other office electronic equipment.
According to the California Commercial End-Use Survey (CEUS) released in March 2006, interior
lighting represents 26.4% of the electricity energy consumption in California office floor space, which
is the highest electricity end-use. Office buildings compliant with the 2008 Title 24 minimum
requirements can be assumed to have 0.9W/sf of installed overhead lighting and 0.2W/sf of installed
task lighting. Hence, about 18% of the interior lighting power density is due to task lighting. In low
ambient lighting designs, this ratio is much higher. When further considering overhead lighting controls
required by 2008 Title 24, the ratio of power consumption by task lightings to that of overhead lightings
can be even higher.
Office equipment represents the third highest electricity end-use in California; it accounts for about
19.2% of the total building electricity consumption. Despite penetration of newer and more efficient
technologies, this electricity end-use is steadily increasing as the use of personal computers and other
electronics devices in offices continues to grow. Forecasts by the Energy Information Administration’s
2010 annual energy outlook predict a 36% increase in PC office equipment energy consumption from
2010 to 2030, and a 65% increase for non-PC office equipment energy consumption.
Although the growth in office equipment use is difficult to control, office equipment use patterns give
room for energy savings. This CASE study investigates potential requirements of applying
automatically shut-off controls to circuits serving task lightings and certain plug loads, so that they can
be switched off when not in use. These control technologies are already required by 2008 Title 24 for
general lightings in nonresidential buildings. Therefore, they can be easily implemented with fewer
technical barriers.
Measure Information Template Page 6
2013 California Building Energy Efficiency Standards [March 2011]
2. Overview
a. Measure
Title
Office Task Lighting and Plug Load Circuit Controls
b.
Description
This proposal investigates the feasibility and cost-effectiveness of requiring automatic
shut-off controls of electric circuits that serve task lightings and certain plug loads in
office buildings. These controls enable connected task lights and plug loads to be
automatically switched off when they are not in use. Electric energy savings are
achieved through reduction in power consumption of connected task lights and plug
loads.
The proposal requests an expansion of 2008 Title 24 automatic shut off controls for
general lighting to cover circuits serving task lighting. The same type of controls, timer
controls and occupancy sensor controls, which are currently required for general
lightings, are proposed to be applied to circuits for task lighting and certain plug loads.
Uncontrolled circuits should still be provided for plug loads that cannot be disrupted.
Receptacles connected to controlled circuits should be marked differently from those
connected to uncontrolled circuits.
The proposed code changes do not impose any requirement on how task lighting and
other plug loads should be connected or used. Rather, they ensure office buildings to be
equipped with the proper control system to allow reduction of unnecessary power
consumption by task lighting and plug loads.
c. Type of
Change
The proposed requirements are mandatory for all office buildings. As mandatory
measures, these requirements do not affect the performance method and trade-off
calculations. Similar to general lighting control requirements, they would require an
acceptance test to ensure controls are correctly installed and wall receptacles are
properly marked.
Measure Information Template Page 7
2013 California Building Energy Efficiency Standards [March 2011]
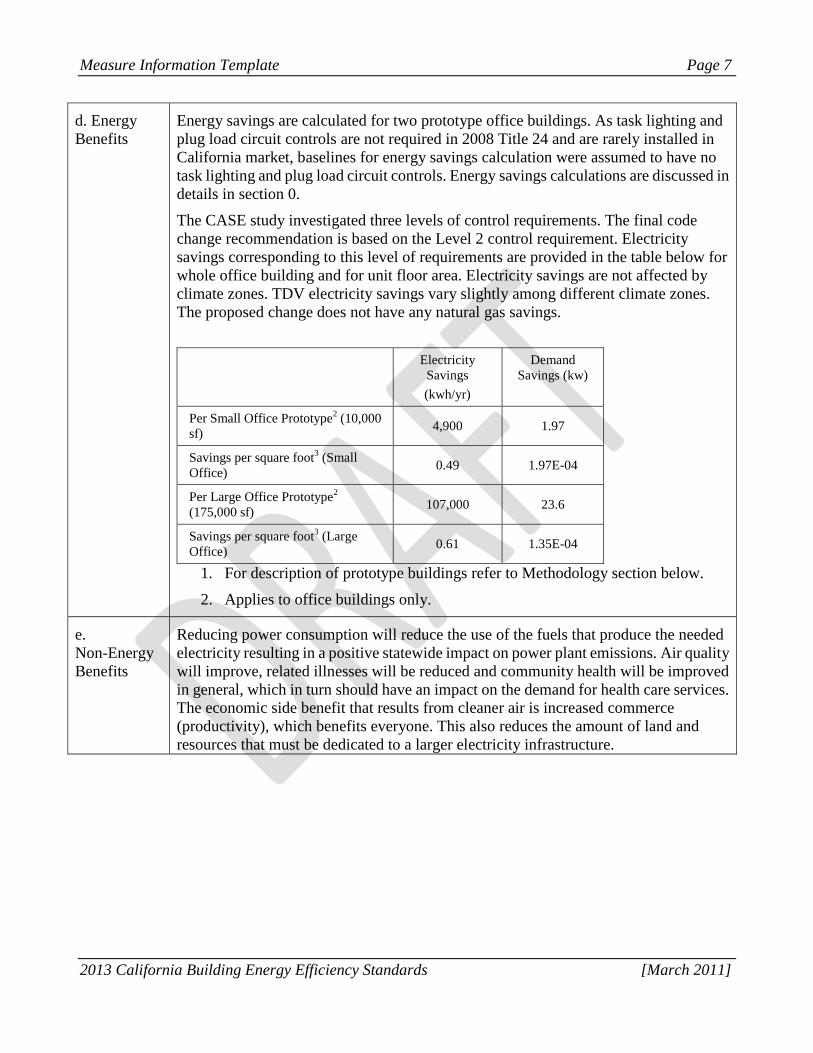
d. Energy
Benefits
Energy savings are calculated for two prototype office buildings. As task lighting and
plug load circuit controls are not required in 2008 Title 24 and are rarely installed in
California market, baselines for energy savings calculation were assumed to have no
task lighting and plug load circuit controls. Energy savings calculations are discussed in
details in section 0.
The CASE study investigated three levels of control requirements. The final code
change recommendation is based on the Level 2 control requirement. Electricity
savings corresponding to this level of requirements are provided in the table below for
whole office building and for unit floor area. Electricity savings are not affected by
climate zones. TDV electricity savings vary slightly among different climate zones.
The proposed change does not have any natural gas savings.
Electricity
Savings
(kwh/yr)
Demand
Savings (kw)
Per Small Office Prototype2 (10,000
sf) 4,900 1.97
Savings per square foot3 (Small
Office) 0.49 1.97E-04
Per Large Office Prototype2
(175,000 sf) 107,000 23.6
Savings per square foot3 (Large
Office) 0.61 1.35E-04
1. For description of prototype buildings refer to Methodology section below.
2. Applies to office buildings only.
e.
Non-Energy
Benefits
Reducing power consumption will reduce the use of the fuels that produce the needed
electricity resulting in a positive statewide impact on power plant emissions. Air quality
will improve, related illnesses will be reduced and community health will be improved
in general, which in turn should have an impact on the demand for health care services.
The economic side benefit that results from cleaner air is increased commerce
(productivity), which benefits everyone. This also reduces the amount of land and
resources that must be dedicated to a larger electricity infrastructure.
Measure Information Template Page 8
2013 California Building Energy Efficiency Standards [March 2011]
f. Environmental Impact
The potential adverse environmental impacts of this measure are negligible. Task light and plug load
circuit controls requires additional wiring and control equipment (occupancy sensors and control
panels), thus slightly more copper and plastic usages.
The measure will contribute to reduction of power generation and size of the transmission and
distributions system. This leads small reduction in mercury emissions from coal-burning power plants,
water consumption, the amount of land and resources that must be dedicated to a larger electricity
infrastructure. The emission reductions of this measure are calculated by multiplying the electricity
savings (kWh) by the hourly emissions factors. The results are presented in the following table for both
prototype office buildings.
Emission Impacts:
Prototype NOX (lb/yr) SOX (lb/yr) CO (lb/yr) PM10 (lb/yr) CO2 (lb/yr)
Per Small Office 1 5 1 0 2,844
Per Large Office 17 101 25 8 61,804
There is no significantly impact to water consumption and water quality by this measure.
g.
Technology
Measures
Measure Availability:
This measure requires control equipment already installed in office buildings per 2008
Title 24 general lighting control requirements. In all cases, compliance to the proposed
code changes would only require capacity expansion of the same control equipment
used to meet general the lighting requirements.
Useful Life, Persistence, and Maintenance:
Lighting control equipment typically has an useful life of 15 years. Energy savings
from this measure will persist for the life of the installed control systems and for the life
of the building, if proper control equipment is replaced in future. Lighting control
equipment required by the proposed changes does not require maintenance.
h.
Performance
Verification
of the
Proposed
Measure
This measure will require acceptance tests that can be included in the currently
established permitting and site inspection process, similar to those for general lighting
controls. Specific requirements include:
Verify that both controlled and uncontrolled receptacles are installed in the
required spaces, and they are marked differently;
In office building open spaces, verify that circuit wire leads for future
workstation furniture connection are marked as controlled and uncontrolled;
Verify required shut off controls function properly, following the acceptance
test procedures for general lighting controls
Once the initial acceptance tests are passed, consistent energy savings are expected.
Measure Information Template Page 9
2013 California Building Energy Efficiency Standards [March 2011]
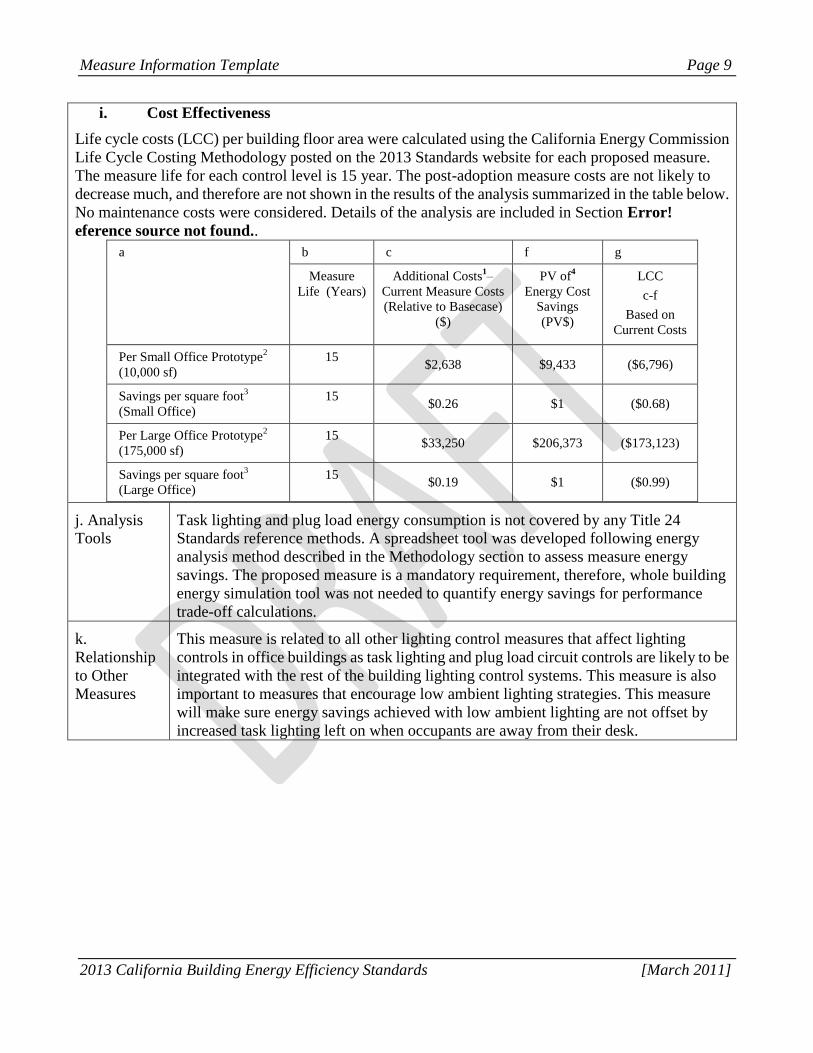
i. Cost Effectiveness
Life cycle costs (LCC) per building floor area were calculated using the California Energy Commission
Life Cycle Costing Methodology posted on the 2013 Standards website for each proposed measure.
The measure life for each control level is 15 year. The post-adoption measure costs are not likely to
decrease much, and therefore are not shown in the results of the analysis summarized in the table below.
No maintenance costs were considered. Details of the analysis are included in Section Error!
eference source not found..
a b c f g
Measure
Life (Years)
Additional Costs1–
Current Measure Costs
(Relative to Basecase)
($)
PV of4
Energy Cost
Savings
(PV$)
LCC
c-f
Based on
Current Costs
Per Small Office Prototype2
(10,000 sf)
15 $2,638 $9,433 ($6,796)
Savings per square foot3
(Small Office)
15 $0.26 $1 ($0.68)
Per Large Office Prototype2
(175,000 sf)
15 $33,250 $206,373 ($173,123)
Savings per square foot3
(Large Office)
15 $0.19 $1 ($0.99)
j. Analysis
Tools
Task lighting and plug load energy consumption is not covered by any Title 24
Standards reference methods. A spreadsheet tool was developed following energy
analysis method described in the Methodology section to assess measure energy
savings. The proposed measure is a mandatory requirement, therefore, whole building
energy simulation tool was not needed to quantify energy savings for performance
trade-off calculations.
k.
Relationship
to Other
Measures
This measure is related to all other lighting control measures that affect lighting
controls in office buildings as task lighting and plug load circuit controls are likely to be
integrated with the rest of the building lighting control systems. This measure is also
important to measures that encourage low ambient lighting strategies. This measure
will make sure energy savings achieved with low ambient lighting are not offset by
increased task lighting left on when occupants are away from their desk.
Measure Information Template Page 10
2013 California Building Energy Efficiency Standards [March 2011]
3. Methodology
This section describes the methodology that we followed to assess control strategy feasibility, energy
savings, incremental costs, and cost effectiveness of the proposed code change. The key elements of the
study methodology are as follow:
Task lighting and plug loads usage characteristics study
Control technologies market study and industry practice survey Prototype building development
Energy Savings Analysis
Cost Analysis
Cost-effectiveness and Statewide Savings
Stakeholder Meeting Process
3.1 Task Lighting and Plug Load Characteristics Study
The first step of the study was to understand the characteristics of office task lightings and plug loads in
terms of installed power densities and operation patterns. Such information was needed to determine if
and how plug loads can be controlled and the amount of power that can potentially be reduced through
controls. The CASE study team conducted literature reviews in order to collect relevant information.
Different sources were reviewed and analyzed in order to provide a comprehensive understanding of
the subject.
3.2 Market Assessment
The general code change proposal concept is to require task lighting and plug loads to be controlled by
time switchers or occupancy sensors to achieve automatic shut off controls. To demonstrate the
feasibility of this concept, the CASE study conducted market studies to identify commercially available
control products and to explore control system design options. Market study results were used to
develop compliance options, and collected product costs supported the cost analysis of the proposed
control requirements.
This market assessment encompassed two efforts:
Control technologies market study
Industry practice assessment
The market study started with literature research to understand existing practices and technology
development associated with plug load controls. This effort was carried out in conjunction with
literature research on office plug load characteristics study.
Many plug load control studies focused on soft-wired control technologies, e.g. task lighting with
embedded occupancy sensor and power strips with occupancy sensor or timer control capabilities.
These are effective control strategies and are especially cost effective for plug load control in existing
buildings. They are not, however, suitable for Title 24 regulation. This CASE study investigates the
implementation of hardwired control strategies in new construction buildings.
Measure Information Template Page 11
2013 California Building Energy Efficiency Standards [March 2011]
The literature study and initial survey revealed that hardwired plug controls had very small market
penetration and that little was published on this topic. In response, the CASE project team shifted
market study efforts towards product research and control strategy development by interviewing
industry practitioners. A broad range of lighting control and circuit control products were reviewed.
The project team conducted extensive discussion with lighting control and system furniture
manufacturers to examine how hardwired plug load circuit controls can be implemented. The CASE
team further surveyed electrical designers, contractors, and system furniture manufacturers using an
online survey or through phone calls. The survey aimed at collecting industry consensus on following
issues:
Lighting and circuit control practices and products
Feasibility of potential control requirements
Office electric circuit wiring design practices
Integration of plug load controls with office furniture systems
The project staff further interviewed authors of relevant studies and projects to obtain detailed technical
information, to seek additional control strategies and design options, and to identify implementation
and operation issues.
3.3 Building Prototype Development
The CASE team developed two building prototypes (a small office building and a large office building)
to assess the energy savings, cost, and cost-effectiveness of the proposed task lighting and plug load
control requirements. The CASE team built on the two office building prototypes from the Database for
Energy Efficient Resources (DEER), which classified the office building stock into two categories,
small and large, using a building square footage threshold of 30,000 sf. An office layout was developed
for each prototype based on typical office building design and was checked by registered architects.
3.4 Energy Savings Analysis
Once task lightings and other controllable plug loads are plugged into receptacles that are connected to
controlled circuits, they can be automatically shut off when they are not in use. The amount of energy
savings depends on three elements: how many task lights and plug loads are connected to controlled
receptacles, when they can be switched off, and the average power status when they are switched off.
Types of controllable plug loads and installation densities of controllable plug loads were determined
based on task lighting and plug load characteristics study. The number of plug loads installed for each
building prototype was further estimated based on prototype building sizes and detailed configurations,
such as number of private offices and conference rooms.
Control schedule depends on office operation and occupancy presence schedule, as well as on control
technology. Central timer control can shut off plug load power according to a fixed schedule when all
occupants are expected to be out of office, e.g. during non-business hours. In the case of occupancy
sensor control, additional savings can be achieved when an occupant is not at his/her desk during
business hours, which includes two scenarios, away from desk and out of office. Similarly, occupancy
sensor control in conference rooms can achieve additional savings when the conference room is vacant.
Control schedules were developed based on assumptions of average office operation schedules.
Measure Information Template Page 12
2013 California Building Energy Efficiency Standards [March 2011]
Power status of task lighting and other controllable plug loads during all control schedule periods, i.e.
business and non-business hours were also based on information collected through task lighting and
plug load characteristics study, described in section 0.
The CASE team evaluated energy savings for both the small and large office building prototypes. Three
levels of control were considered, which used different combinations of central timer control and
occupancy sensor controls.
State-wide energy savings were calculated by multiplying unit energy savings (savings per square foot)
by the CEC’s forecast of square footage of office building new construction. Peak demand savings were
estimated as the average load (kW) reduction during summer peak hours, which are defined as 12pm –
6 pm in July through September, according to CPUC treatment of demand savings for IOU energy
efficiency programs.
3.5 Cost Analysis
This code change proposal seeks to expand existing lighting control systems for general lighting in
office buildings to implement task lighting and plug load controls. Based on 2008 Title 24 general
lighting automatic shut off control requirements , general lighting control compliance options were
investigated to develop baseline designs. Task lighting and plug load control compliance options were
developed as an upgrade to these general lighting control systems. The CASE study assessed the
incremental cost of the proposed code changes by comparing the cost of the baselines to the cost of the
corresponding task lighting and plug load control compliance options.
System upgrade costs were estimated for each compliance option with the consideration of following
components:
Cost of control equipment upgrade, installation, configuration, and maintenance
Cost of additional wiring, if any
This approach also provided realistic compliance examples to effectively demonstrate code change
feasibility.
Control equipment costs depend on the number of task lighting and plug load circuits to be controlled,
which were determined based on prototype office building configurations. Different office building
wiring practices were considered to generate a range of cost estimate.
Control equipment costs were obtained from manufacturers’ distributors as part of the efforts of market
study of control technologies previously discussed. Labor and material costs for installation,
configuration and additional wiring were estimated based on RS Means Cost Works Online
Construction Cost Data.
3.6 Cost Effectiveness Analysis
The CASE team calculated lifecycle cost analysis using methodology explained in the California
Energy Commission report Life Cycle Cost Methodology 2013 California Building Energy Efficiency
Standards, written by Architectural Energy Corporation, using the following equation:
Measure Information Template Page 13
2013 California Building Energy Efficiency Standards [March 2011]
– [1]
ΔLCC = ΔC – (PVTDV-E * ΔTDVE + PVTDV-G * ΔTDVG)
Where:
ΔLCC change in life-cycle cost
ΔC cost premium associated with the measure, relative to the base case
PVTDV-E present value of a TDV unit of electricity
PVTDV-G present value of a TDV unit of gas
ΔTDVE TDV of electricity
ΔTDVG TDV of gas
A 15-year lifecycle was used as per the LCC methodology for nonresidential lighting control
measures. LCC calculations were completed for two building prototypes, in all sixteen (16) climate
zones analyzed, for high, low, and average load shed rates. This provided a range of cost effectiveness
to accommodate for varying scenarios.
3.7 Stakeholder Meeting Process
All of the main approaches, assumptions and methods of analysis used in this proposal have been
presented for review at public Stakeholder Meetings.
At each meeting, the utilities' CASE team invited feedback on the proposed language and analysis thus
far, and sent out a summary of what was discussed at the meeting, along with a summary of outstanding
questions and issues.
Records of the Stakeholder Meeting presentations, summaries and other supporting documents can be
found at www.calcodes.com. Stakeholder meetings were held on the following dates and locations:
Control and DR Stakeholder Meeting: July 7th, 2010, San Ramon Conference Center, San
Ramon, CA
Lighting Stakeholder Meeting: February 24th, 2011, UC Davis Alumni Center, Davis CA
In addition to the Stakeholder Meetings, the CASE team contacted representative of diverse
organizations involved in projects or code proposals related to plug load control such as ASHRAE and
NBI.
[1] The Commission uses a 3% discount rate for determining present values for Standards purposes.