23
1 Office of Federal High-Performance Green Buildings Plug Load Research Review Summary May 20, 2013 Report prepared by the Institute for the Built Environment
1
Office of Federal High-Performance Green Buildings
Plug Load Research Review Summary
May 20, 2013
Report prepared by the Institute for the Built Environment

2
Contents
After‐Hours Power Status of Office Equipment and Energy Use of Miscellaneous Plug‐Load Equipment ........................................................................................................................................... 3
Assessing and Reducing Plug and Process Loads in Office Buildings ................................................... 5
Office Plug Load Field Monitoring Report ........................................................................................... 7
Energy Saving Potential of Office Equipment Power Management .................................................... 9
Pilot Study of a Plug Load Management System: Preparing for Sustainability Base ......................... 11
Energy Conservation Potential of Power Management for Fax Machines ...................................... 13
Office Building Plug Load Profiles ...................................................................................................... 14
Reducing Plug and Process Loads for a Large Scale, Low Energy Office Building: NREL's Research Support Facility .................................................................................................................................. 16
PC and Monitor Night Status: Power Management Enabling and Manual Turn‐Off ......................... 18
After‐Hours Power Status of Office Equipment in the USA ............................................................... 20
Plug‐Load Control and Behavioral Change Research in GSA Office Buildings .................................... 22

3
Article Title After‐Hours Power Status of Office Equipment and Energy Use of Miscellaneous Plug‐Load Equipment
Citation Judy A. Roberson, C. A. W., Marla C. McWhinney, Richard E. Brown, Margaret J. Pinckard, and John F.
Busch. (2004). After‐hours power status of office equipment and energy use of miscellaneous plug‐load equipment.
Justification this survey of plug‐load equipment provides an inventory of equipment with trends in usage patterns
typical in commercial buildings. Their conclusions define products with the highest energy saving potential and the use of power management best practices by users. This article will be helpful for those developing plans to reduce plug loads and to IT departments as policies for organization computer settings for power management are developed.
Introduction & Methodology The study surveyed the number of units and total energy consumption of plug loads and IT equipment,
more than 10k total devices, from 16 commercial sites in Pennsylvania, Georgia, and California; 4 educational buildings, 2 medical buildings, 2 large offices (>500 employees), 3 medium offices (50‐500 employees), and 5 small offices (<50 employees). Their results included the common types of plug loads, the percentage of those plugs which were turned off, in low‐power mode, or on, the density of units per square foot and per employee, and the total energy consumption. Energy of devices was not monitored, instead it was estimated using data from previous studies. In summary, this article provides a weighted inventory of plug loads and serves as a foundation for understanding context in order to develop effective methods for energy reduction.
LBNL team surveyed education, healthcare, and office facilities using the CBECS 1999 (Commercial Building Energy Consumption Survey) protocol, which included counting the number of computers per area and finding the density of computers per square foot and per employee. Researchers performed the survey after hours or on weekends. Also surveyed were: monitors, printers, fax machines, copiers, scanners, multi‐function devices, lamps, battery chargers, vending machines, and refrigerators.
Article Summary Power Management
Though office equipment is often idle, it is often left on when not in use ‐ especially networked equipment. Energy star labeled products have factory installed power management settings installed which require the device to enter a low power mode during these times; however, users, administrators, and software updates can often disable these settings. Power management was found to be most successful in monitors and laser printers; and least successful in desktop computers, inkjet printers, copiers, and fax machines. This study found that of the computers they inventoried during their afterhours survey, only 6% of turned‐on computers had power management enabled. Turn off rates for computers (36%) and monitors (29%) were somewhat lower than the study 3 years prior. PM rates for monitors (72%) were higher by 16%. Power management was lowest in high schools and small offices and highest in universities and large offices. This may indicate the influence of centralized IT departments and effective policy. Also illustrates the opportunity for energy savings in small offices and in high school computer labs. Laptop computers now comprise a higher percentage of server computers (10%). This is a conservative estimate as many laptops and charge cords are taken home by employees. Monitor turn‐off rates are lower than expected; though power‐management of monitors is high. It is speculated that the PM black screen is often misinterpreted by users that the monitor is off. This was found true in offices with strict monitor turn‐off policies. Miscellaneous Equipment Miscellaneous Equipment outnumbered office equipment in most sites. ME includes, audio visual, food/beverage, portable HVAC, lab equipment, lighting, medical equipment, networking, office misc., peripheral (speakers, docking stations), power, telephony, and maintenance. The estimated unit energy consumption of all ME shows food/beverage as the most energy consuming. Though their unit energy

4
consumption is low, networking equipment (ethernet ports) are numerous and therefore high in total energy consumption, offering opportunity for energy efficiency
Key Takeaways • Power management was found to be most successful among monitors and laser printers; and least
successful among desktop computers, inkjet printers, copiers, and fax machines. • Turn‐off rates are highest (≥ 40%) among integrated computer systems, copiers, and scanners; and lowest (≤ 20%) among laser printers, LCD monitors, and Multi function devices. • While each ethernet switch port has a UEC of just 17 kWh/yr, the over 2,000 units have a collective TEC of over 35,000 kWh/year, which suggests this equipment is a good target for energy efficiency measures. • Computer speaker pairs collectively account for almost 10,000 kWh/yr in these buildings; because these units are seldom used, their consumption represents a considerable energy savings potential. • Only 6% of desktop computers in this study of commercial buildings were found in low power. In contrast, 96‐98% of monitors connected to computers that were not on were found in low power, so a very high proportion of monitors are ENERGY STAR compliant, or capable of power managing themselves. Among the sample of printers, 46% were laser and 34% were inkjet. • The turn‐off rate was twice as high (30%) for inkjet printers as for laser printers (15%); inkjet printers are more likely to be turned off than laser printers because they are much less likely to be networked.

5
Article Title Assessing and Reducing Plug and Process Loads in Office Buildings
Citation NREL. (2011). Assessing and Reducing Plug and Process Loads in Office Buildings. Golden, CO.
Justification This concise guidance document provides a great overview of the strategies and justification for reducing plug and process loads. We have provided an overview of the document's content; however, we would advise reading it in its entirety (9 pages).
Introduction & Methodology This report provides a synthesis of best practices to reduce plug and process loads in commercial
buildings. Plug and process loads (PPLs) in commercial buildings account for almost 5% of U.S. primary energy consumption (McKenney et al. 2010). Minimizing these loads is a primary challenge in the design and operation of an energy‐efficient building. PPLs are not related to general lighting, heating, ventilation, cooling, and water heating, and typically do not provide comfort to the occupants. They use an increasingly large fraction of the building energy use pie because the number and variety of electrical devices have increased along with building system efficiency. Reducing PPLs is difficult because energy efficiency opportunities and the equipment needed to address PPL energy use in office spaces are poorly understood.
Article Summary Plug & Process Loads Reduction Process Step 1: Establish a Plug and Process Loads ‐ Champion Identify an initiator, someone who understands energy efficiency and design strategies and who can make cost justifications. Step 2: Develop a Business Case for Addressing Plug and Process Loads ‐ Gain buy‐in by illustrating the financial incentive for PPL reduction Step 3: Benchmark Current Equipment & Operations ‐ 3A: Select a Plug Load Meter, 3B: Meter the Plug Loads Establish a baseline using PPL power meters. Step 4: Identify Occupants' True Needs ‐ Determine what employees require to do their jobs and collaboratively determine how they can perform their jobs more efficiently. Step 5: Meet Needs Efficiently ‐ Specify the most efficient equipment, pay special attention to parasitic loads in order to use efficient equipment in the most efficient manner. Step 6: Turn It All Off ‐ Reduce energy use during non‐business hours. Step 7: Institutionalize Plug and Process Load Measures ‐ Institutionalize PPL measures through procurement decisions and policy programs. Step 8: Address Unique Plug and Process Loads ‐ In vendor spaces, building owners should contractually require or provide the most efficient equipment available. Step 9: Promote Occupant Awareness ‐ Encourage occupants to "do good" while implementing strategies to counteract "bad users". Educate occupants about the energy ramifications of their choices. Step 10: Address Plug and Process Loads (Design Team) ‐ Use new construction or retrofits as opportunities to implement additional PPL reduction strategies. Plan space efficiently to decrease equipment and integrate PPL control strategies into the building's electrical system.
Strategies Breakroom and Kitchen: Remove mini‐ and underused refrigerators with consolidated ENERGY STAR refrigerators. Upgrade small appliances with ones with limited parasitic loads and connect to timed outlets. Replace inefficient vending machines and investigate load management and delamping of machines. Remove coolers from drinking fountains.
Workstations: Replace desktop computers with laptops, and CRT monitors with LCD monitors. Set power options to standby or sleep after 15m of inactivity. Replace incandescent desk lighting with CFL or LED. Utilize power management surge protectors. Consolidate personal equipment (printers, scanners, fax) with networked multifunction devices with enabled power settings.

6
Elevators: Add occupancy sensors to control lighting and ventilation Small‐Scale Food Service Replace appliances with ENERGY STAR equipment. Don't use glass front refrigerators. Utilize electrical switches to disconnect power to all non‐essential equipment during non‐business hours. Conference Room Equipment: Utilize electrical outlet times and occupancy sensors to shut down equipment when unoccupied. Procure LED backlit LCSD televisions and efficient projectors. Server Room: Specify Uninterruptible Power Supplies with 95%+ efficiency. Procure blade servers with variable‐speed fans. Utilize hot aisle containment and waste heat recovery in retrofits and new construction. Telecommunications: Power and enable ports based on occupant needs. Miscellaneous: Minimize or eliminate personal electronic equipment at workstations. Utilize outlet times to power down equipment during non‐business hours. Aggregate plug loads onto a dedicated electrical panel for control and submetering.
Also Included in Document: PPL Reduction Worksheet
Key Takeaways Not applicable

7
Article Title Office Plug Load Field Monitoring Report
Citation Moorefield, L., et al. (2008). Office Plug Load Field Monitoring Report. Portland, OR, Ecos: 74.
Justification This is the first study to actually measure how electronics are used in an office environment as opposed to relying on lab measurements. The study found that the office plug loads consumed more energy than previously thought. Their conclusions provide data for making informed decisions about office equipment purchases and usage.
Introduction & Methodology Office equipment and other miscellaneous plug loads consume more than 20 percent of electricity in
California’s offices. However, energy use per device and device usage patterns are not well documented for many of these plug loads. In 2007 and 2008, Ecos Consulting and RLW Analytics conducted a plug load field monitoring study in commercial offices in California. Researchers visited 47 offices and compiled an inventory of all plug load devices found at each of the sites. The research team then installed plug load meters on a subset of devices in 25 of these offices. The meter files consisted of two weeks of data at one‐minute intervals for each metered device. Researchers recorded power, current, voltage, and power factor with real‐time time stamps. In total, the team inventoried nearly 7,000 plug load devices and collected meter data from 470 plug load devices. This is the first study to actually measure how products are used in the office environment.
This study's methodology was designed to be replicated for other studies on field measurement of plug loads in a commercial setting. Participant sample includes rural and urban counties; three office types are represented ‐ legal, accounting, tax; architectural and engineering; computer systems design; both small and large offices are included. Watts Up Pro ES meters were used after evaluating several meters. The research was conducted in 2 phases ‐ phase one included site visits and plug load inventories of 22 offices; phase 2 included site visits and inventories of 25 additional sites as well as selection of devices for metering. Researchers determined prioritization criteria for the selection of devices to be metered. Researchers visited 47 California offices and compiled an inventory of all plug load devices, nearly 7,000 devices total; Researchers metered plug load devices in 25 of the 47 offices, nearly 470 devices total; The meter files consisted of two weeks of data at one‐minute intervals; Researchers recorded power, current, voltage, and power factor with real‐time time stamps. Finally, researchers collected billing data from 21 participating sites.
Article Summary Energy efficiency efforts designed for commercial buildings have traditionally targeted the building
envelope; heating, ventilation, and air‐conditioning systems; and hard‐wired lighting. Recently, however, the energy effect of the plugged‐in equipment in these offices has garnered attention as a result of the growing requirement for more electronic products that are faster and functionally more robust than their predecessors. Today, office equipment and other miscellaneous plug loads consume more than 20 percent of electricity in California’s offices. Previous research to understand the energy use of office products relied on lab measurements of power drawn in various modes of operation, which were then combined with educated guesses about the ways products are actually used. In 2007 and 2008, Ecos Consulting and RLW Analytics conducted a plug load field monitoring study in commercial offices in California on behalf of the California Energy Commission’s Public Interest Energy Research (PIER) Program to record detailed data on how many and what types of plug loads are found in California’s office, and how these plug loads are used.
The overarching goal of this research was to collect and analyze detailed information on California’s office plug loads to develop sound recommendations for near‐ and long‐term strategies to reduce plug load energy consumption and recommend policy priorities for the Energy Commission, electric utilities, and other interested organizations so that growth of future commercial energy use can be reduced through voluntary market‐based programs and energy efficiency regulations. The project’s objectives were to

8
document how many and what kinds of plug loads are in use today in a select group of Northern and Southern California offices, and then to record detailed data on device power demand by mode, power factor, energy consumption, and usage patterns. In addition, the team sought to collect qualitative information from study participants on their office’s energy efficiency practices and procurement specifications, if any. The meter logged power, current, voltage, and power factor with real‐time time stamps at one minute intervals for each of the metered devices.
While the scale of this study was not large enough to be statistically valid for all of California, the findings provide detailed insights into how many and what types of plug loads are found in California’s offices, how these devices operate in their everyday office settings, and how much energy they consume. Overall, this study found that the office plug loads consumed more energy than previous studies which is significant because this is the first study to actually measure how products are being used in the office environment as opposed to relying on lab measurements.
Key Takeaways • Computers and monitors accounted for 66 percent of all devices; office electronics (printers, faxes,
multifunction devices and computer speakers) accounted for 17 percent of all devices; Miscellaneous devices (portable lighting, telephones, and coffee makers) accounted for the remaining 17 percent of all plug load devices. • Much of this energy is consumed on nights and weekends when no one is working in the offices. In total, researchers estimated that California’s office plug loads consume more than 3,000 gigawatt‐hours annually, costing business owners more than $400 million each year. The associated carbon dioxide emissions of these plug loads is more than 700,000 metric tons annually—equivalent to the carbon dioxide emissions of 140,000 cars during one year. • On average, plug loads consumed about 30% of total office electricity in the participating sites that shared their utility bills, which translates to 3.3 kWh per year per square foot. This also translates to 802 kWh per year per full‐time employee, or 788 kWh per year for all full‐ and part‐time employees. • The inventory showed that offices contained on average 7 devices per employee and 30 plug load devices per 1,000 square feet of office space. • The survey responses indicate that there is very little active plug load power management occurring in the buildings and that there is a need for consumer education about the significance of plug load energy impacts. • Laptops are 76% more energy efficient than desktop computers; CRT monitors used 14‐49% more power than LCD monitors depending on the mode, though 79% of monitors inventoried were LCD monitors; Inkjet printers and multifunction devices are 70% more energy efficient than laser printers. • On average, desktop computers are in standby or sleep 50% of the time and disconnected 7% of the time; Laptops are in standby or sleep 58% of the time and disconnected 26% of the time ‐ hence the large discrepancy between power use. Desktops are in active mode about 30% of the time whereas laptops are in active mode only 10% of the time.
9
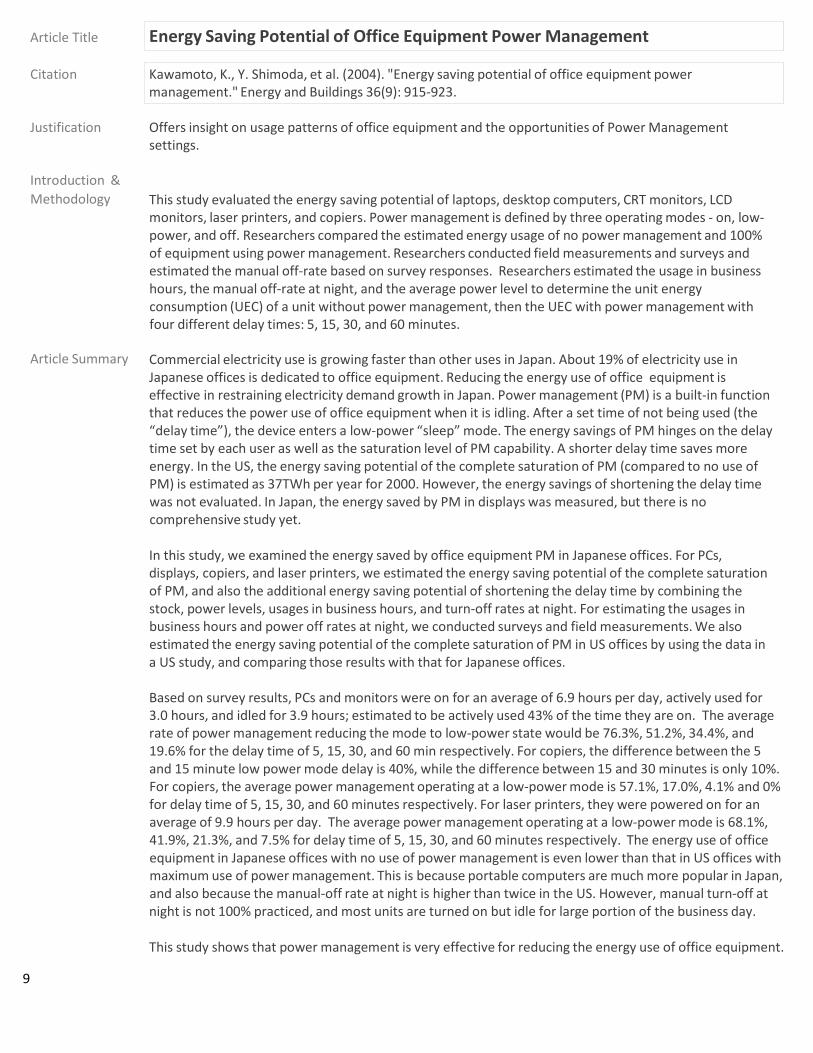
Article Title Energy Saving Potential of Office Equipment Power Management
Citation Kawamoto, K., Y. Shimoda, et al. (2004). "Energy saving potential of office equipment power management." Energy and Buildings 36(9): 915‐923.
Justification Offers insight on usage patterns of office equipment and the opportunities of Power Management
settings.
Introduction & Methodology This study evaluated the energy saving potential of laptops, desktop computers, CRT monitors, LCD
monitors, laser printers, and copiers. Power management is defined by three operating modes ‐ on, low‐ power, and off. Researchers compared the estimated energy usage of no power management and 100% of equipment using power management. Researchers conducted field measurements and surveys and estimated the manual off‐rate based on survey responses. Researchers estimated the usage in business hours, the manual off‐rate at night, and the average power level to determine the unit energy consumption (UEC) of a unit without power management, then the UEC with power management with four different delay times: 5, 15, 30, and 60 minutes.
Article Summary Commercial electricity use is growing faster than other uses in Japan. About 19% of electricity use in
Japanese offices is dedicated to office equipment. Reducing the energy use of office equipment is effective in restraining electricity demand growth in Japan. Power management (PM) is a built‐in function that reduces the power use of office equipment when it is idling. After a set time of not being used (the “delay time”), the device enters a low‐power “sleep” mode. The energy savings of PM hinges on the delay time set by each user as well as the saturation level of PM capability. A shorter delay time saves more energy. In the US, the energy saving potential of the complete saturation of PM (compared to no use of PM) is estimated as 37TWh per year for 2000. However, the energy savings of shortening the delay time was not evaluated. In Japan, the energy saved by PM in displays was measured, but there is no comprehensive study yet.
In this study, we examined the energy saved by office equipment PM in Japanese offices. For PCs, displays, copiers, and laser printers, we estimated the energy saving potential of the complete saturation of PM, and also the additional energy saving potential of shortening the delay time by combining the stock, power levels, usages in business hours, and turn‐off rates at night. For estimating the usages in business hours and power off rates at night, we conducted surveys and field measurements. We also estimated the energy saving potential of the complete saturation of PM in US offices by using the data in a US study, and comparing those results with that for Japanese offices.
Based on survey results, PCs and monitors were on for an average of 6.9 hours per day, actively used for 3.0 hours, and idled for 3.9 hours; estimated to be actively used 43% of the time they are on. The average rate of power management reducing the mode to low‐power state would be 76.3%, 51.2%, 34.4%, and 19.6% for the delay time of 5, 15, 30, and 60 min respectively. For copiers, the difference between the 5 and 15 minute low power mode delay is 40%, while the difference between 15 and 30 minutes is only 10%. For copiers, the average power management operating at a low‐power mode is 57.1%, 17.0%, 4.1% and 0% for delay time of 5, 15, 30, and 60 minutes respectively. For laser printers, they were powered on for an average of 9.9 hours per day. The average power management operating at a low‐power mode is 68.1%, 41.9%, 21.3%, and 7.5% for delay time of 5, 15, 30, and 60 minutes respectively. The energy use of office equipment in Japanese offices with no use of power management is even lower than that in US offices with maximum use of power management. This is because portable computers are much more popular in Japan, and also because the manual‐off rate at night is higher than twice in the US. However, manual turn‐off at night is not 100% practiced, and most units are turned on but idle for large portion of the business day.
This study shows that power management is very effective for reducing the energy use of office equipment.

10
The high saturation of power management seems to be already achieved by the promotion of Energy Star Program. However, many users are annoyed by delays of power management, and so disable it or set a long time delay like 60 min. Technological innovation to shorten the inconvenience of power management is necessary to achieve more energy savings by power management.
Key Takeaways • An average desktop computer with a display, either CRT or LCD, consumes about 30% of its energy use
during idling, and 40% in non‐business hours. By enabling the PM, the energy use in non‐business hours can be decreased by 60%. Furthermore, the shorter delay time of PM will decrease the energy use during idling by about 50%. • A portable computer’s energy use is much less than a desktop computer with a display. Even the UEC of a portable computer without PM is less than one‐third of the UEC with PM. This means that the energy savings by changing desktop PCs to portable PCs are larger than those obtained by enabling PM. • For copiers, when PM is built‐in and properly functioning, about 90% of the energy use in non‐business hours can be saved. For laser printers, without PM, about 50% of energy is used in non‐business hours, and 45% of energy is used during idling in business hours. In the case that PM is built‐in and properly functioning, about 65% of the energy use in non‐business hours can be saved. Furthermore, the energy use in idling can be saved by about 45% in the case of shortest delay time. • With complete saturation of PM, the energy use in non‐business hours is decreased by about 2.0TWh per year. Shortening the delay time decreases the energy use further by 1.2TWh per year.
11
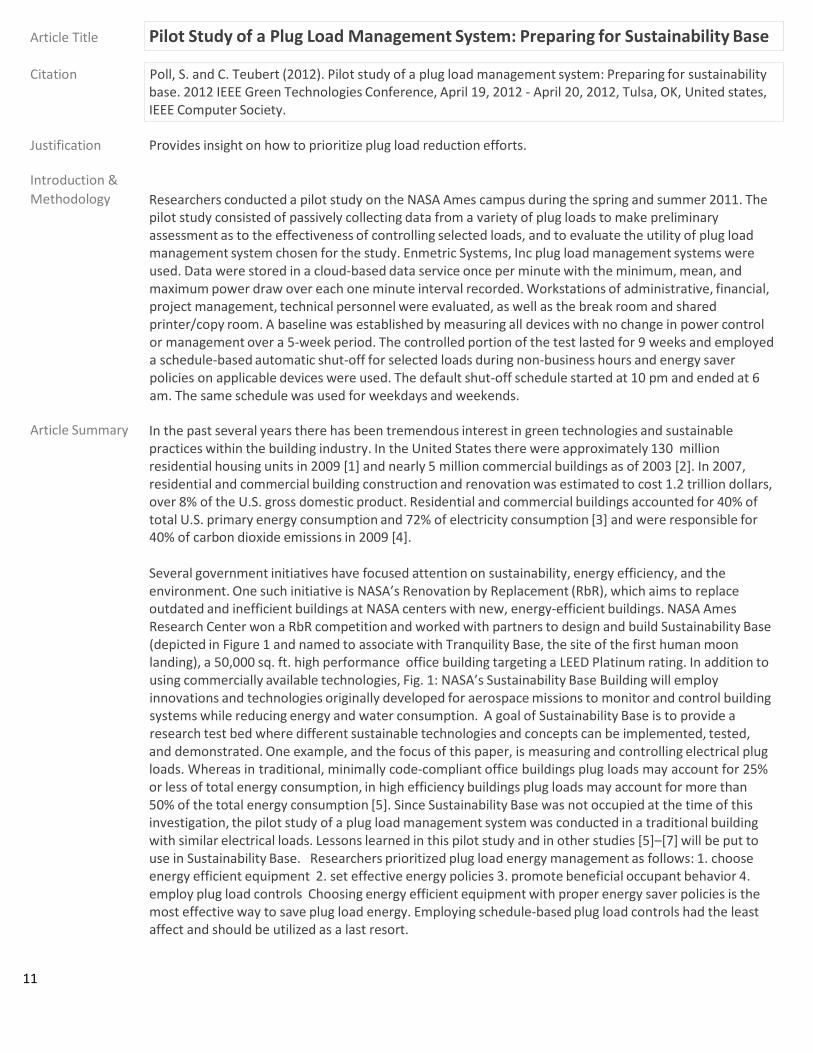
Article Title Pilot Study of a Plug Load Management System: Preparing for Sustainability Base
Citation Poll, S. and C. Teubert (2012). Pilot study of a plug load management system: Preparing for sustainability base. 2012 IEEE Green Technologies Conference, April 19, 2012 ‐ April 20, 2012, Tulsa, OK, United states, IEEE Computer Society.
Justification Provides insight on how to prioritize plug load reduction efforts.
Introduction & Methodology Researchers conducted a pilot study on the NASA Ames campus during the spring and summer 2011. The
pilot study consisted of passively collecting data from a variety of plug loads to make preliminary assessment as to the effectiveness of controlling selected loads, and to evaluate the utility of plug load management system chosen for the study. Enmetric Systems, Inc plug load management systems were used. Data were stored in a cloud‐based data service once per minute with the minimum, mean, and maximum power draw over each one minute interval recorded. Workstations of administrative, financial, project management, technical personnel were evaluated, as well as the break room and shared printer/copy room. A baseline was established by measuring all devices with no change in power control or management over a 5‐week period. The controlled portion of the test lasted for 9 weeks and employed a schedule‐based automatic shut‐off for selected loads during non‐business hours and energy saver policies on applicable devices were used. The default shut‐off schedule started at 10 pm and ended at 6 am. The same schedule was used for weekdays and weekends.
Article Summary In the past several years there has been tremendous interest in green technologies and sustainable
practices within the building industry. In the United States there were approximately 130 million residential housing units in 2009 [1] and nearly 5 million commercial buildings as of 2003 [2]. In 2007, residential and commercial building construction and renovation was estimated to cost 1.2 trillion dollars, over 8% of the U.S. gross domestic product. Residential and commercial buildings accounted for 40% of total U.S. primary energy consumption and 72% of electricity consumption [3] and were responsible for 40% of carbon dioxide emissions in 2009 [4].
Several government initiatives have focused attention on sustainability, energy efficiency, and the environment. One such initiative is NASA’s Renovation by Replacement (RbR), which aims to replace outdated and inefficient buildings at NASA centers with new, energy‐efficient buildings. NASA Ames Research Center won a RbR competition and worked with partners to design and build Sustainability Base (depicted in Figure 1 and named to associate with Tranquility Base, the site of the first human moon landing), a 50,000 sq. ft. high performance office building targeting a LEED Platinum rating. In addition to using commercially available technologies, Fig. 1: NASA’s Sustainability Base Building will employ innovations and technologies originally developed for aerospace missions to monitor and control building systems while reducing energy and water consumption. A goal of Sustainability Base is to provide a research test bed where different sustainable technologies and concepts can be implemented, tested, and demonstrated. One example, and the focus of this paper, is measuring and controlling electrical plug loads. Whereas in traditional, minimally code‐compliant office buildings plug loads may account for 25% or less of total energy consumption, in high efficiency buildings plug loads may account for more than 50% of the total energy consumption [5]. Since Sustainability Base was not occupied at the time of this investigation, the pilot study of a plug load management system was conducted in a traditional building with similar electrical loads. Lessons learned in this pilot study and in other studies [5]–[7] will be put to use in Sustainability Base. Researchers prioritized plug load energy management as follows: 1. choose energy efficient equipment 2. set effective energy policies 3. promote beneficial occupant behavior 4. employ plug load controls Choosing energy efficient equipment with proper energy saver policies is the most effective way to save plug load energy. Employing schedule‐based plug load controls had the least affect and should be utilized as a last resort.

12
Key Takeaways • Each workstation consumed an average of 27kWh of energy every week with no controls. • With controls, the weekly energy consumption averaged at 21 kWh (22% reduction). • Computers make up for 82% of plug loads in the workstations. • During the workday, desktop computers consume an average of 2.7 kWh while laptop computers consume only .36 kWh, an 86.6% reduction. Researchers estimate that by replacing desktops with laptops yearly energy savings reach 770 kWh per swapped computer. • Most effective energy saving method was enabling energy saver policies on computers. For monitors, using energy saver policies showed to have more than twice the savings of enacting scheduled‐based rules alone. The copiers did not respond well to controls and the stand‐by mode still was a large energy draw. • In the break rooms, vending machines make up 84% of the plug loads. Schedule‐based rules were employed for all devices except the refrigerator and showed a savings of 9 kWh per week. Schedule‐ based shut off for vending machines saved a total of 5.1 kWh per week. • Replacing desktop computers with laptop computers can reduce computer energy consumption by as much as 85%, as projected from the pilot study observations.
13
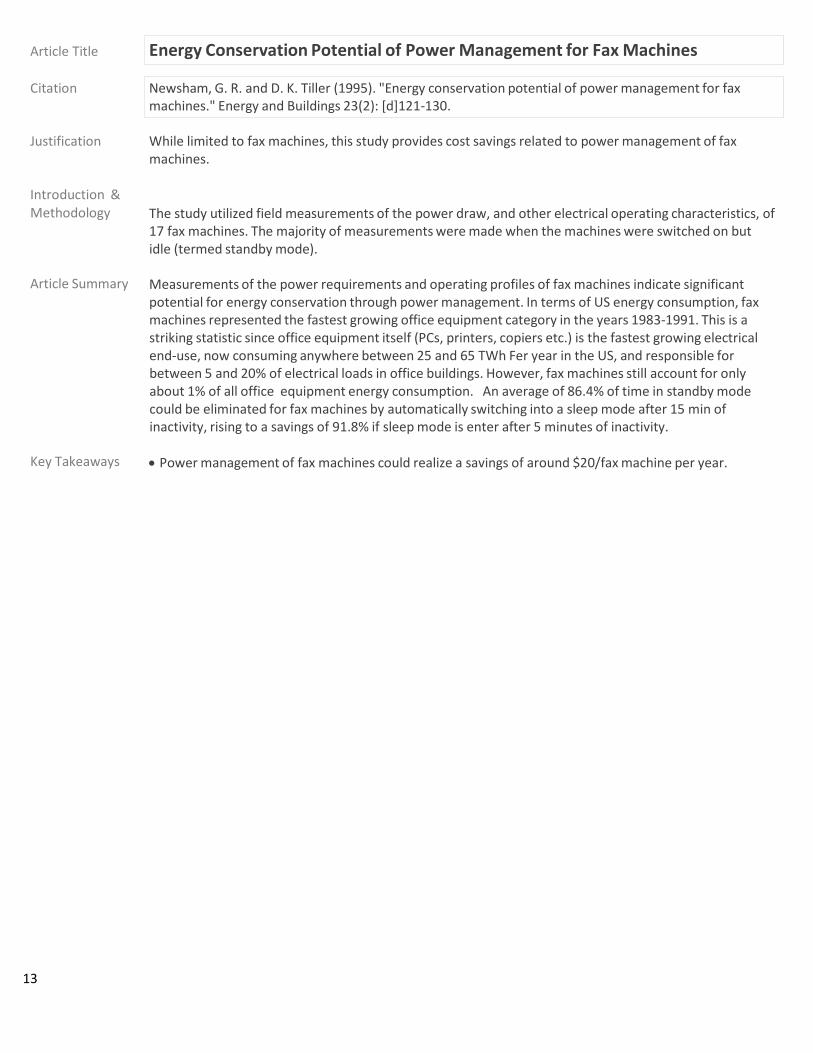
Article Title Energy Conservation Potential of Power Management for Fax Machines
Citation Newsham, G. R. and D. K. Tiller (1995). "Energy conservation potential of power management for fax
machines." Energy and Buildings 23(2): [d]121‐130.
Justification While limited to fax machines, this study provides cost savings related to power management of fax machines.
Introduction & Methodology The study utilized field measurements of the power draw, and other electrical operating characteristics, of
17 fax machines. The majority of measurements were made when the machines were switched on but idle (termed standby mode).
Article Summary Measurements of the power requirements and operating profiles of fax machines indicate significant
potential for energy conservation through power management. In terms of US energy consumption, fax machines represented the fastest growing office equipment category in the years 1983‐1991. This is a striking statistic since office equipment itself (PCs, printers, copiers etc.) is the fastest growing electrical end‐use, now consuming anywhere between 25 and 65 TWh Fer year in the US, and responsible for between 5 and 20% of electrical loads in office buildings. However, fax machines still account for only about 1% of all office equipment energy consumption. An average of 86.4% of time in standby mode could be eliminated for fax machines by automatically switching into a sleep mode after 15 min of inactivity, rising to a savings of 91.8% if sleep mode is enter after 5 minutes of inactivity.
Key Takeaways • Power management of fax machines could realize a savings of around $20/fax machine per year.

14
Article Title Office Building Plug Load Profiles
Citation Acker, B., et al. (2012). Office Building Plug Load Profiles. Boise, ID., University of Idaho: 53.
Justification This paper analyzes different plug load intervention techniques to assess effectiveness of reducing off‐ hour/inactive energy use. It compares results to recent office plug load studies and provides direction.
Introduction & Methodology This paper presents the findings from a two‐year project to characterize space level plug load profiles and
explore load reduction interventions and their effects on load shapes in typical commercial office spaces. A total of six office spaces were studied comprising 48,500 square feet (SF) and inventorying 1,360 plugged devices. Baseline plug load profiles are presented along with load profiles and savings in spaces that had plug load reduction interventions installed. Interventions investigated included occupancy sensor plug strips, load sensing plug strips, educational and behavior based strategies, and replacement of legacy equipment with Energy Star equipment. A total of 121 plug strips were installed in two spaces.
The authors reviewed published plug load studies ranging from 2001 to 2011 to identify gaps in research and in results. The literature review revealed a knowledge gap with regard to aggregate plug load profiles (computers, ME, and other OE) within a building because most existing research focused on profiles of individual equipment. Therefore, the authors studied plug loads at the distribution panel level to reveal the scale of total plug loads and their associated profiles over time. Of specific interest to the authors were peak demand and baseline power levels, associated times, and after hour power levels. The literature review also suggested a need for future work surrounding the effect of smart plug strips and occupancy sensors to control outlet power and the implementation of user education campaigns to raise awareness of the total power contribution of plug loads. No aggregate level research was found on plug load reduction strategies.
Four strategies were investigated in this study, 1) occupancy sensor plug strips, 2) load sensing plug strips, 3) behavior based interventions through an educational campaign, and 4) installation of Energy Star equipment. Six offices were included in the studied and all offices were located in Boise, ID. Five of the six offices were suites within a larger building. The office types included Land Records, World Wide Logistics, Architect, Elections, Regulatory Agency, and Investment Analytics. The offices ranged from small (under 20 employees), medium (20‐50 employees), to large (50‐100 employees).
Total plug load energy was logged at the distribution panel level in order to obtain aggregate plug loads and plug load profiles over time. Data logging equipment was placed at the panel feeders to record true power and energy values every 15 minutes. If the panel contained circuits, which were not plug loads, such as lighting or HVAC equipment, current loggers were used to monitor these current draws and these draws were subtracted from the total current of the panel, leaving just the plug load data. Data were collected over a 15‐month period. Interventions were applied to four of the six sites. For the plug strip and e‐mail interventions a 12‐month period was used to establish a baseline energy use profile, and interventions were logged for 3 months. In the case of the Energy Star intervention, baseline energy was logged for 3 months with 12 months of post logging.
Article Summary Of the plug strip interventions (occupancy sensor plug strips and load‐sensing plug strips), savings per device controlled was comparable. The average savings with the occupancy sensor plug strip was 16.97% during the weekday, 28.39% during the weekend, and 36.22% during the holidays, for a total average of 27.19%. For the load sensing plug strips, the average savings was 19.75% during the weekday, 25.14% during the weekend, and 38.41% during the holidays, for a total average of 27.77%. The behavior intervention consisted of the human resources manager sending out a preliminary e‐mail informing the staff of the importance of turning off unneeded equipment and the energy impacts of current practices.

15
The e‐mail also contained information about the study being performed and contained a graph of the baseline plug load profile. After the initial e‐mail was sent, a reminder e‐mail was delivered once a week for a period of four weeks. Very modest energy savings can be seen in unoccupied hours during the post intervention period. During occupied weekday hours there was an average 0.24% energy savings. During unoccupied weekday hours there was an average of 4.14% savings, during the weekend the average savings was 1.52%, and during the holidays the average savings was 18.95%, for a total average of 6.21% savings. Of the Energy Star equipment intervention, four older computers were replaced with Energy Star models. Additionally, four computers were removed and not replaced as they were seldom used, which represents a substantial savings potential. The average savings was 14.49% during the weekday, 19.83% during the weekends, and no holidays were recorded during the baseline period, for a total average of 17.16% savings. Server control was not studied though warrants more investigation. An example of this can be seen in the afterhours load profile in Graph 5, which is due to an IT policy of leaving computers powered on during weekdays so software program updates can be installed. Decreased allowable lighting power densities and increased task lighting will serve to increase the percentage of plug loads. Energy modeling inputs need to be carefully monitored, too, as the increase in wide plug load variables may further increase modeling error. While the energy savings potential from both occupancy sensor and load sensing plug strips is considerable, cost effectiveness may still be a concern. The current price for occupancy sensor plug strips are approximately $90.00 and load sensing plug strips are $30.00; standard plug strips with similar surge protection specifications cost approximately $15‐20.
Key Takeaways Older CRT monitors were often not used, though, survey results showed that many of the offices used two LCD monitors per workstation, making the energy saving potential between LCD and CRT monitors neutral. The total average savings of the different intervention programs were: 1) occupancy sensor plug strips ‐ 27.19% 2) load sensing plug strips ‐ 27.77% 3) behavior based interventions through an educational campaign ‐ 6.21% 4) installation of Energy Star equipment ‐ 17.16% (not including savings during holidays)
16
Article Title Reducing Plug and Process Loads for a Large Scale, Low Energy Office Building: NREL's Research Support Facility
Citation Lobato, C., et al. (2011). Reducing plug and process loads for a large scale, low energy office building:
NREL's research support facility. 2011 ASHRAE Winter Conference, January 29, 2011 ‐ February 2, 2011, Las Vegas, NV, United states, Amer. Soc. Heating, Ref. Air‐Conditioning Eng. Inc.
Justification Provides a good methodology for identifying and reducing process and plug loads in order to meet strict
energy goals.
Introduction & Methodology NREL's Research Support Facility (RSF) is projected to achieve annual net zero energy use with on‐site
renewables and be one of the largest U.S. net zero energy office buildings. The project’s Request for Proposals (RFP) set a whole‐building demand‐side energy use requirement of a nominal 25 kBtu/ft2∙yr (78.8 kWh/m2∙yr) (Pless et al. 2010) that parked an investigation into benchmarking current plug and process loads (PPLs). This paper outlines reduction strategies that were developed for the RSF. These can be used in any building, but are most effective at the beginning of the design stage. The owner, tenant, engineer, architect, information technologies (IT) procurement staff, and facility operator all can make decisions about efficient PPLs. The RSF design team was contractually required to meet a whole‐building energy use goal that included PPLs.
To accurately account for PPLs, the team required input from NREL on previous and proposed equipment and use. A team of NREL researchers was assigned to be PPL champions, and began by performing a thorough survey of NREL’s equipment use. From the PPL survey, NREL researchers developed an equipment inventory and metered a representative sample to develop use patterns and determine peak and standby energy use. The metered data revealed a baseline PPL energy use of 35.1 kBtu/ft2∙yr (110.6 kWh/m2∙yr), which would have made it impossible to meet the RSF energy goal. Therefore, RSF PPLs had to be reduced by approximately 50%.
Article Summary One of the first PPL reduction strategies implemented was with the data center. NREL's previous data
center used multiple servers that typically had a utilization rate of less than 5%. The continuous power consumption rate per person was 65 W. The uninterruptable power supply and room power distribution units were 80% efficient. The RSF data center uses blade servers running virtualized servers and has a continuous power consumption rate per person is 35 W. Additionally, the current UPS and room power distribution are 97% efficient. With copiers, printers and fax machines, the audit reveal that many workstations had their own single‐user machines. The RSF will have all‐in‐one printing stations to be used by approximately 60 occupants. For computers and monitors, the audit revealed that approximately 90% of employees used desktop computers. In the RSF building, 90% of workstations will be equipped with laptop computers and LED backlist LCD monitors in addition to setting power saving modes on the laptops and monitors. Some other key strategies were more efficient task lamps and phones, more efficient appliances in breakrooms, energy efficient regenerative traction elevators rather than the standard hydraulic elevators, and more efficient miscellaneous load for espresso machines and vending. Additionally, the miscellaneous equipment will be control to shut off after business hours.
The design strategies resulted in an overall savings of 47% for PPLs and 51% for the whole RSF building compared to the previous NREL building. By integrating the PPL strategies with the other efficient building systems, the RSF has an expected whole‐building energy use of 35.1 kBtu/sf/yr. The additional loads will be offset by a photovoltaic system to meet the Zero Energy Building goal. The PPL and efficient building systems strategies resulted in a PV cost savings of more than $4 million. The RSF PPL energy use intensity is estimated to be 18.5 kBtu/sf/yr.
The authors provide recommendations and strategies for reducing plug and process loads on page 8‐10.

17
Establish a PPL champion, Develop a business case for addressing PPLs, Benchmark your conventional equipment and operations, Be willing to identify occupants' true needs, Meet needs as efficiently as possible, Turning it all off, Encourage the design team to identify applicable PPL strategies, Institutionalize plug load measures through procurement decisions and policy programs, Address unique miscellaneous PPLs, Occupant awareness.
Key Takeaways • Using the avoided cost of renewables (ACR) metric makes a strong business case for implementing
significant changes. For every one Watt continuous saved in RSF, $33 worth of PV was avoided. At a whole‐building EUI of 25 kBtu/sf/yr, a building will achieve a diminishing return on investment into demand‐side reductions. At this point, it becomes economically advantageous to invest in supply‐side measures, such as PV, to reduce net energy consumption. • Savings from each PPL reduction strategy are shown on Table 1, page 6‐7. • The PPL energy use intensity was reduced from 35.1 kBtu/sf/yr to 18.5 kBtu/sf/yr.

18
Article Title PC and Monitor Night Status: Power Management Enabling and Manual Turn‐Off
Citation Nordman, B., et al. (2000). "PC and monitor night status: Power management enabling and manual turn‐ off." Proceedings ACEEE Summer Study on Energy Efficiency in Buildings 7: 7.89‐87.99.
Justification Paper summarizes perviously published data, concludes with the opportunities for significant energy savings through device power management.
Introduction & Methodology Analyze data from other published reports.
Article Summary The authors express that in order to understand true energy consumption patterns of office equipment
we need to understand the status of these devices when they are not in use. Specifically, the use of automatic power management and manual turn‐off greatly affects a computer’s annual energy use. In this paper, the authors review measurements of power management enabling rates and night status for PCs and monitors. They propose “typical” rates for these factors.
This study is limited to PCs and monitor night status (including enabling), as within the realm of office equipment, this topic holds the most extant data, uncertainty in energy use, and existing and potential energy savings. PC power management operates by the unit sensing when a specified time has passed with no ‘activity’ (usually from the keyboard or mouse) and initiating a sequence of low power modes. Delay times usually range from a few minutes up to an hour. When activity occurs while the device is in a low‐power state, it automatically wakes itself up and returns to the full‐on state. Though not technically part of automatic power management, the degree to which people turn off equipment by hand can be as important to energy use and savings as power management. To illustrate the importance of automatic power management (night status), they show an estimate of energy savings based on power consumption in different modes (Figure 1). Based on their estimates, night status can reduce energy demand by over 60%. The authors define equipment night status as being a function of two factors ‐ the rate at which equipment is manually turned off and the rate at which equipment power management capabilities begin operating. The authors examined the night‐time operating status and the status of the power management equipment that have been reported in published and gray literature.
Data on office equipment night status are not regularly reported in any standard venue such as government statistics, refereed journals, or even building energy audits. Most of the sources are research reports by building energy efficiency professionals assessing office equipment, plus surveys by an equipment manufacturer. The analysis was limited to studies that included at least ten devices of a given type (PC, monitor, printer, or copier). No data was collected after intervention was made to change energy use patterns. The purposes of the studies that were incorporated into this analysis fell into the following general categories: Document office plug load energy use patterns, Collect data to evaluate energy reduction measures, Collect data to estimate current use, Evaluate the performance of Energy Star computers, Assess knowledge of office equipment energy efficiency ad test educational messages among different groups, Estimate the savings from installation of controlling devices only.
Key Takeaways • Based on their estimates, night status can reduce energy demand by over 60%. The results show that of
the studies analyzed, only an average of 25% of the PC had power management settings enabled, and 60% of the monitors had power management settings enabled. During after hours, an average of 25% of the PCs were left on, 10% were reported to be in low power mode, and 65% of the PCs were turned off. • As for the monitors after hours, an average of 15% were left on, 20% were reported to be in low power mode, and 65% were turned off. • While the authors are not confident in the data given the wide degree of variability in the methodology, the results show that there is an opportunity for IT managers and energy managers to enable automatic

19
power saving programs in computers and monitors for energy savings.

20
Article Title After‐Hours Power Status of Office Equipment in the USA
Citation Webber, C. A., et al. (2006). "After‐hours power status of office equipment in the USA." Energy 31(14): 2487‐2502.
Justification Provides an understanding of the scope of opportunities available within power management settings.
Introduction & Methodology Office equipment is expected to be the fastest‐growing segment of commercial energy use over the next
20 years, yet many aspects of office equipment energy use are poorly understood. User behavior, such as turning off devices at night or enabling power management (PM), influences energy use to a great extent. The computing environment also plays a role both in influencing user behavior and in the success of PM. Information about turn‐off rates and PM rates for office equipment was collected through a series of after‐hours audits in commercial buildings. Sixteen businesses were recruited, including offices (small, medium and large offices in a variety of industries), schools, and medical buildings in California, Georgia, and Pennsylvania. The types and power states of office equipment found in these buildings were recorded and analyzed. This article presents these data for computers, monitors, printers, copiers, fax machines, scanners and multi‐function devices. These data can be used to improve estimates of both energy consumption for these devices and savings from energy conservation efforts.
A small office has fewer than 50 employees, a medium office has 50–500 employees, and a large office has more than 500 employees on site. The overall size of the company (which may have employees working in other locations) was not considered when characterizing the size of the office. Also, some audited offices occupied only a part of a larger building; the occupancy of the building as a whole was not a factor in characterizing office size. The power state of each unit was recorded as on, low, off, or unplugged (equipment that appeared never to be used was not recorded). If a paired monitor and computer were both on, the screen content was recorded. When a monitor is off and the computer to which it is connected is not, it can be difficult to tell whether the computer is on or in low power. For PCs that appeared to be in low power mode, a clamp‐on current meter was used to measure relative current in the computer power cord before and after initiating a computer wake function, such as touching the mouse or keyboard. The PC was determined to have been in low power mode if the change exceeded a pre‐determined threshold.
Article Summary The authors note that the DOE projects that office equipment will be the fastest growing commercial end
us between 2003‐2025. They explain, however, the topic has not been highly researched at a scholarly level. They identified the published analyses noted in their literature review as "bottom‐up" analyses, where they begin with device power and usage, unit shipments, and device life times and work "upward" to aggregate energy use and savings. They purport that precise estimate of the underlying inputs are essential to accurately analyze this growth area. The authors determine that two key areas of uncertainty in estimating energy use are user behavior and power management (PM) rates. User behavior determines the number of hours per day during which a device is in use, the number of hours the device is turned on but idle, and the number of hours the device is off. PM can reduce the amount of power used by a device when it is turned on but not in active use.
Of the body of literature on PM and turn‐off rates, the studies do not present a cohesive picture of office equipment user behavior and the results span a wide range. PC turnoff rates range from 0% to 91%, with the two most recent surveys reporting rates of 44% and 82%. User behavior may also vary from region to region (e.g. Japanese results may differ from American results because Japanese and Americans have different usage patterns). User behavior may also be changing over time with the evolution of office equipment technology, software and computer networks.
The Energy Analysis Department at Lawrence Berkeley National Lab (LBNL) undertook this study to improve

21
understanding of turn‐off behavior and PM rates to better estimate overall energy use and gauge the effectiveness of PM technologies. It includes more buildings and more pieces of equipment than previous studies, and includes non‐office and non‐government buildings in several US regions. The study consisted of a series of after‐hours audits of office equipment in commercial buildings done as part of ongoing technical support of EPA’s ENERGY STAR program. Sixteen businesses were audited, including offices (small, medium and large offices in a variety of industries), schools, and medical buildings in the San Francisco Bay area (CA), Pittsburgh, PA, and Atlanta, GA. This article presents the results of these audits, including the numbers and types of office equipment found, their observed power states and PM delay settings (if applicable). This is the most robust sample of buildings to date for collecting data on the after hours power status of office equipment. It includes data on 1683 computers (including desktops, ICSs, laptops and servers) and about 448,000 ft2 in 12 commercial buildings, including schools and health‐ care facilities in California, Georgia, and Pennsylvania. Turn‐off rates for PCs and monitors were much lower than found in most of the previous studies. The desktop turn off rate was 36% (laptops not included), CRT monitors was 32%, and LCD monitors was 18%. The PM rate for desktop computers was 6%, and 71% and 75% for CRT and LCD monitors, respectively (Table 3). Fifty laptop computers were observed during the audits, while it was clear by empty docking stations and unattached power cords that there were 120 more missing laptops, likely taken home by employees. Laptops only made up 10% of all personal computers audited.
Key Takeaways The results, shown in Table 8, suggest that energy use could be reduced by a factor of 2.6 through turn‐
off behavior alone, or by a factor of 2.9 through turn‐off behavior and fully successful PM.

22
Article Title Plug‐Load Control and Behavioral Change Research in GSA Office Buildings
Citation Metzger, I., et al. (2012). Plug‐Load Control and Behavioral Change Research in GSA Office Buildings. GSA Green Proving Ground Program. NREL: 47.
Justification Provides relevant data on the effectiveness of plug load intervention strategies with return on investment
data.
Introduction & Methodology GSA owns and leases over 354 million sf of space in over 9,600 buildings. According to several energy
assessments of GSA’s Region 3 buildings conducted by NREL, the average plug‐load energy consumption accounts for 21% of the energy end use within a standard office building, excluding data centers. A complex array of technologies that meter and control office equipment has emerged in the marketplace. Control strategies that match office equipment energy use to user work schedules can save considerable energy in most office buildings. These control strategies are also effective in reducing peak demand.
The study consisted of three different phases of data collection. Each condition ran for 4 weeks. The study also included two of the eight sites as control groups for the entire three phases. Data were collected from 295 different devices divided throughout the eight different study locations. The three different phases are outlined below: Phase 1 – Inventory and Baseline: A site visit was conducted at each field office to inventory the existing plug‐load equipment and note any inconsistencies between sites. Submetering without control was used to monitor energy consumption prior to the control phase. Phase 2 – Initial Controls Deployed: The sample of eight field offices was divided into four groups, each testing different control features (except for the control group). Prior to the experimental phase, occupants were provided with a brief notification including operating instructions, access to the online dashboard (limited to the facility site managers), and plug‐load energy efficiency educational information. Phase 3 – Controls Refined: The controls strategies were refined in an attempt to achieve higher savings and incorporate lessons learned from phase 2 (initial control deployment).
Article Summary The three controls studied were load‐sensing plug strips, schedule timer controls and both controls at the
same time. With load‐sensing control, the most significant savings were achieved with printers (avg 32%) and miscellaneous equipment (avg 52.5%). The laptops (avg 6%), monitors (avg 2.5%) realized only limited savings on average. Limited or no energy savings can be attributed to master devices failing to go into a standby mode and never crossing the specified threshold and lack of occupant training which lead to disabling of controls. For laptops, it can be seen that the computer power management system was already turning these devices down to very low‐power states during unoccupied hours, and the load‐ sensing did not add much value to this device type. Finally, the miscellaneous equipment did demonstrate reduced power and effective control by the load‐sensing control, yet the small total draw of the devices did not add much to the overall savings achieved.
For schedule timer controls, the best results were achieved for printers (average 49.5%), laptops (avg 32%), and miscellaneous workstation equipment (avg 46%). The laptops also realized good energy savings during the evenings and weekends, in addition to the savings already being achieved by the computer power management system. Monitors realized an average of 20.5% savings, and under cabinet lighting realized an average of 24% savings. With the combined control, some savings were achieved in all categories except for monitors. Printers realized an average of 22.5%, laptops realized and average of 24.5% savings, miscellaneous equipment realized an average of 54% savings. Results for the combined controls did not improve energy savings as expected. Issues with the load‐sensing controls as well as instances of conflicting controls may have contributed to the limited savings. Also, a significant number of complaints were received from occupants in this research group during control phase 2 leading to several of the schedule and load‐sensing rules

23
being disabled. The overall average energy savings for each control were 47.5% for schedule timer controls, 16.5% for load‐sensing controls, and 17.5% savings for the combined controls. The payback period for a $100 device was best for the schedule timer controls, at an average of 3.425 years for all devices combined. The average payback period for the load‐sensing controls was 30.5 years and 13.9 years for the combined controls. The largest savings were on loads that run 24 hours per day, 7 days per week unnecessarily: printers (27%‐69% reduction, depending on the type of control) and miscellaneous equipment (51%‐81% reduction, depending on the type of control). Most of the workstation equipment (laptops and monitors) were already demonstrating relatively good power‐saving behavior due to the computer power management system, which limited energy savings potential.
Key Takeaways See article summary.


