86
OLLI WEST: EARTH CLIMATE – WEEK 3 1. Data and proxy data 2. Present signs of climate change 3. Ocean acidification Tuesday September 29th, 2015 Paul E. Belanger, Ph.D.
| Date post: | 02-Jan-2016 |
| Category: |
Documents |
| Upload: | jack-barker |
| View: | 214 times |
| Download: | 0 times |
OLLI WEST: EARTH CLIMATE – WEEK 3
1. Data and proxy data
2. Present signs of climate change
3. Ocean acidification
Tuesday September 29th, 2015
Paul E. Belanger, Ph.D.

Data and proxy data
• Data: Measurements – present and past• Thermometry• Ice bubbles, • Field measurements, etc.
• Data Proxies: indirect measurements made from collected data to reconstruct past climates:
geochemical proxies
biological proxies
lithologic proxies

Data and proxy data
Data has it’s errors
Proxy data has even more errors

Scientific History of Climate change – PROXY DATA
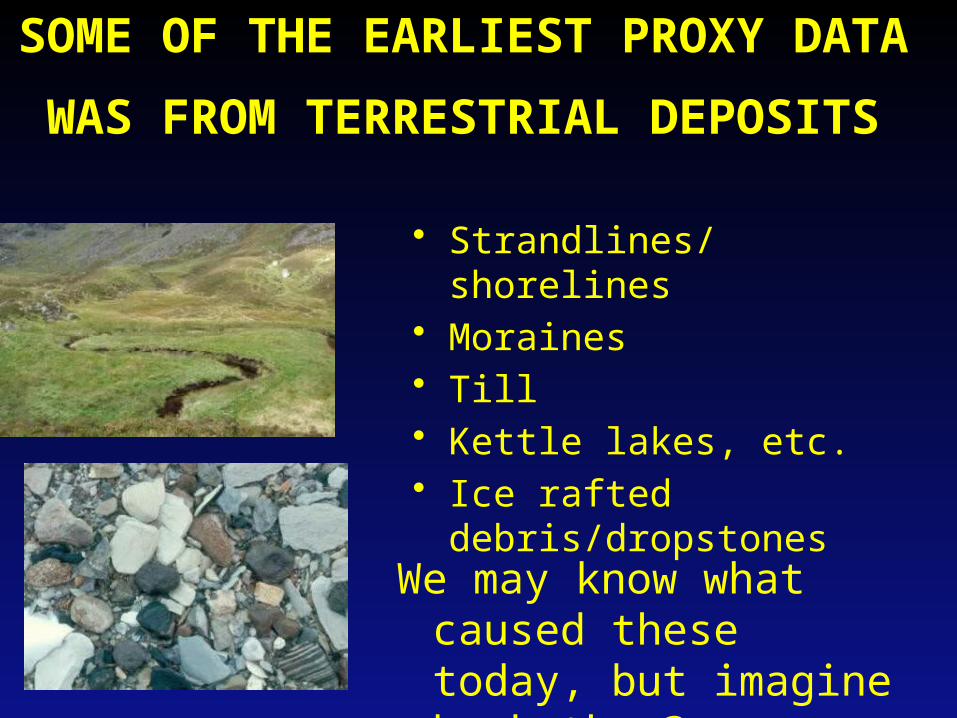
• Strandlines/shorelines• Moraines• Till• Kettle lakes, etc.• Ice rafted
debris/dropstones
SOME OF THE EARLIEST PROXY DATA
WAS FROM TERRESTRIAL DEPOSITS
We may know what caused these today, but imagine back then?
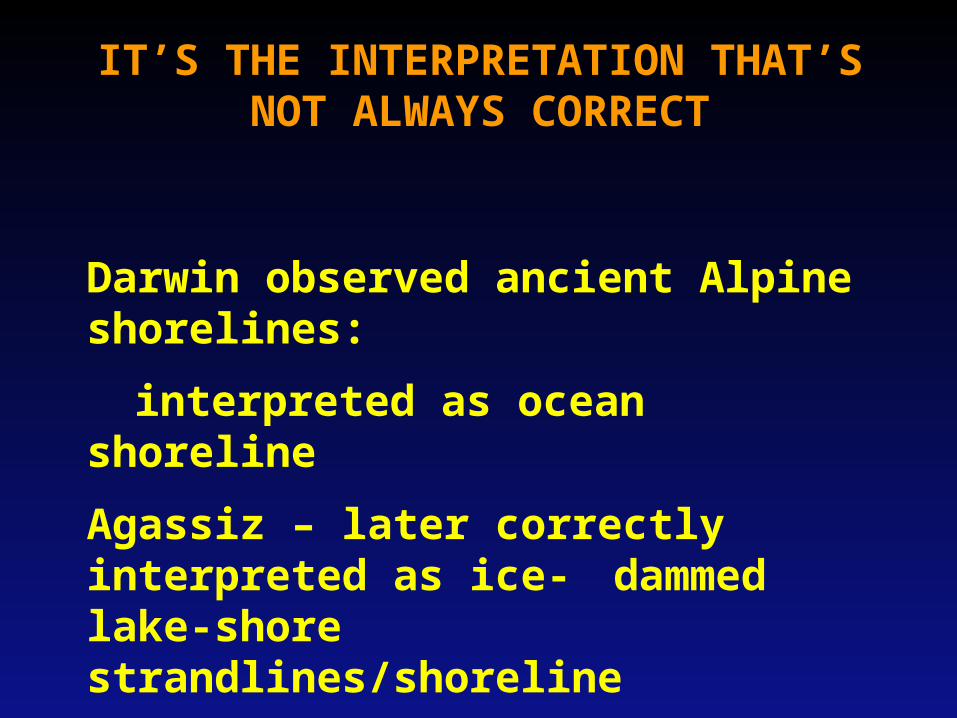
IT’S THE INTERPRETATION THAT’S NOT ALWAYS CORRECT
Darwin observed ancient Alpine shorelines:
interpreted as ocean shoreline
Agassiz – later correctly interpreted as ice-dammed lake-shore strandlines/shoreline

• Jean Louis R. Agassiz
• “Father” of Glaciology
• 1807-1873• Paleontologist• Glaciologist
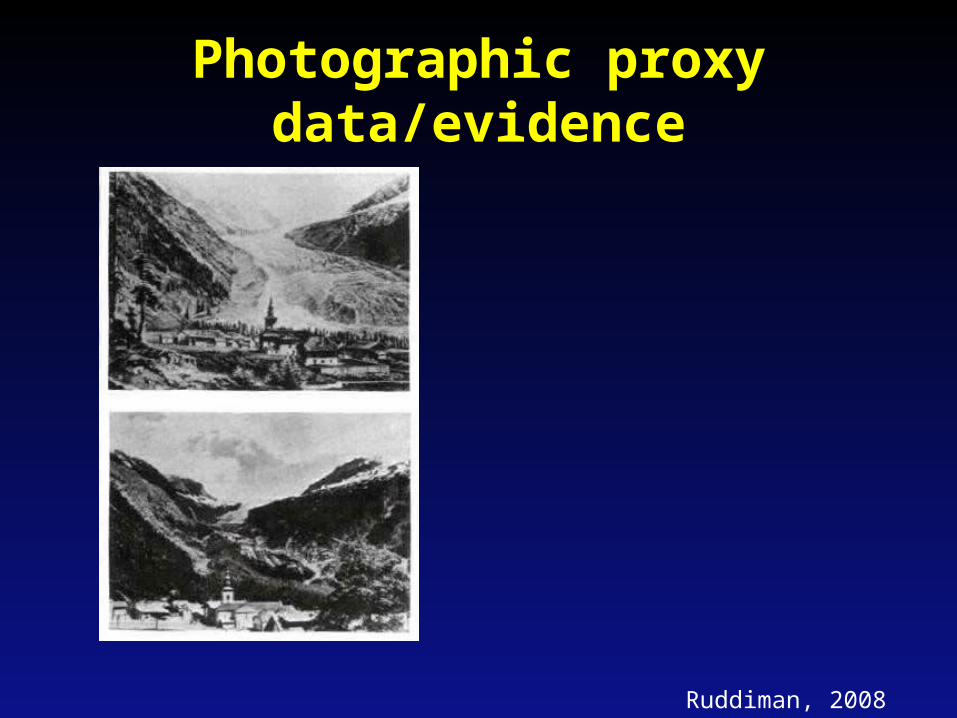
Photographic proxy data/evidence
Ruddiman, 2008

EARLY PROXY DATA:
TREE RINGS
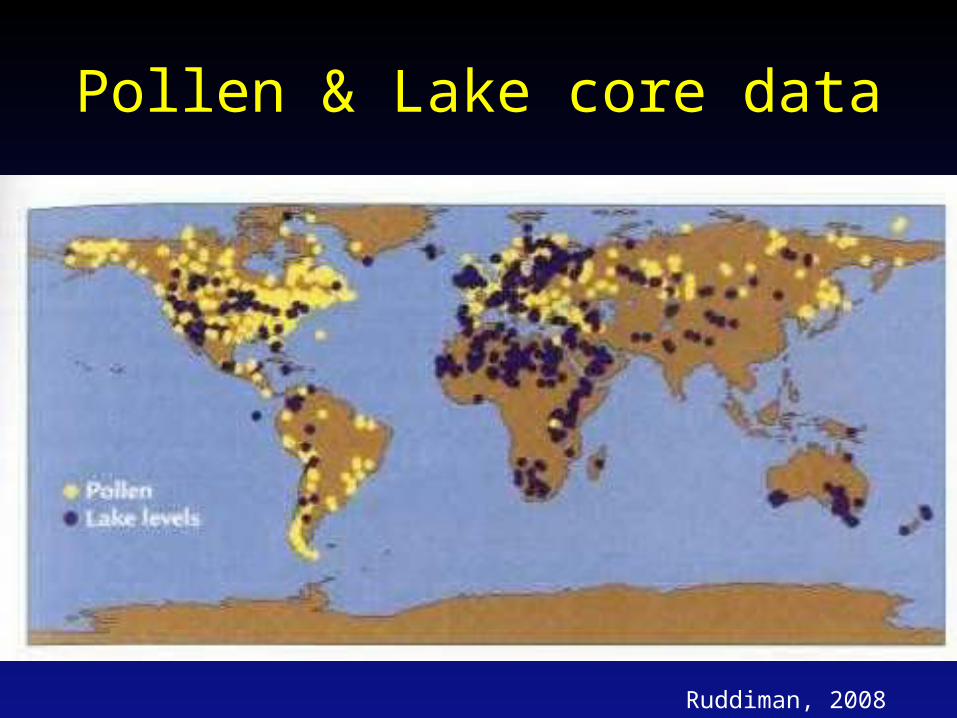
Pollen & Lake core data
Ruddiman, 2008
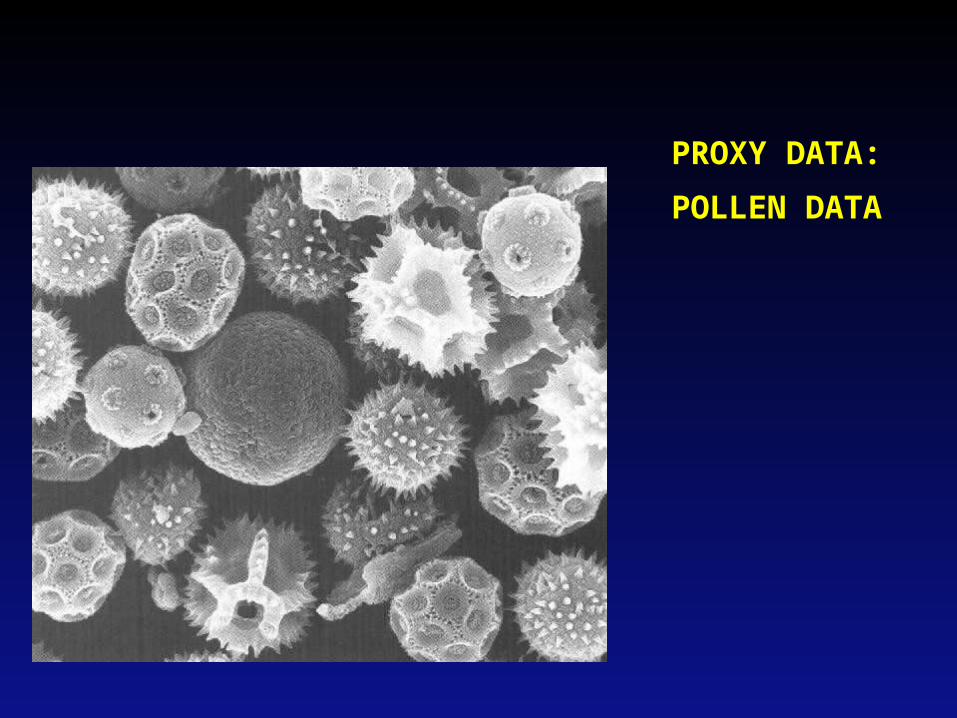
PROXY DATA:
POLLEN DATA

PROXY DATA:
LEAVES

Tree rings, corals, ice cores
Ruddiman, 2008
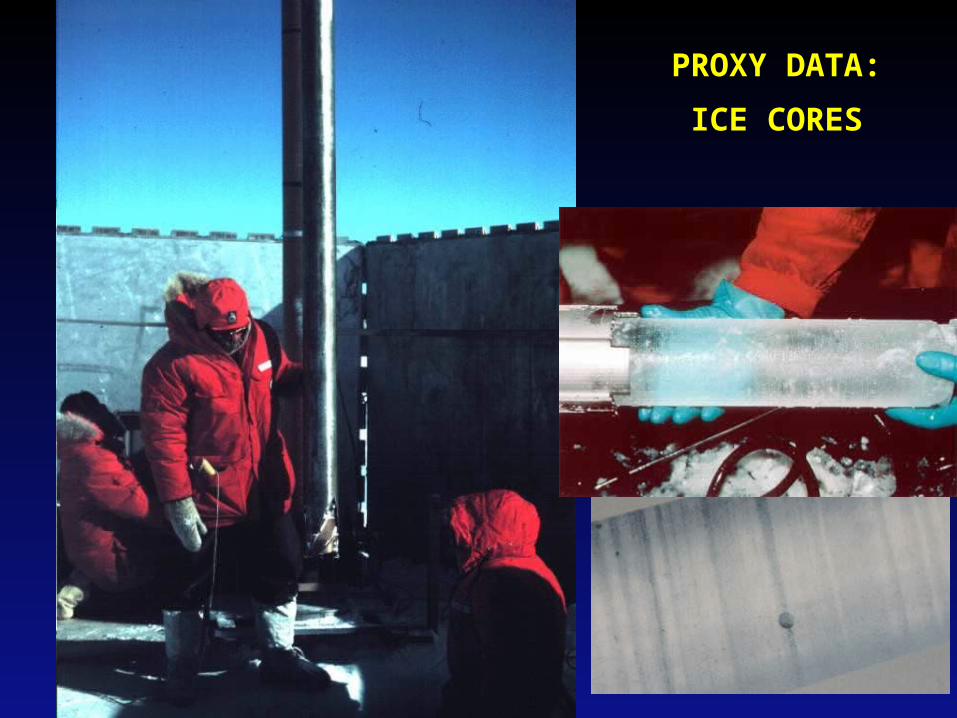
PROXY DATA:
ICE CORES
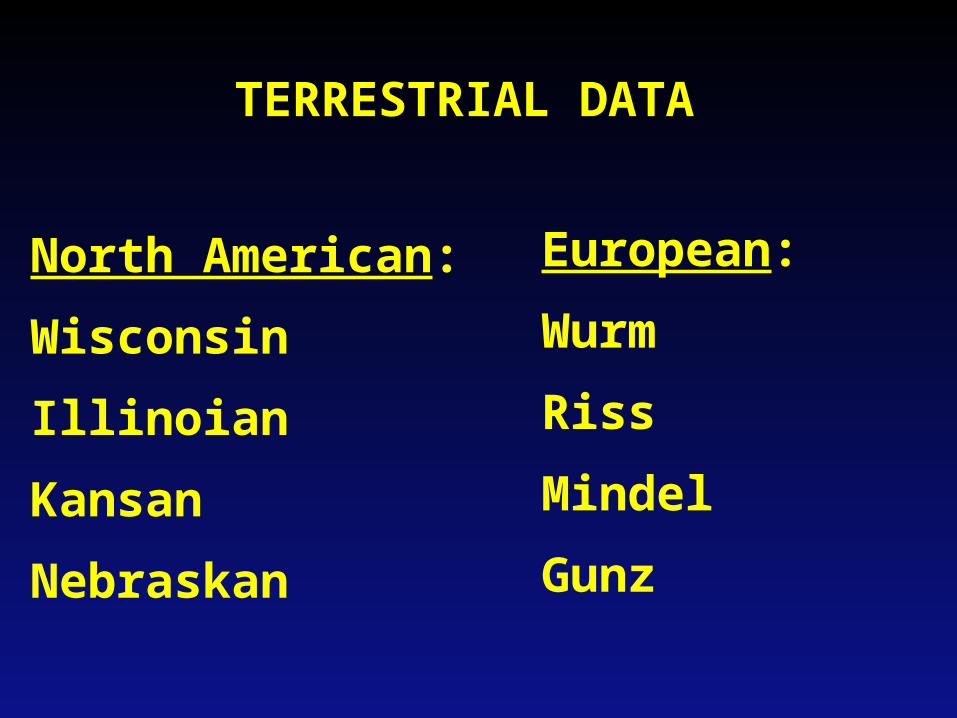
TERRESTRIAL DATA
North American:
Wisconsin
Illinoian
Kansan
Nebraskan
European:
Wurm
Riss
Mindel
Gunz

LATER EVIDENCE CAME FROM
THE MARINE RECORD
NOT WITHOUT IT’S PROBLEMS,
BUT MORE COMPLETE

CesareEmilani:
Paleontologist,Chemist
Father of Paleoceanography

Other Paleoceanographers
Wally Broecker
Thermal-haline
“conveyor” belt of circulation
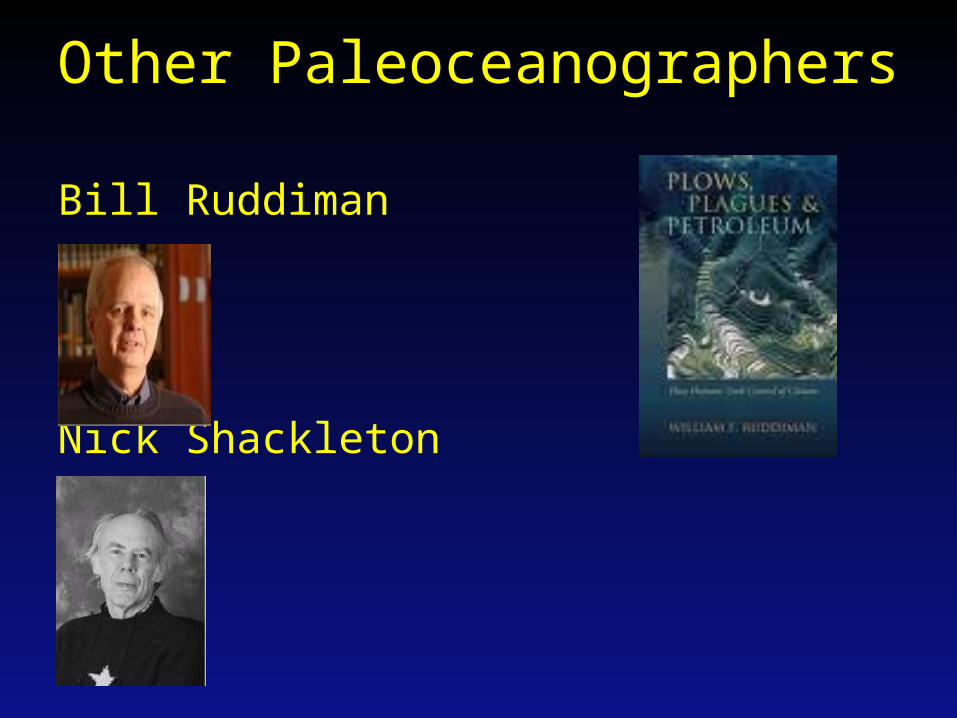
Bill Ruddiman
Nick Shackleton
Other Paleoceanographers
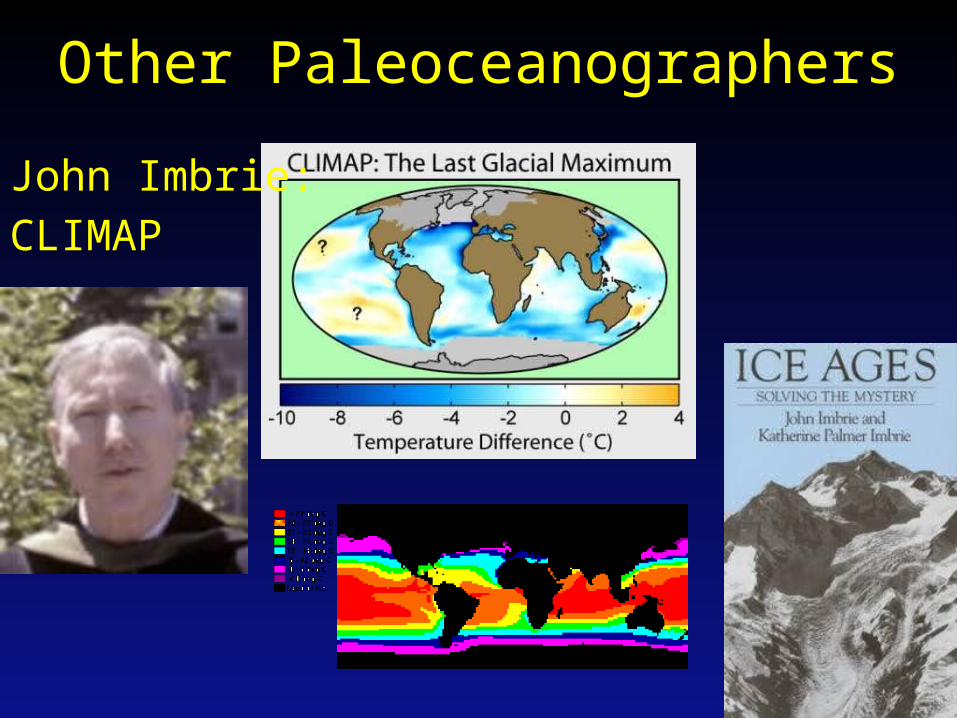
Other Paleoceanographers
John Imbrie:
CLIMAP

PROXY DATA:
CORE DATA
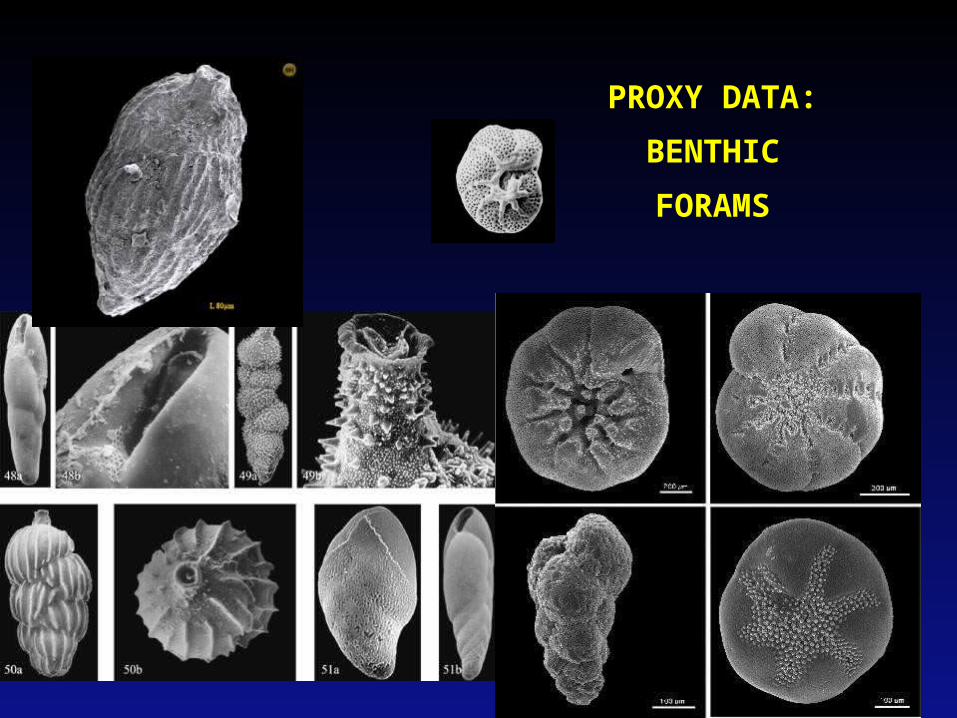
PROXY DATA:
BENTHIC
FORAMS

PROXY DATA:
PLANKTONIC
FORAMS

Deep Sea Coring
Ruddiman, 2008

Isotopic fractionation

http://serc.carleton.edu/microbelife/research_methods/environ_sampling/stableisotopes.html
• Normal Oxygen has 6 protons and 6 neutrons referred to as O16.
• The rarer stable isotope of oxygen has 2 extra neutrons and is referred to as O18
How Rain, snow and ice gets progressively lighter in the ratio of O18/O16

http://atoc.colorado.edu/~dcn/SWING/overview.php
How Rain, snow and ice gets progressively lighter in the ratio of O18/O16
SMOW
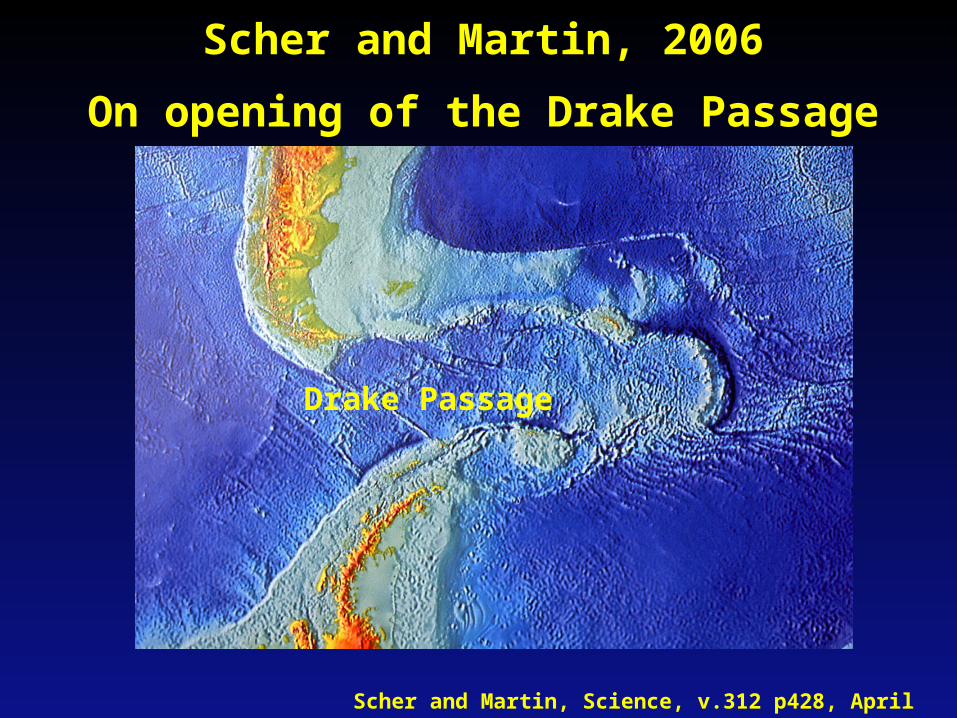
Drake Passage
Scher and Martin, 2006
On opening of the Drake Passage
Scher and Martin, Science, v.312 p428, April 2006

…throws a curve ball in interpreting the graph of data below
…we continue to learn/refine

Geochemical data to make proxy measurements of
temperature or sea level fall/rise and/or ice volume

Azolla event:
~ 49 Ma
What’s data vs. interpretation
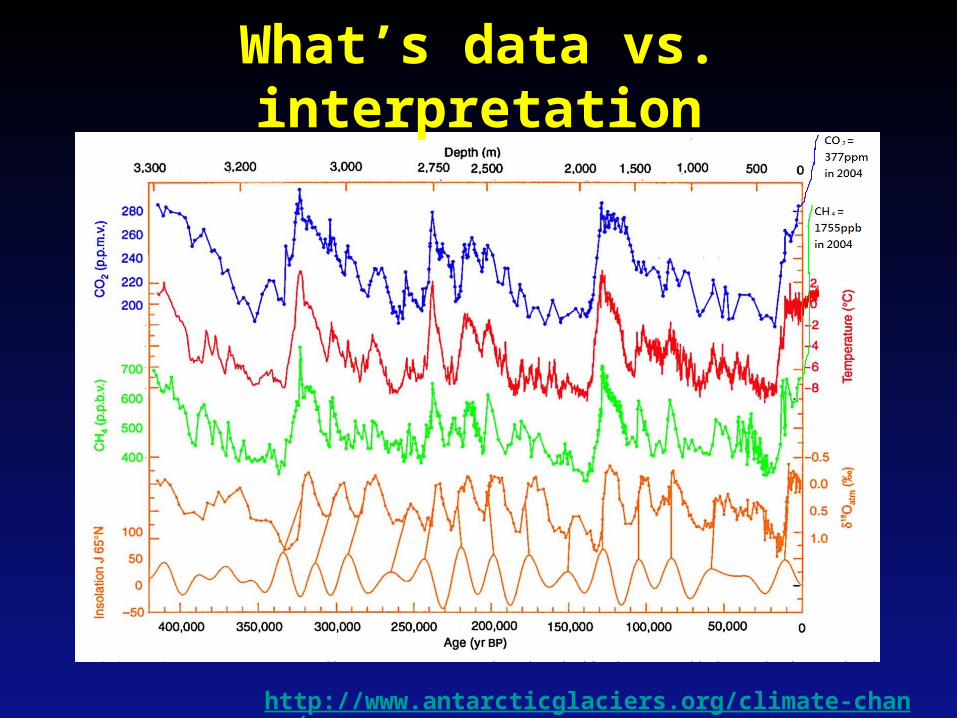
http://www.antarcticglaciers.org/climate-change/
What’s data vs. interpretation
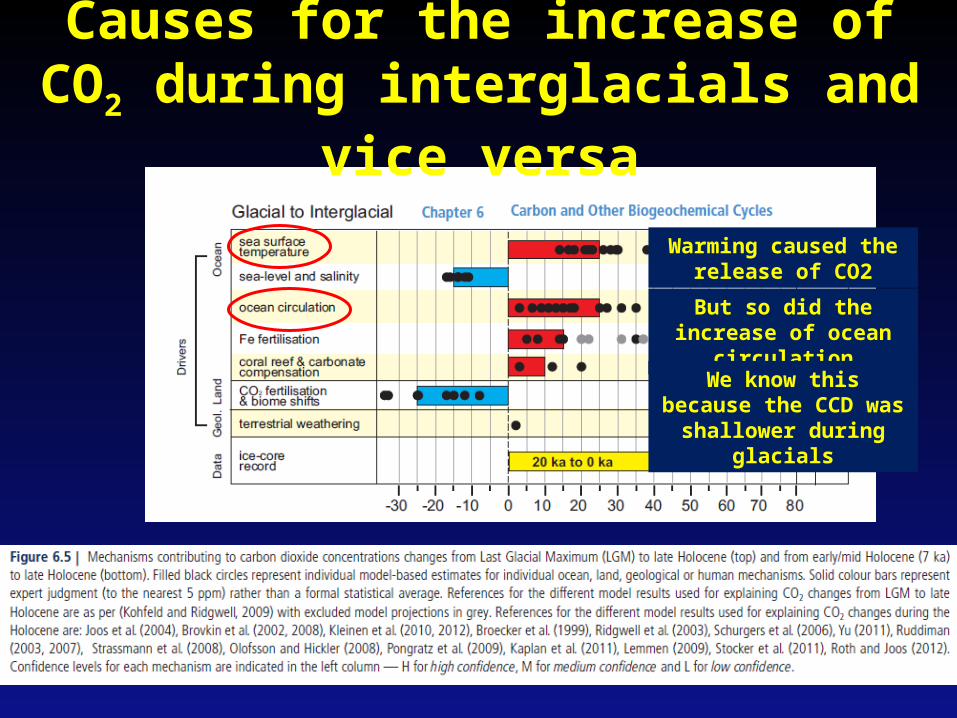
Causes for the increase of CO2 during interglacials and vice versa
Warming caused the release of CO2
But so did the increase of ocean circulation
We know this because the CCD was shallower
during glacials
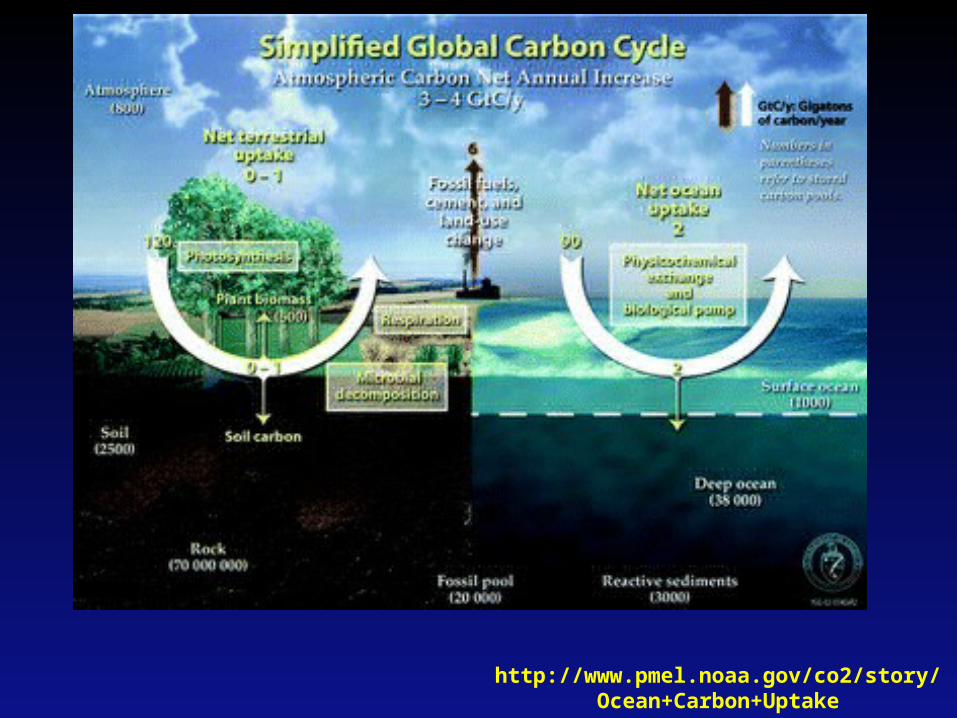
http://www.pmel.noaa.gov/co2/story/Ocean+Carbon+Uptake


How C13 varies; PDB is the standard to compare to – it’s a Belemnite CaCO3 fossil:
Understanding this helps make better interpretations
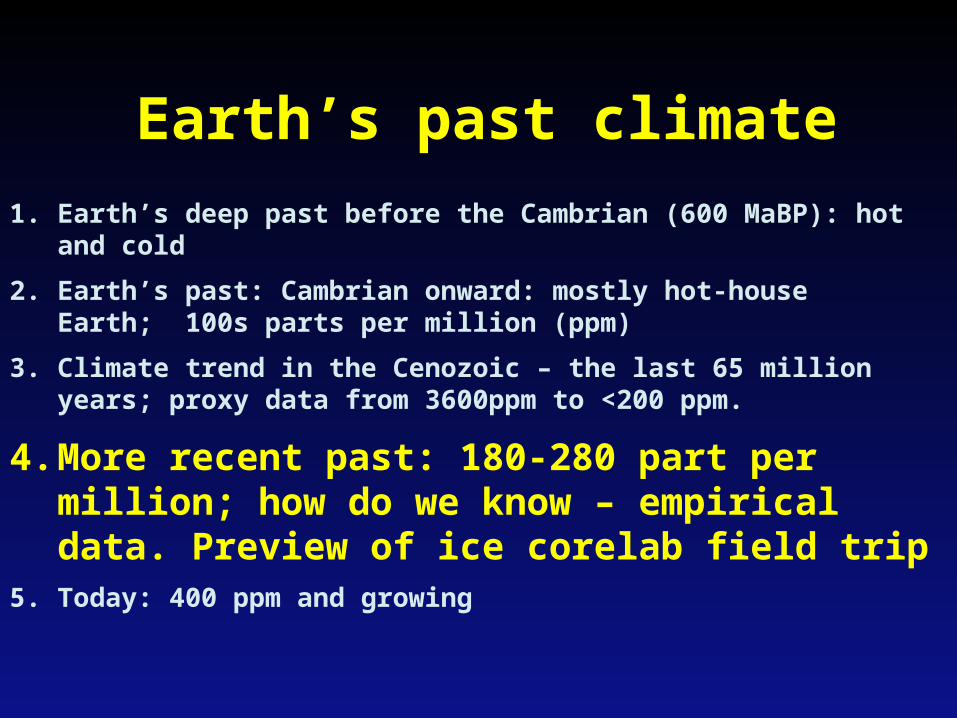
1. Earth’s deep past before the Cambrian (600 MaBP): hot and cold
2. Earth’s past: Cambrian onward: mostly hot-house Earth; 100s parts per million (ppm)
3. Climate trend in the Cenozoic – the last 65 million years; proxy data from 3600ppm to <200 ppm.
4. More recent past: 180-280 part per million; how do we know – empirical data. Preview of ice core lab field trip
5. Today: 400 ppm and growing
Earth’s past climate
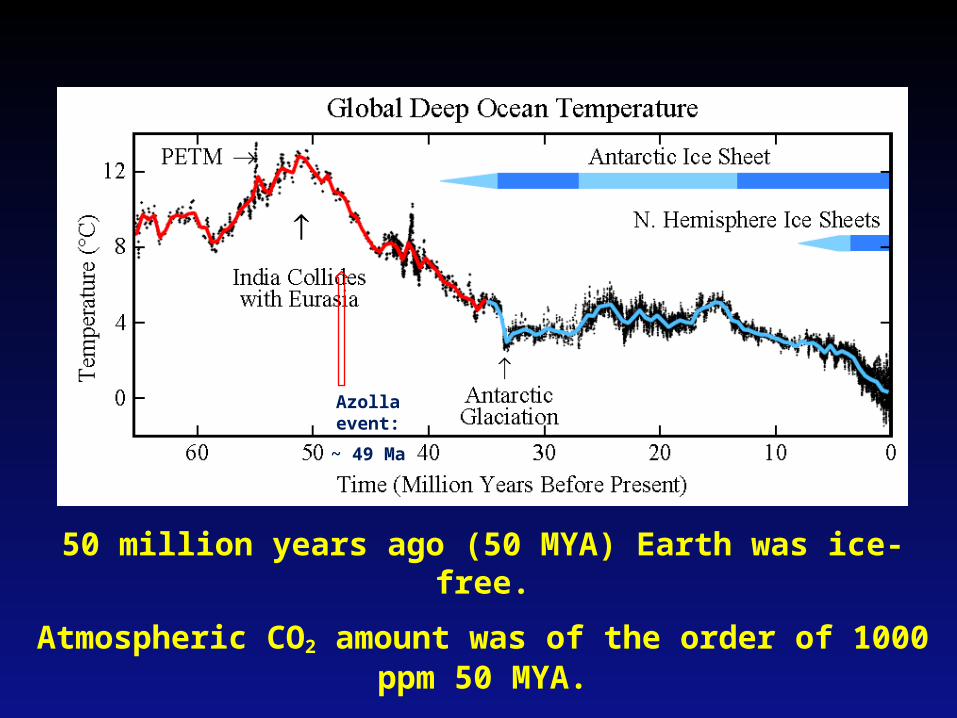
50 million years ago (50 MYA) Earth was ice-free.
Atmospheric CO2 amount was of the order of 1000 ppm 50 MYA.
Atmospheric CO2 imbalance due to plate tectonics ~ 10-4 ppm per year.
Azolla event:
~ 49 Ma

Volcanism decreased; some slowing of spreading rates = less CO2 emitted by volcanoes
Weathering/Precipitation increased:• India colliding into Asia/Himalayas
• Continents to higher latitudes: mechanical aided weathering increases chemical weathering
So – what changed?
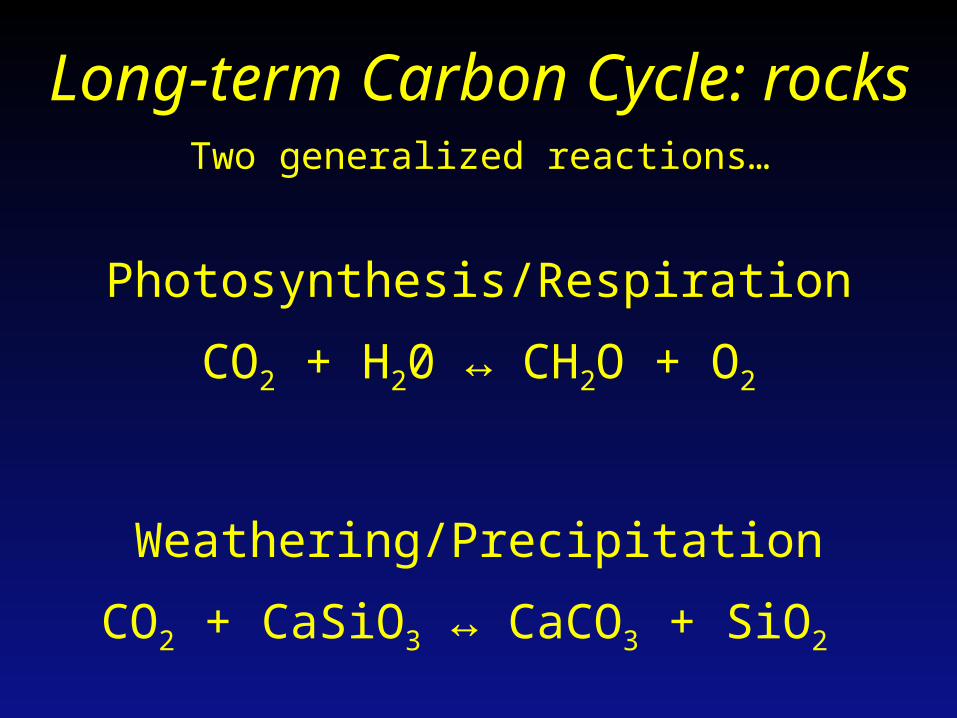
Photosynthesis/Respiration
CO2 + H20 ↔ CH2O + O2
Weathering/Precipitation
CO2 + CaSiO3 ↔ CaCO3 + SiO2
Long-term Carbon Cycle: rocksTwo generalized reactions…
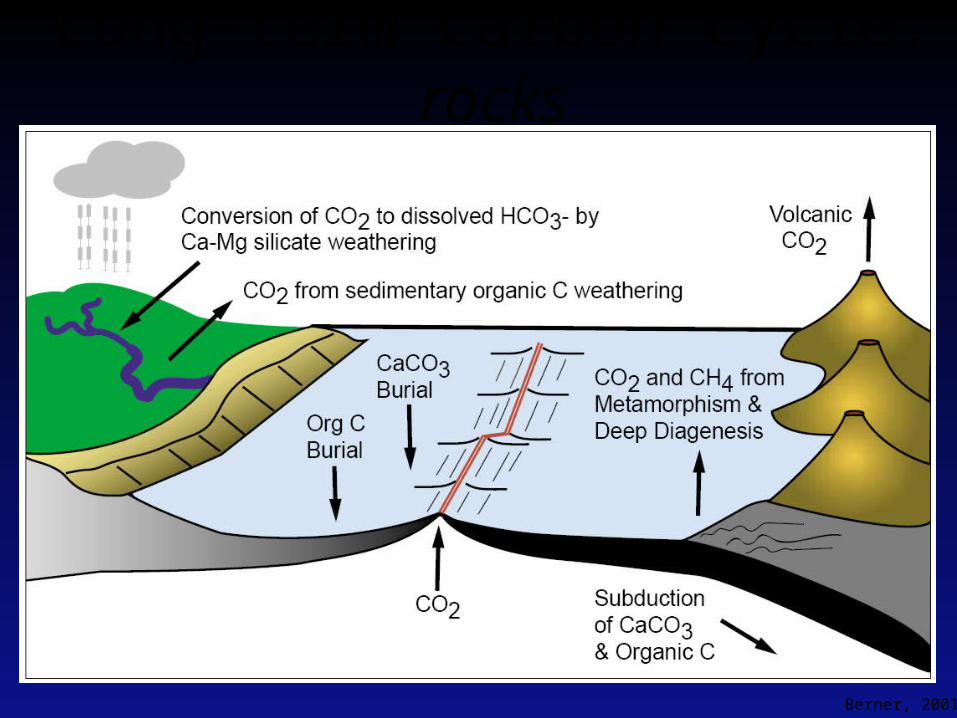
Berner, 2001
Long-term carbon cycle: rocks

J. Ormes, 2015
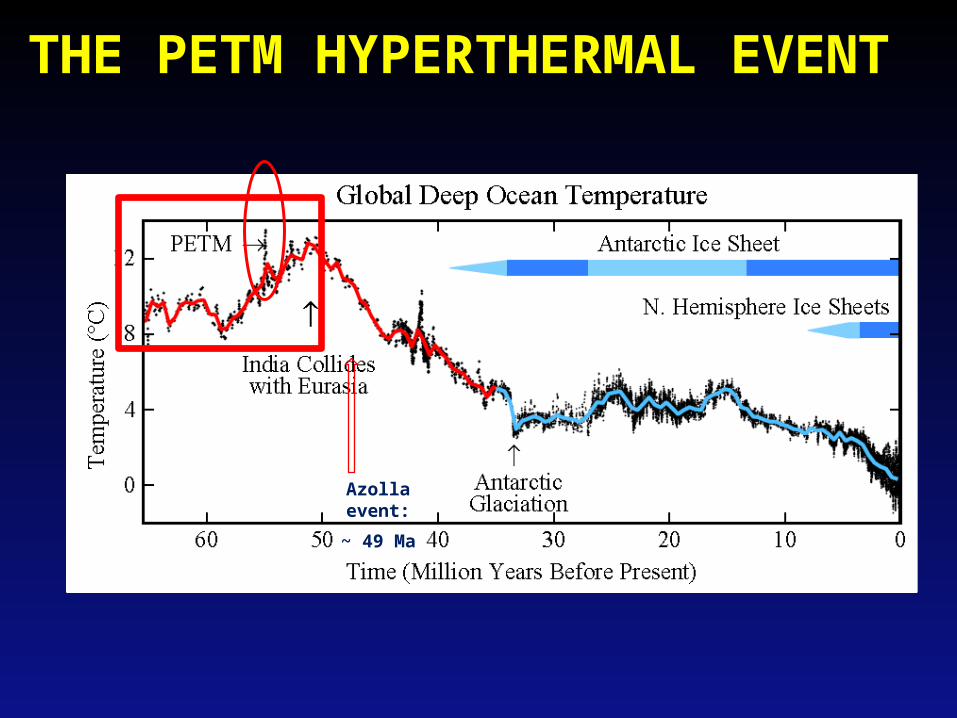
THE PETM HYPERTHERMAL EVENT
Azolla event:
~ 49 Ma

So what are these hyperthermals like the PETM?
Paleocene-Eocene Thermal Maximum
• Negative carbon isotopes
• Indicative of methane release
• Calcium compensation depth rises
• = more clay rich sediments vs. carbonates
• Ocean acidification
• Onset rapid; <20,000 years
• Recovery longer: ~100,000-200,000 years
https://en.wikipedia.org/wiki/Paleocene%E2%80%93Eocene_Thermal_Maximum


PETM - THE LAND RECORD

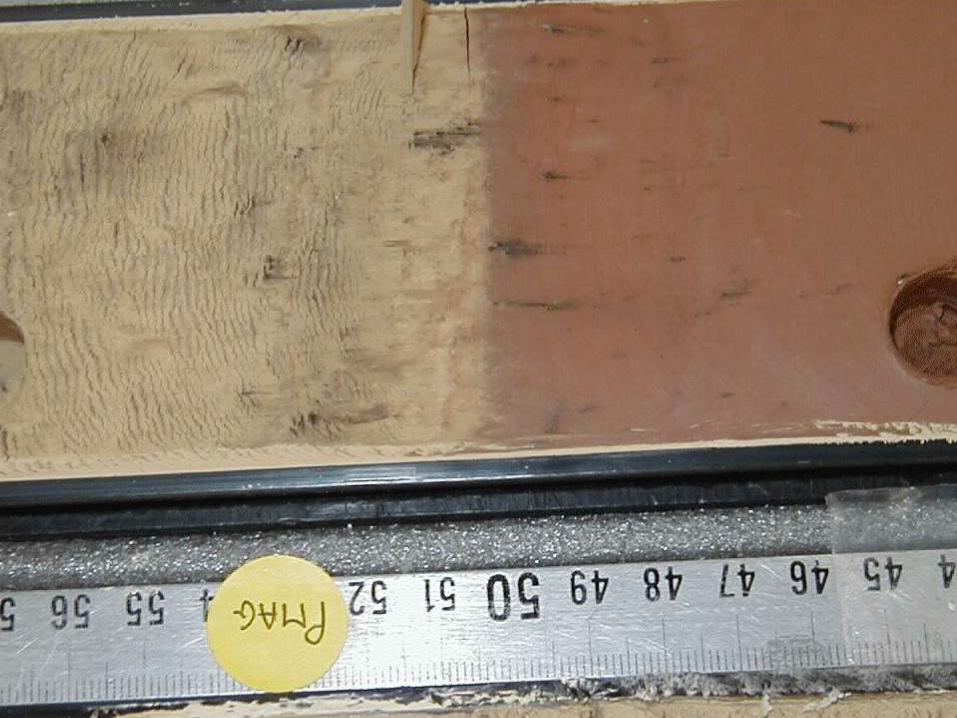
Bighorn Basin
PETM interval in fluvial deposits with excellent alluvial paleosols - seen as color bands, which are soil horizons
Found in Willwood Fm
Reds, purples due to iron oxides in B horizons

Paleosol Density
Pre-PETM
PETM
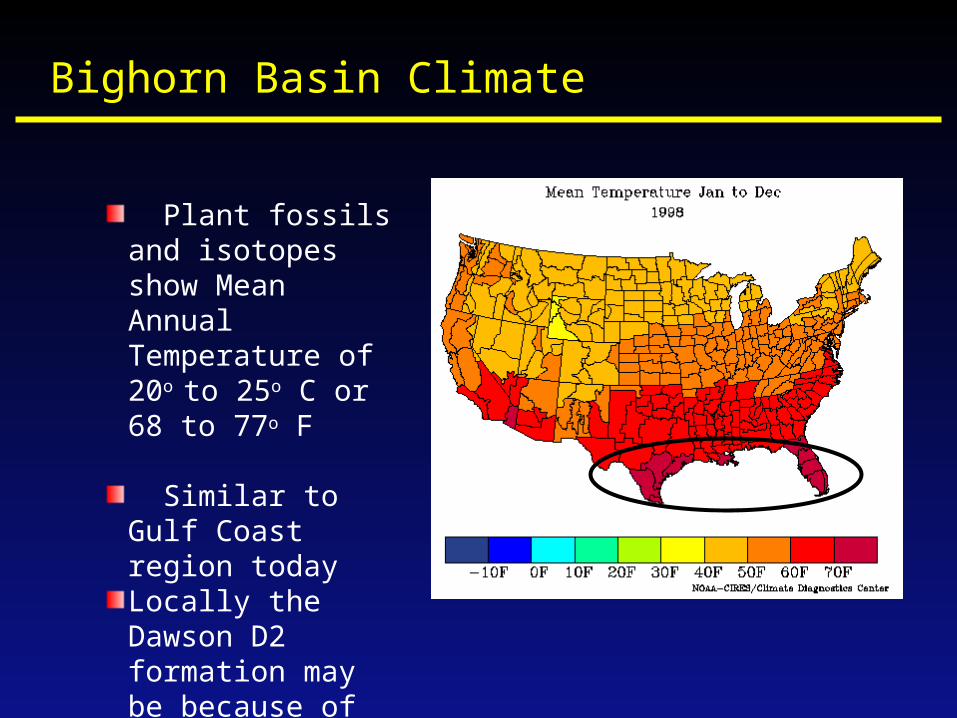
Bighorn Basin Climate
Plant fossils and isotopes show Mean Annual Temperature of 20o to 25o C or 68 to 77o F
Similar to Gulf Coast region todayLocally the Dawson D2 formation may be because of the PETM
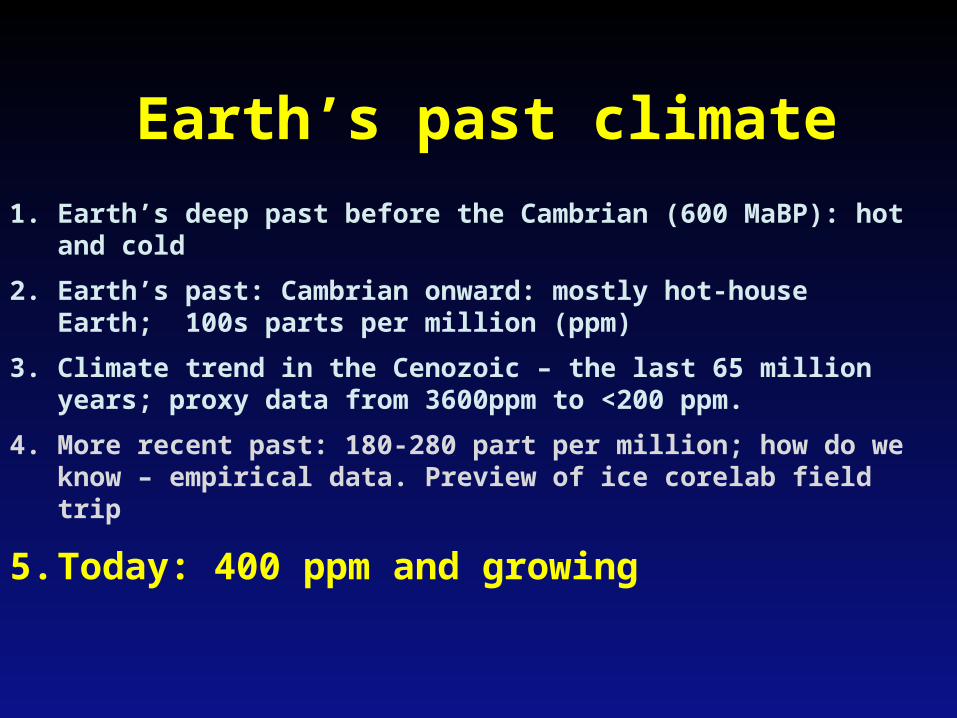
1. Earth’s deep past before the Cambrian (600 MaBP): hot and cold
2. Earth’s past: Cambrian onward: mostly hot-house Earth; 100s parts per million (ppm)
3. Climate trend in the Cenozoic – the last 65 million years; proxy data from 3600ppm to <200 ppm.
4. More recent past: 180-280 part per million; how do we know – empirical data. Preview of ice corelab field trip
5. Today: 400 ppm and growing
Earth’s past climate

Climate Changes from Ocean Sediment Cores, since 5 Ma. Milankovitch Cycles
41K 100 K
3.0Ma4.0Ma 2.0Ma 1.0Ma5.0Ma 0
When CO2 levels get below ~400-600 ppm Orbital parameters become more important than CO2
the last time inferred temperatures will have been this high – once
equilibrium is reached, will have been 3-5 million years ago or more
*we are
now about here
1. Earth’s deep past before the Cambrian (600 MaBP): hot and cold
2. Earth’s past: Cambrian onward: mostly hot-house Earth; 100s parts per million (ppm)
3. Climate trend in the Cenozoic – the last 65 million years; proxy data from 3600ppm to <200 ppm.
4. More recent past: 180-280 part per million; how do we know – empirical data. Preview of ice corelab field trip
5. Today: 400 ppm and growing
Earth’s past climate
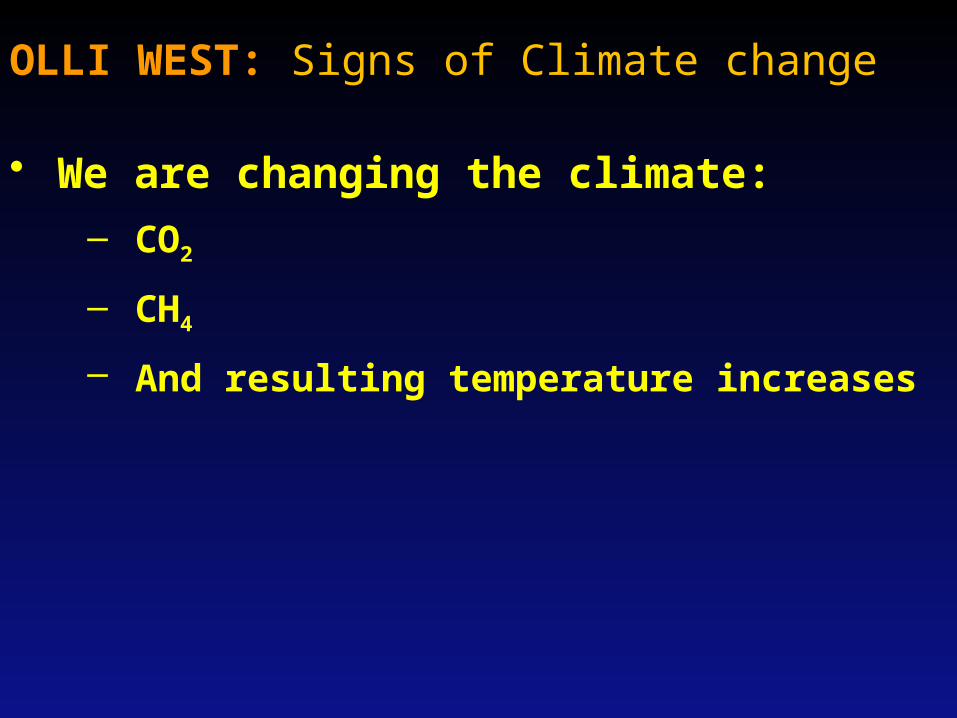
OLLI WEST: Signs of Climate change
• We are changing the climate:
– CO2
– CH4
– And resulting temperature increases

*400 ppm
http://en.wikipedia.org/wiki/Keeling_Curve
Lest we forget: CO2 is still going up

What about Methane?
http://clathrates.blogspot.com/2012/04/threat-of-methane-release-from.html
http://www.esrl.noaa.gov/gmd/aggi/aggi.html

SOURCE OF METHANE


How do we know we are causing it?
– CO2:
• Isotopically more negative Carbon (see next slide)
• Reduction of C14 in atmosphere – dead carbon
– And if you believe in the laws of Physics (see first handout and video on GHGs) then it’s the main reason along with positive feedbacks for Global warming (and ocean acidification)

The past 20 years
http://www.cmar.csiro.au/research/capegrim_graphs.html
pre-industrial value -6.4
The past 1000 years
http://www.bridge.bris.ac.uk/projects/pcmip/
experiments.html
We see the effect in corals, too.
“Evidence for ocean acidification in the Great Barrier Reef of Australia”, G. Wei et
al. 2009, Geochimica et Cosmochimica Acta, 73, 8, 15 April 2009, Pages 2332–
2346
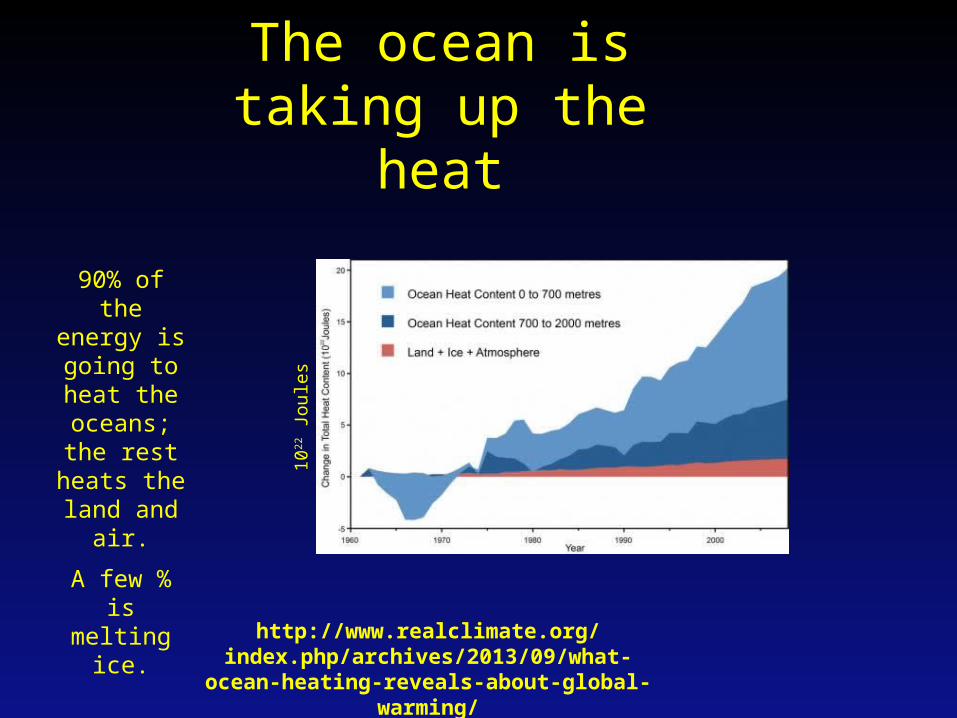
The ocean is taking up the heat
90% of the energy is going to heat the oceans; the rest
heats the land and
air.
A few % is melting
ice.
10
22 Joule
s
http://www.realclimate.org/index.php/archives/2013/09/what-ocean-heating-
reveals-about-global-warming/
OTHER EVIDENCE
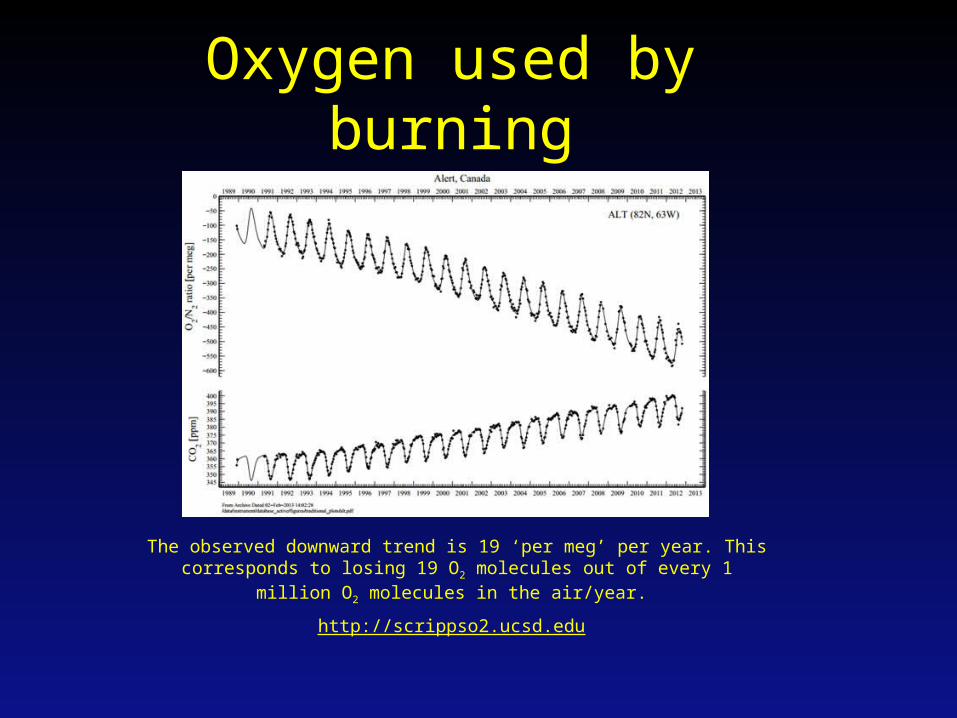
Oxygen used by burning
The observed downward trend is 19 ‘per meg’ per year. This corresponds to losing 19 O2 molecules out of every 1 million
O2 molecules in the air/year.
http://scrippso2.ucsd.edu

http://takvera.blogspot.com/2014/01/antarctic-ice-mass-accelerating.html

Energy consumption rises

2007 emissions: Population matters!China biggest emitter•14% more than US•Per capita Pop.
U.S.: 19.4 0.31Russia: 11.8 0.14E. U.: 8.6 0.50China: 5.1 1.33India: 1.8 1.14
tons Billions
Netherlands Environmental
Assessment Agency 2008
Tons of CO2 per capita
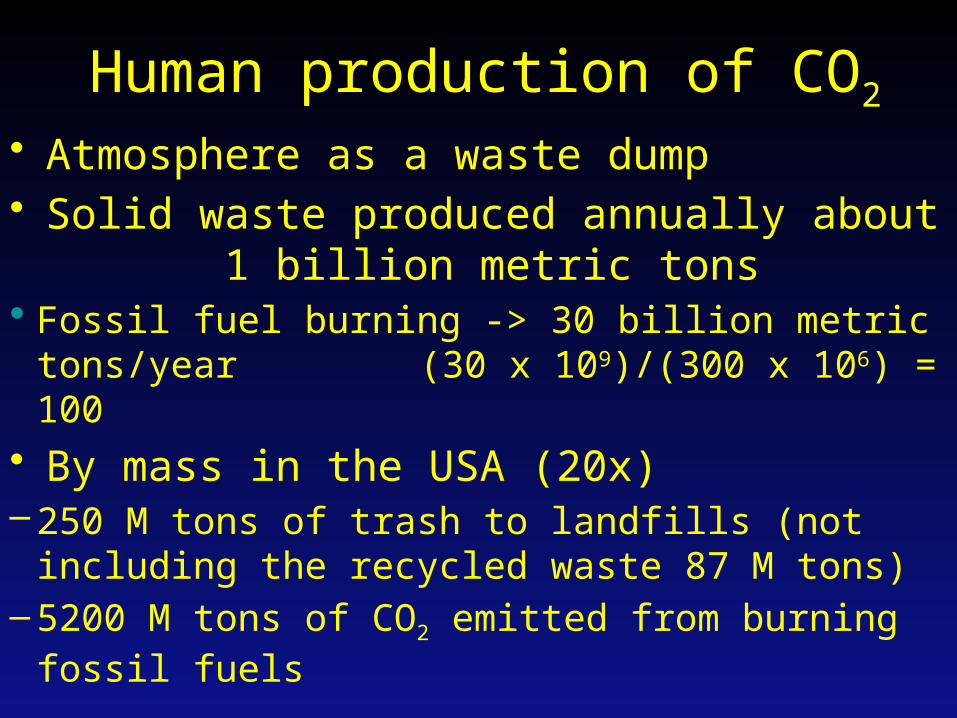
Human production of CO2
• Atmosphere as a waste dump• Solid waste produced annually about 1
billion metric tons• Fossil fuel burning -> 30 billion metric tons/year
(30 x 109)/(300 x 106) = 100• By mass in the USA (20x)– 250 M tons of trash to landfills (not including the
recycled waste 87 M tons)– 5200 M tons of CO2 emitted from burning fossil fuels
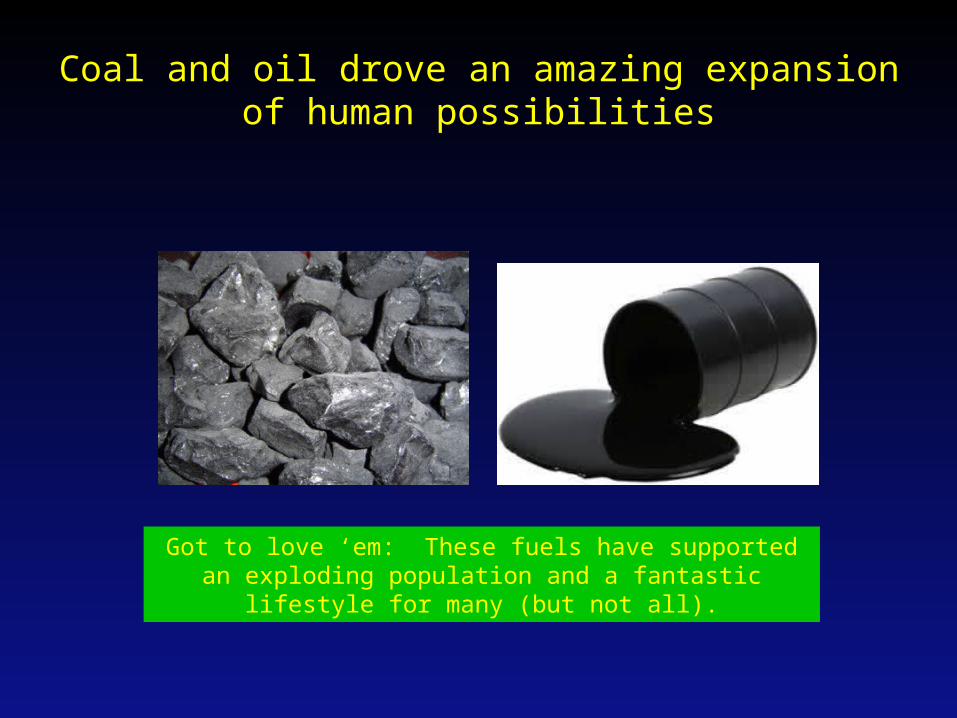
Got to love ‘em: These fuels have supported an exploding population and a fantastic lifestyle for many
(but not all).
Coal and oil drove an amazing expansion of human possibilities


Human species
0.5 billion: 1600
1 billion: 1802 202 years
2 billion: 1928 126 years
4 billion: 1974 46 years
8 billion: 2030 56 years
9 billion: 2050 20 years
20th Century growth rate was “super exponential”
until inflection point circa 1980

Ocean acidification
oCaCO3 + H2CO3 = Ca+2 + 2HCO-3 [1]
oH2CO3 is carbonic acid - a relatively weak
naturally occuring acid that forms by the reaction between water and carbon
dioxide: H2O + CO2 = H2CO3 [2]
o

http://www.pmel.noaa.gov/co2/story/Ocean+Carbon+Uptake
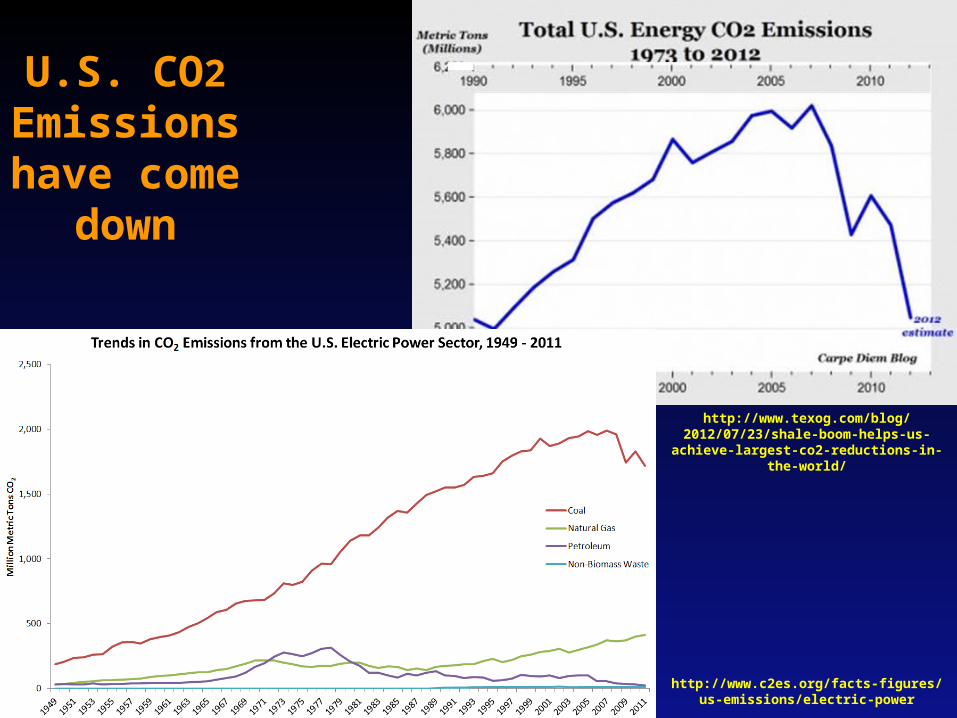
http://www.texog.com/blog/2012/07/23/shale-boom-helps-us-achieve-largest-co2-
reductions-in-the-world/
U.S. CO2 Emissions have come
down
http://www.c2es.org/facts-figures/us-emissions/electric-power

THE END
WEEK 3

EXTRA

BONUS: THE AZOLLA SEQUESTERING EVENT
– Read more at: https://en.wikipedia.org/wiki/Azolla_event
Summary: Acex coring expedition 2004
• Arctic ocean became fresh water on surface
• Fresh, salinity intolerant fern, Azolla, grew and covered the Arctic ocean
• Died off every winter and sunk to the anoxic bottom
• 800,000 years of organic matter preserved
• Sequestered 500-1000 ppm CO2?

ARCTIC EVENTS
Brinkhuis et al,, 2006
Moran et al., 2006

The Arctic Sea 50 million years ago

ACEX Azolla core
• >8 meter ACEX core with 90% Azolla
• Azolla occurs as laminated layers
• indicates Azolla deposited in situ
• bottom-water anoxia at ACEX site
Bujak, pers. Comm.

the massive decrease in
atmospheric CO2?
Bujak, pers. Comm.
UNPRECEDENTED DROP IN CO2

poor data
1200 ppm
800 ppm
600 ppm
can this be used to predict the effect of future increases in CO2 ?
Bujak, pers. Comm.
climate models indicate that full
Antarctic glaciation cannot occur
unless CO2 ppm is less than 1000 ppm

A Climate knowledge quiz:
• http://www.csmonitor.com/Environment/2014/0827/Climate-change-Is-your-opinion-informed-by-science-Take-our-quiz/Gas

IS CLIMATE CHANGE ALL DOOM AND GLOOM?
• Answer: NO! • – but YES it’s a challenge
and as humans we have always been challenged: read the history books.
• That doesn’t mean we stick our heads in the sand and ignore the challenges.
• We have human ingenuity and adaptability.
• Is ignoring and doing nothing an appropriate answer.
• Is resigning oneself to abdicating addressing the issue merely a way of dismissing and saying there’s nothing we can do.
• There are a lot of smart people working to meet those challenges – let me cite 2 that might be “game changers“.
• More at: http://denverclimatestudygroup.com/


