EXECUTIVE COMMITTEE CHAIR- MARILYN HOPPEN, SVP Human Resources, Kitsap Bank VICE CHAIR, ASCHLEE DRESCHER, Human Resources The Veterans Administration JESSICA BARR, Regional Director Washington State Employment Security Dept. MONICA BLACKWOOD, President WestSound Workforce CHUCK MOE, Field Representative Laborers Local 252 CORDI FITZPATRICK, Human Resources Mgr. Port Townsend Paper Corporation COUNCIL MEMBERS DR. KAREEN BORDERS, Executive Director West Sound STEM Network NICOLE BRICKMAN, HR Manager Skookum Contract Services DR. MARTY CAVALLUZZI, President Olympic College NICHOLAS GIANACAKOS, General Manager General Dynamics LISA DONLON, General Manager Windermere Commercial GREG DRONKERT, President Pacific Mobility Group, Inc. KEVIN GALLACCI, General Systems Manager Clallam Transit Systems (Ex Officio) MICHELL GRAFF, Kitsap Community Resources Employment & Training Division Director RUSTY GRABLE, Business Representative /Organizer, International Assoc. of Machinists and Aerospace Workers SARA HATFIELD, CTE Director South Kitsap School District (Ex Officio) NEAL HOLM, IBEW Local 46 Electrician and membership Development ASHELEY JACKSON Data Analysis Specialist, USN PETER JOHNSON, Human Resourced Director McKinley Paper Corporation HEIDI LAMPRECHT, Co-Founder Paella House GINA LINDAL, Administrator CSO, DSHS GREG LYNCH, Superintendent Olympic Edu. Service Dist. #114 COLLEEN MCALEER, Director Clallam Economic Development Corp. GILLIAN NIUMAN, Human Resources Town and Country Markets ANNA REYES POTTS, General Manager TMF Inc. LEANNE RAINES, Supervisor Dept. of Vocational Rehabilitation JEFF RANDAL, Board of Commissioners Jefferson County Public Utility District DR. LUKE ROBINS, PhD, President Peninsula College MORGAN SNELL, Jamestown S’Klallam Tribe Higher Education and Professional Development Coordinator DANNY STEIGER, CEO Angles Mill Works and Lumber Traders COUNCIL MEETING Tuesday, Sept 14, 2021 10:00 a.m. – 12:30 p.m. Via Zoom https://zoom.us/j/94868877351 Committee Meetings 9:00 a.m. to 9:50 a.m. Online – see packets attached for login A G E N D A Action Items • Call to Order – 10:00 a.m. and Welcome • Approval of Agenda • Approval of Meeting Minutes from May 11, 2021 (Att. 3.a) pg. 2 • Budget Affirmation and move to Olympic Consortium Board Discussion Items 5. Mr. David McMahon Appreciation 6. New Members – Welcome Mr. Rusty Grable 7. Peninsula College Update – Mr. Brian Kneidl 8. Olympic College – New Program (Att. 8.a) pg. 5 9. Puget Sound Energy – Ms. Melissa Troy (Att. 9.a) pg. 6 Break 10. Executive Committee Minutes (Att. 10.a) pg. 48 11. Operations Packet (Att. 11. a-f) pg. 51 12. Business and Economic Development Packet (Att. 12.a-b) pg. 69 13. Youth Packet (Att. 13.a-b) pg. 72 14. Calendar (Att. 14.a) pg. 75 15. Adjourn Next Meeting: November 9, 2021 – Via Zoom Olympic Workforce Development Council Data and information in this packet are sujbect to revision. 1/75
Transcript
EXECUTIVE COMMITTEE
CHAIR- MARILYN HOPPEN, SVP Human Resources, Kitsap Bank
VICE CHAIR, ASCHLEE DRESCHER, Human Resources The Veterans Administration
JESSICA BARR, Regional Director Washington State Employment Security Dept.
MONICA BLACKWOOD, President WestSound Workforce
CHUCK MOE, Field Representative Laborers Local 252
CORDI FITZPATRICK, Human Resources Mgr. Port Townsend Paper Corporation
COUNCIL MEMBERS
DR. KAREEN BORDERS, Executive Director West Sound STEM Network
Committee Meetings 9:00 a.m. to 9:50 a.m. Online – see packets attached for login
A G E N D A Action Items
• Call to Order – 10:00 a.m. and Welcome• Approval of Agenda• Approval of Meeting Minutes from May 11, 2021 (Att. 3.a) pg. 2• Budget Affirmation and move to Olympic Consortium Board
Discussion Items
5. Mr. David McMahon Appreciation6. New Members – Welcome Mr. Rusty Grable7. Peninsula College Update – Mr. Brian Kneidl8. Olympic College – New Program (Att. 8.a) pg. 59. Puget Sound Energy – Ms. Melissa Troy (Att. 9.a) pg. 6
OLYMPIC WORKFORCE DEVELOPMENT COUNCIL (OWDC) MINUTES
May 11, 2021
1. CALL TO ORDER
The Olympic Workforce Development Council (OWDC) meeting was held via Zoom on May 11, 2021. Marilyn Hoppen, Chair, called the meeting to order at 10:00 a.m.
2. APPROVAL OF AGENDA
Motion: Ashlee Dresher moved to approve the agenda as presented. Anna Whinny seconded the motion. Motion carried unanimously.
3. MINUTES February 9, 2021
Motion: Jessica Barr moved to approve the minutes as corrected. Michelle Graff seconded the motion. Motion carried unanimously.
DISCUSSION ITEMS
4. Budget Review, Cognito Form and 2022 Budget: Elizabeth explained the change inprocess for federal monitoring, as it relates to private vs. public sector. Kitsap requiresthe commissioners approve the budget, this will not change. New process for next yearrequires the council be included in the review. This will happen through a Cognito formsubmission, sent to all voting council members to review 19131 and 19132 budget andaffirm.
5. Executive Committee Minutes (attachment 5.a): Review by the council, questions andcomments directed to Elizabeth.
6. Operations Packet (attachment 6.a.): Reviewed by the council, questions andcomments directed to Elizabeth.
7. Business and Economics Development Packet (attachment 7.a.): Review by thecouncil, questions and comments directed to Elizabeth.
8. Youth Packet (attachment 7.a.): Review by the council, questions and commentsdirected to Elizabeth.
9. New Members Welcome: Dr. Kareen Boarders, West Sound Stem Network
10. New At-Large Members Welcome: Mr. Seth White, JATC PSNS and Rusty Grable,Machinist Aerospace
11. Dept. of Services for the Blind: Selena Cunningham presentation tabled
12. Puget Sound Regional Council Presentation with Dr. Charles Patton, EquityManager:
a. Gave an overview of Vision 2050 Regional Equity Strategy from the EconomicDevelopment District Board
Attachment 3.a 2/75
b. History covered: Environmental Justice and Growing Transit Communities with80 urban areas and 2 mill. people
oReview planning, growth, economy and transportationo Sustainable developmentoRegional Policy directionoNeeds of people of color with targeted outreach to underrepresented
communitiesc. Opportunity mapping: Targeted strategies that reduce barriers for those with less
access, education, opportunities, and various other factors that predict lifeoutcomes. With goals to give all people access to resources that will aid them inreaching their full potential
d. Deeper understanding: analyze policy, skills and tools to reduce inequities,explicit bias and structural racism
e. Equitable Outcomes: Data should be used to understand and respond to thesegroups. This means incorporating a public facing website so the community canhave a voice and hold agencies accountable.
f. Authentic engagement is imperative: Meet the community where they are,translated material in 9 languages, social media
g. Ad-Hoc committee: created with four counties of Snohomish, Pierce, Kitsap, King
13. Puget Sound Energy with Matthew Mauer:a. Discussed the commitment to carbon emissions reduction for electric and gas
operations.b. Local energy provider for 150 yearsc. Climate change cannot be ignoredd. Aspire to slow climate change, be carbon neutral by 2030 and be carbon free by
2045e. CACAP 2.0 assistance for income qualified customers starting in April
14. Office of the Superintendent of Public Instruction with Dr. Timmy Forster:a. Athletic agencies to facilitate change with social justice issuesb. Address potential biases and assumptions with transparency and full disclosurec. Audience study with state agencies, educational groups interfacing with students,
and mored. Action steps, innovative collaboration with sports organizations and state, identify
and increase formalization strategies, strengthen relationships, address socialjustice intentionally
e. Findings, race relations matter, barriers of systematic politics
15. Youth Committee Report: Jeff Allen, Employment Security Departmenta. Hybrid schooling is in place, with some students back physically in school
buildingsb. What we learned, last 12 monthsc. Mental health
3/75
16. Calendar
17. Good of the Order a. Employment Security Department: Recognition letter
NEXT MEETING
The next council meeting is scheduled for September 14, 2021.
ADJOURNMENT
There being no further business to come before the Council, the meeting was adjourned at 11:30 a.m.
4/75
Olympic College is an equal opportunity institution. Information about our nondiscrimination policies is available at: olympic.edu/nondiscrimination-title-ix, 360-792-6050, 1600 Chester Ave., Bremerton, WA 98337-1699. Employment data from: CareerOneStop.org
Classes will be in-person and online. Instruction will be at OC and Avian Flight School.
The Bachelor program also allows students who were too young to test for the FAA Aircraft Dispatchers Certificate to qualify for testing.
Classes Begin Fall 2021. Get Started Today!
Interested in Aviation?Launch your Associate of Applied Science Degree,
Airline Dispatch Pathway!Become an Airport Manager or Airport Operations Coordinator
Entry to mid-level earnings range from $22.99 to $28.63 an hour!
The Aviation Tech AAS - Airline Dispatch Program will prepare you for a career in Aviation. Added bonus: Earn your Commercial Pilot AAS by completing one additional course!
This Associate degree leads directly into the Green River CollegeBAS – Aeronautical Science partnership program.
Attachment 8.a 5/75
Jan. 2019
Environmental, social and governance (ESG) report
ESG strategy and vision
Attachment 9.a 6/75
2 Environmental, social and governance (ESG) report Jan. 2019
Company profile and business operations .................................................................................................. 5Table 1: Company overview .....................................................................................................................................................................5
Core business operations ..........................................................................................................................................................................6
Energy supply ...........................................................................................................................................................................................6
Table 2: Company controlled energy resources and production .............................................................................................................6
Electric supply ........................................................................................................................................................................................7
Natural gas supply ..................................................................................................................................................................................7
Natural gas storage ..................................................................................................................................................................................8
Our ethics: doing the right thing .............................................................................................................................................................9
Corporate compliance program ............................................................................................................................................................10
Compliance Council ..............................................................................................................................................................................10
Enterprise risk management and business continuity ........................................................................................................................... 11
Lobbying and political contributions ......................................................................................................................................................12
Environmental .............................................................................................................................................. 13Creating a better energy future ..............................................................................................................................................................13
PSE carbon reduction goal ....................................................................................................................................................................14
Greenhouse gas (GHG) policy and emissions reporting ........................................................................................................................14
Table 5: 2017 Greenhouse Gas Inventory ..............................................................................................................................................15
Table 6: Total emissions reductions from conservation programs ........................................................................................................15
Clean Energy .............................................................................................................................................................................................16
Wind power ............................................................................................................................................................................................16
Solar power ............................................................................................................................................................................................16
Clean energy customer programs.......................................................................................................................................................... 17
Table 7: Clean energy customer programs at PSE ................................................................................................................................ 17
Energy efficiency .......................................................................................................................................................................................18
Business energy management programs ..............................................................................................................................................18
Table 8: business energy management programs ................................................................................................................................18
Residential energy management programs ...........................................................................................................................................19
Table 9: PSE residential energy management programs .......................................................................................................................19
Electric vehicles (EVs) .............................................................................................................................................................................20
PSE fleet .................................................................................................................................................................................................21
Compressed natural gas (CNG) vehicles ...............................................................................................................................................21
Liquefied natural gas (LNG) vessels .......................................................................................................................................................21
Air program ............................................................................................................................................................................................23
Waste management program ...............................................................................................................................................................23
Water .....................................................................................................................................................................................................23
Spill prevention and response ................................................................................................................................................................24
Environmental audit program .................................................................................................................................................................24
Biodiversity and habitat protection programs ......................................................................................................................................25
Protecting fish .........................................................................................................................................................................................25
Baker and Skagit Rivers.....................................................................................................................................................................25
Wildlife and habitat protection ...............................................................................................................................................................26
Central Washington shrub-steppe ....................................................................................................................................................26
The White River ..................................................................................................................................................................................27
North Cascades habitat ....................................................................................................................................................................27
Wetland and waterways mitigation ....................................................................................................................................................29
Cultural resources .............................................................................................................................................................................29
Social ............................................................................................................................................................30Health and safety ......................................................................................................................................................................................30
Employee safety program ......................................................................................................................................................................31
Contractor safety program .....................................................................................................................................................................31
Public safety ..............................................................................................................................................................................................31
Public safety programs ...........................................................................................................................................................................32
Electric safety ........................................................................................................................................................................................32
Natural gas safety ..................................................................................................................................................................................32
Energy resource planning: assurance and reliability ..............................................................................................................................33
Energy resource need considerations ...................................................................................................................................................33
Reliability and resiliency ..........................................................................................................................................................................34
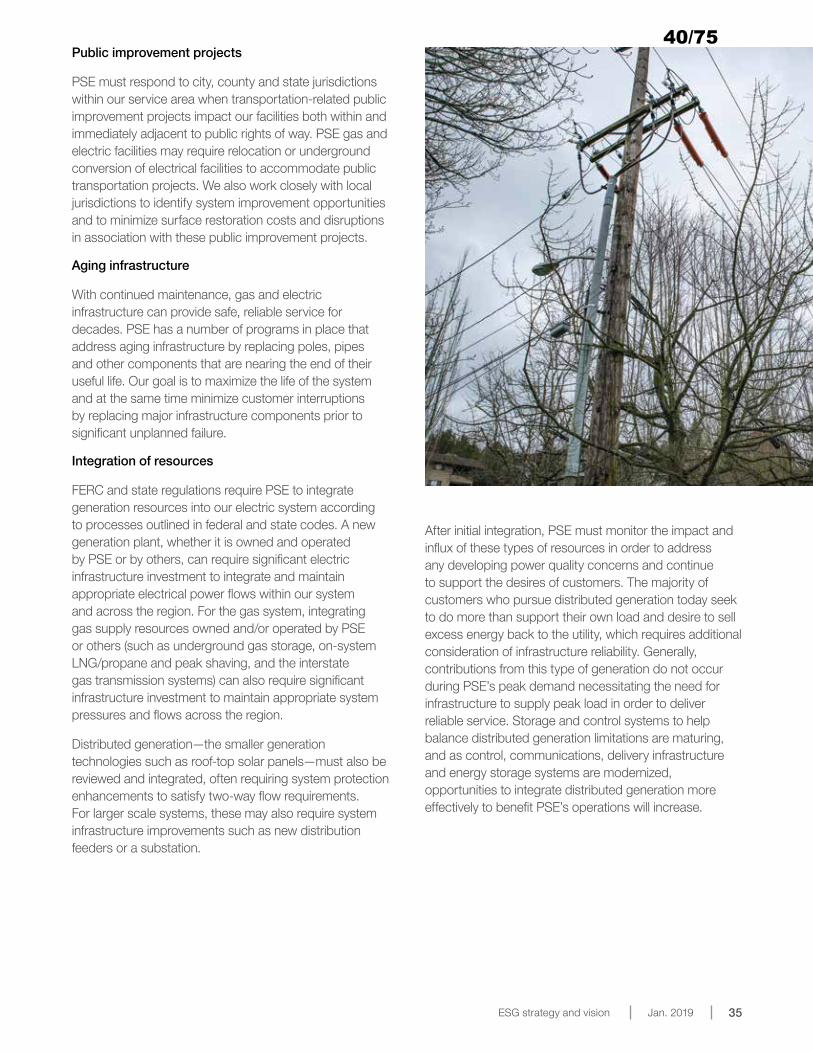
Public improvement projects ..................................................................................................................................................................35
Integration of resources ..........................................................................................................................................................................35
2017 Integrated Resource Plan (IRP) ......................................................................................................................................................36
Emergence of solar power ....................................................................................................................................................................36
Energy storage and demand response instead of fossil fuel generation ..............................................................................................36
Redirecting transmission to increase market access ...........................................................................................................................36
Energy efficiency ...................................................................................................................................................................................36
Natural gas utility resource plan .............................................................................................................................................................36
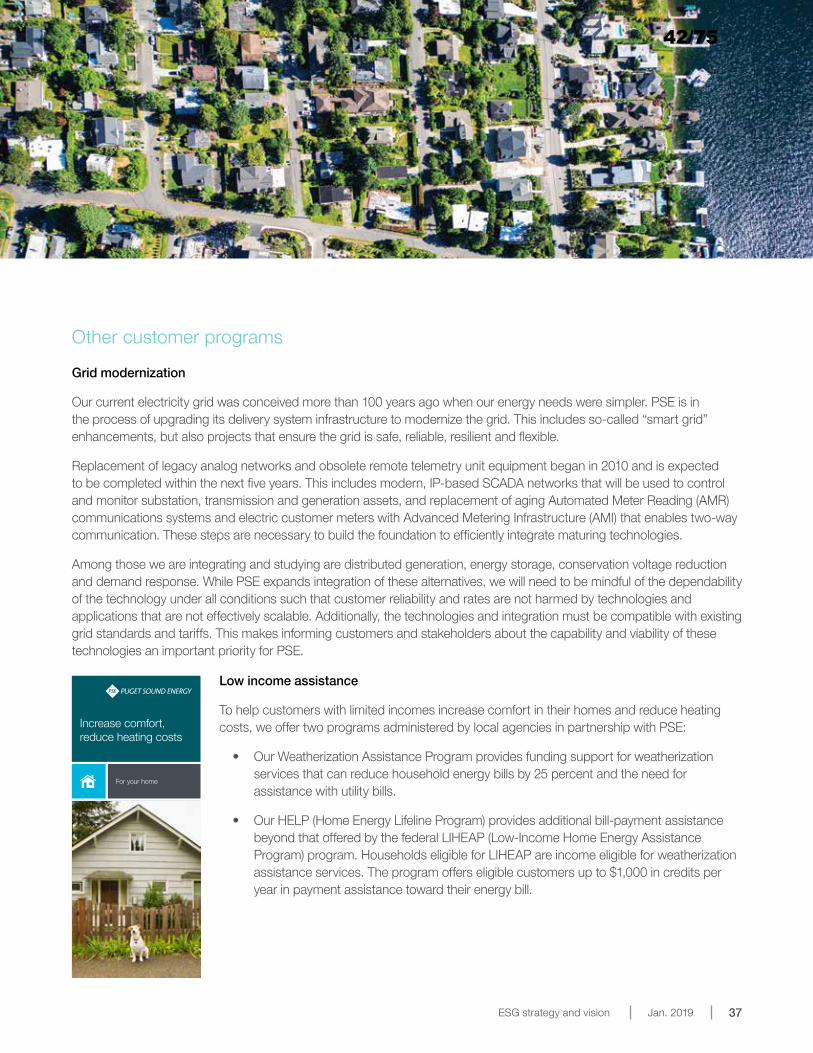
Other customer programs ........................................................................................................................................................................37
Low income assistance .........................................................................................................................................................................37
Tours and recreation ...............................................................................................................................................................................38
Employee wellness program ..................................................................................................................................................................39
Professional development and tuition reimbursement ..........................................................................................................................39
Military and veteran support ..................................................................................................................................................................39
Customer and community outreach ......................................................................................................................................................39
Community outreach .............................................................................................................................................................................40
Major projects outreach .........................................................................................................................................................................40
Volunteering, community service and corporate giving ........................................................................................................................40
PSE Foundation ..................................................................................................................................................................................... 41
4 Environmental, social and governance (ESG) report Jan. 2019
PSE ESG overview
Executive summary
From Kimberly Harris and Steve Secrist
For 145 years, Puget Sound Energy (PSE) has provided customers and communities across Washington state with the energy to do great things. Today, we proudly serve more than 1.5 million customers.
We are more than just their local energy provider, though. This is our home, too, as it is for our 3,100-plus employees who live and work in the 10 counties we serve. We’re part of the fabric of these communities and are deeply committed to their future. As such, our company values specifically point to the impact of our actions. One of the three core values of our organization is, “We do what’s right and we seek the best outcomes for our customers and community”.
Doing the right thing drives our approach to environmental, social and governance (ESG) issues. It’s embedded into the four guiding principles for our ESG strategy and vision, which calls for us to transform and grow our business by:
1. Implementing innovative customer solutions
2. Advancing clean energy
3. Building a smarter, stronger power grid
4. Strengthening our communities
These guiding principles shape our long–term actions as well as our day-to-day activities. They’re incorporated into our business planning, our processes and our policies.
The following paper provides a comprehensive overview of our ESG efforts. It’s also a work in progress, as we continue to identify ways we can improve and do even more. We believe in a better energy future for all who are so fortunate to live here in Washington state, and we’re committed to making that vision a reality.
Sincerely,
President & CEO General Counsel, Chief Ethics & Compliance Officer
9/75
ESG strategy and vision 5Jan. 2019
Company profile and business operationsPSE is an investor-owned utility company headquartered in Bellevue, WA. Its parent company, Puget Energy, is owned through a holding company structure by Puget Holdings under the ownership of a consortium of long-term infrastructure investors.
We are a regulated utility under the Federal Energy Regulatory Commission (FERC), Washington Utilities and Transportation Commission (UTC), North American Electric Reliability Corporation (NERC), and Western Electricity Coordinating Council (WECC).
PSE is the oldest and largest electric and natural gas utility headquartered in the state of Washington with operations extending throughout the western and southern parts of the state. With a 6,000-square-mile service area stretching across 10 counties, we serve approximately 1.1 million electric customers and almost 830,000 gas customers. As of December 31, 2017, PSE had approximately 3,140 full-time equivalent employees with approximately 1,110 represented by the International Brotherhood of Electrical Workers Union (IBEW) or the United Association of Plumbers and Pipefitters (UA).
Table 1: Company overview
Resource Amount
Total Electric Customers 1,142,053
Total Natural Gas Customers 825,599
Miles of Electric Transmission lines 2,597
Miles of Electric Distribution lines 20,428
Miles of Natural Gas Mains 12,192
Miles of Natural Gas Service Lines 13,657
Total Energy Resources 4,737 MW
Total Energy Production 25,310,904 MWh
Source: 2017 10K Report. As of December 31, 2017, approximately 398,518 customers purchased both electricity and natural gas from PSE. Total Energy Resources and Total Energy Production include company- controlled and purchased resources.
10/75
6 Environmental, social and governance (ESG) report Jan. 2019
Core business operations
PSE’s core business operations include electric transmission and distribution, electric generation, natural gas distribution and natural gas storage.
Energy supply
PSE operates a fleet of 14 generation facilities, including hydroelectric, thermal, and wind power. We are a part owner of a coal plant in Colstrip, Montana which is operated by another company. We also co-own and operate the Pacific Northwest’s largest natural gas storage depot, the Jackson Prairie Underground Natural Gas Storage Facility in Lewis County, the 14th largest gas-storage reserve in the country. As of December 31, 2017, our aggregate generating capacity was 4,737 MW from company owned (3,614 MW) and purchased (1,123 MW) resources.
PSE purchases natural gas for customer use and to meet portfolio demands for its combustion turbine generators. Our natural gas system consists of over 25,000 miles of gas mains and service lines that extend through six counties.
Table 2: Company controlled energy resources and production
Electric Generation Resources (Company–Controlled)
Number of Plants Resources MaximumCapacity (MW)
Energy Production (MW)
Coal 2 677 MW* 4,463,705 MWh*
Natural Gas 10 1,908 MW** 3,822,462 MWh**
Wind 3 773 MW 1,674,790 MWh
Hydroelectric 3 254 MW 864,821 MWh
Other 1 2 MW 746.5 MWh***
Total (Company Controlled) 20 3,614 MW 10,825,778
Source: 2017 Annual 10K Report*Amounts are totals from Colstrip, which PSE has 50% interest in Units a 1 & 2 and 25% interest in Units 3 & 4.**Amount includes Frederickson Unit 1, which PSE has 49.85% interest.***Estimated amount.
11/75
ESG strategy and vision 7Jan. 2019
Electric supply
PSE is the largest energy utility in the state, providing electric power to more than 1.1 million customers.
We currently own more than 3,600 megawatts of power-generating capacity. We purchase the rest of our power supply under long-term firm purchased power contracts with other utilities and marketers in the western energy market. In 2017, 52.3 percent of electricity delivered to PSE customers was generated by the company, while 47.9 percent of electricity was purchased via firm contracts (35.6 percent) and non-firm contracts, such as the spot market (12.1 percent).
Our diversified mix
The electricity we provide our customers uses a number of different resources. Although water supply fluctuates year to year, hydroelectric power accounts for approximately a third of our power portfolio. Wind power is a very important and increasingly prominent resource for PSE. Together, our three large wind farms located in central and eastern Washington produce enough electricity, on average, to power nearly 200,000 homes, making us the third-largest utility generator of wind power in the U.S.
Every year, PSE reports to the Washington State Department of Commerce the types and amount of energy that was delivered to our customers in the previous year. The estimated fuel mix assigned to PSE in 2017 is detailed in table 3.
Table 3: Utility fuel mix
Fuel Percent MWh from Claims on Resources
Total MWh from Market Purchaes
Total MWh
Biogas 0.00% 0 0 0
Biomass 0.44% 0 99,153 99,153
Coal 37.58% 7,645,766 784,539 8,430,305
Geothermal 0.00% 0 0 0
Hydro 33.49% 4,912,099 2,600,698 7,512,797
Natural Gas 21.27% 3,753,271 1,018,769 4,772,039
Nuclear 0. 73% 49,044 115,313 164,357
Other Biogenic 0.00% 6 0 6
Other Non-Biogenic 0.24% 0 53,517 53,517
Petroleum 0.20% 11,946 33,911 45,857
Solar 0.00% 879 0 879
Waste 0.00% 0 0 0
Wind 6.05% 1,356,385 0 1,356,385
Total 100% 17,729,396 4,705,899 22,435,295
Natural gas supply
Before Washington was even a state, in 1873, PSE’s earliest predecessor introduced Washington Territory to manufactured gas lighting.
Today, PSE operates the state’s largest natural-gas distribution system, serving nearly 830,000 natural gas customers over six counties. We purchase 100 percent of the natural-gas supplies needed to serve our customers. In 2018, nearly 75 percent of our purchased gas for electric power generation and natural gas distribution was obtained from producers and marketers in British Columbia and Alberta, and the rest comes from Rocky Mountain States. All the gas we acquire is transported into our service area through large interstate pipelines owned and operated by an interstate natural gas transmission company. Once we take possession of the gas intended for direct use by customers, it is distributed to our customers through more than 25,000 miles of PSE-owned gas mains and service lines.
We manage a strategically diversified gas-supply portfolio to reduce financial risks. To obtain gas at the most favorable price, we carefully analyze gas-market trends and conditions, then procure gas under a mix of short-, medium- and long-term contracts. The combined price we pay for natural gas under these contracts is passed along to customers at cost, with no mark-up or profit for PSE.
12/75
8 Environmental, social and governance (ESG) report Jan. 2019
Natural gas storage
While all the natural gas used by PSE originates from western Canada or the Rocky Mountain area, PSE, along with other Northwest utilities, delivers a significant share of their natural gas supply—mainly in winter (high demand periods)—from storage. By using storage, PSE and other utilities can buy and store significant amounts of natural gas during the lower-priced summer months, and then tap the reserves in winter when customers’ natural gas requirements—and wholesale natural gas prices—are highest.
PSE operates and maintains one-third ownership in the Jackson Prairie underground natural gas reservoir located in Chehalis, Washington. In operation since 1970, Jackson Prairie’s natural gas reserves can meet up to 25 percent of the Pacific Northwest’s peak demand on our coldest winter days. PSE also stores up to 12.9 billion cubic feet of natural gas in Questar’s Clay Basin underground facility in northeast Utah.
PSE operates a small liquefied natural gas (LNG) storage facility in Gig Harbor, Washington, and is developing a larger LNG facility at the Port of Tacoma. Similar to storage reservoirs, the Tacoma LNG facility will receive natural gas during low demand periods, liquify it for more efficient storage, and then convert it back to a gas for use during high demand periods. This facility will be key to mitigating risk associated with the single interstate pipeline that serves customers from British Columbia down into Oregon. Our region has experienced significant growth that’s forecasted to continue. Looking at the natural gas required only by our retail customers—the homes and businesses we serve—we know that by the winter of 2020-2021, peak natural gas demand will exceed the amount the single pipeline can supply in a given period. The Tacoma LNG facility will also be important in the event of a failure on the single pipeline or an issue impacting supply on it, such as the October 2018 explosion of a transmission line in British Columbia, Canada that temporarily shut off supply.
Governance
Our corporate governance helps ensure our commitments are effectively integrated throughout the organization. At the board level, we follow stated corporate governance guidelines that include an independent and local chairperson, detailed principles, and specified committee charters. We maintain a Code of Ethics for senior financial officers that provides specific principles these officers are expected to follow and promote, including principles governing professional and ethical conduct, reporting of violations, treatment and consequences of violations, and waivers of the code. All employees are trained on ethics and corporate compliance consistent with our corporate value of doing the right thing, expected to adhere to the highest standards. We have a robust risk management framework that oversees enterprise risk as well as business continuity and environmental risk.
13/75
ESG strategy and vision 9Jan. 2019
Leadership
As of November 1, 2018, 10 directors serve on Puget Energy’s board of directors. These directors also constitute PSE’s board, along with one additional representative.
The chair of the board is an independent director who is a resident of the state of Washington and not an officer or employee of PSE or our investors. In addition to this role, we have two other independent directors who are local residents and not employed by PSE or our investors. The directors are selected in accordance with the bylaws of Puget Energy and PSE, pursuant to which the investor-owners of Puget Holdings are entitled to select individuals to serve on the boards of Puget Energy and PSE. Regular board executive sessions are held without the PSE president and CEO present.
• Puget Energy Board of Directors www.pugetenergy.com/pages/board.html
• PSE Board of Directors http://www.pugetenergy.com/pages/board.html
Board committees consist of an Audit Committee, Governance and Public Affairs Committee, Compensation and Leadership Development Committee, Business Planning Committee, Asset Management Committee, and Securities Pricing Committee.
Table 4 : Board Committee overview
Committee Key Responsibilities
Asset Management Committee Reviews the ongoing performance of Puget relative to the budget and business plan
Business Planning Committee Reviews and recommends annual five -year budget and business plan
Audit Committee Oversees compliance with financial controls and reporting, and performance of the internal and independent auditors
Compensation and Leadership Development Committee
Oversees executive compensation and succession planning
Governance and Public Affairs Committee Responsible for board governance issues
Securities Pricing Committee Approves refinancings or new debt issuances
Source: PSE Legal Dept
Our ethics: doing the right thing
Our Code of Ethics includes our corporate statement concerning the way Puget Energy and PSE conduct business and our policies are outlined in a corporate policy manual. PSE has an appointed a Senior Vice President, General Counsel and Chief Ethics Compliance Officer (CECO) who is an advisor to the board of directors and senior management.
14/75
10 Environmental, social and governance (ESG) report Jan. 2019
The foundation of this program is spelled out in our Compliance Management Framework made up of our Corporate Ethics and Compliance Code, our corporate policy manual, our Duty of Employees which is to uphold the code and related policies and laws as applicable, and the U.S. Sentencing Commission’s Federal Sentencing Guidelines (FSG) Manual Chapter Eight §8B2.1, with a fundamental purpose to:
1. Document and uphold the company’s values, mission statement, and Corporate Ethics and Compliance Code;
2. Detect and deter conduct not in keeping with these principles;
3. Comply fully with applicable federal, state, and local laws and regulations governing our industry and our business; and
4. Help ensure that we act ethically with a high level of integrity.
Corporate compliance program
Our Corporate Compliance program infuses compliance across the organization through partnering, appropriate standardization, and increasing transparency. At the same time, the program relies on decentralized day-to-day management of compliance areas most effectively implemented at the business unit level.
Program components include:
• Establishing a senior-level compliance officer to manage the program
• Training to enhance company-wide awareness of the program and associated personnel responsibilities to ensure everyone understands the compliance risks that apply to their jobs
• Providing an online reporting tool plus a toll-free help-line, available 24 hours a day, seven days a week, for company personnel to ask questions and report concerns
• Ensuring that the board of directors is fully informed about the progress of the program
• Conducting audits and reviews to ensure corporate compliance
Compliance Council
A Compliance Council comprised of compliance program managers throughout the company and key personnel builds partnerships among compliance programs and provides recommendations with respect to overall compliant operations and continuous improvement. The Council’s purpose is to:
• Partner and share information across PSE business units regarding compliance program operation and implementation;
• Collaborate to develop common and transparent expectations and processes that endeavor success for the employee; and
• Maintain consistent alignment with customer service, safety, and efficiency objectives of PSE by supporting operationally effective activities that deliver compliant outcomes and reinforce a culture of compliance.
Environmental regulatory and compliance tracking
Compliance is accomplished and verified through guidance from our Environmental Management System (EMS), employee awareness training, regulatory compliance task tracking, regulatory reporting, and environmental audits. Our Environmental & Program Services department (EPS) oversees compliance including regulatory oversight and consultation of environmental regulations. Additionally, our federal and state Government Affairs team monitors a variety of proposed and pending legislation, including areas of environmental compliance, and communicates information and updates to affected departments.
We maintain a corporate-wide compliance investigation process that tracks non-compliance violations including an internal process that reviews incidents of non-compliance and near misses to address root causes and mitigate the likelihood of future recurrences. Company-wide tasks tied to environmental compliance are tracked through an internal system that notifies proper personnel of the due date to complete tasks on time, tracks progress, follow up, and records completion.
15/75
ESG strategy and vision 11Jan. 2019
Risk management
We use a variety of methods to identify and track risks related to compliance. We regularly conduct risk analysis to support corporate planning efforts. We assess and communicate risk through an Enterprise Risk Management (ERM) framework. We evaluate large-scale emergency situations through Business Continuity Plans. And we identify business risks related to environmental compliance with our EMS.
Enterprise risk management and business continuity
Our ERM integrates risk management into PSE’s strategy, governance, reporting process, procedures and culture. The objective of the ERM is to consistently identify, assess, evaluate and manage risks across the company. Thorough evaluation of controls and consideration of risk context helps formulate mitigation plans to lower residual risk. These risks and associated mitigation plans are regularly reported to the board of directors.
We developed Business Continuity Plans to resume work following an emergency or incidient that significantly impacts PSE’s business operations and our customers. Planning consists of an evaluation of key personnel, workplace and systems to prepare our employees to respond should a disruptive incident occur.
Environmental risk management
Environmental stewardship is integral to PSE and we encourage environmentally responsible and sustainable behavior. We maintain a Corporate Environmental Policy that ensures PSE and its employees at all levels will comply with all environmental laws, regulations, and company environmental policies. The policy is endorsed by senior decision makers and communicated to all employees.
As part of these efforts, PSE is involved in the development of future and changing regulations, and works to optimize operational needs when meeting regulatory requirements. This includes implementing an EMS that covers operational and procedural processes impacted by legal requirements and environmental regulations. Program compliance is overseen by several business units.
Cybersecurity
Utilities are a particular target for criminals looking to expose data, impact the power grid and cripple infrastructure. PSE’s goal is to apply the same level of due diligence across the enterprise to ensure risks are consistently addressed and mitigated in alignment with the rapidly changing security landscape. Our programs are based on the same national standards followed by leading companies in the energy and defense industries.
16/75
12 Environmental, social and governance (ESG) report Jan. 2019
We continually evaluate our cybersecurity posture to ensure additional investments are properly identified and funded. As critical infrastructure becomes more technically complex, we adapt and mature our cybersecurity practices and programs allowing PSE to take advantage of new technical opportunities while continuing to mitigate the risks.
In addition to keeping our security tools current, we have strong policies and programs in place that assist in achieving our overall security goals. We require our employees and vendors to successfully complete targeted security trainings at regular intervals throughout the year to ensure they are aware of the important role they play in keeping our systems and information safe. We participate in numerous state and industry-specific cyber security initiatives and coordinate across a growing list of external entities to keep pace with industry trends and standards. We perform security assessments of our vendors and technology implementations to ensure the safety and security of our infrastructure. And, we regularly exercise our cybersecurity incident response plan such that anyone asked to play a role in an incident exercise has experience before a real-life situation occurs.
Lobbying and political contributions
PSE follows strict federal, state, and in some cases, local political contribution laws. Compliance includes disclosure and reporting of financial contributions made to political candidates and political action committees. Additionally, PSE employees can voluntarily participate in the Puget Sound Energy Political Action Committee (PAC) for Good Government, which contributes to federal candidates; compliance is governed by the Federal Election Committee and through the PSE PAC Articles of Association (bylaws).
PSE engages in advocacy on behalf of our customers, the company and employees, at the federal, state and local levels of government. Federal and state lobbyists employed by the company are required to register with Congress, the Washington State Public Disclosure Commission (PDC) or the State of Montana Commissioner of Political Practices, report political contributions on a regular basis, and file reports that quantify lobbying expenses incurred by the company as well as the public policy issues on which the company engaged government officials. King County is the only jurisdiction in our service area requiring lobbyist registration and quarterly reports of lobbying disclosure. PSE follows internal written policies to collect, organize and report on the data for each of these filings.
17/75
ESG strategy and vision 13Jan. 2019
Environmental
Creating a better energy future
We share our customers’ concerns about the impacts of climate change.
PSE was an early leader in bringing our customers more sources of clean energy, investing in wind energy before Washington state voters established a renewable energy portfolio standard in 2006. In the past 14 years, we deployed over 770 megawatts of wind generation and other green energy projects, and we are currently the nation’s third-largest utility producer of wind power.
In addition to developing renewables, we have gone above and beyond in our conservation efforts, establishing award-winning programs in energy conservation and green power. PSE has one of our country’s most comprehensive energy-efficiency programs for helping homes and businesses reduce their energy use. PSE offers our customers financial incentives and technical help to conserve energy, and PSE also promotes the growth of renewable electricity production in its service area through various customer programs. We are keenly aware of our customers’ interest in reducing carbon emissions, and we share their commitment to achieving meaningful carbon reduction.
18/75
14 Environmental, social and governance (ESG) report Jan. 2019
PSE carbon reduction goal
In December 2017, PSE announced plans to reduce carbon emissions 50 percent by 2040 by helping lead Washington’s transition from coal, by providing more clean energy, and by advancing cleaner transportation.
• The transition from coal: With the retirements of the Colstrip Units 1&2 by 2022 and the shutdown of the Centralia Coal Plant in 2025, PSE will be 85 percent coal free, and on the path to 100 percent coal-free generation by the early 2030s.
• Clean energy: PSE will continue to invest in wind, solar and energy efficiency on behalf of all customers, while providing voluntary solutions for customers who want to transition faster.
• Cleaner transportation: Transportation is currently the largest source of carbon emissions in Washington state. PSE supports increasing the availability of lower emitting commercial vehicles that can be powered either by cleaner burning natural gas, renewable natural gas or electricity. These include buses, delivery trucks, waste hauling vehicles and transport shuttles as well as shipping and other maritime uses.
PSE developed its carbon reduction plan in coordination with customers. One of the things we heard was that customers want to be involved and want concrete actions that make a difference in their daily lives. PSE developed its TOGETHER campaign in response, helping customers understand how PSE will reach its goals and how they can contribute as individuals.
However, PSE can only go so far on its own. Realizing our full potential will require policy changes at the state level, including alternative regulatory models, carbon policy, and measures to support the adoption of electric and alternative fuel vehicles. PSE is actively working with customers, policy makers and other interested parties to move both short and long term actions forward.
Greenhouse gas (GHG) policy and emissions reporting
As the Northwest’s largest utility, PSE has been a leader in developing and promoting clean energy and advancing efficiency programs and technologies for almost 20 years. The design of greenhouse gas policy and carbon regulation is critically important to achieving meaningful carbon reductions and avoiding unintended consequences. We take short-term measures designed to lessen the growth of greenhouse gas emissions and follow long-term strategies that will ultimately manage
greenhouse gas emissions to appropriate levels in a scientifically sound and responsible fashion.
We have voluntarily reported our carbon emissions since 2002, and we have supported state-wide initiatives, laws and regulations with tools aimed at carbon reduction including an emission performance standard for thermal plants and increased energy efficiency and conservation. We served on the state Clean Energy Leadership Council and the Governor’s Climate Advisory Team, a select panel that helped state lawmakers craft strategies to cut Washington’s greenhouse gas emissions to half of the 1990 level by 2050.
Since 2010, PSE has complied with requirements to submit an annual report of its greenhouse gas emissions to the state of Washington Department of Ecology including emissions from all individual power plants emitting over 10,000 tons per year of greenhouse gases and from certain natural gas distribution operations. Emissions exceeding 25,000 tons per year of greenhouse gases from these sources must also be reported to the U.S. Environmental Protection Agency (EPA). The most recent data indicate that PSE’s total greenhouse gas emissions (direct and indirect) from its electric supply portfolio in 2017 were 10.2 million metric tons of carbon dioxide equivalents. Approximately 37 percent of PSE’s total greenhouse gas emissions (approximately 4.5 million metric tons) are associated with PSE’s ownership and contractual interests in coal in 2017. PSE’s overall emissions strategy demonstrates a concerted effort to manage customers’ needs with an appropriate balance of new renewable generation, existing generation owned and/or operated by PSE and significant energy efficiency efforts.
Table five shows that a majority of the greenhouse gas emissions reported in the inventory are from electric generating resources, while the remaining emissions are
19/75
ESG strategy and vision 15Jan. 2019
from natural gas supply to end-users (“direct use”).
Table 5: 2017 Greenhouse Gas Inventory
Emission Source Energy Amount (UOM)
Emissionss in CO2 Equivalents (CO2e) - 100 year timeline (Tons) Emission Intensity
Data Source: [1] EPA GHG MRR Subpart A (40 CFR 98), Table A-1 (EPA 2015)
Notes:(1) Non-firm contract purchases do not invlude "Book Outs" under EITF Issue 03-11(2) Consistent with the GHG protocol, only CO2 is accounted separately for biomass generation(3) Percentage of emissions in CO2e in scope(4) NC= Not Calculated
Global Warming Potentials (1):
Time Horizon CO2 CH4 N2O SF6
100 Years 1 25 298 22,800
Table six summarizes these total emissions reductions from conservation targets. PSE operates a variety of electric and natural gas conservation programs, which result in significant reductions in demand on electric and natural gas resources. These programs led to an estimated savings of over 108,500 metric tons of CO2, 5,970 metric tons of CH4, and 0.22 metric tons of N2O in 2017.
Table 6: Total emissions reductions from conservation programs
Source of emissions savings CO2
(metric ton)CH4
(metric ton)N20(metric ton)
Electricity and Natural gas 108,537 5,975.32 0.22
20/75
16 Environmental, social and governance (ESG) report Jan. 2019
Clean Energy
Wind power
PSE owns and operates three large wind farms in Washington state: the Wild Horse Wind and Solar Facility in Kittitas County; the Hopkins Ridge Wind Facility in Columbia County; and our third and largest wind operation, the Lower Snake River Wind Facility, in Garfield County. Our three current wind facilities produce up to 773 megawatts of electricity, enough to meet the power demands of nearly 200,000 homes, making us the third-largest utility owner of wind power in the U.S.
Hydropower
Depending on conditions such as snow pack, low-cost hydropower accounts for roughly one-third of our current power portfolio. We own and operate two hydropower projects, Baker River, and Snoqualmie Falls, in Western Washington. We also buy a substantial amount of hydroelectric power from the regional power market.
Solar power
To help demonstrate the viability of solar power in the Northwest, PSE built one of the region’s largest solar arrays in 2007 at our Wild Horse Wind and Solar Facility in Kittitas County. The installation can produce up to 500 kilowatts of power. We’ve also helped thousands of customers, both large and small, to install solar panels and other renewable generation through our net metering program (now know as Customer Connected Solar).
21/75
ESG strategy and vision 17Jan. 2019
Clean energy customer programs
PSE also encourages the growth of renewable electricity production in its service area through voluntary programs. These programs allow customers to use clean power resources for their home or business by purchasing renewable energy credits, carbon offsets, or installing their own small-scale renewable energy devices to reduce their carbon footprint.
In 2002, we created our Green Power program for business and residential customers to match some or all of their electricity usage with green power. Today, our Green Power program is a top-six green pricing program in terms of both participation and MWh sold. Another longstanding program is Carbon Balance, which allows PSE natural gas customers to balance greenhouse gas emissions associated with their natural gas use by purchasing carbon offsets through local projects. PSE also offers a net metering program, called Customer Connected Solar. Participants who generate a portion of their electricity through a qualifying renewable energy system (such as roof top solar) can not only avoid purchasing that amount from PSE, but they can also get a credit from PSE for any surplus renwable generation that they put into the grid.
Recently, we added two new clean energy programs designed to help customers lower their carbon footprint and meet sustainability goals: Solar Choice and Green Direct. Solar Choice is an extension of our Green Power program that enables customers to match their usage with solar energy generated by independent power producers. It’s designed for customers who want to support solar energy without having to install pricey equipment. On a much larger scale is our Green Direct program. It was created specifically for our large municipal and commercial customers who want their clean energy to come from a local resource. The result is two new energy projects—Western Washington’s first wind farm and the state’s largest solar array. When these projects are complete, PSE will add over 650 million KWh of renewable energy to its system, enough to power more than 54,000 homes. Green Direct’s customers range from the State of Washington and the Port of Seattle to T-Mobile, Target and REI, with King County being our largest customer.
Table 7: Clean energy customer programs at PSE
Program Objective
Green Power and Solar Choice
Allows PSE electric customers to contribute to renewable energy generation and spur more renewable-power production in the Northwest by voluntarily buying renewable energy credits. PSE has partnered with public- and private-sector entities on a variety of innovative alternative-energy projects, such as the generation of power from dairy waste at farms in King, Whatcom and Skagit counties. Solar Choice is an alternative for customers who specifically want power from solar resources. The solar power is generated at a separate location and added to the power grid on their behalf.
Carbon Balance A voluntary program for PSE natural gas customers to balance the greenhouse gas emissions associated with their natural gas use by purchasing carbon offsets through local projects that work to reduce or capture greenhouse gases. Customers can purchase 'carbon offset' blocks through the Bonneville Environmental Foundation to offset CO2 emissions. Program funds are directed to local projects that work toward reducing greenhouse gases.
Green Direct A renewable energy program specifically designed for PSE's largest business and municipal customers seeking to reduce greenhouse gas emissions by adding renewable power to their energy portfolios. This ground-breaking initiative is an effort for PSE to provide stable, cost efficient solutions for these customers to meet their carbon reduction goals by providing them with the ability to purchase 100 percent of their energy from dedicated, local, renewable energy resources.
Customer Connected Solar (net metering)
A program for PSE electric customers who generate a portion of their electricity through solar, wind, biomass from animal waste, fuel cell, or other qualifying renewable energy generating system. Customers that generate their own electricity, and are connected to the utility's distribution grid, offset electricity that would otherwise be purchased from the utility. PSE offers credits to customers who generate more electricity than their home need.
22/75
18 Environmental, social and governance (ESG) report Jan. 2019
Energy efficiency
PSE has one of the nation’s largest energy efficiency programs. Over the last 10 years, we helped customers cut electricity consumption by more than 21 billion kilowatt hours--that's enough to power every home and business we serve for a full year. And over the next two decades, we plan to help customers save 440 average-megawatts of electricity and 70 million therms of natural gas.
Our conservation programs are separated into two categories: business energy management and residential energy management. This enables us to meet the unique needs of businesses of all types and sizes as well as homeowners and families.
Business energy management programs
PSE provides engineering consultation, custom incentives, and technical assistance for energy efficiency and upgrades for commercial and industrial projects, and tailored grants for retrofits and upgrades in energy intensive buildings. These programs provide businesses with a dual benefit: significant cost savings plus the opportunity to reduce their carbon footprint.
Energy management HVAC Kitchen
Laundry Lighting Lodging
New construction Small business Retrofit grants
PSE’s financial incentives and support programs include:
• Standard rebates and incentives for commercial HVAC systems, kitchens, and hospitality equipment
• Lighting incentives and point of sale discounts for LED lighting and controls
• Customized incentives to help cover project costs
• Design assistance and incentives for new construction projects that exceed code requirements
• Incentives and support for large businesses such as school districts, governments, hospitals, and mid-size customers under our multiple comprehensive energy management offerings.
PSE works with owners, developers, and designers of new facilities, or major remodels, to propose cost-effective energy-efficient upgrades that exceed energy codes. PSE provides funding of up to 100 percent of incremental costs for installation of cost-effective energy-efficient equipment to achieve savings beyond the applicable energy code. For small businesses, we offer a direct install rebate program to retrofit lighting and other equipment.
Table 8: business energy management programs
23/75
ESG strategy and vision 19Jan. 2019
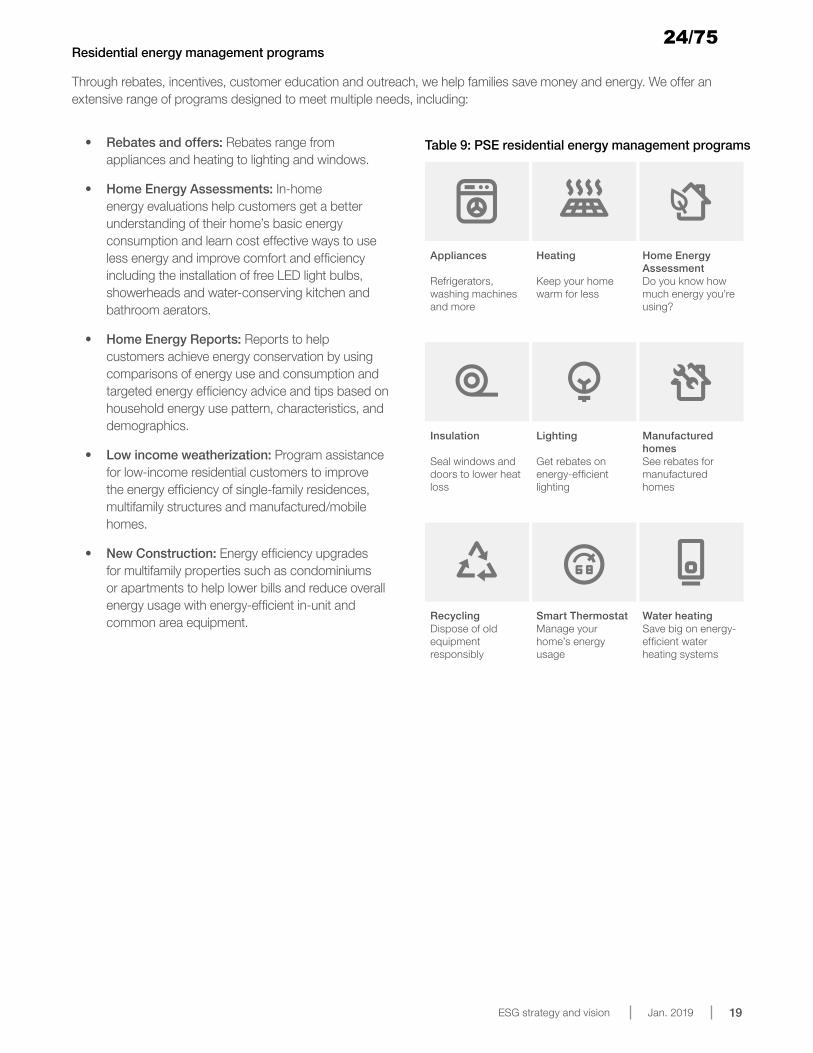
Table 9: PSE residential energy management programs
Residential energy management programs
Through rebates, incentives, customer education and outreach, we help families save money and energy. We offer an extensive range of programs designed to meet multiple needs, including:
Appliances Heating Home Energy Assessment
Refrigerators, washing machines and more
Keep your home warm for less
Do you know how much energy you’re using?
Insulation Lighting Manufactured homes
Seal windows and doors to lower heat loss
Get rebates on energy-efficient lighting
See rebates for manufactured homes
Recycling Smart Thermostat Water heatingDispose of old equipment responsibly
Manage your home’s energy usage
Save big on energy-efficient water heating systems
• Rebates and offers: Rebates range from appliances and heating to lighting and windows.
• Home Energy Assessments: In-home energy evaluations help customers get a better understanding of their home’s basic energy consumption and learn cost effective ways to use less energy and improve comfort and efficiency including the installation of free LED light bulbs, showerheads and water-conserving kitchen and bathroom aerators.
• Home Energy Reports: Reports to help customers achieve energy conservation by using comparisons of energy use and consumption and targeted energy efficiency advice and tips based on household energy use pattern, characteristics, and demographics.
• Low income weatherization: Program assistance for low-income residential customers to improve the energy efficiency of single-family residences, multifamily structures and manufactured/mobile homes.
• New Construction: Energy efficiency upgrades for multifamily properties such as condominiums or apartments to help lower bills and reduce overall energy usage with energy-efficient in-unit and common area equipment.
24/75
20 Environmental, social and governance (ESG) report Jan. 2019
Cleaner transportation
Washington is different from most states when it comes to carbon emissions. In most of the country, the power sector is the single largest contributor to carbon emissions. That’s not the case in Washington where 43 percent of our carbon emissions come from transportation.
In addition to passenger vehicles, PSE is focused on the commercial sector. There is increasing availability of lower emitting commercial vehicles that can be powered either by cleaner burning natural gas, renewable natural gas or electricty. This includes buses, delivery trucks, waste hauling vehicles and transport shuttles.
Electric vehicles
Each new electric vehicle (EV) that replaces an existing combustion engine eliminates an average of more than 5,400 pounds of carbon a year.
For the last decade, PSE has been part of the state’s effort to drive adoption of 50,000 electric vehicles. We believe that we can do more and as part of our goal to reduce carbon emissions 50 percent by 2040, are calling for 1 million electric vehicles on the roads by 2030.
Meeting this aggressive goal will require a policy and regulatory framework that enables the development of convenient, reliable and affordable charging infrastructure, and incentivizes EV purchases.
25/75
ESG strategy and vision 21Jan. 2019
Currently, PSE is running a series of pilot programs with charger installations in public, workplace, multifamily and residential locations, and will install more than 700 chargers in the next few years. These pilot programs are designed to both educate customers and identify optimal mechanisms for encouraging drivers to charge when demand on the grid is smallest.
PSE is also working directly with customers to educate them about electric vehicle technology and options available to them. Our free “Ride and Drive” events give customers the opportunity to test multiple styles of vehicles and talk with energy experts about set up and charging. We’ve also developed online resources to help customers, including cost calculators and information about charging at home, at work and on the road.
PSE fleet
As part of our carbon reduction goal, we’re also making improvements to our fleet. We’ve committed to doubling the number of electric vehicles in PSE’s pool car inventory each year for five years. We’re also investing in hybrid electric technology, most recently installing these systems on vans for our Gas First Response team. The converted vehicles will reduce our carbon footprint by about 1.3 million pounds of CO2 annually.
Compressed natural gas (CNG) vehicles
PSE supplies compressed natural gas (CNG) to public and private fueling stations around the Puget Sound region and its own CNG truck fleet. The cost of CNG as a transportation fuel is surprisingly low and a CNG-powered vehicle gets about the same fuel economy as a conventional vehicle. Now available at roughly half the cost of petroleum-based fuel, CNG fuel prices are also more stable compared to the volatile price fluctuations in the market for petroleum.
Natural gas vehicles are designed and built to be safe in normal operations, fueling and accidents. As with vehicles that are fueled with petroleum-based gasoline, new natural gas vehicles are subject to federal motor vehicle safety standards and crash tests. Fueling stations are also built to high safety standards.
Liquefied natural gas (LNG) vessels
Ocean-going vessels have traditionally burned the most polluting of all fuels called bunker fuel. Nationally and internally, the cleanest option for ships travelling long distances has become Liquefied Natural Gas (LNG).
PSE is developing an LNG facility at the Port of Tacoma. It will provide a cleaner fuel alternative for maritime vessels and other transportation uses, in addition to helping meet customer demand at times of peak usage. Our first partner is TOTE Maritime. When TOTE’s first ship leaves Tacoma for Alaska fueled with LNG, it will allow for the greenest shipping fleet on the West Coast, helping reduce not only greenhouse gas emissions but also dangerous particulates that put Port workers at risk for major health issues. Our partnership with TOTE Maritime will make just the kind of green impact we are seeking in transportation.
26/75
22 Environmental, social and governance (ESG) report Jan. 2019
Corporate environmental policy
Our corporate environmental policy lays out the company’s commitments to environmental compliance, pollution prevention, continual improvement, an internal awareness culture, stakeholder engagement, and community outreach. The policy assures PSE
and its employees at all levels accept accountability and responsibility for the policy to comply with all environmental laws, regulations, and policies.PSE senior decision makers endorse this policy and it gets communicated to all employees.
Environmental compliance
We maintain the highest level of environmental performance and value our strong relationships with our regulators and our local community. Our management of environmental compliance risk starts with our corporate environmental policy, an environmental management system (EMS) and an environmental audit program.
27/75
ESG strategy and vision 23Jan. 2019
EMS system
Our EMS documentation formalizes our company-wide approach and commitment to managing our environmental responsibilities. It provides clarity of roles and responsibilities associated with implementing PSE’s corporate environmental policy by providing program structure, set processes, and guidance tasks for departments to ensure compliance with environmental laws and regulations. It also provides a roadmap of employees and departments tasked with maintaining compliance across multiple environmental program areas throughout the company. Program areas include air, cultural resources, facility siting, hazardous material, waste, natural resources, remediation, spill response, and water discharge.
The EMS is reviewed annually and continually built upon and modified. Our compliance managers monitor our progress in meeting all regulatory requirements at our operations. Our goal is always no violations of regulatory requirements and we work to meet that target.
Air program
PSE’s air program provides reporting, management and emission reduction initiatives for various aspects of the company’s air quality programs. This includes oversight and negotiations of all air permits, oversight of testing and monitoring activities, and regulatory interpretation and planning. PSE’s Environmental & Program Services (EPS) department works closely with agencies and PSE plant and operations groups to assure compliance and to develop new alternatives to reduce emissions and improve operational efficiencies.
Waste management program
Our compliance program includes a waste management program to ensure all waste at PSE is managed in accordance with local, state, and federal regulations. The program is designed to heighten awareness and improve communications and engagement with employees on waste management policies while implementing effective measures to track waste generation, cost, and opportunities for waste minimization and reduction. Under guidance from our EPS department, we developed policies and procedures, employee awareness and training, and compliance tracking and documentation commitments to support waste minimization.
PSE also maintains a vendor audit program specifically to evaluate regulatory compliance performance of PSE waste management service providers and ensure all our waste is handled appropriately.
Water
Water is an important resource in power generation. PSE’s thermal electric generation facilities need water to cool high temperatures and power steam turbines. From an environmental perspective, our industrial water usage also supports our thermal facilities’ control of air emissions. All of PSE’s thermal facilities operate under permitted water usage conditions or permits. We obtain our water from local municipal water supply sources and we monitor and track the amount of water used, consumed and discharged at these facilities.
Our water discharge program covers industrial wastewater as well as stormwater management at PSE facilities. The EPS group assists in the development, compliance, renewal and updating of wastewater and stormwater permits and best management practices for PSE facilities and operations. All our natural gas thermal plants discharge wastewater to local publicly–owned treatment works (POTWs), and all our wastewater discharges are regulated by National Pollutant Discharge Elimination System (NPDES) permits.
PSE also works with local jurisdictions as well as the Washington State Department of Ecology to ensure that best management practices are implemented in compliance with construction stormwater permitting for applicable construction projects. PSE strives to minimize impacts to local waterways from potential stormwater runoff associated with construction activities.
28/75
24 Environmental, social and governance (ESG) report Jan. 2019
Remediation
PSE’s environmental remediation program manages clean up of legacy contamination from operations by PSE and its predecessors. Sites such as those below show PSE's commitment to properly addressing environmental impacts and have helped PSE earn a reputation as a responsible corporate citizen.
• Buckley Headworks: PSE worked closely with the Washington Department of Ecology (WDOE) in developing and implementing a remedy to address contaminated soil and groundwater impacted by historic operations of a wood treating facility at former hydroelectric project at Lake Tapps. WDOE issued a No Further Action (NFA) letter as well as nominated PSE for the Governor’s Award for its efforts in protecting the environment.
• Thea Foss Waterway and Tacoma Tar Pits sites: As part of the Commencement Bay Superfund Site, PSE worked closely with federal and state government environmental agencies to address contamination associated with the past ownership and/or operation of two manufactured gas plants (MGP). The Tacoma Tar Pits remedy was implemented in the late 1990’s and Thea Foss Waterway remedy was completed in 2004. Both sites have received review from EPA with the results showing the remedies are functioning as designed and are protective of human health and the environment.
• Crystal Mountain Generation Station: In 2006, a device associated with the fueling system for the generator failed and ultimately spilled a large quantity of diesel at this remote location in the Cascade Mountains. PSE worked with EPA, WDOE and the U.S. Forest Service to efficiently remediate and restore the site.
• Gas Works Park: A MGP was operated from 1906 until 1956 by PSE’s predecessors at a site now owned by the City of Seattle and established as Gas Works Park. PSE and the City of Seattle have fully investigated and remediated the upland portion of the park and are working closely with WDOE to address the sediments offshore of the park in Lake Union.
Spill prevention and response
PSE has over 600,000 pieces of oil-filled electrical equipment in service throughout its territory. Damage to these devices can occur during storm events, vehicle accidents as well as an occasional equipment failure resulting in a spill. PSE’s spill response program is designed to alleviate the impact of spills through rigorous response procedures, mitigation, and cleanup efforts including a 24-hour spill response service. All spills are reported to local agencies and all spill incidents are monitored and tracked in a database.
Environmental audit program
Our environmental audit program includes the coordination and conducting of environmental reviews at PSE facilities to verify environmental compliance is being met. The program is designed to review procedures and operations to identify deficiencies, potential areas of concern, and areas for improvement in order to more effectively carry out commitments under PSE’s corporate environmental policy. We conduct inspections and/or audits regularly at service centers and operating bases, power generation facilities, natural gas storage facilities and other PSE facilities. We also perform compliance assessments on our environmental contractors at these facilities to ensure that they are in compliance with environmental regulations and have no outstanding major fines or violations.
29/75
ESG strategy and vision 25Jan. 2019
Biodiversity and habitat protection programs
PSE maintains programs specific to the protection of habitats of birds, fish, wildlife and other natural resources. Notably this includes implementing protective measures for fish passage at hydroelectric facilities, protected bird species, and wetland and wildlife habitats.
Protecting fish
Baker and Skagit Rivers
PSE’s largest hydropower facility is the Baker River Hydroelectric Project, a 215 MW facility located on a tributary of the Skagit River in northwest Washington. It features the Upper Baker Dam and Lower Baker Dam, each with its own powerhouse and reservoir.
In 2008, the Federal Energy Regulatory Commission (FERC) issued PSE a new, 50-year operating license for the project after eight years of collaborative consultation between PSE and 23 other parties, including government agencies, Indian tribes, and environmental groups. The license provides for an adaptive management approach to operation of the project including enhancement measures for several different resource areas including fish and terrestrial resources.
The Baker River is a major tributary of the Skagit River, one of Washington State’s most prolific river systems
for fish. PSE’s power projects feature extensive salmon-enhancement systems, including a fish hatchery and innovative facilities for moving migrating fish both upstream and downstream around PSE’s two dams. A second powerhouse below Lower Baker Dam allows for fish-friendly outflows that protect fish populations and riparian habitat in the Baker-Skagit Rivers.
Over the years, advances in technology, greater knowledge of fish biology, ongoing PSE investments in fisheries systems and continued collaboration with resource agencies and Northwest Indian tribes have produced significant gains in the river’s fish stocks. Our two Baker River dams are too high for conventional fish ladders so we trap returning adult fish and haul them upstream of the dams. Part of this successful equation is our floating surface collector on Baker Lake. The $50 million apparatus, completed in 2008, attracts and safely holds juvenile salmon for downstream transport by “fish taxi.” In 2013, a second floating surface collector was constructed on Lake Shannon as a further boost to the
30/75
26 Environmental, social and governance (ESG) report Jan. 2019
basin’s sockeye production. In addition to an advanced, upstream trap-and-haul facility completed in 2010, both facilities are benefitting the river’s once struggling salmon populations and rebounding sockeye numbers to new record levels. We also upgraded our sockeye spawning beach — a series of large, gravel-bottom pools with spring-fed water percolating up through them. This man-made, but naturalistic 20-year-old beach provides a controlled, predator-free environment for adult sockeye that greatly increases spawning success.
The new hatchery and renovated spawning beach are expected to result in a fourfold increase in hatched salmon fry in Baker Lake — up to 11 million initially. Future expansion could push the fry total to 14 million.
Snoqualmie Falls
PSE’s Snoqualmie Falls Project, located about 30 miles east of Seattle on the western slopes of the Cascade Mountains, is one of the oldest hydropower plants in the United States. The project contains a small diversion structure just upstream from Snoqualmie Falls--which is a natural fish barrier-- and two powerhouses. Built in 1898-1899, the first powerhouse is encased in bedrock 260 feet beneath the surface and was the world’s first completely underground power plant. The second powerhouse, located a quarter-mile downstream from the falls, was built in 1910 and expanded in 1957.
After operating for more than a century, the facility still produces clean, renewable electricity for our customers. The project received a new, 40-year federal operating license in 2004. The license included an adaptive management approach to operation of the project including enhancement measures for the historic
infrastructure and public recreation facilities, and several different areas including fish and terrestrial resources.
To further protect downstream fish on the Snoqualmie River, we installed new flow-control equipment in our Plant 2 powerhouse that will ensure consistent outflows from the plant if an emergency shutdown occurs. The new equipment will prevent rapid changes in downstream river levels that could potentially strand fish in side channels.
Wildlife and habitat protection
Through our conservation and restoration efforts, we help sustain valuable habitats that support significant wildlife populations.
Central Washington shrub-steppe
Over the past 150 years, half of this dry, native ecosystem in Central Washington has become farmland, making shrub-steppe among the most threatened ecosystems in North America. When constructing our Wild Horse Wind and Solar Facility, we voluntarily added a conservation easement to safeguard 7,000 acres of shrub-steppe habitat. By planting 6,500 sagebrush plugs, we helped restore the area to a viable ecosystem for loggerhead shrikes, ground squirrels, sage grouse and the sensitive hedgehog cactus.
In partnership with the Trust for Public Lands and the Washington Department of Fish and Wildlife, we also preserved 18,000 acres of undeveloped open-space, helping to maintain enough wild lands to support elk, mule deer, bobcats, badgers, hawks, and other wildlife — all told, more than 200 bird species and 30 mammal species.
31/75
ESG strategy and vision 27Jan. 2019
The White River
Urbanization has taken a toll on Puget Sound open space, encroaching on watersheds and native riparian habitat. Along the White River where PSE operated a hydroelectric facility for much of the 20th Century, we set aside 3,000 acres of our own land (undeveloped forest, wetlands, bluffs and meadows) along a 10-mile stretch of the river — one of the few large tracts of undeveloped property left in the lowlands of central Puget Sound. Our effort preserves habitat for bears, deer, cougars, great blue herons, wood ducks and other species.
North Cascades habitat
PSE’s Baker River Hydroelectric Project is situated within the heavily forested Cascade Range of northwest Washington. Under our operating license for the project, we have purchased nearly 900 acres of wildlife habitat (wetlands, elk and bird habitat). On these lands, we have developed nearly 16 acres of meadow-like elk forage areas and another 90 acres of enhanced forage areas for elk, protected 24,600 linear feet of streams and approximately 90 acres of wetlands, developed snags and logs for wildlife habitat management, and decommissioned roads and installed access
management features to reduced motorized vehicle impacts on the properties. We have provided funding to the USDA Forest Service for road closures to improve grizzly bear habitat, enhance habitat conditions in late seral forest areas, and for mountain goat habitat enhancement.
Snoqualmie
At Snoqualmie, we have set aside about 24 acres of forest habitat and wetlands, and established a popular hiking trail. PSE has also purchased a small amount of wetland credits from a wetland mitigation bank to mitigate impacts caused by construction at the facility.
Noxious weed management
Invasive and noxious weeds can crowd out native plants, degrade habitats and increase harmful erosion. We strive to control these species through an ecologically based, integrated weed management program at our facilities. We work with local environmental organizations to help identify and manage the weeds, then reintroduce native plants to restore the habitat. Our noxious weed program has over 150 weed sites that we are treating, and we are protecting at least 10 rare plant locations.
32/75
28 Environmental, social and governance (ESG) report Jan. 2019
Avian protection
For 30 years we’ve worked to preserve bird habitats and prevent eagles, osprey, hawks, trumpeter swans and other birds from coming into contact with power lines and utility equipment. Our Avian Protection Program promotes a consistent avian-safe system across our eight-county electric service area. While it is not possible to prevent all injurious contact between birds and electric equipment, we make significant investments to reduce the number of incidents.
Our Avian Protection Program is recognized by federal wildlife officials as an industry model for reducing the impact of utility equipment on migrating and resident bird populations. While the number of eagles has increased significantly in recent years, we’ve seen no increase in eagle mortalities from contact with our electrical system. Small-bird mortalities also have been reduced through our efforts. Both of these facts are a testament to the effectiveness of our bird-protection programs.
Under the program we:
• Conduct bird surveys near our electrical facilities to assess problem areas and identify high-priority sites for elevated bird-protection efforts.
• Minimize impact on nesting, roosting and wintering habitat by working with our engineers and utility-infrastructure planners to ensure avian safety is part of all projects.
• Exchange information and partner in the field on bird-protection initiatives with the United States Fish and Wildlife Service and the Washington Department of Fish and Wildlife.
• Respond to bird issues at company facilities and take corrective actions throughout our service area.
• Are continually refining and implementing construction standards that minimize bird interaction with our electrical system.
We are constantly assessing and reassessing our programs and procedures to continue to reduce our electrical system’s impact on birds. We evaluate what works and proactively improve our standards. We are also a member of the Avian/Power Line Interaction Committee and a contributor to its nationally recognized publication, Suggested Practices for Avian Protection on Power Lines.
We extend the same commitment to avian protection at our wind facilities. We follow the terms and conditions set out in our Federal Special Purpose Utility Permit, conduct regular field monitoring, report all incidents found to state and federal agencies and support local and regional avian research initiatives. In addition, we have implemented a number of conservation measures and are actively pursuing Eagle Take Permits for our three wind facilities.
Vegetation management
Since 2001, PSE has been recognized by the National Arbor Day Foundation as a utility that has demonstrated practices that protect and enhance America’s urban forests.
PSE has an obligation to provide reliable electrical service to our customers. The major cause of power outages are unhealthy trees that fall into the electrical lines, windblown branches that cross the line as they fall to the ground, and tree limbs that grow into power lines. PSE is responsible for the trimming or removal of incompatible trees near
33/75
ESG strategy and vision 29Jan. 2019
our power lines in order to comply with local, regional, and state laws for the safety of the public and to increase service reliability.
When we need to remove tall-growing species under power lines or hazardous trees that could fall and damage electrical equipment, we balance it with a mitigation program. We partner with local, state and federal agencies to identify potential mitigation sites that are currently degraded and could benefit from additional vegetation. Our goal is to convert these critical areas into thriving ecosystems. Planting tree and shrub species native to western Washington provides shade for salmon habitats, perches for birds, woody debris for amphibians and foraging material for mammals.
We’re committed to providing safe and reliable service to our customers while taking a responsible approach to protecting and restoring the natural environment.
Wetland and waterways mitigation
PSE’s predominant territory expands across Western Washington which is home to a large number of wetlands and streams, many of which can be habitat for threatened and endangered salmon species. It is PSE’s policy to relocate work around water bodies where possible or select a construction method that causes the least disturbance.
For projects involving in-water work or other high impact construction, we contract with specialized consultants to determine impacts, propose appropriate mitigation or use of mitigation banks, or perform on-site and off-site mitigation activities to offset impacts.
We reach out early (separate from the required permit noticing) to stakeholder groups, tribes and agencies on high impact projects to gather input on construction methods and mitigation details to ensure we have support for the proposed action.
Once the mitigation is in place for a given project, designated PSE employees are assigned to manage and oversee the maintenance and monitoring of mitigation sites (typically a 10–year monitoring period). In addition to ongoing maintenance of multiple mitigation sites, PSE maintains a robust company standard for erosion and sediment control that continues to evolve as environmental sensitivity increases.
Cultural resources
PSE’s Cultural Resources Program works with government agencies, tribes, other stakeholders and the public to develop and share information pertaining to cultural resources. This information acts not only as the foundation to make sound decisions regarding cultural resources managed by or potentially affected by PSE actions, but serves as outreach and education materials. We share technical reports and findings with affected parties and through consultation we develop materials suitable for the public. We also work with regulators and local tribes to ensure all necessary consultations and cultural resource surveys are conducted so that we can preserve our cultural artifacts.
Social
34/75
30 Environmental, social and governance (ESG) report Jan. 2019
PSE is committed to being a valued member of the communities we serve. We’re part of the vital infrastructure that serves homes and businesses and we invest billions to improve and maintain our systems. We work directly with customers, providing them with a range of information and resources on safety, energy efficiency, and local projects. And we work in close partnership with local charitable and nonprofit organizations, with a strong emphasis on programs that support those in need or efforts to protect and preserve our natural environment.
Health and safety
Safety is PSE’s foundation. Our culture of safety starts with our employees and our commitment that “Nobody Gets Hurt Today.” That extends to the safety of our customers and communities in our system design and maintenance as well as our outreach, education and preparedness programs.
35/75
ESG strategy and vision 31Jan. 2019
Employee safety program
Our workplace safety program puts significant emphasis on education and training. Topics cover not only safety around the often hazardous equipment and conditions employees work in but also day-to-day issues such as ergonomics. This ensures compliance with all federal Occupational Safety and Health Administration and Washington State Division of Occupational Safety and Health rules to ensure PSE provides and remains a safe and healthy working environment for all employees. PSE vehicles, equipment, and construction practices meet all applicable regulations and codes for worker and public safety.
An executive-level steering committee oversees employee safety performance and programs. Policies are outlined in a comprehensive manual, the “Yellow Book,” which is maintained by PSE’s Safety and Health Department.
As a way of recognizing the importance of safety, the annual employee incentive is tied to performance on goals for safety training, education and performance.
Contractor safety program
PSE maintains a supply chain contract management program that incorporates a safety policy into master service agreements with contractors. Safety is stated as a project condition in every construction contract and a written contractor project specific safety plan is reviewed, accepted, and incorporated into each contract prior to start of construction. Additionally, labor standards and working conditions are governed as part of PSE’s collective bargaining agreements with the International Brotherhood of Electric Workers (IBEW) Local 77 and United Association Local 23. Visitors are expected to follow the same safety requirements as employees. Contractors are contractually obligated to meet safety requirements. Personnel who have need to go to the field and construction sites have personal protective equipment and have been trained in the proper use of PPE. The Contractor Safety Policy has been introduced throughout the supply chain to emphasize the importance of a safety culture.
Contractors working on behalf of PSE are required to submit an incident report to PSE. Safety metrics are incorporated in each major service provider master services agreement with safety statistics reported and measured monthly. PSE tracks safety statistics of its major construction contractors on an ongoing basis. A safety evaluation is conducted to evaluate contractors for capital bid projects and prioritizing emergency call-outs.
Public safety
PSE is commited to building, operating, and maintaining its energy-delivery infrastructure in a manner that will provide a high level of public safety, ensuring employees are committed to following all regulatory requirements governing the design and operations of its utility infrastructure. In addition, we actively participate in public-awareness safety education and commit to responding quickly and prudently to emergency situations.
Our energy-delivery infrastructure is designed and operated in such a manner as to protect the integrity of the system in the event of failures, natural disasters, terrorism or other external actions. The system is also designed to meet or exceed factors of safety and redundancy called for in applicable laws, regulations, and codes.
Under our Public Safety Policy, our employees are directed to report any safety issues in the energy-delivery system or any issues affecting public safety related to the operation and maintenance of the energy delivery infrastructure.
36/75
32 Environmental, social and governance (ESG) report Jan. 2019
Public safety programs
Our customer safety communications team informs customers how to use electricity and natural gas safely, how to best access PSE customer services, and how to prevent damaging underground utilities. We also promote public awareness programs focused on helping individuals and communities prepare for a natural disasters such as a flood, earthquake, or storm.
Electric safety
We communicate the importance of electric safety to our customers including:
• How to steer clear of downed power lines
• How to safely use portable generators
• How to safely use electrical appliances inside homes
• How to properly shut off electricity inside the home
• How to remain clear from overhead power lines to avoid hazardous situations
Natural gas safety
We communicate the importance of gas safety to our customers including:
• How to detect gas leaks and what to do if a leak is suspected
• How to avoid potential hazards with striking or digging around underground utilities
• How to properly shut off gas appliances
• How to properly maintain gas pipelines
37/75
ESG strategy and vision 33Jan. 2019
Serving our customers
Energy resource planning: assurance and reliability
PSE manages and maintains multiple energy policies and strategies dedicated to maintaining reliability and integrity of our energy system, meeting commitments to greenhouse gas emission reductions, and supplying alternative energy resources. The Integrated Resource Plan (IRP) is PSE’s strategic road map to securing reliable and cost-effective energy resources and procuring future energy supplies. It is used as a forecasting tool to assess PSE’s customer energy requirements for the next 20 years and suggest the most viable resource options to meet customer energy needs at the lowest cost and risk.
PSE’s IRP is updated and released every two years to reflect new demand forecasts, changing demographics, market conditions, environmental laws and regulations, and other factors. For each IRP a team of in-house economists, energy specialists, environmental advocates, demographers and other experts:
• Examine the many energy-resource options available to PSE, including the maximum amount of new energy “supply” we can acquire through energy efficiency
• Make a thorough, objective assessment of the benefits, costs and risks associated with each energy-supply option
• Analyze the region’s population and economic trends, including a forecast of PSE customers’ natural gas and electricity needs two decades into the future
• Evaluate political and economic policies and trends, and their potential impact on energy production, usage and availability
Energy resource need considerations
By law PSE’s resource plan forecast represents, “… the mix of energy supply and conservation that will meet current and future needs at the lowest reasonable cost to the utility and its ratepayers.” PSE’s resource planning process starts with an output of a deterministic portfolio optimization model, then incorporates how different long-term economic conditions and other factors affect resource need. Factors considered can include but are not limited to, demand forecast, demand-side resources, additional conservation, natural gas prices, wholesale power prices, greenhouse gas regulation, carbon pricing, regional resource adequacy, renewable resource costs, energy storage costs and availability, and emerging technologies.
Delivery infrastructure investment drivers
Even with load growth being offset by PSE conservation efforts, infrastructure expenditures may stay the same or even increase. This is because load growth is only one of the drivers of infrastructure investment. For instance, aging equipment must be maintained or replaced. Regulatory requirements may require spending on system upgrades or alterations or require us to integrate new generation resources. Public transportation projects can necessitate equipment relocation.
Below are six factors that drive infrastructure investment to better serve our customers. Some can be known in advance, others can be forecasted, and some circumstances arise from external events such as extreme weather, new codes or policies that drive behavior or actions, or new transportation projects as a result of unexpected increased funding.
38/75
34 Environmental, social and governance (ESG) report Jan. 2019
Load growth
PSE’s primary obligation is to serve the gas and electric needs of our customers. When customers turn on the switch or turn up the heat, sufficient gas and electricity needs to be available. Load drives system investment in three ways: as overall system loads, short-term peak loads, and point (block) loads. All of these must be met.
Demands on the overall system increase as the population grows and economic activity increases in our service area, despite the increasing role of energy demand management and conservation. PSE regularly evaluates economic and population forecasts in order to stay abreast of where and when additional infrastructure, including electric transmission lines, substations and high-pressure gas lines, may be needed to meet growing loads.
The gas system is designed to operate more conservatively than the electric system because during a peak event the gas system pressure declines as loads increase. As gas pressure approaches zero, customer equipment is unable to operate as intended, requiring manual intervention by PSE to restore service safely. For this reason, gas outages have much greater public and restoration impacts than electric outages and must be avoided for all but the most extreme conditions. The electric system is more flexible. For short periods of time components can often carry more current than their nameplate ratings call for with no adverse effects, and power restoration following an outage can be achieved instantly if power is rerouted through available switches.
System investments are sometimes required to serve specific “point loads” that may appear at a particular geographic location in our service territory. Electrical infrastructure to serve a computer server facility is one example; gas infrastructure to serve an industrial facility such as an asphalt plant is another.
Reliability and resiliency
The energy delivery system is reviewed each year to improve the reliability of service to existing customers. Past outages, equipment inspection and maintenance records, customer feedback, and PSE field input help identify areas where improvements may be made. Additional consideration is given to system enhancements that will improve resiliency (such as being able to provide a second power line from one substation to another). Some of the investments to improve reliability and resiliency include replacing aging conductors, installing covered conductors (tree wire) and converting overhead lines to underground.
Regulatory compliance
PSE is committed to operating our system in accordance with all regulatory requirements. The gas and electric delivery systems are highly regulated by several state and federal agencies including PHMSA (Pipeline & Hazardous Materials Safety Administration), NERC (The North American Electric Reliability Corporation), FERC (Federal Energy Regulatory Commission), the UTC (Washington Utilities and Transportation Commission) and various worker and public safety regulations. Infrastructure investments driven by compliance requirements include electric transmission projects that are aimed at preventing cascading power outages and system collapse that could extend outside PSE’s system. Gas regulations drive very specific inspection and maintenance activities and often require the replacement of assets based upon age and/or condition.
Peak loads occur when the weather is most extreme. To prepare for these events, PSE carefully evaluates system performance during periods of peak demand each year, updates its system models and compares these models against future load and growth forecasts. This prepares us to determine where additional infrastructure investment is required to meet peak firm loads.
Electric and gas system delivery planning is based on near-term and long-term customer growth forecast updates prepared by the Resource Planning and Analysis department. The forecasts include the impact of conservation efforts and implementation of interruptible rate schedules. Interruptible rate schedules are most commonly employed by commercial or industrial customers due to their ability to provide backup generation for critical load and willingness to tolerate a complete outage for period of time, as PSE must be able to depend on curtailment when needed.
39/75
ESG strategy and vision 35Jan. 2019
Public improvement projects
PSE must respond to city, county and state jurisdictions within our service area when transportation-related public improvement projects impact our facilities both within and immediately adjacent to public rights of way. PSE gas and electric facilities may require relocation or underground conversion of electrical facilities to accommodate public transportation projects. We also work closely with local jurisdictions to identify system improvement opportunities and to minimize surface restoration costs and disruptions in association with these public improvement projects.
Aging infrastructure
With continued maintenance, gas and electric infrastructure can provide safe, reliable service for decades. PSE has a number of programs in place that address aging infrastructure by replacing poles, pipes and other components that are nearing the end of their useful life. Our goal is to maximize the life of the system and at the same time minimize customer interruptions by replacing major infrastructure components prior to significant unplanned failure.
Integration of resources
FERC and state regulations require PSE to integrate generation resources into our electric system according to processes outlined in federal and state codes. A new generation plant, whether it is owned and operated by PSE or by others, can require significant electric infrastructure investment to integrate and maintain appropriate electrical power flows within our system and across the region. For the gas system, integrating gas supply resources owned and/or operated by PSE or others (such as underground gas storage, on-system LNG/propane and peak shaving, and the interstate gas transmission systems) can also require significant infrastructure investment to maintain appropriate system pressures and flows across the region.
Distributed generation—the smaller generation technologies such as roof-top solar panels—must also be reviewed and integrated, often requiring system protection enhancements to satisfy two-way flow requirements. For larger scale systems, these may also require system infrastructure improvements such as new distribution feeders or a substation.
After initial integration, PSE must monitor the impact and influx of these types of resources in order to address any developing power quality concerns and continue to support the desires of customers. The majority of customers who pursue distributed generation today seek to do more than support their own load and desire to sell excess energy back to the utility, which requires additional consideration of infrastructure reliability. Generally, contributions from this type of generation do not occur during PSE’s peak demand necessitating the need for infrastructure to supply peak load in order to deliver reliable service. Storage and control systems to help balance distributed generation limitations are maturing, and as control, communications, delivery infrastructure and energy storage systems are modernized, opportunities to integrate distributed generation more effectively to benefit PSE’s operations will increase.
40/75
36 Environmental, social and governance (ESG) report Jan. 2019
Highlighted strategies under our 2017 IRP include:
Emergence of solar power
Wind has dominated new renewable resource additions in the Pacific Northwest. The 2017 IRP found solar power in Eastern Washington to be a cost-effective renewable resource for the first time.
Energy storage and demand response instead of fossil fuel generation
Energy storage and demand response resources can help push PSE’s need for capacity resources to 2025. This is a low-cost and low-risk strategy that helps avoid locking PSE’s customers into a long-lived fossil fuel plant while alternative technology is evolving rapidly and greenhouse gas policies are being developed.
Redirecting transmission to increase market access
PSE can reassign some transmission from intermittent wind resources to the regional power market (Mid-C market) in a way that will allow PSE to expand its access to short-term bilateral markets on a firm basis, while still allowing us to deliver that wind energy to our customers. Increasing market reliance is a low cost alternative for our customers. The 2017 IRP includes a comprehensive analysis of market risk in relation to the Pacific Northwest’s resource adequacy outlook, built on Northwest Power and Conservation Council (NPCC), Bonneville Power Administration (BPA) and Pacific Northwest Utilities Conference Committee (PNUCC) analyses. It finds the region is nearly meeting its resource adequacy target, and with continued strong conservation programs, it may become even more reliable in the future. This is not without risk, but PSE has analyzed these risks extensively and concluded the risks are reasonable. Redirecting transmission supports the strategy to push out the need for additional fossil fuel plants to 2025, which
should allow rapidly evolving technology to drive down the costs of resource alternatives and provide time for uncertainty in greenhouse gas regulation to be resolved.
Energy efficiency
Devoting significant resources to help our customers use energy more wisely is a proven way of reducing costs and the environmental footprint of PSE's operations as well as those of our customers'.
Natural gas utility resource plan
Strategic agility is also the hallmark of the natural gas utility resource plan. Continued conservation investment, completion of the Tacoma LNG peaking facility and the option to upgrade PSE’s propane peaking facility (SWARR) push out the need to lock our natural gas customers into lengthy contracts to expand regional pipeline infrastructure. Again, this is a low-cost and low-risk resource strategy for our gas customers.
2017 Integrated Resource Plan (IRP)
The resource plan forecast in the 2017 IRP signaled important changes in energy supply. The forecast relies on additional transmission to market to meet peak capacity need, continued strong investment in conservation, utility-scale solar to meet renewable resource need, and energy storage. While many of these changes have been on the horizon for some time and discussed extensively in the media and by advocacy groups, this is the first time that some appear to truly be part of a low cost, low risk resource plan for PSE’s customers.
41/75
ESG strategy and vision 37Jan. 2019
Other customer programs
Grid modernization
Our current electricity grid was conceived more than 100 years ago when our energy needs were simpler. PSE is in the process of upgrading its delivery system infrastructure to modernize the grid. This includes so-called “smart grid” enhancements, but also projects that ensure the grid is safe, reliable, resilient and flexible.
Replacement of legacy analog networks and obsolete remote telemetry unit equipment began in 2010 and is expected to be completed within the next five years. This includes modern, IP-based SCADA networks that will be used to control and monitor substation, transmission and generation assets, and replacement of aging Automated Meter Reading (AMR) communications systems and electric customer meters with Advanced Metering Infrastructure (AMI) that enables two-way communication. These steps are necessary to build the foundation to efficiently integrate maturing technologies.
Among those we are integrating and studying are distributed generation, energy storage, conservation voltage reduction and demand response. While PSE expands integration of these alternatives, we will need to be mindful of the dependability of the technology under all conditions such that customer reliability and rates are not harmed by technologies and applications that are not effectively scalable. Additionally, the technologies and integration must be compatible with existing grid standards and tariffs. This makes informing customers and stakeholders about the capability and viability of these technologies an important priority for PSE.
Increase comfort, reduce heating costs
For your home
Community services agencies PSE works with local community services agencies to administer the HELP and weatherization programs. Contact the participating agency in your county or city:
Call 1-866-223-5425 for other languages.
pse.com/assistance
Island CountyHELP and Weatherization Assistance: The Opportunity Council 360-679-6577 or 1-800-317-5427oppco.org
King CountyHELP: Multi-Service Center (for South King) 253-517-2263
Hopelink (for North and East King) 425-658-2592 hopelink.org/energy
Byrd Barr Place (Seattle residents) 206-486-6828 byrdbarrplace.org
Weatherization Assistance
King County Housing Authority206-214-1240kcha.org
Seattle Office of Housing 206-684-0244 seattle.gov/housing
Kitsap CountyHELP and Weatherization Assistance: Kitsap Community Resources HELP: 360-479-1507Weatherization: 360-473-2045kcr.org
Kittitas CountyHELP and Weatherization Assistance: HopeSource 509-925-1448hopesource.us
Lewis CountyHELP and Weatherization Assistance: Community Action Council of Lewis, Mason and Thurston counties HELP: 360-736-1800 ext. 4100 Weatherization: 360-438-1100 ext. 2100caclmt.org
Pierce CountyHELP: Pierce County Human Services (County residents) 1-855-798-4328piercecountywa.org
Metropolitan Development Council (Tacoma residents) 253-572-5557mdc-tacoma.org
Pierce County Human Services (County Residents) 253-798-4400 ext. 3 piercecountywa.org
Skagit CountyHELP: Community Action of Skagit County 360-428-1011
Weatherization Assistance: Housing Authority of Skagit County 360-757-6509
Snohomish CountyHELP and Weatherization Assistance: Snohomish Human Services Department HELP: 425-388-3880 Weatherization: 425-388-7205snohomishcountywa.gov
Thurston CountyHELP and Weatherization Assistance: Community Action Council of Lewis, Mason and Thurston countiesHELP: 360-438-1100 ext. 1144 Weatherization: 360-438-1100 ext. 2100caclmt.org
Whatcom CountyHELP and Weatherization Assistance: The Opportunity Council 360-255-2192 or 1-888-586-7293oppco.org
6442 10/18
Low income assistance
To help customers with limited incomes increase comfort in their homes and reduce heating costs, we offer two programs administered by local agencies in partnership with PSE:
• Our Weatherization Assistance Program provides funding support for weatherization services that can reduce household energy bills by 25 percent and the need for assistance with utility bills.
• Our HELP (Home Energy Lifeline Program) provides additional bill-payment assistance beyond that offered by the federal LIHEAP (Low-Income Home Energy Assistance Program) program. Households eligible for LIHEAP are income eligible for weatherization assistance services. The program offers eligible customers up to $1,000 in credits per year in payment assistance toward their energy bill.
42/75
38 Environmental, social and governance (ESG) report Jan. 2019
Customer satisfaction
Customers are central to what PSE does and how we do it. They’re in our corporate values--“we do what’s right and we seek the best outcomes for our customers and community.” And customers are PSE’s “north star,” serving as a guide for employees in all projects and efforts.
PSE uses a variety of methods to track customer satisfaction. We regularly conduct polling with our customers. We use J.D. Power to benchmark against other utilities, and are currently one of six national combination utilities with first or second quartile satisfaction scores in all residential and business customer surveys. We also have a service quality index (SQI) with nine measures. SQIs are reported annually to the UTC and are a quantitative factor in annual employee incentives. Our employees
Workplace policies
PSE is committed to maintaining a work environment free of violence or harassment or discrimination of any kind, including harassment based on race, color, gender, sex, sexual orientation, age, religion, creed, national origin, marital status, veteran status or disability. Violence and threatening behavior are not tolerated by the Company and employees are expected to treat one another with mutual respect and dignity.
We fully comply with all federal, state, and local employment laws and prohibit unlawful discrimination in the recruiting, hiring, compensating, promoting, transferring, training, downgrading, terminating, laying off, or recalling of any person based upon race, religion, creed, color, national origin, age, sex, sexual orientation, gender identity, marital status, veteran or military status, the presence of a disability, or any other characteristic protected by law.
Fair labor
PSE maintains policies committed to following all applicable minimum wage, overtime wage, child labor, and other wage and hour laws and regulations. Our hiring policies comply with the principles of nondiscrimination, freedom of association, child labor, indigenous rights, forced and compulsory labor, and other labor laws.
Tours and recreation
PSE provides for tours and recreational access to its facilities including:
• Wild Horse Wind and Solar Facility
• Snoqualmie Falls Hydroelectric Project
• Baker River Basin
• Lower Snake River Wind Facility
• Hopkins Ridge Wind Facility
43/75
ESG strategy and vision 39Jan. 2019
Employee wellness program
PSE maintains a wellness program that offers a wide range of resources and tools at little or no cost to employees and their families, including company-sponsored wellness events and ongoing health and wellness communications.
Employee satisfaction
PSE has been conducting the Great Place to Work survey since 2001 in an ongoing effort to create a culture that supports company values and enables PSE to do its best work on behalf of its customers and communities.
Professional development and tuition reimbursement
PSE has multiple training programs and modules designed to educate employees on an assortment of health and safety practices and certifications, corporate ethics and compliance, environmental awareness and regulatory compliance, and emergency preparation and response. We also offer employees a tuition reimbursement program for relevant education opportunities.
Military and veteran support
The PSE Patriots and Supporting Charities’ (PSE2) objective is to aid in recruitment, retention and development of military veterans. We also support military veterans through communication, recognition, mentoring, community outreach, and support of families during deployment.
Customer and community outreach
PSE has dedicated teams of employees who work on a daily basis with customers, government representatives and agencies, and local organizations. In addition to these employees, there are hundreds of employees who take advantage of PSE-sponsored volunteer opportunities in their local communities.
44/75
40 Environmental, social and governance (ESG) report Jan. 2019
Community outreach
PSE’s Outreach teams work to promote customer awareness of PSE’s major projects and products and services through direct engagement and partnerships at the local level. Their mission is to empower customers to control their energy costs through participation in energy efficiency programs, to educate customers about PSE products and services, and to strengthen community-based programs through relationships with customers and other parties.
Major projects outreach
PSE engages the community, jurisdictions, tribes and stakeholders as we develop large scale projects. Providing project specific information helps the community understand the project need, what’s being proposed and what it might mean to them. Outreach tools include community meetings, routing workshops, public open houses and online open houses, web pages, community mailers, surveys and comment cards.
Depending on the scope and complexity of the project, community advisory groups may be formed to capture the area’s diverse interests. The goal is to share system needs and potential solutions, to identify and assess community values in the context of the project attributes, and to develop recommendations for PSE’s consideration.
An example is our Energize Eastside project. The Energize Eastside project will improve electric infrastructure that had its last major upgrade in the 1960s. Since then, the population has grown eightfold and the economy depends on reliable power in ways it did not 50 years ago.
PSE is conducting a multi-year outreach effort for Energize Eastside to share information and collaborate with local cities, residents, businesses. That includes forming a Community Advisory Group with public meetings and project briefings with stakeholders, neighborhoods and cities about the project details as well as address public questions and concerns.
Volunteering, community service and corporate giving
In the last decade, PSE has contributed more than $17 million to the community through PSE, our separately-funded Puget Sound Energy Foundation, and employee contributions and volunteer efforts. Organizations supported range from United Way, the American Red Cross and Food Lifeline to Forterra and the Mountains to Sound Greenway.
TeamPSE
TeamPSE is an individual or group of PSE employees and retirees (and their families and friends) who give their time to local causes they care about, including building homes for Habitat to Humanity, trail restoration, food bank sorting and more.
Powerful Partnerships
Each year, PSE selects a group of nonprofits for a year long collaboration. Since the program was started in 2016, PSE has partnered with 42 local organizations and invested almost $400,000 to help these organizations achieve their goals.
2018 Partners
45/75
ESG strategy and vision 41Jan. 2019
PSE Foundation
Puget Energy, the parent company of PSE, created the Puget Sound Energy Foundation in 2006. The foundation makes charitiable contributions to qualifying 501(c)3 nonprofits to help support a broad range of community programs, with a special focus on emergency preparedness and environmental sustainability. None of Puget Sound Energy Foundation funds come from PSE customers.
Most recently, the foundation wrapped up a multi-year, $1 million initiative that funded generators at locations in 12 communities that can become emergency shelters or warming centers, or are currently food distribution centers.
46/75
42 Environmental, social and governance (ESG) report Jan. 2019
Conclusion
We do what’s right and we seek the best outcomes for our customers and community.
As this report shows, we live this value through our environmental, social and governance programs. We’re proud of our track record. More important, though, we’re committed to continuing to be a leader and a responsible steward of resources. In this way, we can continue to serve our customers for years—and decades—to come.
47/75
OLYMPIC WORKFORCE DEVELOPMENT COUNCIL (OWDC) EXECUTIVE COMMITTEE SUMMARY
July 27, 2021
ATTENDANCE: Marilyn Hoppen, Aschlee Drescher, Monica Blackwood, Chris Abplanalp Staff: Elizabeth Court, Alissa Durkin, Doug Washburn
The Olympic Workforce Development Council’s (OWDC) Executive Committee meeting was held on Tuesday, July 27, 2021 via Zoom.
APPROVAL OF SUMMARY
The Executive Committee’s Meeting Agenda was approved as follows:
ACTION: Aschlee Drescher moved to approve the Agenda as presented. Motion was seconded by Monica Blackwood.
Motion carried unanimously.
The Executive Committee’s Meeting Minutes were approved as follows:
ACTION: Aschlee Drescher moved to approve the April 27, 2021 Executive Committee Minutes as presented. Motion was seconded by Monica Blackwood. Motion carried unanimously.
DISCUSSION
Executive Membership and Vacancies • The Executive Committee currently has a vacant position under Business
Community Member.• Send nominations via email to Elizabeth Court.
on Friday, July 23, 2021.• Follow-Up Services are authorized to begin after a WIOA Title I(Adult,
Discloated Worker, and Youth) participant program completion (exit) intounsubsidized employment, for at least a period of 12-months after the firstday of employment.
• Follow-Up Services include Career Services and Supportive Services.
Economic Security for All grant
Attachment 10.a 48/75
• The OWDC has been awarded federal WIOA grant, Economic Security forAll, in the amount of $385,083.25.
• OWDC awarded the funding to youth provider, Olympic EducationalService District 114, in the amount of $345,575.00.
• OESD 114 will use the funding to strengthen partnerships in the regionand provide WIOA eligible youth, with coaching, mentorship and support,leading towards employment at wages above $34,480.
• Partnerships include local housing, childcare, healthcare, higher-ed, andhuman services providers in the community.
The State of the Nation’s Housing 2021 • Households that weathered the crisis without financial distress are
snapping up the limited supply of homes for sale, pushing up prices andfurther excluding less addlient buyers from homeownership.
• Millions of households that lost income during the shutdowns are behindon their housing payments and are on the brink of eviction andforeclosure.
• These at-risk households include renters with low income and people ofcolor.
• Additional government support will be necessary to ensure all householdsbenefit from the expanding economy.
WOIS/The Career Information System-Private, Nonprofit Organization • Source for current, complete career and college planning tools.• Access to detailed career descriptions, college training program
descriptions, and nationwide college descriptions.• Provides four career assessments, national school search, budgeting tools
showing careers that support a preferred lifestyle, careers and educationalprograms arranged by clusters and activities and worksheets to guideexploration activities.
In-Person Services • Clallam and Kitsap WorkSource centers are appointment basis.• Screening at front door• Masks required• Resource room accessible• Desk-side appointments with case managers and plexi glass dividers.
EO Focus • Equal Opportunity Spring Conference July 26th and 27th.
49/75
• Conference agenda items included EO monitoring, complaintinvestigations, program complaint policy with state monitors, and NW ADACenter Training.
Sequim Office Update • New WorkSource center is on schedule for a move in date of October
2021.• Framing completed and roof began week of July 26th.
UPDATES
PY20 Q4 Formula Performance Reports • Enrollments and Expenditures are below targets however, staff remain
resourceful in marketing and outreach of all services and resourcesprovided at WorkSource centers to community members andemployers.
• Looking forward to the end of the Unemployment Benefit extensionsand start of the new program year.
Achievement Recognition Letter Equal • OWDC received letter from Employment Security Department
recognizing teams positive performance on outcomes for Quarter 1ending March 31, 2021.
Calendar • Until further notice from the Department of Health, the Executive
Committee meeting will remain via Zoom.
ADJOURN
There being no further business to come before the committee, the meeting was adjourned at 10:33 a.m.
Next Meeting: Tuesday, October 26, 2021, via Zoom
50/75
EXECUTIVE COMMITTEE
CHAIR- MARILYN HOPPEN, SVP Human Resources, Kitsap Bank
VICE CHAIR, JULIE HATCH, Manager Kitsap Bank, Port Angeles
JESSICA BARR, Regional Director Washington State Employment Security Dept.
MONICA BLACKWOOD, President WestSound Workforce
ASCHLEE DRESCHER, Human Resources The Veterans Administration
ROBIN HAKE, HR Director City of Port Townsend
DAVID MCMAHAN, Vice President Olympic Labor Council
LISA DONLON, General Manager Windermere Commercial
GREG DRONKERT, President Pacific Mobility Group, Inc.
CORDI FITZPATRICK, Human Resources Mgr. Port Townsend Paper Corporation
KEVIN GALLACCI, General Systems Manager Clallam Transit Systems (Ex Officio)
MICHELL GRAFF, Kitsap Community Resources Employment & Training Division Director
SARA HATFIELD, CTE Director South Kitsap School District (Ex Officio)
NEAL HOLM, IBEW Local 46 Electrician and membership Development
ASHELEY JACKSON Easter Seals Workforce Development Dir.
PETER JOHNSON, Human Resourced Director McKinley Paper Corporation
BRIAN KUH, Deputy Director Team Jefferson (Ex Officio)
HEIDI LAMPRECHT, Co-Founder Paella House
GINA LINDAL, Administrator CSO, DSHS
GREG LYNCH, Superintendent Olympic Edu. Service Dist. #114
COLLEEN MCALEER, Director Clallam Economic Development Corp.
CHUCK MOE, Field Representative Laborers Local 252
GILLIAN NIUMAN, Human Resources Town and Country Markets
ANNA REYES POTTS, General Manager TMF Inc.
LEANNE RAINES, Supervisor Dept. of Vocational Rehabilitation
JEFF RANDAL, Board of Commissioners Jefferson County Public Utility District
LUKE ROBINS, PhD, President Peninsula College
MORGAN SNELL, Jamestown S’Klallam Tribe Higher Education and Professional Development Coordinator
DANNY STEIGER, CEO Angles Mill Works and Lumber Traders
MATT WHEELUS, Chief Operating Officer Harrison Hospital
Olympic Workforce Development Council Operations Committee Meeting
Tuesday, May 11th, 2020 9:00 a.m. – 10:00 a.m. Microsoft Teams meeting
______________________________________
A G E N D A
1. Call to Order
2. Approval of Meeting Minutes from May 11, 2021 (Att. 11.b) pg. 52
3. Discussion Item(s)/Action Item(s)
a. ESD Monitoring December
b. OWDC Operational Partner Highlight (Att. 11.c) pg. 54
4. Performance Reports
a. OWDC Performance Report PY20 Q4 (Att. 11.d) pg. 62
b. WIOA Primary Indicators of Performance Report (Att. 11.e) pg. 63
c. WorkSource System Performance Dashboards PY20 Q4 (Att. 11.f) pg. 66
5. Good of the Order
6. Agenda Items for next meeting
Adjourn
Next Meeting: November 9, 2021 Microsoft Teams
51/75
Operations Committee Minutes Olympic WorkSource Development Council
May 11, 2021
ATTENDEES –Michael Robinson, Gina Lindal, Jessica Barr, Anna Winney, Amy Hatfield, LeAnn Raines, Selena Cunningham, Evan Salveson, Brian Kneidl, and Staff Luci Bench
1. INTRODUCTIONS2. CALL TO ORDER – Mike Robinson, called the meeting to order at 9:02 a.m.3. MINUTES –Anna Winney moved to approve February 9th meeting minutes. Amy Hatfield
seconded. Motion carried.4. DISCUSSION ITEMS
a. ESD Monitoring: During the March ESD Monitoring, all subrecipients did very well with onlyquarterly demographics review as an action item. The virtual format was a struggle, but a lotof lesson’s learned. Greg Ferland, ESD Monitoring Manager, letter of completion expected within the next couple of weeks. Letter will be shared out once available.
b. OWDC Operational Partner Highlight• New OWDC Operational Partner report out format for operations meeting to
support a greater system review of effectiveness.• Gina Lindal, DSHS Community Services Division, summarized her OWDC Operations
Partners submission.• Mike summarized Goodwill of Olympics and Rainier Region submission.• Selena Cunningham introduced Department of Services for the Blind and
summarized their submission.• LeAnne Raines, Division of Vocational Rehabilitation presented her submission and
provided a summary.• Evan Salveson, Kitsap Community Resources, summarized submission and shared
outcomes from In-Person Hiring Event on May 7th. Businesses are desperate forapplicants. KCR is working closely with businesses and participants to get peopleinto jobs.
• Mike summarized WorkSource Kitsap, Clallam and Jefferson services and initiatives,summarizing his submission.
• Brian Kneidl, Peninsula College, Welding and Construction on-campus otherwise allonline and looking forward to returning in the fall. College has been helping withlaptops and internet access. Trying to connect with technological challengedstudents has been a struggle, but a lot of lessons have been learned.
• Amy Hatfield, Olympic College, very similar to Peninsula, with a few on-campuscourses. Enrollment is open and they are trying to reach students with no access totechnology. 25th Annual Career Fair on May 5th focused on exploring diversity andwho had access to laptops, hotspots, data sticks and food pantry. OC focus oneconomic recovery, technology access, adult education, digital literacy. Focus on
52/75
Equity, diversity, inclusion and belonging national discussion in higher education and here at OC.
c. Integrated Service Delivery (ISD)• Reviewed, no comment.
d. OWDC Performance Report PY20 Q3Reviewed, no comment.
e. WIOA Primary Indicators Performance Report PY20 Q3• Reviewed, no comment.
f. WorkSource System Performance Dashboards PY20 Q3• Reviewed, no comment.
5. Good of the Ordera. None
6. ADJOURN – Mike adjourned at 9:57am.
NEXT MEETING – September 14th, 2021 via Microsoft Teams
53/75
OWDC Operation Partners
September 14, 2021
DSHS, Community Services Division (CSD) Office Administrators:Bremerton CSO- Gina Lindal Port Angeles & Forks Branch Offices- Jim Weatherly Port Townsend CSO- Jeannie Dickinson
Office Sites Serving Kitsap, Clallam, & Jefferson Counties All services from the Bremerton, Port Townsend, Port Angeles and Forks Branch Offices can be accessed remotely by calling our Customer Service Contact Center at 1-877-501-2233 or online at washingtonconnection.org
Serves, Workshops, & Participants CSD provides programs and services to help low-income people meet their basic needs and achieve economic independence through programs such as the Temporary Assistance for Needy Families (TANF), or Aged, Blind and Disabled (ABD), and Housing and Essential Needs (HEN) programs or Food Assistance, Medical and other employment-focused services. Programs such as these currently serve 38,532 Food Assistance; 2,437 TANF; 859 ABD; and 125 HEN clients living in Kitsap, Clallam and Jefferson counties.
*E-MAPS July 2021 Client/Caseload Data
Initiatives SNAP Increase- Effective October 1, 2021, Supplemental Nutrition Assistance Program (SNAP) allotments will see the largest permanent increase in the program’s history. This COLA increase will replace the temporary 15% increase to Basic Food allotments that has been in place since January 2021. The following increases will be effective 10/1/21
EBT Expungement for Unused Benefits- On August 22, 2021, unused benefits will start being expunged from EBT accounts after 274 days. In December 2018, Congress passed the Agriculture Improvement Act of 2018 (Farm Bill) and included a new requirement for states to expunge, or remove, unused benefits from EBT accounts after 274 days instead of the previous 365 days of non-use. Clients’ benefits that are more than 274 days old will be automatically expunged from their accounts and no longer available. This is for all cash and food programs that utilize EBT cards as their issuance methods. A letter has been mailed to all affected households informing them of the change.
54/75
WorkFirst Mandatory Participation- Effective September 1, 2021, WorkFirst mandatory participation requirements resume. WorkFirst mandatory participation requirements and WorkFirst sanction penalties have been temporarily suspended since March 16, 2020, due to the COVID-19 pandemic. In early August, CSD sent notice to all adult TANF/SFA recipients explaining that the suspension of mandatory WorkFirst participation requirements is ending and participation will be mandatory again in September. We also made automated calls to these households with similar information about the change.
Olympic College
Amy Hatfield, Dean for Workforce Development and Basic Studies [email protected]| 360-475-7264
Pandemic Update Olympic College declares “fully-vaccinated” status and requires masks Governor Inslee’s requirements for Higher Education continue to evolve. For current information please visit the Olympic College COVID-19 webpage. Student Assistance The availability of grant funding means that many Olympic College students can attend Fall Term with little out-of-pocket expense and money to spare. Higher Education Emergency Relief Funds (HEERF) Olympic College will disburse about $5 million in grant funds to students attending college this fall and beyond. Earlier this year the college received $5.3 million in HEERF from the federal government and began making awards this summer. There are numerous other grants available to Olympic College students this fall as well.
Housing Assistance Grant: If you are struggling to pay your rent or mortgage, the Olympic College Foundationmay be able to assist you. Complete this form to begin the conversation with the Students in NeedGroup. Complete the form now!
Student Emergency Assistance Grant (SEAG): If you are struggling financially and have limited resources to meetyour needs, you may qualify for a SEAG grant. Complete the form now!
Washington College Grant: Funding is available for many families making under $97,000/year. Complete theFAFSA to find out how much you qualify for.
Workforce & Economic Development The Washington State Board for Community and Technical Colleges administers numerous state and federal grants. The Division continues to pursue new opportunities for our students, faculty, and staff. FY22 SBCTC Grants and Allocations awarded to date - $2,818,687. FY22 grant applications currently submitted and pending approval - $249,202
WorkFirst Student Supports Funds - $33,300 ~ Perkins Special Project (Outdoor Preschool) - $6,853 Basic Food, Employment and Training (BFET) - $203,799 ~ BEDA Special Projects - $5,250
Program Development Under development – Marine Electrical, Digital Filmmaking Documentary Certificate, Drone Certificate, Aviation Agreement with Green River College
LeAnne Raines, M.M. Olympic Unit Supervisor (Kitsap, Jefferson and Clallam counties) 206-327-2242 (work cell)
DVR is a statewide resource assisting people with disabilities to prepare for, secure, maintain, advance in, or regain employment. DVR partners with organizations and businesses to develop employment opportunities. DVR serves people who seek meaningful, secure employment but whose disabilities may result in one or more barriers to achieving an employment goal. Contacts: LeAnne Raines, M.M., Olympic Unit Supervisor, 206-327-2242 (work cell). Tricia Burks, Lead Vocational Rehabilitation Counselor, 360-535-9460
Office Sites Serving Kitsap, Clallam, & Jefferson Counties Silverdale DVR, 3888 NW Randall Way Suite 201, Silverdale WA 98383-7847, Phone: 360-698-4360
Silverdale Work Source, Phone: 360-535-9460
Port Townsend, 2507 Evans Vista, Port Townsend, WA 98368, Phone: 360-302-3472 Port Angeles, 203 W. 1st ST, Port Angeles, WA 98362
Serves, Workshops, & Participants DVR serves individuals with who:
1) Have a disability that creates a significant impairment which interferes with the ability to work and2) Requires vocational rehabilitation to obtain and maintain employment3) DVR works with adults and students with disabilities.
Success Stories
DVR has worked with customers reach their goals of employment (obtain, maintain or regain employment). We had two customers who were hired making more than $100,00 per year.
Office Sites Serving Kitsap, Clallam, & Jefferson Counties KCR in Port Orchard, 3200 SE Rainshadow Ct KCR in Bremerton, 845 8th Street
Initiatives
New WIOA program manager, Sarah Knox, worked to create a training binder and onboarding procedures to help new staff understand start to finish policies and practices regarding WIOA. We are already seeing the value to having taken these actions, as we continue to experience staff turnover and new hires. Sarah also created a support service funding chart based on income guidelines to help with equitable and consistent distribution of financial assistance via training dollars to client’s requesting more than $500. We have held two in-person job fairs; our goal is to host one each quarter. The responses from businesses we invite are very positive and have given KCR WIOA ongoing opportunities to create new community partnerships while reestablishing previous partnerships. Case managers continue to do weekly WIOA outreach/education by posting flyers at various community centers and public places, along with weekly social media pushes.
KCR Employment & Training continues to rock the GED scene with yet another completion in August. We hope to re-start Fresh and Healthy Cooking for Your Family classes in October, and we look forward to the DSHS TANF WorkFirst participation exemption ending in September. Our Business Support and Training (BE$T) classes will also resume in person classes with a new instructor, Jon King, in September. Demand has been high for these classes, and we already have a wait list for the following eight-week session; start date not yet determined.
Employment Security Department
WorkSource Administrator Mike Robinson Email: [email protected] Ph: 360-277-8684
Office Sites Serving Kitsap, Clallam, & Jefferson Counties WorkSource Clallam – Comprehensive Service One-Stop Center, Port Angeles, Serving Clallam, and Jefferson Counties
WorkSource Kitsap - Comprehensive Service One-Stop Center, Silverdale, Serving Kitsap County
Services, Workshops, & Participants Services:
Both sites provide comprehensive employment and business services for job skills, employment and
readiness training services to job seekers and employers.
• Service provider of Title I Adult and Dislocated Worker WIOA contracts (See performance metrics) attached.Workforce development/employment workshops, employment assessments and career guidance, resources forworker training/retraining, on-the-job training, and support services. Priority of Service is focused on recipients
of public assistance, or other low-income individuals, and individuals who are basic skills deficient, and face barriers to employment.
• Service Provider Title III Wagner Peyser re-employment services, employment assessments, career guidance, jobmatching, workforce development/employment workshops, business services and labor market information.The employment service seeks to improve the functioning of the local labor markets by bringing togetherindividuals seeking employment with businesses seeking workers.
• Service provider of Jobs for Veterans State Grants – Supports Disabled Veterans Outreach Program, and LocalVeteran Employment Representative services. DVOP specialists provide individualized career services toveterans with significant barriers to employment, with the maximum emphasis directed toward serving veteranswho are economically or educationally disadvantaged. Local Veterans' Employment Representatives conductoutreach to employers and business associations and engage in advocacy efforts with hiring executives toincrease employment opportunities for veterans and encourage the hiring of disabled veterans.
• Service provider for 3 DSHS contracts/services - WorkFirst and Strategies for Success, and Financial Capabilities
Workshops: All count as a job search activity
• WIOA Title I – Orientation to WIOA – Assist customers with WIOA overview of services and application process.• Wagner Peyser Title III Labor Exchange - Re-employment services that support UI claimants who are selected for
Reemployment Services and Eligibility Assessment activities.• WP LEX staff are providing Orientation to Virtual WorkSource Services.• Reentry workshops within DOC facilities, statewide (virtually) and Starting Over: Employment After
Incarceration.• Surviving Job Loss – Launched in May, prepares participant to recognize and manage the emotional impact of
job loss that can have an impact on self and others. Identifying resources available and practical steps to prepareto move on to the next phase in career transition.
• WP LEX Business Services - Supporting employers, organizing, scheduling, and producing virtual job fairs and inperson hiring events. Large size events on hold until safe to do so, keeping as single employer events.
• USAJOBS Workshop – ESD staff collaborate and facilitate a workshop aimed to assist applicants on the federalapplication and resume process and how to obtain federal employment. Offered twice per month.
• Strategies for Success – A series of 20-hour, life-skills workshops. Each of the six modules are four days long.• Financial capabilities - Explore how your personal view and perception of money and income can affect how well
you manage it. Also, learn about sources and timing of income.• Mock Interview Sessions – Prepare job seekers with the confidence and abilities to successfully navigate in-
person and virtual interviews.• Veterans Orientation to WorkSource Services – Led by veterans for veterans and military spouses to connect
with employment and training services. In the works is a Veterans Job Club where employers will be able tomeet with participant and discuss workforce development issues, needed skills, employment opportunities andnetworking.
• WorkSource Virtual Job Club (In Development)- Successful job seekers network, listen and learn. Participants willshare strategies that have been successful in the past, per mentored, employer and training institutions will beencouraged participate. Highlights include Goal setting and accountability. Learn tested job search skills,brainstorm challenges. And provides social and emotional support so that they do not have to go it alone.
Success Stories Title III Wagner Peyser Labor Exchange Services:
• Case 1, PUA enrollment:The customer contacted ESD staff through the Kitsap office on June 14, stating she was having trouble filing for aPUA claim. She is a 76-year-old independent businesswoman and had not realized she could file for a PUA untilrecently. She wanted the claim backdated as far as possible, since her work had suffered since the onset ofCOVID restrictions, we informed her the farthest back we could go was the week ending in December 12, 2020.
59/75
For some reason, the current week populated on the ineligible UI claim, while the others all populated into the PUA claim. Over the next several weeks, staff had recurring contact from the claimant, trying to overcome technology issues, primarily. She had an identity issue come up, and staff provided her the contact numbers to OSI, and gave her instruction on how to upload her ID documents. Once the ID issue was resolved, staff helped her figure out how to move the one odd weekly claim from the UI claim into the correct PUA claim, with the approval of the UI lead, and gave her repeated assistance with figuring out how to file a weekly claim. Just three weeks later, with the assistance of the entire UI team, including leads and OSI, $14,615 were deposited into her accounts by July 2, which helped her keep her business from failing. She is currently working on new projects, as the release of COVID restrictions has spurred business back into production for her.
• Case 2, Hardship (Able and Available)Claimant had an open Able and Available issue from October 2020 that had no end date holding her payments.The issue at the time, according to the case description, was a COVID diagnosis, and she had answered fact findingquestions. Claims dating back to February 20, 2021, were awaiting the decision, which dated back more than 16weeks. Staff submitted the hardship request. Checking it later, we noticed it was denied, due to no response fromthe claimant. Staff also noticed in the notes that the claimant had called the claims center and stated that thenumber that was given in the adjudicator’s voice message was not working, and there was a request for a secondcall back. Staff reached out to the adjudicator to see if the second call back had been attempted, and the amazinglythe adjudicator decided to open the case to give the claimant a second chance at connecting, before having to filean appeal. The claimant was able to speak with the adjudicator that same day, and by July 2, $6,100 were released into her funds, which essentially helped her avoid homelessness.
• Case 3, Hardship (Worker’s Comp)The hardship request for this Worker’s Comp issue was submitted and approved for escalation in late May, but aglitch in the system negated the request, temporarily. When it was revisited, the next day the issue was clearedand $18,644 were released into the claimant’s account.
Jobs for Veterans Grant Program66-year-old disabled homeless veteran enrolled into DVOP services on 7/19/21 and veteran received job offeron 9/1/21. Worked with employer to promote this veteran and assisted employer with taking advantage ofavailable federal and state incentives. Veteran received full array of employment services, resume, cover letter,interview skills, computer skills, etc., as well as assistance with securing VA assisted housing, food security andmedical services. Veteran relates being very happy with whole process and is very excited about new position asDispatcher for Parrish Trucking, Inc. Starts work on 9/13/21.Former VA VRE DVOP case, career military veteran-service connected at 90% rate. veteran wanted to explorepossibility of advancing into position that would increase opportunities to serve the members of his communityand upward employment mobility. Current employment is high stress and has little opportunity to move upwithin organization. At this same time ESD was recruiting for a WorkSource Specialist position in the Clallamoffice. Assisted veteran with updating resume and developing Cover Letter, updating WorkSourceWA accountand applying online. Coached veteran in Interview skills and supported him through the waiting for word backphase. Veteran was offed an interview and was successful, offered tentative employment with ESD WorkSourceClallam and expected start date is October 1st, 2021. Very excited to welcome him to the ESD Team and knowthat we drafted an outstanding candidate, who will continue to serve our community with distinction.
Initiatives Focus on Equity through Diversity Equity and Inclusion – Currently ESD leadership staff are drafting a Regional Strategic Plan which includes Equity Training for all ESD staff at every level. Leadership and staff participate widely in community BIPOC and EI forums to learn best practices and provide awareness of WS services.
Supporting Staff through Employee Engagement and Work Life Balance – Accommodations are in place to allow some staff to continue working from home using reasonable accommodation process. All staff have the opportunity to work from home to support work life balance on a need basis while we recalibrate our offices, moving towards a culture that supports opportunity to WFH.
60/75
Making Technology Work – Although we are not providing in person workshops, we have developed a process to allow customers to utilize Smart Boards, big screen TV’s or laptops to connect to virtual workshops, including jobseekers needing technology to participate in virtual interviewing.
Re-opening WorkSource Centers – ESD, along with partners at OESD114 and the WDC have developed plans that started with a slow phased approach to returning staff to the offices and providing services by appointment only and focusing on safe screening, physical distancing, and reduced occupancy levels to provide a safe environment. Provided Plastic barriers (sneeze guards) masks, additional cleaning, hand sanitizer, plastic gloves, and cleaning sipes. Created a climate of caution and acceptance/tolerance for reporting incidents, contact tracing, and response. The customer is advised of protocols while establishing appointments and agree to follow precautions.
Due to reduced staffing WorkSource Clallam offers in-person appointments and resource room usage twice per week, while virtual services remain available M-F 9-4:45 weekly. WorkSource Kitsap, offers 5 days per week in-person availability and resource room access. The Resource room technology access is by appointment, 50% capacity, offering A.M. and P.M sessions.
Employment Security Department is an equal opportunity employer/program. Auxiliary aids and services are available upon request to individuals withdisabilities. Language assistance services for limited English proficient individuals are available free of charge. Washington Relay Service: 711.
Datalastrefreshed:8/19/202140535PM
68/75
EXECUTIVE COMMITTEE
CHAIR- MARILYN HOPPEN, SVP Human Resources, Kitsap Bank
VICE CHAIR, ASCHLEE DRESCHER, Human Resources The Veterans Administration
JESSICA BARR, Regional Director Washington State Employment Security Dept.
MONICA BLACKWOOD, President WestSound Workforce
CHUCK MOE, Field Representative Laborers Local 252
CORDI FITZPATRICK, Human Resources Mgr. Port Townsend Paper Corporation
COUNCIL MEMBERS
DR. KAREEN BORDERS, Executive Director West Sound STEM Network
OLYMPIC WORKFORCE DEVELOPMENT ECONOMIC DEVELOPMENT & BUSINESS COORDINATION COMMITTEE MEETING MINUTES
9:00 a.m. – 9:50 a.m. Tuesday, May 11, 2021
Via Webex In attendance: Christopher Abplanalp, WorkSource Monica Blackwood, WestSound Workforce Kevin Gallacci, Clallam Transit System
1. Call to OrderMeeting called to order by Christopher Abplanalp, at 9:06 AM
2. Introductions3. Approval of Agenda (Attachment)
No quorum.4. Approval of February 9, 2021 Summary (Attachment)
No quorum.5. Action Item(s)/Discussion Item(s)WorkSource Employer Services, hiring events and emerging opportunitiesChristopher Abplanalp, WorkSource:
a. Hiring Events and Job Fairs• February 16th Job Fair Clallam and Jefferson County – Small turnout• March 30th Job Fair Kitsap County – 45 participants
• Virtual Resource Fair – helpful practice for staff and community engagement• Upcoming job fair for the hospitality industry.
b. Rapid Response: Area updates• Rapid response for Neometal with a layoff of employees but in the end, no
employees came to WorkSource for helpc. Office Relocations updates
• Getting close, waiting for approval to open back up. 90% done getting officesset up. New office to come in Sequim, permits are approved and breakingground soon. Port Angeles will move to Sequim once completed
6. WDA Trends from members – Discussion on, recruiting, and business needs during COVID
Kevin Gallacci, Clallam Transit System - Individuals are taking opportunities to use this timeto enjoy themselves and go on vacations. Until benefits are reduced, people will continue totake advantage and use the benefits until they run out. Hired extra people to disinfect innon-perm positions but losing them left and right. Candidates are dropping out ofinterviews. New federal funds to potentially extend services but need more employees tobe able to do so. Having a hard time expanding the workforce.
Attachment 12.b 70/75
Monica Blackwood, WestSound Workforce – Benefits have also been a factor in their hiring. Unemployment rate is 6% in west sound. Care issues are a factor in those not participating in the workforce. Childcare especially since school is not in session full time. Not requiring job search needs to go away to get people back into the workforce. Mentioned other states using the rest of the PUA money to set up a return to work bonus and require job search to get folks back to work.
7. Good of the Order
Next Meeting: September 14, 2021
Adjournment: 9:32 AM
71/75
EXECUTIVE COMMITTEE CHAIR- MARILYN HOPPEN, SVP Human Resources, Kitsap Bank
VICE CHAIR, ASCHLEE DRESCHER, Human Resources The Veterans Administration
JESSICA BARR, Regional Director Washington State Employment Security Dept.
MONICA BLACKWOOD, President WestSound Workforce
CHUCK MOE, Field Representative Laborers Local 252
CORDI FITZPATRICK, Human Resources Mgr. Port Townsend Paper Corporation
COUNCIL MEMBERS
DR. KAREEN BORDERS, Executive Director West Sound STEM Network
3. Approval of Previous Meeting Minutes May 11, 2021 (Attachment 13.b) pg.65
Discussion Items
4. Economics Security for All Grant
5. Career Connected Learning
- State and Regional Updates
- CCL Rural Network Collaboration
6. WIOA-Youth, Pathways to Success Update
7. YouthBuild Update
8. Open Discussion
9. Adjourn
Next Meeting – November 9, 2021
Attachment 13.a 72/75
OLYMPIC WORKFORCE DEVELOPMENT COUNCIL (OWDC) YOUTH COMMITTEE SUMMARY
May 11, 2021
ATTENDANCE: Jeff Allen, Kimberly Hetrick, Tiffany Skidmore, Emily Manson, Aschlee Drescher, Jennifer Scheel, Jen Mobley Staff: Alissa Durkin
The Olympic Workforce Development Council’s (OWDC) Youth Committee meeting was held on Tuesday, May 11, 2021 via Zoom
APPROVAL OF SUMMARY
The Youth Committee’s Meeting Agenda was reviewed as follows:
ACTION: Those present reviewed the agenda as presented. No additions were suggested, and the agenda was agreed upon by those present.
DISCUSSION
Strive Together-Cradle to Career Framework video o Alyson Rotter prepared video showcasing Graduate Strong.o Graduate Strong
Focused on ensuring that all children and youth have thecapabilities, connections and credentials to flourish.
How do we help people flourish?• Developing ring of ecosystem with Influencers, Community,
Institutions, and Systems. Utilizing strengths-based approaches to increase school and
community capacity in the Kitsap region around: • Trauma SensitiveSchools • Attendance • Discipline Policies and RestorativePractices • Hope and Resilience Building through Mentorship •Future Bound Action: College Bound Sign-Ups, Internships, DualCredit Enrollment, and Financial Aid Completion • Credentials:Technical, 2-year, and 4-year Enrollment • College Persistence
EcSA Grant o OWDC awarded OESD WIOA Youth program EcSA grant.o Grant will be used to develop stronger partnership with DSHS and
Housing Insecurity providers.o Will serve individuals below 200% Federal Poverty Level.
Attachment 13. b 73/75
o Looking to tie eligible youth engaged with apprenticeship career launchprogram with EcSA program.
State & Regional Updates
• Career Connect Learningo Focused on Clallam and Jefferson counties equitable access to
graduation pathways.o Working to have at least 1 CTE accepted pathway available in every
school within the 2 counties. Pathways that lead to post-secondarycredentials/dual credit.
o Partnering with Washington College Access Network and the WestSoundSTEM Network, continuing to increase Financial Aid Navigator pool.Hosted several Navigator workshops to train caring adults about thefinancial aid process.
Youth Program Update o Facebook page went live
Youthbuild
• New co-hort starting Monday the 17th.• 8-10 Youth are participating in the co-
hort.
ADJOURN
There being no further business to come before the committee, the meeting was adjourned at 9:55 am.
Next Meeting: Tuesday, September 14, 2021 via Zoom
74/75
Olympic Consortium Board Meeting (4th Fridays) 10 a.m. to 12:00 p.m. Zoom until further notice
Olympic Consortium Board Meeting (4th Fridays) 10 a.m. to 12:00 p.m. Zoom until further notice
Exec OWDC Meeting (4th Tuesdays) 10 a.m. to 12:00 p.m. Zoom until futher notice
OWDC Full Meeting (2nd Tuesdays) 9:00 a.m. to 1:30 p.m. Zoom from 9 to 11:30 until further notice
Su Mo Tu We Th Fr Sa Su Mo Tu We Th Fr Sa Su Mo Tu We Th Fr Sa Su Mo Tu We Th Fr Sa