168
User’s Guide OMEGAMON ® XE for DB2 on z/OS Version 300 G251247000 August 2004 Candle Corporation 100 Sepulveda Boulevard El Segundo, California 90245
User’s GuideOMEGAMON® XE for DB2 on z/OS
Version 300
G251247000
August 2004
Candle Corporation100 Sepulveda Boulevard
El Segundo, California 90245
2 OMEGAMON XE for DB2 on z/OS User’s Guide, Version 300
Registered trademarks and service marks of Candle Corporation: AF/OPERATOR, AF/REMOTE, Availability Command Center, Candle, Candle CIRCUIT, Candle Command Center, Candle Direct logo, Candle eDelivery, Candle Electronic Customer Support, Candle logo, Candle Management Server, Candle Management Workstation, CandleLight, CandleNet, CandleNet Command Center, CandleNet eBusiness Platform, CandleNet Portal, CL/CONFERENCE, CL/SUPERSESSION, CommandWatch, CT, CT/Data Server, CT/DS, DELTAMON, DEXAN, eBA, eBA*ServiceMonitor, eBA*ServiceNetwork, eBusiness at the speed of light, eBusiness Assurance, eBusiness Institute, ELX, EPILOG, ESRA, ETEWatch, IntelliWatch, IntelliWatch Pinnacle, MQSecure, MQView, OMEGACENTER, OMEGAMON, OMEGAMON II, OMEGAMON Monitoring Agent, OMEGAMON Monitoring Agents, OMEGAVIEW, OMEGAVIEW II, PQEdit, Response Time Network, Roma, SitePulse, Solutions for Networked Applications, Solutions for Networked Businesses, TMA2000, Transplex, and Volcano.Trademarks and service marks of Candle Corporation: AF/Advanced Notification, AF/PERFORMER, Alert Adapter, Alert Adapter Plus, Alert Emitter, AMS, Amsys, AutoBridge, AUTOMATED FACILITIES, Availability Management Systems, Business Services Composer, Candle Alert, Candle Business Partner Logo, Candle Command Center/SentinelManager, Candle CommandPro, Candle eSupport, Candle Insight, Candle InterFlow, Candle Managing what matters most, Candle Service Suite, Candle Technologies, CandleNet, CandleNet 2000, CandleNet Conversion, CandleNet eBP, CandleNet eBP Access for S.W.I.F.T., CandleNet eBP Administrator, CandleNet eBP Broker Access for Mercator or MQSI, CandleNet eBP Configuration, CandleNet eBP Connector, CandleNet eBP File Transfer, CandleNet eBP Host Connect, CandleNet eBP Object Access, CandleNet eBP Object Browser, CandleNet eBP Secure Access, CandleNet eBP Service Directory, CandleNet eBP Universal Connector, CandleNet eBP Workflow Access, CandleNet eBusiness Assurance, CandleNet eBusiness Exchange, CandleNet eBusiness Platform Administrator, CandleNet eBusiness Platform Connector, CandleNet eBusiness Platform Connectors, CandleNet eBusiness Platform Powered by Roma Technology, CandleNet eBusiness Platform Service Directory, Candle Vision, CCC, CCP, CCR2, CEBA, CECS, CICAT, CL/ENGINE, CL/GATEWAY, CL/TECHNOLOGY, CMS, CMW, Command & Control, Connect-Notes, Connect-Two, CSA ANALYZER, CT/ALS, CT/Application Logic Services, CT/DCS, CT/Distributed Computing Services, CT/Engine, CT/Implementation Services, CT/IX, CT/Workbench, CT/Workstation Server, CT/WS, !DB Logo, !DB/DASD, !DB/EXPLAIN, !DB/MIGRATOR, !DB/QUICKCHANGE, !DB/QUICKCOMPARE, !DB/SMU, !DB/Tools, !DB/WORKBENCH, Design Network, e2e, eBA*SE, eBAA, eBAAuditor, eBAN, eBANetwork, eBAAPractice, eBP, eBusiness Assurance Network, eBusiness at the speed of light, eBusiness at the speed of light logo, eBusiness Exchange, eBX, End-to-End, eNotification, ENTERPRISE, Enterprise Candle Command Center, Enterprise Candle Management Workstation, Enterprise Reporter Plus, ER+, ERPNet, ETEWatch Customizer, HostBridge, InterFlow, Candle InterFlow, Lava Console, Managing what matters most, MessageMate, Messaging Mastered, Millennium Management Blueprint, MMNA, MQADMIN, MQEdit, MQEXPERT, MQMON, NBX, NC4, NetGlue, NetGlue Extra, NetMirror, NetScheduler, New Times, New Team, New Readiness, OMA, OMC Gateway, OMC Status Manager, OMEGACENTER Bridge, OMEGACENTER Gateway, OMEGACENTER Status Manager, OMEGAMON/e, OMEGAMON Management Center, OSM, PathWAI, PC COMPANION, Performance Pac, Powered by Roma Technology, PowerQ, PQConfiguration, PQScope, Roma Application Manager, Roma Broker, Roma BSP, Roma Connector, Roma Developer, Roma FS/A, Roma FS/Access, RomaNet, Roma Network, Roma Object Access, Roma Secure, Roma WF/Access, Roma Workflow Access, RTA, RTN, SentinelManager, Somerset, Somerset Systems, Status Monitor, The Millennium Alliance, The Millennium Alliance logo, The Millennium Management Network Alliance, Tracer, Unified Directory Services, WayPoint, and ZCopy.Trademarks and registered trademarks of other companies: AIX, DB2, MQSeries and WebSphere are registered trademarks of International Business Machines Corporation. Citrix, WinFrame, and ICA are registered trademarks of Citrix Systems, Inc. Multi-Win and MetaFrame are trademarks of Citrix Systems, Inc. SAP is a registered trademark and R/3 is a trademark of SAP AG. UNIX is a registered trademark in the U.S. and other countries, licensed exclusively through X/Open Company Ltd. HP-UX is a trademark of Hewlett-Packard Company. SunOS is a trademark of Sun Microsystems, Inc. All other company and product names used herein may be trademarks or registered trademarks of their respective owners.
Copyright © August 2004, Candle Corporation, a California corporation. All rights reserved. International rights secured.
Threaded Environment for AS/400, Patent No. 5,504,898; Data Server with Data Probes Employing Predicate Tests in Rule Statements (Event Driven Sampling), Patent No. 5,615,359; MVS/ESA Message Transport System Using the XCF Coupling Facility, Patent No. 5,754,856; Intelligent Remote Agent for Computer Performance Monitoring, Patent No. 5,781,703; Data Server with Event Driven Sampling, Patent No. 5,809,238; Threaded Environment for Computer Systems Without Native Threading Support, Patent No. 5,835,763; Object Procedure Messaging Facility, Patent No. 5,848,234; End-to-End Response Time Measurement for Computer Programs, Patent No. 5,991,705; Communications on a Network, Patent Pending; Improved Message Queuing Based Network Computing Architecture, Patent Pending; User Interface for System Management Applications, Patent Pending.
NOTICE: This documentation is provided with RESTRICTED RIGHTS. Use, duplication, or disclosure by the Government is subject to restrictions set forth in the applicable license agreement and/or the applicable government rights clause.This documentation contains confidential, proprietary information of Candle Corporation that is licensed for your internal use only. Any unauthorized use, duplication, or disclosure is unlawful.
3
List of Tables . . . . . . . . . . . . . . . . . . . . . . . . . . . . . . . . . . . . . . . . . . . . . . . . . . 9
Preface . . . . . . . . . . . . . . . . . . . . . . . . . . . . . . . . . . . . . . . . . . . . . . . . . 11Documentation Set . . . . . . . . . . . . . . . . . . . . . . . . . . . . . . . . . . . . . . 12Adobe Portable Document Format . . . . . . . . . . . . . . . . . . . . . . . . . . 13
What’s New . . . . . . . . . . . . . . . . . . . . . . . . . . . . . . . . . . . . . . . . . . . . . . . . . 17
Chapter 1. Introducing OMEGAMON XE for DB2 on z/OS . . . . . . . . . . . . 19OMEGAMON XE for DB2 on z/OS Operating Environment . . . . . . . 20OMEGAMON XE for DB2 on z/OS . . . . . . . . . . . . . . . . . . . . . . . . . . 24How OMEGAMON XE for DB2 on z/OS Assists You . . . . . . . . . . . . . 26
Chapter 2. Learning About OMEGAMON XE for DB2 on z/OS. . . . . . . . . 27Understanding OMEGAMON XE for DB2 on z/OS Attributes . . . . . . 28Understanding OMEGAMON XE for DB2 on z/OS Information . . . . 29Understanding OMEGAMON XE for DB2 on z/OS Situations and Events . . . . . . . . . . . . . . . . . . . . . . . . . . . . . . . . . . . . 31Using CandleNet Portal to Work with Workspaces . . . . . . . . . . . . . . . 33Using CandleNet Portal to Work with Situations . . . . . . . . . . . . . . . . 40
Chapter 3. Introducing OMEGAMON XE for DB2 on z/OS Workspaces . . 45OMEGAMON XE for DB2 on z/OS Workspaces . . . . . . . . . . . . . . . . 46Using CandleNet Portal to Navigate Between Workspaces. . . . . . . . . 50
Chapter 4. Buffer Pool Workspaces . . . . . . . . . . . . . . . . . . . . . . . . . . . . . . 53Buffer Pool Details Workspace. . . . . . . . . . . . . . . . . . . . . . . . . . . . . . 54Buffer Pool Management Workspace . . . . . . . . . . . . . . . . . . . . . . . . . 55
Chapter 5. CICS Workspaces . . . . . . . . . . . . . . . . . . . . . . . . . . . . . . . . . . . 57CICS Connections Workspace . . . . . . . . . . . . . . . . . . . . . . . . . . . . . . 58CICS Threads Workspace . . . . . . . . . . . . . . . . . . . . . . . . . . . . . . . . . 59
Contents
4 OMEGAMON XE for DB2 on z/OS User’s Guide, Version 300
Chapter 6. Coupling Facility Structures Workspace Group . . . . . . . . . . . . . 61Introducing the Coupling Facility Structures Workspaces . . . . . . . . . . 62Coupling Facility Structures Workspace . . . . . . . . . . . . . . . . . . . . . . . 64Coupling Facility Connections Workspace . . . . . . . . . . . . . . . . . . . . . 65Typical Scenarios. . . . . . . . . . . . . . . . . . . . . . . . . . . . . . . . . . . . . . . . 66
Chapter 7. DDF Workspaces . . . . . . . . . . . . . . . . . . . . . . . . . . . . . . . . . . . 69DDF Conversations Workspace . . . . . . . . . . . . . . . . . . . . . . . . . . . . . 70DDF Statistics Workspace . . . . . . . . . . . . . . . . . . . . . . . . . . . . . . . . . 71
Chapter 8. Detailed Thread Exception Workspace . . . . . . . . . . . . . . . . . . . 73Detailed Thread Exception Workspace . . . . . . . . . . . . . . . . . . . . . . . 74
Chapter 9. EDM Pool Workspace . . . . . . . . . . . . . . . . . . . . . . . . . . . . . . . . 75EDM Pool Workspace . . . . . . . . . . . . . . . . . . . . . . . . . . . . . . . . . . . . 76
Chapter 10. GOA Volume Workspace Group . . . . . . . . . . . . . . . . . . . . . . . . 77Introducing the GOA Volume Workspace Group . . . . . . . . . . . . . . . . 78GOA Volume Workspace. . . . . . . . . . . . . . . . . . . . . . . . . . . . . . . . . . 80GOA Volume Database Workspace . . . . . . . . . . . . . . . . . . . . . . . . . . 81GOA Volume Spacename Workspace . . . . . . . . . . . . . . . . . . . . . . . . 82GOA Volume Spacename Detail Workspace . . . . . . . . . . . . . . . . . . . 83Typical Scenarios. . . . . . . . . . . . . . . . . . . . . . . . . . . . . . . . . . . . . . . . 84
Chapter 11. GOA Thread Database Workspace Group. . . . . . . . . . . . . . . . . 85Introducing the GOA Thread Database Workspaces . . . . . . . . . . . . . 86GOA Thread Database Workspace . . . . . . . . . . . . . . . . . . . . . . . . . . 88GOA Thread Spacename Workspace . . . . . . . . . . . . . . . . . . . . . . . . 89GOA Thread Spacename Detail Workspace . . . . . . . . . . . . . . . . . . . 90Typical Scenario . . . . . . . . . . . . . . . . . . . . . . . . . . . . . . . . . . . . . . . . 91
Chapter 12. GOA Volume Thread Workspace Group . . . . . . . . . . . . . . . . . 93Introducing GOA Volume Thread Workspaces . . . . . . . . . . . . . . . . . 94GOA Volume Thread Workspace. . . . . . . . . . . . . . . . . . . . . . . . . . . . 95GOA Volume Thread Detail Workspace . . . . . . . . . . . . . . . . . . . . . . 96Typical Scenario . . . . . . . . . . . . . . . . . . . . . . . . . . . . . . . . . . . . . . . . 97
5
Chapter 13. Global Lock Conflicts Workspace . . . . . . . . . . . . . . . . . . . . . . . 99Introducing the Global Lock Conflicts Workspace . . . . . . . . . . . . . . 100Typical Scenarios. . . . . . . . . . . . . . . . . . . . . . . . . . . . . . . . . . . . . . . 101
Chapter 14. Group Buffer Pool Statistics Workspace Group . . . . . . . . . . . . 103Introducing the Group Buffer Pool Statistics Workspaces . . . . . . . . . 104Group Buffer Pool Statistics Workspace . . . . . . . . . . . . . . . . . . . . . . 105Detailed Group Buffer Pool Statistics Workspace . . . . . . . . . . . . . . . 106Typical Scenarios. . . . . . . . . . . . . . . . . . . . . . . . . . . . . . . . . . . . . . . 107
Chapter 15. Group Buffer Pool Structures Workspace Group . . . . . . . . . . . 109Introducing the Group Buffer Pool Structures Workspaces . . . . . . . . 110Group Buffer Pool Structures Workspace. . . . . . . . . . . . . . . . . . . . . 111Group Buffer Pool Connections Workspace. . . . . . . . . . . . . . . . . . . 112Typical Scenarios. . . . . . . . . . . . . . . . . . . . . . . . . . . . . . . . . . . . . . . 113
Chapter 16. Group Object Activity Database Workspace Group . . . . . . . . . 115Introducing the Group Object Activity Database Workspaces. . . . . . 116Group Object Activity Database Workspace . . . . . . . . . . . . . . . . . . 118Group Object Activity by Spacename Workspace . . . . . . . . . . . . . . 119Group Object Activity by Spacename Detail Workspace . . . . . . . . . 120Typical Scenarios. . . . . . . . . . . . . . . . . . . . . . . . . . . . . . . . . . . . . . . 121
Chapter 17. IMS Workspaces . . . . . . . . . . . . . . . . . . . . . . . . . . . . . . . . . . . 123IMS Connections Workspace . . . . . . . . . . . . . . . . . . . . . . . . . . . . . . 124IMS Region Information Workspace . . . . . . . . . . . . . . . . . . . . . . . . 125
Chapter 18. Log Manager Workspace . . . . . . . . . . . . . . . . . . . . . . . . . . . . 127Log Manager Workspace . . . . . . . . . . . . . . . . . . . . . . . . . . . . . . . . . 128
Chapter 19. Monitored Systems Summary Workspace . . . . . . . . . . . . . . . . 129Introducing the Monitored Systems Summary Workspace . . . . . . . . 130Typical Scenarios. . . . . . . . . . . . . . . . . . . . . . . . . . . . . . . . . . . . . . . 131
Chapter 20. Object Analysis Database Workspace Group . . . . . . . . . . . . . . 133Introducing the Object Analysis Database Workspace Group. . . . . . 134Object Analysis Database Workspace . . . . . . . . . . . . . . . . . . . . . . . 136
6 OMEGAMON XE for DB2 on z/OS User’s Guide, Version 300
Object Analysis Spacename Workspace. . . . . . . . . . . . . . . . . . . . . . 137Object Analysis Spacename Detail Workspace. . . . . . . . . . . . . . . . . 138Typical Scenario . . . . . . . . . . . . . . . . . . . . . . . . . . . . . . . . . . . . . . . 139
Chapter 21. Subsystem Management Workspace . . . . . . . . . . . . . . . . . . . . 141Subsystem Management Workspace . . . . . . . . . . . . . . . . . . . . . . . . 142
Chapter 22. System Status Workspace . . . . . . . . . . . . . . . . . . . . . . . . . . . . 143System Status Workspace . . . . . . . . . . . . . . . . . . . . . . . . . . . . . . . . 144
Chapter 23. Thread Activity Workspace Group. . . . . . . . . . . . . . . . . . . . . . 145Introducing the Thread Activity Workspaces . . . . . . . . . . . . . . . . . . 146Thread Activity Workspace . . . . . . . . . . . . . . . . . . . . . . . . . . . . . . . 147Thread Statistics Workspace . . . . . . . . . . . . . . . . . . . . . . . . . . . . . . 148Typical Scenarios. . . . . . . . . . . . . . . . . . . . . . . . . . . . . . . . . . . . . . . 149
Chapter 24. Utility Jobs Workspace . . . . . . . . . . . . . . . . . . . . . . . . . . . . . . 151Utility Jobs Workspace . . . . . . . . . . . . . . . . . . . . . . . . . . . . . . . . . . 152
Chapter 25. Volume Activity Workspace . . . . . . . . . . . . . . . . . . . . . . . . . . . 153Volume Activity Workspace . . . . . . . . . . . . . . . . . . . . . . . . . . . . . . . 154
Chapter 26. OMEGAMON XE for DB2 on z/OS Situations . . . . . . . . . . . . 155Situations Delivered with OMEGAMON XE for DB2 on z/OS . . . . . 156Coupling Facility Situation Definitions . . . . . . . . . . . . . . . . . . . . . . . 158Database Locks Situation Definitions. . . . . . . . . . . . . . . . . . . . . . . . 159Group Buffer Pool Predefined Situation Definitions . . . . . . . . . . . . . 160Threads Situation Definitions . . . . . . . . . . . . . . . . . . . . . . . . . . . . . 161DB2 Command Situation Definitions . . . . . . . . . . . . . . . . . . . . . . . 162
Index . . . . . . . . . . . . . . . . . . . . . . . . . . . . . . . . . . . . . . . . . . . . . . . . 165
9
Table 1. Product Features . . . . . . . . . . . . . . . . . . . . . . . . . . . . . . . . . . . . . . . . 24Table 2. Organization of OMEGAMON XE for DB2 on z/OS Information . . . . 46Table 3. OMEGAMON XE for DB2 on z/OS Workspaces . . . . . . . . . . . . . . . . 48Table 4. Coupling Facility Structures Workspaces . . . . . . . . . . . . . . . . . . . . . . 62Table 5. GOA Volume Workspaces . . . . . . . . . . . . . . . . . . . . . . . . . . . . . . . . . 78Table 6. GOA Thread Database Workspaces . . . . . . . . . . . . . . . . . . . . . . . . . 86Table 7. GOA Volume Thread Workspaces . . . . . . . . . . . . . . . . . . . . . . . . . . . 94Table 8. Group Buffer Pool Statistics Workspaces . . . . . . . . . . . . . . . . . . . . . 104Table 9. Group Buffer Pool Structures Workspaces . . . . . . . . . . . . . . . . . . . . 110
Table 10. Group Object Activity Database Workspaces . . . . . . . . . . . . . . . . . 116Table 11. Object Analysis Database Workspaces. . . . . . . . . . . . . . . . . . . . . . . 134Table 12. Thread Activity Workspaces. . . . . . . . . . . . . . . . . . . . . . . . . . . . . . . 146
List of Tables

10 OMEGAMON XE for DB2 on z/OS User’s Guide, Version 300
11
Preface
IntroductionThis guide provides detailed information about the OMEGAMON® XE for DB2 on z/OS product and its workspaces.
Who should use this guide
This guide serves the following audiences:
� operators
� system programmers
� system administrators
� network administrators
� Candle sales force and field support
Why you should use this guide
This guide will help you understand how to use OMEGAMON XE to monitor your DB2. The guide supplements the OMEGAMON XE online help.
Candle recommends that you reference this guide whenever you need additional information about the OMEGAMON XE for DB2 on z/OS product and workspaces.
P
Documentation Set
12 OMEGAMON XE for DB2 on z/OS User’s Guide, Version 300
Documentation Set
OverviewCandle provides this User’s Guide for OMEGAMON XE for DB2 on z/OS. This manual supplements the online help provided with the product.
You may wish to review manuals that comprise the OMEGAMON II for DB2 documentation set These manuals are useful should you need to review information provided by the underlying OMEGAMON II for DB2, Version 540 product.
Where to look for more informationFor more information related to this product and other related products, please see the
� technical documentation CD-ROM that came with your product
� technical documentation information available on the Candle Web site at www.candle.com
� online help provided with this and the other related products.
13
Adobe Portable Document Format
Adobe Portable Document Format
Printing this bookCandle supplies documentation in the Adobe Portable Document Format (PDF). The Adobe Acrobat Reader will print PDF documents with the fonts, formatting, and graphics in the original document. To print a Candle document, do the following:
1. Specify the print options for your system. From the Acrobat Reader Menu bar, select File > Page Setup… and make your selections. A setting of 300 dpi is highly recommended as is duplex printing if your printer supports this option.
2. To start printing, select File > Print... on the Acrobat Reader Menu bar.
3. On the Print pop-up, select one of the Print Range options for� All� Current page� Pages from: [ ] to: [ ]
4. (Optional). Select the Shrink to Fit option if you need to fit oversize pages to the paper size currently loaded on your printer.
Printing problems?The print quality of your output is ultimately determined by your printer. Sometimes printing problems can occur. If you experience printing problems, potential areas to check are:� settings for your printer and printer driver. (The dpi settings for both your
driver and printer should be the same. A setting of 300 dpi is recommended.)
� the printer driver you are using. (You may need a different printer driver or the Universal Printer driver from Adobe. This free printer driver is available at www.adobe.com.)
� the halftone/graphics color adjustment for printing color on black and white printers (check the printer properties under Start > Settings > Printer). For more information, see the online help for the Acrobat Reader.
� the amount of available memory in your printer. (Insufficient memory can cause a document or graphics to fail to print.)
For additional information on printing problems, refer to the documentation for your printer or contact your printer manufacturer.
Adobe Portable Document Format
14 OMEGAMON XE for DB2 on z/OS User’s Guide, Version 300
Contacting AdobeIf additional information is needed about Adobe Acrobat Reader or printing problems, see the Readme.pdf file that ships with Adobe Acrobat Reader or contact Adobe at www.adobe.com.
Adding annotations to PDF filesIf you have purchased the Adobe Acrobat application, you can add annotations to Candle documentation in .PDF format. See the Adobe product for instructions on using the Acrobat annotations tool and its features.

15

16 OMEGAMON XE for DB2 on z/OS User’s Guide, Version 300
17
What’s New
OMEGAMON XE for DB2 on z/OS, Version 300With Version 300, OMEGAMON XE for DB2 on z/OS includes all the functionality of OMEGAMON XE for DB2plex, Version 220, as well as the functionality of OMEGAMON XE for DB2, Version 100. After installing OMEGAMON XE for DB2 on z/OS, you can view the workspaces, attributes, and situations that make up both products.
Additionally, with Version 300, OMEGAMON XE for DB2 on z/OS provides support for Version 8 of the IBM DB2 product.
Note: Version 8 of DB2 does not support hiperpools. If you use Version 8, the workspace fields for hiperpools will not display any data.
W

18 OMEGAMON XE for DB2 on z/OS User’s Guide, Version 300
Introducing OMEGAMON XE for DB2 on z/OS 19
IntroducingOMEGAMON XE for DB2 on z/OS
IntroductionThis chapter introduces you to OMEGAMON XE for DB2 on z/OS. It includes information about the DB2 product, user interface, and this release of DB2.
Chapter contentsOMEGAMON XE for DB2 on z/OS Operating Environment . . . . . . . . . . . 20OMEGAMON XE for DB2 on z/OS. . . . . . . . . . . . . . . . . . . . . . . . . . . . . . 24How OMEGAMON XE for DB2 on z/OS Assists You . . . . . . . . . . . . . . . . 26
1
OMEGAMON XE for DB2 on z/OS Operating Environment
20 OMEGAMON XE for DB2 on z/OS User’s Guide, Version 300
OMEGAMON XE for DB2 on z/OS Operating Environment
Overview
OMEGAMON XE for DB2 on z/OS can help you to address the increasing challenges presented by today’s technical environment. OMEGAMON XE assists you to better manage the performance of the systems that comprise your operating environment.
In this unit you learn about the operating environment in which OMEGAMON XE for DB2 on z/OS resides.
What is OMEGAMON XE?OMEGAMON XE is a suite of products that assist you in monitoring your mainframe and distributed systems on a variety of platforms using a variety of workstations.
OMEGAMON XE provides a way to monitor the availability and performance of all the systems in your enterprise from one or several designated workstations. It provides many useful workspaces you can use to track trends and understand and troubleshoot system problems. You can use OMEGAMON XE to
� establish your own performance thresholds� create situations, which are conditions to monitor� create comprehensive workspaces about system conditions� create policies, which are a collection of activities that help you automate
responses to events or routine operator tasks� monitor for alerts on the systems and platforms you are managing� trace the causes leading up to an alert
Introducing OMEGAMON XE for DB2 on z/OS 21
OMEGAMON XE for DB2 on z/OS Operating Environment
OMEGAMON XE componentsOMEGAMON XE is a client-server-agent implementation that includes
� a client, that can be
– a CandleNet Portal® workstation
– a Candle Management Workstation®, used to manage work groups and work lists, data items, and managed system lists
– an OMEGAMON II® product using a 3270 terminal session
� a server, known as the Candle Management Server® (CMS™)� a CandleNet Portal server that performs common CandleNet Portal
functions and serves to lighten the CandleNet Portal client� monitoring agents that collect and distribute data to a CMS.
OMEGAMON XE for DB2 on z/OS is such an agent.
An additional feature package, OMEGAMON DE is available with OMEGAMON XE. This feature package provides all the capability of OMEGAMON XE, plus additional capabilities as described later in this chapter.
What is CandleNet Portal?CandleNet Portal is a user interface that provides a birds-eye view of your enterprise that you can zoom into for a closer look. The application window consists of a Navigator that shows all the systems in your enterprise where Candle agents are installed, and a workspace that includes table and chart views of system and application conditions. A CandleNet Portal table view is analogous to a CMW workspace.
Like the CMW, CandleNet Portal permits you to view the results of evaluating situations at regular intervals to check that your applications and system resources are running well. A failed test causes event indicators to appear in the Navigator.
CandleNet Portal offers two modes of operation: desktop and browser. In desktop mode the application software is installed on your system. In browser mode the system administrator installs the application on the web server and you start CandleNet Portal from your browser. In browser mode the software is downloaded to your system the first time you log on to CandleNet Portal, and thereafter only when there are software updates.
OMEGAMON XE for DB2 on z/OS Operating Environment
22 OMEGAMON XE for DB2 on z/OS User’s Guide, Version 300
What is the Candle Management Workstation?The Candle Management Workstation (CMW) is an interface you use to manage work groups and work lists, data items, and managed system lists.
Further Information about CandleNet Portal and the CMWCandle provides a complete set of documentation for OMEGAMON XE for DB2. Each manual contains a specific type of information to help you use the product. Relevant manuals are
� the product libraries for CandleNet Portal and Candle Management Workstation
� the installation documentation appropriate for your environment � the online help for CandleNet Portal and the Candle Management
Workstation
What is OMEGAMON DE?The OMEGAMON DE feature package for CandleNet Portal offers a dashboard view of your enterprise. This feature provides a single point of control from which you can manage the resources your business-critical applications rely on, including a range of operating systems, servers, databases, mainframes, and Web components. It enables you to pull together the data and functionality built into all the Candle monitoring solutions, such as OMEGAMON XE for OS/390. OMEGAMON DE provides all the capability of OMEGAMON XE, plus these additional capabilities:� Multiple applications can be displayed in one workspace
In a single workspace, you can build a table or chart with data from one type of monitoring agent, and another table or chart with data from a different agent. Within that workspace, you can show views from as many different agent types as are included on that branch of the Navigator.
� You can link application workspaces
You can define a link from a workspace associated with one type of monitoring agent to a workspace associated with another type of agent.
Introducing OMEGAMON XE for DB2 on z/OS 23
OMEGAMON XE for DB2 on z/OS Operating Environment
� You can define enterprise-specific Navigator views
The Navigator physical view shows the hierarchy of your managed enterprise by operating platform and type of Candle agent. The Navigator business view shows the hierarchy of any managed objects defined through the CMW. You can also define Navigator views for any logical grouping, such as a departmental or site hierarchy.
� You can define a graphic view
The graphic view enables you to retrieve and display real-time monitoring data from Candle agents. Using the graphic view, you can create a background image or import one, then place objects (Navigator items) on the image or have it done automatically using geographical coordinates. You can zoom in and you can add such graphics as floor plans and organization charts.
� You can integrate information provided by Candle’s Universal Agent
Candle’s Universal Agent is an agent you can configure to monitor any data you collect. It lets you integrate data from virtually any platform and any source, such as custom applications, databases, systems, and subsystems. Your defined data providers are listed in the Navigator, and default workspaces are automatically created.
OMEGAMON DE Policy Management adds automation capabilities. The Workflow editor enables you to design sets of automated system processes, called policies, to resolve system problems. A policy performs actions, schedules work to be performed by users, or automates manual tasks.
Detailed information about OMEGAMON DE is provided in the CandleNet Portal online help.
About the Workflow EditorIf your product supports the use of the Workflow Editor, you can find information about its use in CandleNet Portal help and Using OMEGAMON Products: CandleNet Portal. The Workflow Editor permits you to create new policies or modify any predefined policies for your product or policies created using the Candle Management Workstation. Your OMEGAMON Alert Manager includes support for emitter activity programs, which can also be included in policies.
OMEGAMON XE for DB2 on z/OS
24 OMEGAMON XE for DB2 on z/OS User’s Guide, Version 300
OMEGAMON XE for DB2 on z/OS
Overview
In this unit you learn about the OMEGAMON XE for DB2 on z/OS product features.
OMEGAMON XE for DB2 on z/OS can help you to address the increasing challenges in today’s ever changing technical environment and to better manage the performance of your system.
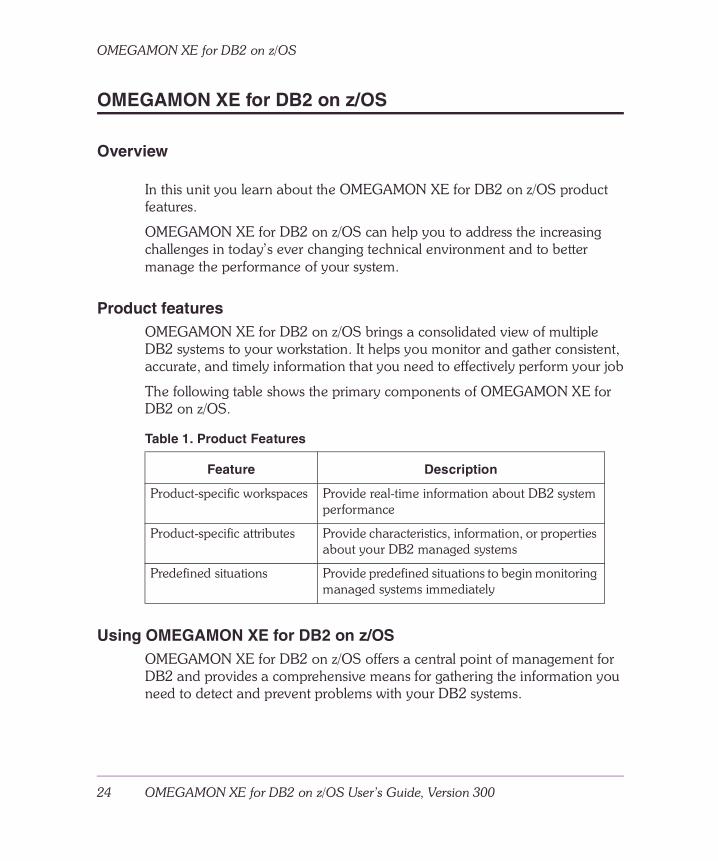
Product featuresOMEGAMON XE for DB2 on z/OS brings a consolidated view of multiple DB2 systems to your workstation. It helps you monitor and gather consistent, accurate, and timely information that you need to effectively perform your job
The following table shows the primary components of OMEGAMON XE for DB2 on z/OS.
Using OMEGAMON XE for DB2 on z/OSOMEGAMON XE for DB2 on z/OS offers a central point of management for DB2 and provides a comprehensive means for gathering the information you need to detect and prevent problems with your DB2 systems.
Table 1. Product Features
Feature Description
Product-specific workspaces Provide real-time information about DB2 system performance
Product-specific attributes Provide characteristics, information, or properties about your DB2 managed systems
Predefined situations Provide predefined situations to begin monitoring managed systems immediately
Introducing OMEGAMON XE for DB2 on z/OS 25
OMEGAMON XE for DB2 on z/OS
OMEGAMON XE lets you easily collect and analyze DB2-specific information, including:
� thread activity and statistics
� database lock conflict information
� coupling facility structure utilization
� group buffer pool structure utilization
� group buffer pool statistics
� object analysis allocation
� group object activity information
� volume use information
With OMEGAMON XE for DB2 on z/OS, system administrators can set threshold levels and flags to alert them when the system reaches these thresholds.
Advanced monitoring facilitiesOMEGAMON XE for DB2 on z/OS includes advanced monitoring facilities.
� User-defined and predefined situations based on thresholds to raise different types of alerts: critical, warning, and others
� At-a-glance status picture of all database servers
� The capability to monitor multiple servers simultaneously from one or more centralized workstations
Planning and installationFor information on planning for and installing OMEGAMON XE for DB2 on z/OS, refer to the appropriate Candle installation manual.
User interfaceOMEGAMON XE for DB2 on z/OS can use the standard CandleNet Portal interface on Windows 2000.
How OMEGAMON XE for DB2 on z/OS Assists You
26 OMEGAMON XE for DB2 on z/OS User’s Guide, Version 300
How OMEGAMON XE for DB2 on z/OS Assists You
Product BenefitsOMEGAMON XE for DB2 on z/OS provides several benefits.
Simplifies application and system management—by managing applications, platforms, and resources across your system.
Increases profits—by providing you with real-time access to reliable, up-to-the-minute data that allows you to make faster, better informed operating decisions.
Enhances system performance—by letting you integrate, monitor, and manage your system, environment, console, and mission-critical applications. OMEGAMON XE for DB2 on z/OS alerts your system administrator when conditions in your environment meet threshold-based conditions. These alerts permit your system administrator to limit and to control system traffic. You can view data that OMEGAMON XE for DB2 on z/OS gathers in workspaces that inform you of the status of your DB2 managed systems.
Historical Data CollectionYou can use the facilities of CandleNet Portal’s historical data collection function to store and save the data being collected by your OMEGAMON XE for DB2 agent or agents. The historical data collection function permits you to specify
� the attribute group or groups for which data is to be collected
� the interval at which data is to be collected
� the interval at which data is to be warehoused (if you choose to do so)
� the location (either at the agent or at the CMS) at which the collected data is to be stored
Information about using the Historical Data Collection function can be found in the CandleNet Portal online Help and in the Historical Data Collection Guide for OMEGAMON XE and CandleNet Command Center.
Learning About OMEGAMON XE for DB2 on z/OS 27
Learning AboutOMEGAMON XE for DB2
on z/OS
IntroductionThis chapter introduces you to the OMEGAMON XE for DB2 on z/OS attributes, and predefined situations, and describes the information OMEGAMON XE for DB2 on z/OS provides to assist you in monitoring your environment.
Chapter contentsUnderstanding OMEGAMON XE for DB2 on z/OS Attributes . . . . . . . . . . 28Understanding OMEGAMON XE for DB2 on z/OS Information . . . . . . . . 29Understanding OMEGAMON XE for DB2 on z/OS Situations and Events 31Using CandleNet Portal to Work with Workspaces . . . . . . . . . . . . . . . . . . 33Using CandleNet Portal to Work with Situations . . . . . . . . . . . . . . . . . . . . 40
2
Understanding OMEGAMON XE for DB2 on z/OS Attributes
28 OMEGAMON XE for DB2 on z/OS User’s Guide, Version 300
Understanding OMEGAMON XE for DB2 on z/OS Attributes
Overview
In this unit you learn about the OMEGAMON XE for DB2 on z/OS attributes.
Using OMEGAMON XE for DB2 on z/OS attributes
OMEGAMON XE for DB2 on z/OS gathers data from remote agents residing on the managed systems of your DB2 network and stores this data in system elements called attributes.
You can use OMEGAMON XE for DB2 on z/OS attributes to build situations that monitor the performance of your DB2 network.
To use OMEGAMON XE for DB2 on z/OS attributes effectively, you must first understand the organization of an attribute.
� An attribute is made up of an attribute group and an attribute item.
� An attribute group refers to a unique characteristic of the data that is stored in the attribute.
� An attribute item stores data for a particular property of an attribute group.
Thus this example attribute
DB2_Lock_Conflict.Lock_Elapsed_Time
comprises an attribute item, Lock_Elapsed_Time, that stores lock elapsed time data for the attribute group DB2_Lock_Conflict.
For more information on attributesSee the online help for OMEGAMON XE for DB2 on z/OS for a complete description of each of the attribute groups and its attributes.
Learning About OMEGAMON XE for DB2 on z/OS 29
Understanding OMEGAMON XE for DB2 on z/OS Information
Understanding OMEGAMON XE for DB2 on z/OS Information
OverviewIn this unit you learn about the information OMEGAMON XE for DB2 on z/OS provides. OMEGAMON XE for DB2 on z/OS information is displayed in CandleNet Portal® in named workspaces. Within a given workspace, information may appear in tabular form. CandleNet Portal refers to this tabular format for information as a table view. Information may also be displayed in the workspace as charts, graphs, or other formats you can specify.
Using OMEGAMON XE for DB2 on z/OS informationOMEGAMON XE for DB2 on z/OS provides the ability to view information about each DB2 managed system that you are monitoring. You can use this information to
� monitor the performance of each DB2 managed system, helping you to identify system bottlenecks and evaluate tuning decisions.
� select the most effective threshold values for situations you create.
� review status information when a change in the state of a given resource occurs, such as from OK to Warning or Warning to Critical.
Associating OMEGAMON XE for DB2 on z/OS workspaces with attributes
There is a direct relationship between OMEGAMON XE for DB2 on z/OS attributes and workspaces. An attribute group corresponds to a workspace and attribute items correspond to workspace columns.
For example, the Global Lock Conflicts workspace contains information that is collected in and represented by the DB2_Lock_Conflict attribute group. The DB2_Lock_Conflict.Lock_Elapsed_Time attribute item contains the information that is displayed in the Elapsed Time workspace column.
Understanding OMEGAMON XE for DB2 on z/OS Information
30 OMEGAMON XE for DB2 on z/OS User’s Guide, Version 300
Each workspace displays real-time information for many of the DB2attributes. The DB2 workspaces are available to you, independent of whether you are using OMEGAMON XE for DB2 on z/OS to monitor situations.
For more information on workspacesFor detailed information about working with OMEGAMON XE for DB2 on z/OS information, see “Using CandleNet Portal to Work with Workspaces” on page 33.
Learning About OMEGAMON XE for DB2 on z/OS 31
Understanding OMEGAMON XE for DB2 on z/OS Situations and Events
Understanding OMEGAMON XE for DB2 on z/OS Situations and Events
OverviewIn this unit you learn about OMEGAMON XE for DB2 on z/OS situations that are shipped with the product. When using CandleNet Portal, you will see these referred to as predefined situations.
Situations and EventsA situation describes a condition you want to test. OMEGAMON XE for DB2 on z/OS compares the situation with the values collected by the monitoring agent and raises an event if the condition is met.
Every Candle agent comes with a set of predefined situations so you can begin monitoring as soon as you start using OMEGAMON XE for DB2 on z/OS. You can edit these situations to match your environment or create your own. You can read a situation as, “If this condition exists, then the situation is true”.
Associated with every situation is an event indicator. When the condition described in the situation becomes true, the event is raised. Event indicators can be critical, warning, or informational. A user monitoring the network for events can acknowledge an event to indicate it has been seen and the problem is being addressed.
Using OMEGAMON XE for DB2 on z/OS situationsYou can use the OMEGAMON XE for DB2 on z/OS situations shipped with the product
� to begin monitoring your DB2 managed systems immediately
� as models for creating your own situations
� to monitor and manage, through localized automation, widely dispersed resources
You can modify the situations you receive to contain values more appropriate for your system. However, Candle recommends that before changing these situations, you make a copy and keep that copy unmodified so that you can revert to the original situations should the need arise.
Understanding OMEGAMON XE for DB2 on z/OS Situations and Events
32 OMEGAMON XE for DB2 on z/OS User’s Guide, Version 300
Most of the OMEGAMON XE for DB2 on z/OS predefined situations have an alert status of either Critical or Warning.
Information about OMEGAMON XE for DB2 on z/OS SituationsFor more information on predefined situations, see the product’s online help. See also “OMEGAMON XE for DB2 on z/OS Situations” on page 155.
Learning About OMEGAMON XE for DB2 on z/OS 33
Using CandleNet Portal to Work with Workspaces
Using CandleNet Portal to Work with Workspaces
OverviewThis unit provides a high-level overview of working with workspaces while using CandleNet Portal. For the most current in-depth information, refer to the online help provided with CandleNet Portal.
The workspace is the working area in which CandleNet Portal presents information. As you select items, the workspace presents views pertinent to your selection. Each workspace has at least one view.
Every workspace has a set of properties associated with it. You can customize the workspace by working in the Properties editor to change the style and content of each view.
Be aware that the changes you make to the workspace are lost when you switch to another workspace unless you Save them first.
Another way to customize the workspace is to change the type of view or to add views to the workspace.
Formats for CandleNet Portal informationOMEGAMON XE information can be presented to you in any of the views below:
� Table view� Pie chart view� Bar chart view� Plot chart view� Needle gauge view� Thermometer gauge view� Notepad view� Event console view, that shows the status of the situations associated with
the system. � Take Action view, that is used to send a command to the system. � Terminal view, that enables you to start a 3270 or 5250 work session.
Using CandleNet Portal to Work with Workspaces
34 OMEGAMON XE for DB2 on z/OS User’s Guide, Version 300
� Browser view, that permits you to open a browser to see HTML pages and Web sites.
Opening a workspace
Opening the default workspace
Most items in the Navigator have a default workspace associated with them. Some items have multiple workspaces you can open, although only one workspace can be open in the CandleNet Portal application window at one time. To open the default workspace, in the Navigator, click the item name or its icon.
Opening multiple workspaces
CandleNet Portal enables you to have multiple workspaces for an item. If the Navigator item has more than one workspace associated with it, use View > Workspace to see and select from a list of alternate workspaces.
Refreshing or reloading a workspaceOnce a workspace is open, it is not refreshed automatically. Rather, CandleNet Portal refreshes the table and chart views in the workspace only when you manually request they be refreshed or when the workspace is reloaded. You can, however, choose to automate the refresh at specified intervals. When choosing automatic refresh for a workspace, you should consider the impact of the refresh on system resources.
To define automatic refresh for a workspace:
1. Open the View menu, then point to Refresh Every.
2. Click 5, 10, 15, 30, or 60 seconds, or On Demand.To refresh a workspace manually with the latest information, click Refresh.
To manually reload the saved workspace and refresh the monitoring data, click Reload. Note that, if you made any changes to the workspace properties without saving them, the changes will be lost when a reload occurs.
Learning About OMEGAMON XE for DB2 on z/OS 35
Using CandleNet Portal to Work with Workspaces
Suspending or stopping a workspaceCandleNet Portal receives monitoring data from the agents at timed intervals and, if you have defined automatic refresh for the workspace, refreshes the table and chart views in the workspace. The refreshes use system resources. You can control when the views are refreshed by suspending the refresh. You can also stop loading the workspace if it is not what you want or you plan to change it.
To stop refreshing, click Suspend. You can then manually refresh the workspace, or you can click Resume to resume automatic refresh.
To stop loading a workspace, click the CandleNet Portal Stop icon. Note that clicking your browser’s Stop icon will not stop the loading of a CandleNet Portal workspace.
Editing a workspaceYour CandleNet Portal product comes with a set of predefined workspaces for every item in the Navigator's physical map. You can edit any of these workspaces to suit your environment.
The changes you can make to a workspace include the following:
� Split a view horizontally or vertically into two separate views.
� Change the dimensions of the views by dragging the borders between them.
� Change a view to a different type, such as from a pie chart to a thermometer gauge.
� Edit the properties of any view to change the data displayed and how the view is styled.
� Build a link to another workspace so that you can link to the other workspace from this one at any time.
� Remove a view from the workspace. The adjacent view enlarges to fill the gap.
When you are finished editing a workspace you must save your changes either as the current workspace or as a new workspace. If you do not save your changes, they will be lost when you open another workspace or end your work session.
Using CandleNet Portal to Work with Workspaces
36 OMEGAMON XE for DB2 on z/OS User’s Guide, Version 300
Any changes you make to a workspace are available to all other users on the network having the same ID.
Saving the workspaceWhatever changes you make to the workspace properties, such as adding or editing a view, are only temporary. They will be lost when you open another workspace or exit CandleNet Portal, unless you save the workspace. You can also save multiple workspaces for the same Navigator item.
Click Save to replace the original workspace with the current workspace. If you do not want to replace the original workspace, save the current workspace under a new name.
If this is a new workspace:
1. Open the File menu and select Save Workspace As.
2. Type a name for the new (modified) workspace in the text box and click OK. The name you specify must not be the same as the name of the predefined workspace that you modified.
Result: The workspace is saved with the name you specify, and is available to all of your managed systems of the same managed system type.
Note: The saved workspace is associated with your CandleNet Portal user ID. Users with a different ID will not see your changes. If you have edited the workspace but do not want to save your workspace, you can reload the saved workspace as described on page 34.
Linking workspacesSome of your product’s predefined workspaces may be linked to other related workspaces. Linking workspaces is a quick method for going from one workspace to another related workspace quickly.
� You can link from one workspace to another from the Navigator. Simply right-click on a workspace. In the pop-up window that appears, select the workspace to which you want to link.
� While using a workspace’s table view, you can right-click within a cell in the table to display existing links to other related workspaces.
Learning About OMEGAMON XE for DB2 on z/OS 37
Using CandleNet Portal to Work with Workspaces
� When a link is predefined for a row in a table view, an icon appears to the left of each row in the table. (The icon resembles two links in a chain.) When the icon is not shaded out, the link is valid for the row. The user can left-click the icon to navigate instantly to the next workspace. Right-clicking on the icon causes a pop-up menu to appear, showing all the links defined for the row. From this menu, you can select from the list of links or change the default link.
You can define your own links using the Link Wizard by following the directions in CandleNet Portal’s online help. Once a link is defined, you can link to the subject workspace from another workspace, edit the link, or remove a link definition. Note that the link will not be saved until the subject workspace is saved.
Defining workspace propertiesEvery workspace has properties for its views. You can right-click in an open view or any item in the Navigator to select and open the Properties editor.
The Properties tree has a Views folder with folders for each type of view in the workspace.
To edit the properties of a view, click its icon in the Properties tree.
The properties open in the right frame with some or all of the following tabs:
Opening an event workspaceWhen the conditions of a situation have been met, an event indicator appears in the Navigator. You can investigate the event by opening its workspace.
Query Specify what data should go in the chart or table
Filters Refine the view by filtering out unwanted data from the chart or table
Thresholds Establish threshold values and color indicators for a table view
Configuration Specify the script to run or the connection to make whenever you open the terminal view
Style Change the behavior and appearance of the view
Using CandleNet Portal to Work with Workspaces
38 OMEGAMON XE for DB2 on z/OS User’s Guide, Version 300
1. In the Navigator move the mouse pointer over the alert indicator to open a flyover listing of the event (or events if the item has more than one true situation).
2. In the flyover listing click a situation name to open its workspace.Result: The Navigator moves to the event location and shows the situation name, and its event workspace opens.
The event workspace shows two table views, one with the values of the attributes when the situation fired, and the other with their current values. It can also display a text view with any expert advice written by the situation's author, and the Take Action view so you can send a command to the application started on that system.
Filtering informationFiltering of OMEGAMON XE for DB2 on z/OS information is accomplished in CandleNet Portal by linking from rows within the summary table view at the highest level of the workspace hierarchy to progressively lower-level workspaces. To link from a specific row, right-click within any cell in the row, then select Link to from the pop-up menu that CandleNet Portal displays. Selecting Link to causes a list of lower-level workspaces to be displayed. Select the one you want from the list. You know you have reached the bottom of a hierarchical group if Link to does not appear in the pop-up menu when you right-click in a row of a table view.
Similarly, you will not be given the opportunity to link to a workspace that does not contain any meaningful data. For example, Link to will not provide a link to the Database Locks workspace if the current row of the summary table has a lock count of 0.
Within a given workspace, the filtering criteria used to limit the data that is displayed are shown in the footer line of the workspace’s table view. As you navigate further down the hierarchy, the amount of information in the footer tends to increase.
To manually set up filtering for a given table view, place the cursor on the table view, press the right mouse button, and select Properties. From the displayed dialog, select the Filters tab. Here you can select the columns to display as well as set up the criteria to determine which rows to display. To save your filtering specifications, you must save the workspace before exiting.
Learning About OMEGAMON XE for DB2 on z/OS 39
Using CandleNet Portal to Work with Workspaces
Sorting InformationSorting is handled by simply clicking on a column heading. Click once and the workspace will be sorted in ascending order. Clicking a second time will resort the workspace into descending order. A third click returns you to the workspace’s default sort.
Using CandleNet Portal to Work with Situations
40 OMEGAMON XE for DB2 on z/OS User’s Guide, Version 300
Using CandleNet Portal to Work with Situations
OverviewThe Candle agent or agents that come with your OMEGAMON XE product have a set of predefined situations that you can use as-is or modify to meet your requirements.
This unit provides a high-level overview of working with situations while using CandleNet Portal. For the most current in-depth information, refer to the online help provided with CandleNet Portal.
The Situation editorYou can display predefined situations and create your own situations using the Situation editor. The way to perform these functions is described below. The left frame of the Situation editor initially lists the situations associated with the Navigator item you selected. When you click a situation name or create a new situation, the right frame opens with the following tabs:
The Situation editor buttons let you Apply your changes by saving and starting the situation, and exit with (OK) or without (Cancel) saving your changes. Note that if you plan to edit multiple situations while in the Situation editor, click Apply after editing one situation to save your changes before selecting the next situation to edit (or creating a new one).
Create a situationYou can create and customize your own situations to monitor specific conditions in your enterprise.
Condition See, add to, and edit the condition being tested
Distribution See the systems to which the situation is assigned and assign the situation to systems
Expert Advice Write comments or instructions to be read in the event workspace
Action Specify a command to be sent to the system
Until Reset a situation when another situation becomes true or after a specified time period.
Learning About OMEGAMON XE for DB2 on z/OS 41
Using CandleNet Portal to Work with Situations
1. Decide on which system you want the situation to run, then right-click either the name or icon of the system, agent, or attribute group in the Navigator.
2. Select Situations from the popup menu. The Situation editor opens.
3. Click New Situation. The Enter New Situation Name dialog opens.
4. Type a name for the situation and click OK. The Select Attribute dialog opens.
5. Click a name in the Group list to see its attributes in the Item list.
6. Click an attribute name in the Item list, then OK. The properties for the new situation display, with the attribute you just selected as the first column.
7. In the Condition tab, edit the condition, interval and status.
8. Click the Distribution tab to see and assign the systems to monitor.
9. Click the Expert Advice tab to enter text viewable from the event workspace.
10. Click the Action tab to enter a command to be invoked when the situation fires.
11. When you are finished creating the situation, click Apply to save your changes and start the situation; or, click OK to save your changes, start the situation, and exit the Situation editor.The Situation editor checks the syntax of each expression you enter. If you enter an improper value for an attribute, such as "abc" for Disk Size, the cell turns red and the situation will not be saved until you correct the error.
Notes:� When you save a situation, it is stored on the Candle Management Server
hub and is viewable at any other CandleNet Portal console whose CandleNet Portal server is connected to the same CMS hub. The CandleNet Portal server and CandleNet Portal consoles must be recycled (restarted) before the situation can be observed from other consoles.
� In the unlikely event that two users attempt to save a situation with the same name simultaneously, an error will occur, ensuring that one situation does not overwrite another.
Display a situationTo examine the condition written for a situation, open it in the Situations editor. The editor has four tabs showing Condition, Distribution, Expert Advice, and Action for a given situation.
Using CandleNet Portal to Work with Situations
42 OMEGAMON XE for DB2 on z/OS User’s Guide, Version 300
1. In the Navigator, right-click a system or any level below.You can right-click either the name or icon of a system, any of its Candle agents, or attribute groups. If you have already selected an event and opened its workspace, you can right-click the situation name.
2. Select Situations from the popup menu; or, if you right-clicked a situation name, click Edit Situation and skip step 3.The Situation editor opens. The Situation tree lists the situations for the object level chosen.
3. Click the situation to see its properties or, if you don't see the situation in the tree, click the Situations Filter to see more.
Note: If you still do not see the situation you are looking for, click Cancel and locate the system to which the situation has been distributed. Then repeat these steps.
Edit a situationTo fine tune a situation, use the Situation editor to edit it.
1. In the Navigator right-click a system, agent, or attribute group.You can right-click either the icon or name of a system, any of its agents or attribute groups. If you have already selected an event and opened its workspace, you can right-click the situation name.
2. Click Situations from the popup menu; or, if you right-clicked a situation name, click Edit Situation and skip step 3.
3. Click Situations from the popup menu. The Situation editor opens. The Situation tree lists the situations for the level chosen.
4. Click a situation to see its properties, or, if you do not see the situation in the tree, click Situation Filter and select more options.
5. If you still do not see the situation you are looking for, click Cancel and locate the system to which the situation is distributed. Then repeat the previous steps.
6. On the Condition tab, edit the condition, interval, or status.
7. Click the Distribution tab to see and assign the systems to monitor.
8. Click the Expert Advice tab to enter text viewable from the event workspace.
9. Click the Action tab to enter a command to be invoked when the situation fires.
Learning About OMEGAMON XE for DB2 on z/OS 43
Using CandleNet Portal to Work with Situations
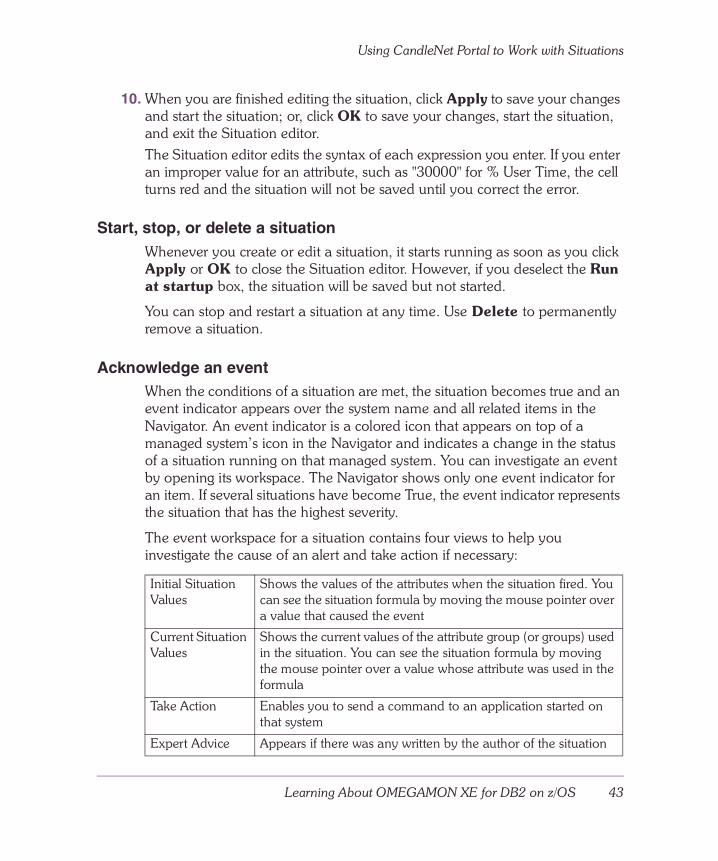
10. When you are finished editing the situation, click Apply to save your changes and start the situation; or, click OK to save your changes, start the situation, and exit the Situation editor.The Situation editor edits the syntax of each expression you enter. If you enter an improper value for an attribute, such as "30000" for % User Time, the cell turns red and the situation will not be saved until you correct the error.
Start, stop, or delete a situationWhenever you create or edit a situation, it starts running as soon as you click Apply or OK to close the Situation editor. However, if you deselect the Run at startup box, the situation will be saved but not started.
You can stop and restart a situation at any time. Use Delete to permanently remove a situation.
Acknowledge an eventWhen the conditions of a situation are met, the situation becomes true and an event indicator appears over the system name and all related items in the Navigator. An event indicator is a colored icon that appears on top of a managed system’s icon in the Navigator and indicates a change in the status of a situation running on that managed system. You can investigate an event by opening its workspace. The Navigator shows only one event indicator for an item. If several situations have become True, the event indicator represents the situation that has the highest severity.
The event workspace for a situation contains four views to help you investigate the cause of an alert and take action if necessary:
Initial Situation Values
Shows the values of the attributes when the situation fired. You can see the situation formula by moving the mouse pointer over a value that caused the event
Current Situation Values
Shows the current values of the attribute group (or groups) used in the situation. You can see the situation formula by moving the mouse pointer over a value whose attribute was used in the formula
Take Action Enables you to send a command to an application started on that system
Expert Advice Appears if there was any written by the author of the situation
Using CandleNet Portal to Work with Situations
44 OMEGAMON XE for DB2 on z/OS User’s Guide, Version 300
You can create an acknowledgement to indicate that you have seen the event and have taken ownership of the problem. Raised events that show a blue checkmark in the Navigator have been acknowledged. You can clear the event by resetting the situation. However, when you reset a situation, you can no longer acknowledge it.
Introducing OMEGAMON XE for DB2 on z/OS Workspaces 45
Introducing OMEGAMON XEfor DB2 on z/OS Workspaces
IntroductionThis chapter introduces you to the organization of OMEGAMON XE for DB2 on z/OS workspaces viewed from CandleNet Portal®, and provides navigation information.
Chapter contentsOMEGAMON XE for DB2 on z/OS Workspaces . . . . . . . . . . . . . . . . . . . . 46Using CandleNet Portal to Navigate Between Workspaces . . . . . . . . . . . . 50
3
OMEGAMON XE for DB2 on z/OS Workspaces
46 OMEGAMON XE for DB2 on z/OS User’s Guide, Version 300
OMEGAMON XE for DB2 on z/OS Workspaces
OverviewIn this unit you learn about the organization of OMEGAMON XE for DB2 on z/OS information.
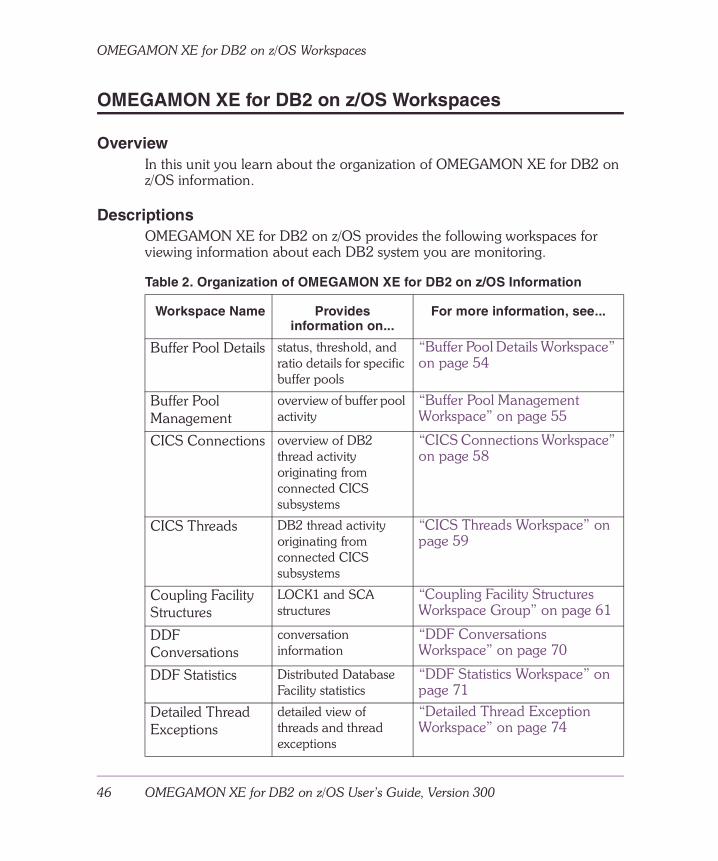
DescriptionsOMEGAMON XE for DB2 on z/OS provides the following workspaces for viewing information about each DB2 system you are monitoring.
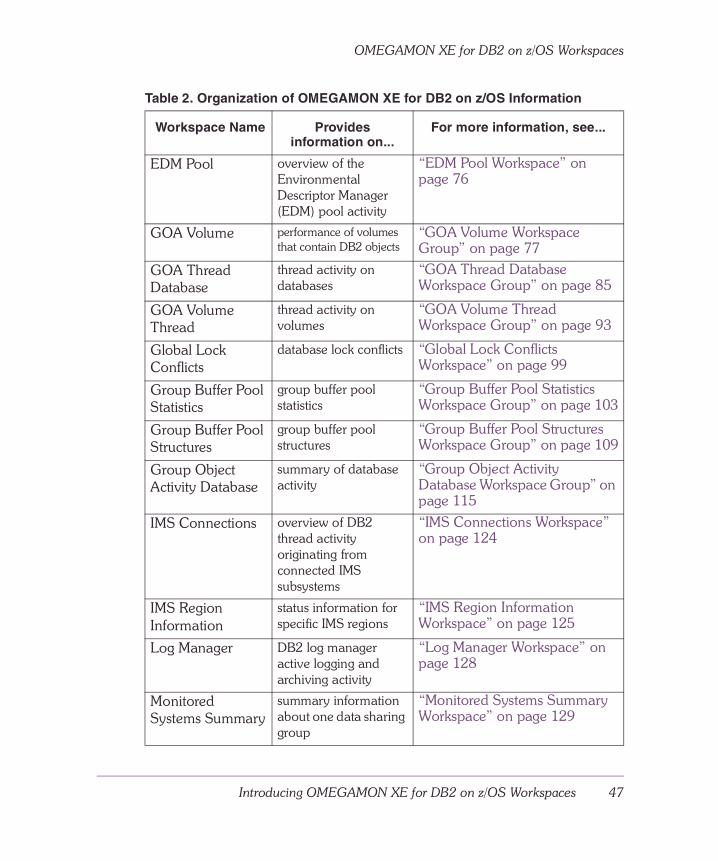
Table 2. Organization of OMEGAMON XE for DB2 on z/OS Information
Workspace Name Provides information on...
For more information, see...
Buffer Pool Details status, threshold, and ratio details for specific buffer pools
“Buffer Pool Details Workspace” on page 54
Buffer Pool Management
overview of buffer pool activity
“Buffer Pool Management Workspace” on page 55
CICS Connections overview of DB2 thread activity originating from connected CICS subsystems
“CICS Connections Workspace” on page 58
CICS Threads DB2 thread activity originating from connected CICS subsystems
“CICS Threads Workspace” on page 59
Coupling Facility Structures
LOCK1 and SCA structures
“Coupling Facility Structures Workspace Group” on page 61
DDF Conversations
conversation information
“DDF Conversations Workspace” on page 70
DDF Statistics Distributed Database Facility statistics
“DDF Statistics Workspace” on page 71
Detailed Thread Exceptions
detailed view of threads and thread exceptions
“Detailed Thread Exception Workspace” on page 74
Introducing OMEGAMON XE for DB2 on z/OS Workspaces 47
OMEGAMON XE for DB2 on z/OS Workspaces
EDM Pool overview of the Environmental Descriptor Manager (EDM) pool activity
“EDM Pool Workspace” on page 76
GOA Volume performance of volumes that contain DB2 objects
“GOA Volume Workspace Group” on page 77
GOA Thread Database
thread activity on databases
“GOA Thread Database Workspace Group” on page 85
GOA Volume Thread
thread activity on volumes
“GOA Volume Thread Workspace Group” on page 93
Global Lock Conflicts
database lock conflicts “Global Lock Conflicts Workspace” on page 99
Group Buffer Pool Statistics
group buffer pool statistics
“Group Buffer Pool Statistics Workspace Group” on page 103
Group Buffer Pool Structures
group buffer pool structures
“Group Buffer Pool Structures Workspace Group” on page 109
Group Object Activity Database
summary of database activity
“Group Object Activity Database Workspace Group” on page 115
IMS Connections overview of DB2 thread activity originating from connected IMS subsystems
“IMS Connections Workspace” on page 124
IMS Region Information
status information for specific IMS regions
“IMS Region Information Workspace” on page 125
Log Manager DB2 log manager active logging and archiving activity
“Log Manager Workspace” on page 128
Monitored Systems Summary
summary information about one data sharing group
“Monitored Systems Summary Workspace” on page 129
Table 2. Organization of OMEGAMON XE for DB2 on z/OS Information
Workspace Name Provides information on...
For more information, see...
OMEGAMON XE for DB2 on z/OS Workspaces
48 OMEGAMON XE for DB2 on z/OS User’s Guide, Version 300
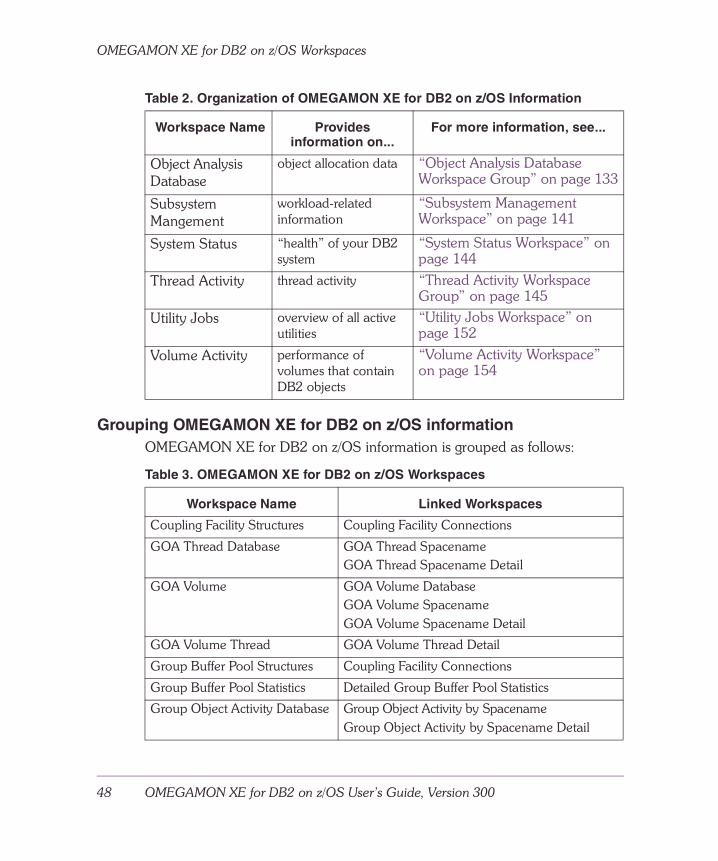
Grouping OMEGAMON XE for DB2 on z/OS informationOMEGAMON XE for DB2 on z/OS information is grouped as follows:
Object Analysis Database
object allocation data “Object Analysis Database Workspace Group” on page 133
Subsystem Mangement
workload-related information
“Subsystem Management Workspace” on page 141
System Status “health” of your DB2 system
“System Status Workspace” on page 144
Thread Activity thread activity “Thread Activity Workspace Group” on page 145
Utility Jobs overview of all active utilities
“Utility Jobs Workspace” on page 152
Volume Activity performance of volumes that contain DB2 objects
“Volume Activity Workspace” on page 154
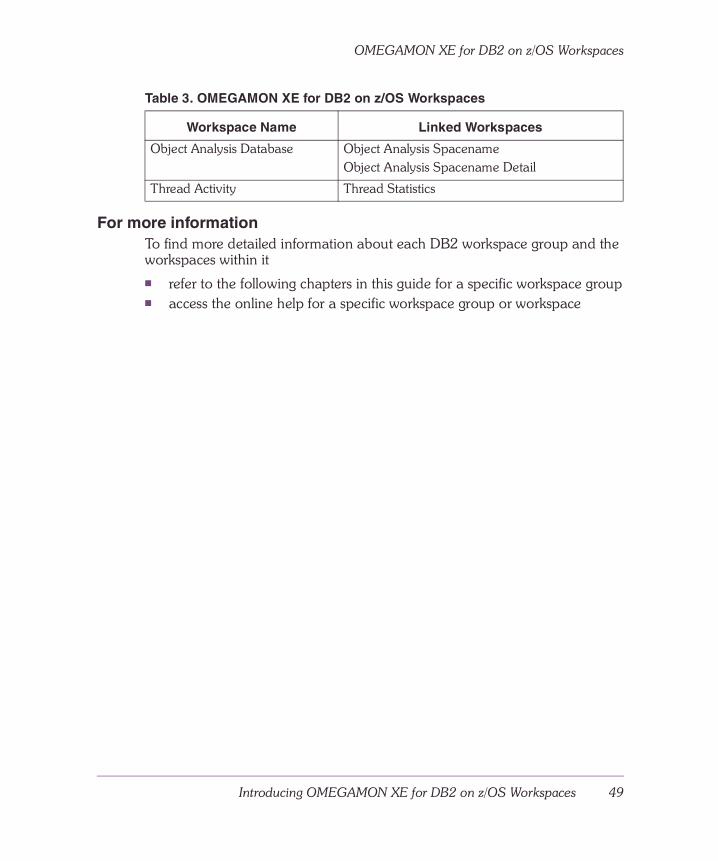
Table 3. OMEGAMON XE for DB2 on z/OS Workspaces
Workspace Name Linked Workspaces
Coupling Facility Structures Coupling Facility Connections
GOA Thread Database GOA Thread Spacename GOA Thread Spacename Detail
GOA Volume GOA Volume Database GOA Volume Spacename GOA Volume Spacename Detail
GOA Volume Thread GOA Volume Thread Detail
Group Buffer Pool Structures Coupling Facility Connections
Group Buffer Pool Statistics Detailed Group Buffer Pool Statistics
Group Object Activity Database Group Object Activity by Spacename Group Object Activity by Spacename Detail
Table 2. Organization of OMEGAMON XE for DB2 on z/OS Information
Workspace Name Provides information on...
For more information, see...
Introducing OMEGAMON XE for DB2 on z/OS Workspaces 49
OMEGAMON XE for DB2 on z/OS Workspaces
For more information To find more detailed information about each DB2 workspace group and the workspaces within it� refer to the following chapters in this guide for a specific workspace group� access the online help for a specific workspace group or workspace
Object Analysis Database Object Analysis Spacename Object Analysis Spacename Detail
Thread Activity Thread Statistics
Table 3. OMEGAMON XE for DB2 on z/OS Workspaces
Workspace Name Linked Workspaces
Using CandleNet Portal to Navigate Between Workspaces
50 OMEGAMON XE for DB2 on z/OS User’s Guide, Version 300
Using CandleNet Portal to Navigate Between Workspaces
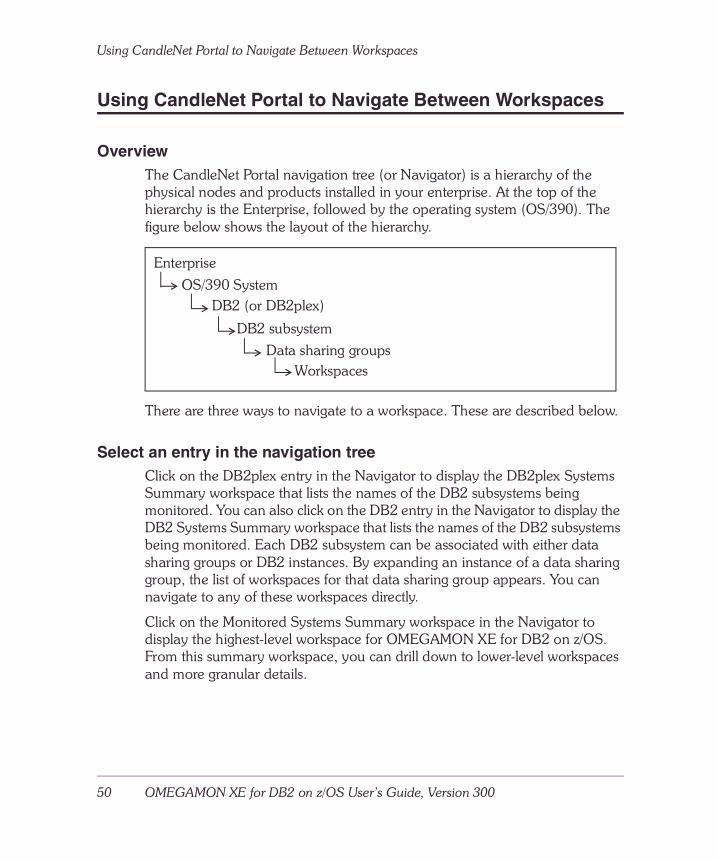
OverviewThe CandleNet Portal navigation tree (or Navigator) is a hierarchy of the physical nodes and products installed in your enterprise. At the top of the hierarchy is the Enterprise, followed by the operating system (OS/390). The figure below shows the layout of the hierarchy.
There are three ways to navigate to a workspace. These are described below.
Select an entry in the navigation treeClick on the DB2plex entry in the Navigator to display the DB2plex Systems Summary workspace that lists the names of the DB2 subsystems being monitored. You can also click on the DB2 entry in the Navigator to display the DB2 Systems Summary workspace that lists the names of the DB2 subsystems being monitored. Each DB2 subsystem can be associated with either data sharing groups or DB2 instances. By expanding an instance of a data sharing group, the list of workspaces for that data sharing group appears. You can navigate to any of these workspaces directly.
Click on the Monitored Systems Summary workspace in the Navigator to display the highest-level workspace for OMEGAMON XE for DB2 on z/OS. From this summary workspace, you can drill down to lower-level workspaces and more granular details.
Enterprise
OS/390 SystemDB2 (or DB2plex)
DB2 subsystem
Data sharing groupsWorkspaces
Introducing OMEGAMON XE for DB2 on z/OS Workspaces 51
Using CandleNet Portal to Navigate Between Workspaces
Select a workspace from the View > Workspace pull-downWorkspaces you have created have an entry in the View > Workspace pull-down menu. To navigate to these user-defined workspaces, click on a workspace name to select it from the pull-down menu.

Using CandleNet Portal to Navigate Between Workspaces
52 OMEGAMON XE for DB2 on z/OS User’s Guide, Version 300
Buffer Pool Workspaces 53
Buffer Pool Workspaces
IntroductionThis chapter describes the buffer pool workspaces.
Reminder about sorting and filtering dataIn CandleNet Portal®, you can filter the information presented in a workspace by moving from the top-level workspace to lower-level workspaces or by using the Filtering Properties dialog. See “Filtering information” on page 38 for more information. Sorting from the CandleNet Portal is covered in “Sorting Information” on page 39.
Workspace fields and definitionsTo view a list of workspace fields and their definitions, access the online help for the Buffer Pool workspaces.
Chapter contentsBuffer Pool Details Workspace . . . . . . . . . . . . . . . . . . . . . . . . . . . . . . . . . 54Buffer Pool Management Workspace . . . . . . . . . . . . . . . . . . . . . . . . . . . . 55
4
Buffer Pool Details Workspace
54 OMEGAMON XE for DB2 on z/OS User’s Guide, Version 300
Buffer Pool Details Workspace
DescriptionThe Buffer Pool Details workspace provides status, threshold, and ratio details associated with specific buffer pool activity. This workspace is comprised of three views. The views are
� Ratio (table view)
� Status (table view)
� Thresholds (table view)
The Ratio table provides thread performance details associated with the buffer pool. The Status table provides “at a glance” buffer pool details, including size and page allocation information. The Thresholds table lists the thread's performance and status thresholds for the selected buffer pool.
Buffer Pool Workspaces 55
Buffer Pool Management Workspace
Buffer Pool Management Workspace
DescriptionBuffer pools, also called virtual buffer pools, are areas of virtual storage where DB2 temporarily stores pages of table spaces or indexes. The Buffer Pool Management workspace provides an overview of buffer pool activity. This workspace is comprised of two views. The views are
� Buffer Pool Management (table view)
� Buffer Pool Rates (bar chart)
The Buffer Pool Management table displays activity details for specific buffer pools. The Buffer Pool Rates chart displays the rate of get page operations, read I/O operations, prefetch requests, and write I/Os performed.

Buffer Pool Management Workspace
56 OMEGAMON XE for DB2 on z/OS User’s Guide, Version 300

CICS Workspaces 57
CICS Workspaces
IntroductionThis chapter describes the CICS workspaces.
Reminder about sorting and filtering dataIn CandleNet Portal®, you can filter the information presented in a workspace by moving from the top-level workspace to lower-level workspaces or by using the Filtering Properties dialog. See “Filtering information” on page 38 for more information. Sorting from the CandleNet Portal is covered in “Sorting Information” on page 39.
Workspace fields and definitionsTo view a list of workspace fields and their definitions, access the online help for the CICS workspaces.
Chapter contentsCICS Connections Workspace . . . . . . . . . . . . . . . . . . . . . . . . . . . . . . . . . 58CICS Threads Workspace . . . . . . . . . . . . . . . . . . . . . . . . . . . . . . . . . . . . . 59
5
CICS Connections Workspace
58 OMEGAMON XE for DB2 on z/OS User’s Guide, Version 300
CICS Connections Workspace
DescriptionThe CICS Connections workspace provides an overview of DB2 thread activity originating from connected CICS subsystems. It provides information on a connection level about all CICS subsystems identified to DB2. This workspace is comprised of two views. The views are
� CICS Connections Summary (table view)
� Thread Usage (bar chart)
The CICS Connections Summary table lists thread status details, including the components of the Thread Usage chart and thread utilization data. The Thread Usage chart displays the counts of currently active pool threads, pool threads that are waiting because the maximum has been reached, and active threads for this CICS connection (including entry and pool threads).
CICS Workspaces 59
CICS Threads Workspace
CICS Threads Workspace
DescriptionThe CICS Threads workspace provides data to monitor DB2 thread activity originating from connected CICS subsystems. This workspace is comprised of two views. The views are
� CICS Threads (table view)
� Thread Counts (bar chart)
The CICS Threads table identifies and measures thread activity from the CICS region. The Thread Counts chart displays “at a glance” counts of entry threads in use, entry threads waiting, and pool thread overflow.
Note: This workspace is available from the CICS Connections workspace and only when at least one thread is active from the CICS region.

CICS Threads Workspace
60 OMEGAMON XE for DB2 on z/OS User’s Guide, Version 300

Coupling Facility Structures Workspace Group 61
Coupling Facility StructuresWorkspace Group
IntroductionThis chapter includes detailed information about the workspaces in the Coupling Facility Structures group.
Chapter contentsIntroducing the Coupling Facility Structures Workspaces. . . . . . . . . . . . . . 62Coupling Facility Structures Workspace. . . . . . . . . . . . . . . . . . . . . . . . . . . 64Coupling Facility Connections Workspace. . . . . . . . . . . . . . . . . . . . . . . . . 65Typical Scenarios . . . . . . . . . . . . . . . . . . . . . . . . . . . . . . . . . . . . . . . . . . . 66
6
Introducing the Coupling Facility Structures Workspaces
62 OMEGAMON XE for DB2 on z/OS User’s Guide, Version 300
Introducing the Coupling Facility Structures Workspaces
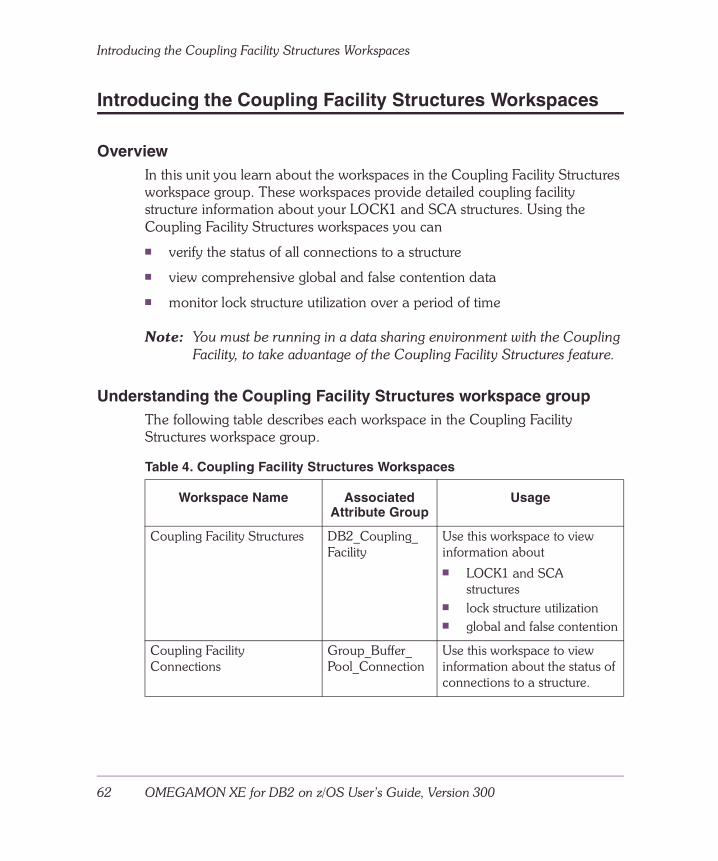
OverviewIn this unit you learn about the workspaces in the Coupling Facility Structures workspace group. These workspaces provide detailed coupling facility structure information about your LOCK1 and SCA structures. Using the Coupling Facility Structures workspaces you can
� verify the status of all connections to a structure
� view comprehensive global and false contention data
� monitor lock structure utilization over a period of time
Note: You must be running in a data sharing environment with the Coupling Facility, to take advantage of the Coupling Facility Structures feature.
Understanding the Coupling Facility Structures workspace groupThe following table describes each workspace in the Coupling Facility Structures workspace group.
Table 4. Coupling Facility Structures Workspaces
Workspace Name Associated Attribute Group
Usage
Coupling Facility Structures DB2_Coupling_Facility
Use this workspace to view information about� LOCK1 and SCA
structures� lock structure utilization� global and false contention
Coupling Facility Connections
Group_Buffer_Pool_Connection
Use this workspace to view information about the status of connections to a structure.
Coupling Facility Structures Workspace Group 63
Introducing the Coupling Facility Structures Workspaces
Reminder about sorting and filtering dataIn CandleNet Portal®, you can filter the information presented in a workspace by moving from the top-level workspace to lower-level workspaces or by using the Filtering Properties dialog. See “Filtering information” on page 38 for more information. Sorting from the CandleNet Portal is covered in “Sorting Information” on page 39.
Coupling Facility Structures Workspace
64 OMEGAMON XE for DB2 on z/OS User’s Guide, Version 300
Coupling Facility Structures Workspace
OverviewIn this unit you learn about the Coupling Facility Structures workspace. The Coupling Facility Structures workspace provides a global view of LOCK1 and SCA coupling facility structures for a specific data sharing group.
Use the Coupling Facility Structures to
� monitor activity rates within a structure
� track structure utilization over a period of time
� view structure data for a true coupling facility situation
� view comprehensive global and false contention data
Workspace fields and definitionsTo view a list of workspace fields and their definitions, access the online help for the Coupling Facility Structures workspace.
Coupling Facility Structures Workspace Group 65
Coupling Facility Connections Workspace
Coupling Facility Connections Workspace
OverviewIn this unit you learn about the Coupling Facility Connections workspace. The Coupling Facility Connections workspace displays connection status information for all connections to a specific coupling facility structure.
Use the Coupling Facility Connections workspace to
� view the status of all connections to a structure
� identify the MVS system where the DB2 subsystems are running, with the associated coupling facility name and jobname
Workspace fields and definitionsTo view a list of workspace fields and their definitions, access the online help for the Coupling Facility Connections workspace.
Typical Scenarios
66 OMEGAMON XE for DB2 on z/OS User’s Guide, Version 300
Typical Scenarios
OverviewIn this unit we present several scenarios that describe how you can use the workspaces in the Coupling Facility Structures workspace group.
Scenario 1: Monitoring coupling facility structuresYou can use the Coupling Facility Structures workspace to verify that your LOCK1 and SCA structures are active and to track structure utilization over a period of time.
For example, you may want to monitor the activity of your LOCK1 structures to determine if they are filling up with entries.
Access the Coupling Facility Structures workspace. Notice that, by default, the workspace sorts in alphabetical order by structure name. To see the Structure Used Percent column, scroll to the right.
To track the structure activity over a period of time, update or refresh the structure data on the Coupling Facility Structures workspace by clicking Refresh Now on the View pull-down menu. The Coupling Facility Structures workspace redisplays with the most current data available from the Candle Management Server (CMS).
Scenario 2: Investigating a true coupling facility situationYou can use the Coupling Facility Structures workspace to investigate a coupling facility situation, viewing detailed structure data for one or more LOCK1 or SCA structures that caused a situation to evaluate to true.
For example, you may want to investigate the predefined situation DB2_CF_Structure_Use_Warning, which evaluates to true when Structure Used Percent is in the range of 80 to 90 percent.
Access the Coupling Facility Structures Workspace. To see the Structure Used Percent value for each coupling facility structure, scroll to the right.
Coupling Facility Structures Workspace Group 67
Typical Scenarios
Scenario 3: Analyzing coupling facility connectionsYou can use the Coupling Facility Connections to analyze a specific coupling facility structure and view the connection status of all connections to the structure. For example, you may want to analyze a specific LOCK1 structure.
From the Coupling Facility Structures workspace, access the Coupling Facility Connections workspace for the specific LOCK1 structure. The Coupling Facility Connections workspace displays connection status information for all connections to the LOCK1 structure. You can also identify the MVS system where the DB2 subsystems are running, plus the associated coupling facility name and jobname.
Note: You can continue your investigation of a coupling facility structure by using the ability to access a host session from CandleNet Portal to display an OMEGAMON II host session.

Typical Scenarios
68 OMEGAMON XE for DB2 on z/OS User’s Guide, Version 300

DDF Workspaces 69
DDF Workspaces
IntroductionThis chapter describes the DDF workspaces.
Reminder about sorting and filtering dataIn CandleNet Portal®, you can filter the information presented in a workspace by moving from the top-level workspace to lower-level workspaces or by using the Filtering Properties dialog. See “Filtering information” on page 38 for more information. Sorting from the CandleNet Portal is covered in “Sorting Information” on page 39.
Workspace fields and definitionsTo view a list of workspace fields and their definitions, access the online help for the Global Lock Conflicts workspace.
Chapter contentsDDF Conversations Workspace . . . . . . . . . . . . . . . . . . . . . . . . . . . . . . . . 70DDF Statistics Workspace . . . . . . . . . . . . . . . . . . . . . . . . . . . . . . . . . . . . . 71
7
DDF Conversations Workspace
70 OMEGAMON XE for DB2 on z/OS User’s Guide, Version 300
DDF Conversations Workspace
DescriptionThe DDF Conversations workspace presents conversation (connection between two transaction programs) information. This workspace is comprised of a single view. The view is
� DDF Conversations (table view)
The DDF Conversations table lists conversation details, including identifiers, counts, and maximums.
Note: This workspace is available from the System Status workspace and only when the DB2 system is configured to use the Distributed Data Facility.
DDF Workspaces 71
DDF Statistics Workspace
DDF Statistics Workspace
DescriptionThe DDF Statistics workspace provides Distributed Database Facility statistics, including send and receive counts. This workspace is comprised of two views. The views are
� Distributed Thread Statistics (table view)
� Send/Receive Counts (bar chart)
The Distributed Thread Statistics table lists activity data associated with the DDF. The Send/Receive Counts chart displays “at a glance” counts of SQL calls, messages, and transactions (received and sent).
Note: This workspace is available from the Detailed Thread Exception workspace for any thread defined as an Allied-Distributed thread.

DDF Statistics Workspace
72 OMEGAMON XE for DB2 on z/OS User’s Guide, Version 300

Detailed Thread Exception Workspace 73
Detailed Thread ExceptionWorkspace
IntroductionThis chapter describes the Detailed Thread Exception workspace.
Reminder about sorting and filtering dataIn CandleNet Portal®, you can filter the information presented in a workspace by moving from the top-level workspace to lower-level workspaces or by using the Filtering Properties dialog. See “Filtering information” on page 38 for more information. Sorting from the CandleNet Portal is covered in “Sorting Information” on page 39.
Workspace fields and definitionsTo view a list of workspace fields and their definitions, access the online help for the Detailed Thread Exception workspace.
Chapter contentsDetailed Thread Exception Workspace . . . . . . . . . . . . . . . . . . . . . . . . . . . 74
8
Detailed Thread Exception Workspace
74 OMEGAMON XE for DB2 on z/OS User’s Guide, Version 300
Detailed Thread Exception Workspace
DescriptionThe Detailed Thread Exception workspace provides a detailed view of threads and thread exceptions connected to DB2. This workspace is comprised of a single view. The view is
� Detailed Thread Exceptions (table view)
The Detailed Thread Exceptions table lists status data for the activity of individual threads.
EDM Pool Workspace 75
EDM Pool Workspace
IntroductionThis chapter describes the EDM Pool workspace.
Reminder about sorting and filtering dataIn CandleNet Portal®, you can filter the information presented in a workspace by moving from the top-level workspace to lower-level workspaces or by using the Filtering Properties dialog. See “Filtering information” on page 38 for more information. Sorting from the CandleNet Portal is covered in “Sorting Information” on page 39.
Workspace fields and definitionsTo view a list of workspace fields and their definitions, access the online help for the Global Lock Conflicts workspace.
Chapter contentsEDM Pool Workspace . . . . . . . . . . . . . . . . . . . . . . . . . . . . . . . . . . . . . . . . 76
9
EDM Pool Workspace
76 OMEGAMON XE for DB2 on z/OS User’s Guide, Version 300
EDM Pool Workspace
DescriptionThe EDM Pool workspace provides an overview of the Environmental Descriptor Manager (EDM) pool activity connected with DB2. This workspace is comprised of three views. The views are
� EDM Statistics (table view)
� EDM Summary (table view)
� EDM Utilization (pie chart)
The EDM Statistics table lists total counts, counts during the last sample period, and the per second count for a variety of tasks associated with the EDM pool. The EDM Summary table provides activity details of the EDM pool, including the number of pages dedicated to a type of pool usage and the percentage of the EDM pool dedicated to that type of usage. The EDM Utilization chart displays the relative distribution of available pages, cursor table pages, database descriptor pages, and package table pages.
GOA Volume Workspace Group 77
GOA VolumeWorkspace Group
IntroductionThis chapter includes detailed information about the workspaces in the Group Object Analysis (GOA) Volume workspace group.
Chapter contentsIntroducing the GOA Volume Workspace Group . . . . . . . . . . . . . . . . . . . 78GOA Volume Workspace . . . . . . . . . . . . . . . . . . . . . . . . . . . . . . . . . . . . . 80GOA Volume Database Workspace . . . . . . . . . . . . . . . . . . . . . . . . . . . . . 81GOA Volume Spacename Workspace. . . . . . . . . . . . . . . . . . . . . . . . . . . . 82GOA Volume Spacename Detail Workspace. . . . . . . . . . . . . . . . . . . . . . . 83Typical Scenarios . . . . . . . . . . . . . . . . . . . . . . . . . . . . . . . . . . . . . . . . . . . 84
10
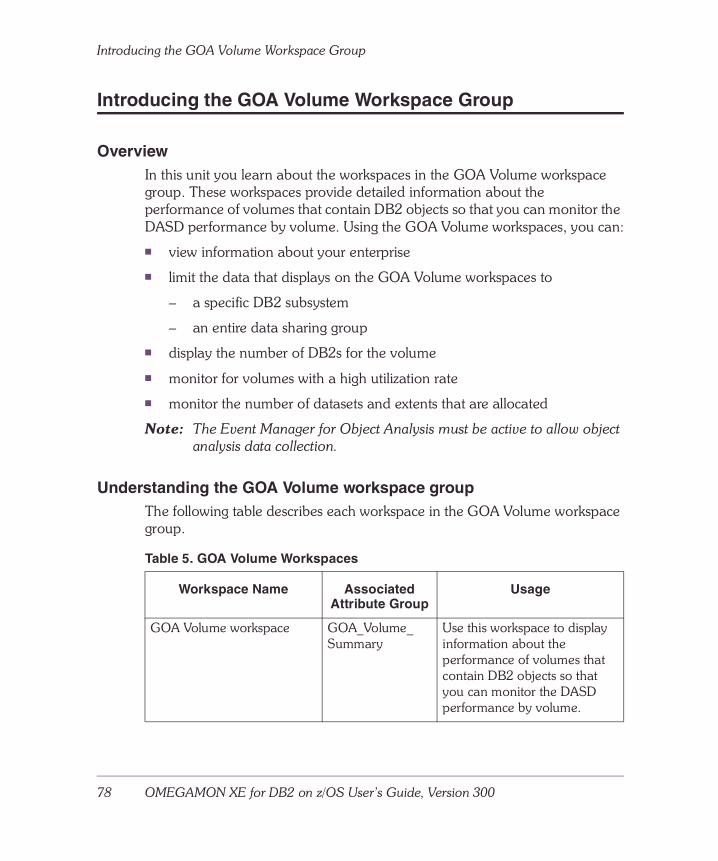
Introducing the GOA Volume Workspace Group
78 OMEGAMON XE for DB2 on z/OS User’s Guide, Version 300
Introducing the GOA Volume Workspace Group
OverviewIn this unit you learn about the workspaces in the GOA Volume workspace group. These workspaces provide detailed information about the performance of volumes that contain DB2 objects so that you can monitor the DASD performance by volume. Using the GOA Volume workspaces, you can:
� view information about your enterprise
� limit the data that displays on the GOA Volume workspaces to
– a specific DB2 subsystem
– an entire data sharing group
� display the number of DB2s for the volume
� monitor for volumes with a high utilization rate
� monitor the number of datasets and extents that are allocated
Note: The Event Manager for Object Analysis must be active to allow object analysis data collection.
Understanding the GOA Volume workspace groupThe following table describes each workspace in the GOA Volume workspace group.
Table 5. GOA Volume Workspaces
Workspace Name Associated Attribute Group
Usage
GOA Volume workspace GOA_Volume_Summary
Use this workspace to display information about the performance of volumes that contain DB2 objects so that you can monitor the DASD performance by volume.
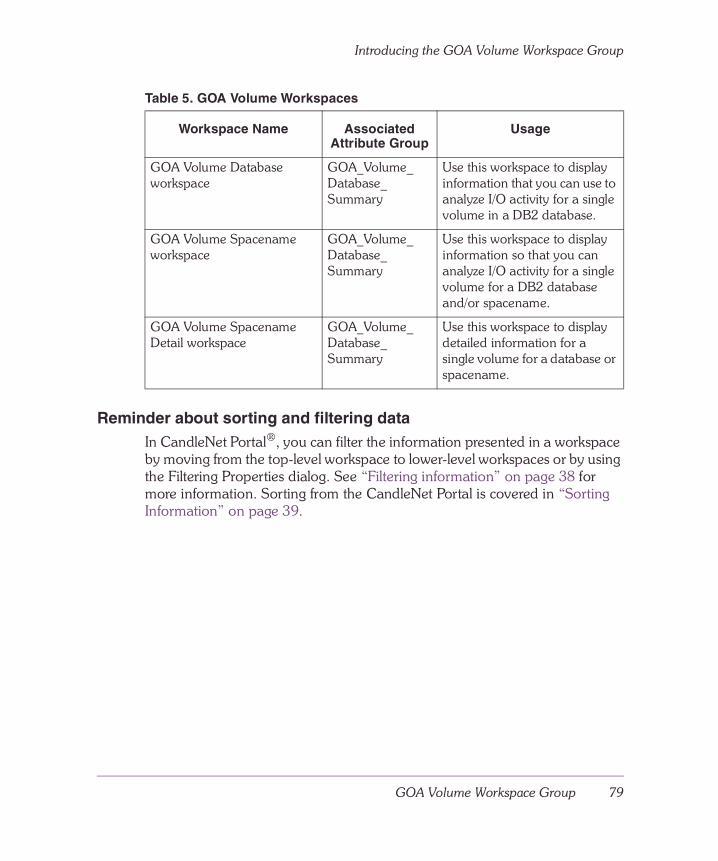
GOA Volume Workspace Group 79
Introducing the GOA Volume Workspace Group
Reminder about sorting and filtering dataIn CandleNet Portal®, you can filter the information presented in a workspace by moving from the top-level workspace to lower-level workspaces or by using the Filtering Properties dialog. See “Filtering information” on page 38 for more information. Sorting from the CandleNet Portal is covered in “Sorting Information” on page 39.
GOA Volume Database workspace
GOA_Volume_Database_Summary
Use this workspace to display information that you can use to analyze I/O activity for a single volume in a DB2 database.
GOA Volume Spacename workspace
GOA_Volume_Database_Summary
Use this workspace to display information so that you can analyze I/O activity for a single volume for a DB2 database and/or spacename.
GOA Volume Spacename Detail workspace
GOA_Volume_Database_Summary
Use this workspace to display detailed information for a single volume for a database or spacename.
Table 5. GOA Volume Workspaces
Workspace Name Associated Attribute Group
Usage
GOA Volume Workspace
80 OMEGAMON XE for DB2 on z/OS User’s Guide, Version 300
GOA Volume Workspace
OverviewIn this unit you learn about the GOA Volume workspace.
The GOA Volume workspace displays information about the performance of volumes that contain DB2 objects. With this information, you can monitor the DASD performance by volume. It is particularly useful that this workspace displays volume information pertaining to DB2 activity and to non-DB2 access to the volume.
Workspace fields and definitionsTo view a list of workspace fields and their definitions, access the online help for the GOA Volume workspace.
GOA Volume Workspace Group 81
GOA Volume Database Workspace
GOA Volume Database Workspace
OverviewIn this unit you learn about the GOA Volume Database workspace.
The GOA Volume Database workspace displays information so that you can analyze I/O activity for a single volume in a DB2 database. The workspace displays a row for each database that has I/O to the selected volume during the collection interval.
Workspace fields and definitionsTo view a list of workspace fields and their definitions, access the online help for the GOA Volume Database workspace.
GOA Volume Spacename Workspace
82 OMEGAMON XE for DB2 on z/OS User’s Guide, Version 300
GOA Volume Spacename Workspace
OverviewIn this unit you learn about the GOA Volume Spacename workspace. The GOA Volume Spacename workspace displays information so that you can analyze I/O activity for a single spacename within a selected database within a selected volume.
The workspace displays information for each spacename in the selected database with I/O activity to the volume during the collection interval.
Workspace fields and definitionsTo view a list of workspace fields and their definitions, access the online help for the GOA Volume Spacename workspace.
GOA Volume Workspace Group 83
GOA Volume Spacename Detail Workspace
GOA Volume Spacename Detail Workspace
OverviewIn this unit you learn about the GOA Volume Spacename Detail workspace. The GOA Volume Spacename Detail workspace displays detailed information for an individual spacename. At this level of detail, you can determine which DB2 subsystems are using the volume. For example, for each spacename, you can display
� the DB2 identifier
� information about the DB2 operations (such as the number of I/O reads and I/O writes)
Workspace fields and definitionsTo view a list of workspace fields and their definitions, access the online help for the GOA Volume Spacename Detail workspace.
Typical Scenarios
84 OMEGAMON XE for DB2 on z/OS User’s Guide, Version 300
Typical Scenarios
OverviewIn this unit we present scenarios that describes how you can use the workspaces in the GOA Volume workspace group.
Scenario 1: Identifying objects with excessive I/O activity You can use these workspaces to determine DASD contention between multiple objects (such as multiple databases and multiple volumes).
For example, you can create a situation to monitor for excessive I/O activity and then use the workspace to identify the volume. Once the volume has been identified, you can take action to eliminate the problem by load balancing or dataset movement.
Scenario 2: Identifying bottlenecks caused by non-DB2 activityPerformance bottlenecks can be attributed to DB2 activity or to non-DB2 activity for a particular volume. With the GOA Volume workspace group, you have access to details that allow you to identify potential bottlenecks caused by non-DB2 activity.
GOA Thread Database Workspace Group 85
GOA Thread DatabaseWorkspace Group
IntroductionThis chapter includes detailed information about the workspaces in the GOA Thread Database workspace group.
Chapter contentsIntroducing the GOA Thread Database Workspaces . . . . . . . . . . . . . . . . . 86GOA Thread Database Workspace . . . . . . . . . . . . . . . . . . . . . . . . . . . . . . 88GOA Thread Spacename Workspace . . . . . . . . . . . . . . . . . . . . . . . . . . . . 89GOA Thread Spacename Detail Workspace . . . . . . . . . . . . . . . . . . . . . . . 90Typical Scenario . . . . . . . . . . . . . . . . . . . . . . . . . . . . . . . . . . . . . . . . . . . . 91
11
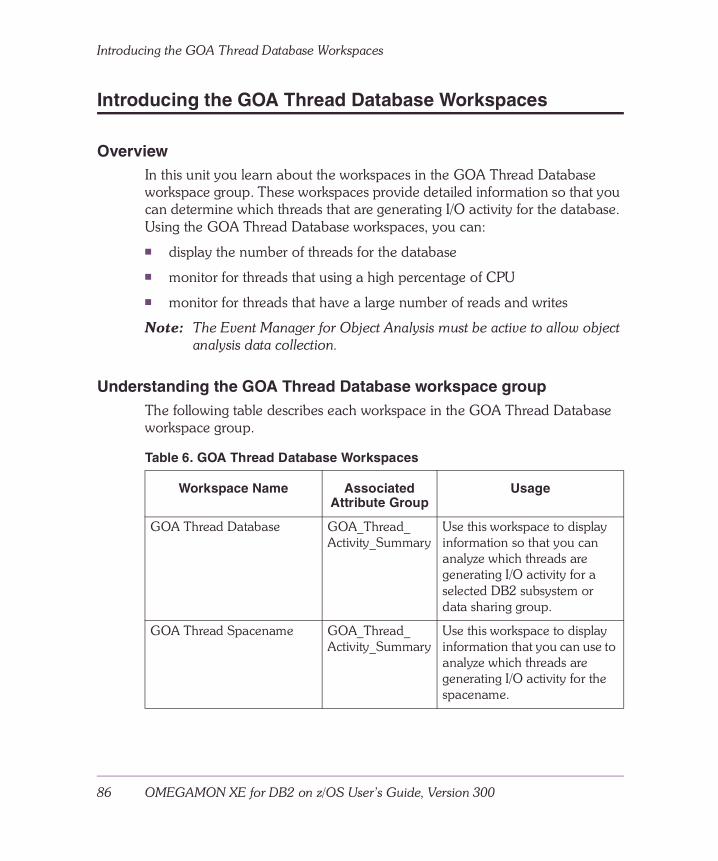
Introducing the GOA Thread Database Workspaces
86 OMEGAMON XE for DB2 on z/OS User’s Guide, Version 300
Introducing the GOA Thread Database Workspaces
OverviewIn this unit you learn about the workspaces in the GOA Thread Database workspace group. These workspaces provide detailed information so that you can determine which threads that are generating I/O activity for the database. Using the GOA Thread Database workspaces, you can:
� display the number of threads for the database
� monitor for threads that using a high percentage of CPU
� monitor for threads that have a large number of reads and writes
Note: The Event Manager for Object Analysis must be active to allow object analysis data collection.
Understanding the GOA Thread Database workspace groupThe following table describes each workspace in the GOA Thread Database workspace group.
Table 6. GOA Thread Database Workspaces
Workspace Name Associated Attribute Group
Usage
GOA Thread Database GOA_Thread_Activity_Summary
Use this workspace to display information so that you can analyze which threads are generating I/O activity for a selected DB2 subsystem or data sharing group.
GOA Thread Spacename GOA_Thread_Activity_Summary
Use this workspace to display information that you can use to analyze which threads are generating I/O activity for the spacename.
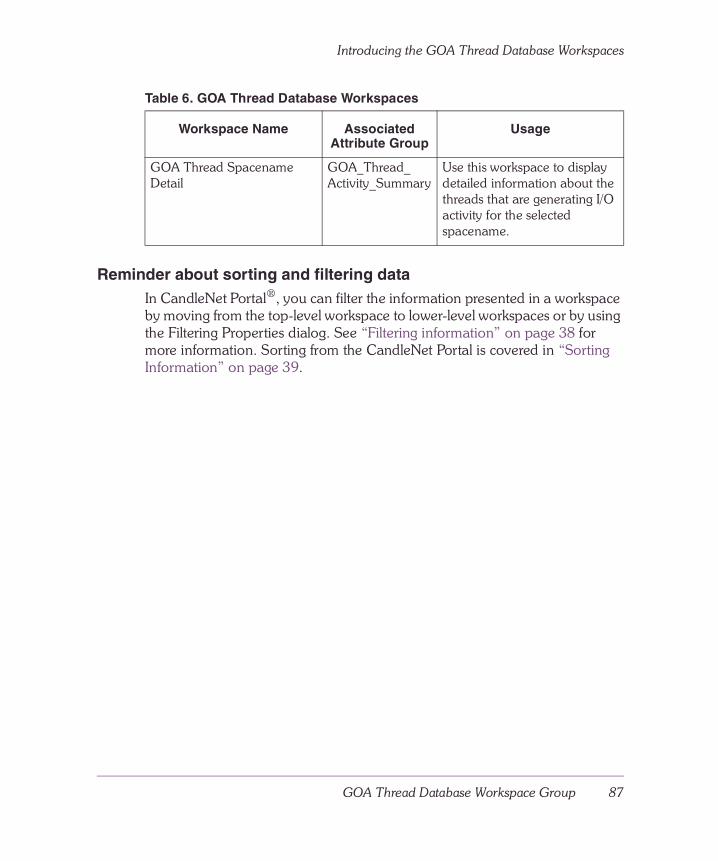
GOA Thread Database Workspace Group 87
Introducing the GOA Thread Database Workspaces
Reminder about sorting and filtering dataIn CandleNet Portal®, you can filter the information presented in a workspace by moving from the top-level workspace to lower-level workspaces or by using the Filtering Properties dialog. See “Filtering information” on page 38 for more information. Sorting from the CandleNet Portal is covered in “Sorting Information” on page 39.
GOA Thread Spacename Detail
GOA_Thread_Activity_Summary
Use this workspace to display detailed information about the threads that are generating I/O activity for the selected spacename.
Table 6. GOA Thread Database Workspaces
Workspace Name Associated Attribute Group
Usage
GOA Thread Database Workspace
88 OMEGAMON XE for DB2 on z/OS User’s Guide, Version 300
GOA Thread Database Workspace
OverviewIn this unit you learn about the GOA Thread Database workspace. The GOA Thread Database workspace displays information so that you can analyze which threads are generating I/O activity for a selected database.
Workspace fields and definitionsTo view a list of workspace fields and their definitions, access the online help for the GOA Thread Database workspace.
GOA Thread Database Workspace Group 89
GOA Thread Spacename Workspace
GOA Thread Spacename Workspace
OverviewIn this unit you learn about the GOA Thread Spacename workspace. The GOA Thread Spacename workspace displays information so that you can analyze which threads are generating I/O activity for the spacename.
The workspace displays a row for each spacename within the selected database that has thread activity during the collection interval.
Workspace fields and definitionsTo view a list of workspace fields and their definitions, access the online help for the GOA Thread Spacename workspace.
GOA Thread Spacename Detail Workspace
90 OMEGAMON XE for DB2 on z/OS User’s Guide, Version 300
GOA Thread Spacename Detail Workspace
OverviewIn this unit you learn about the GOA Thread Spacename Detail workspace.
The GOA Thread Spacename Detail workspace displays detailed information about the threads that are generating I/O activity for the spacename. For example, for a spacename, you can display
� the plan name
� the authorization identifier
� the correlation identifier
� the DB2 identifier
Workspace fields and definitionsTo view a list of workspace fields and their definitions, access the online help for the GOA Thread Spacename Detail workspace.
GOA Thread Database Workspace Group 91
Typical Scenario
Typical Scenario
OverviewIn this unit we present a scenario that describes how you can use the workspaces in the GOA Thread Database workspace group.
Scenario 1: Evaluating the impact of a thread You can use this workspace to evaluate the impact of a thread on resources in a DB2 environment by determining which objects are being impacted by the thread.
For example, you can use the workspace to determine which tablespaces or databases are being impacted by the poor performing thread.

Typical Scenario
92 OMEGAMON XE for DB2 on z/OS User’s Guide, Version 300
GOA Volume Thread Workspace Group 93
GOA Volume ThreadWorkspace Group
IntroductionThis chapter includes detailed information about the workspaces in the GOA Volume Thread workspace group.
Chapter contentsIntroducing GOA Volume Thread Workspaces . . . . . . . . . . . . . . . . . . . . . 94GOA Volume Thread Workspace . . . . . . . . . . . . . . . . . . . . . . . . . . . . . . . 95GOA Volume Thread Detail Workspace . . . . . . . . . . . . . . . . . . . . . . . . . . 96Typical Scenario . . . . . . . . . . . . . . . . . . . . . . . . . . . . . . . . . . . . . . . . . . . . 97
12
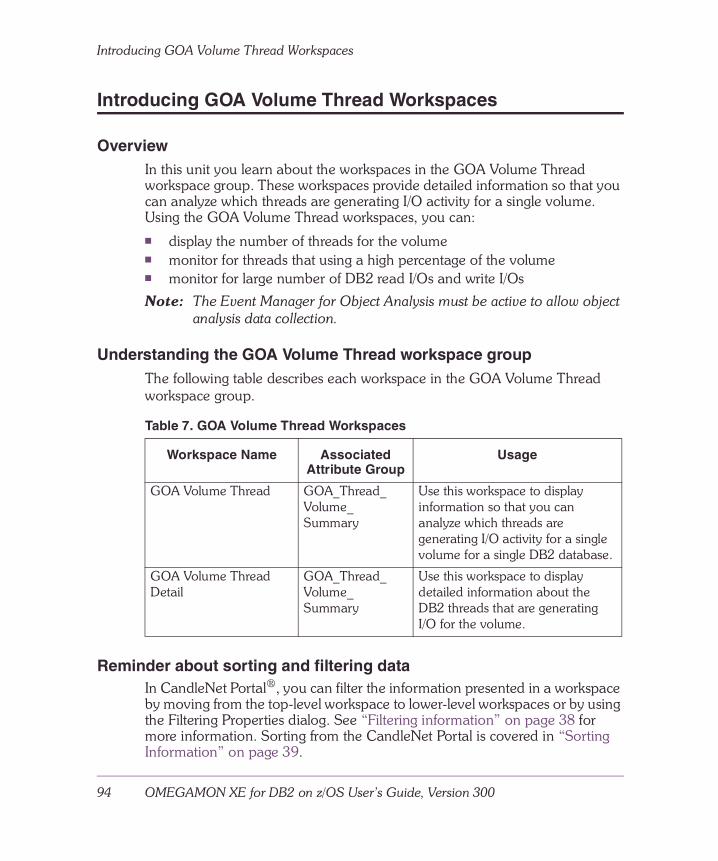
Introducing GOA Volume Thread Workspaces
94 OMEGAMON XE for DB2 on z/OS User’s Guide, Version 300
Introducing GOA Volume Thread Workspaces
OverviewIn this unit you learn about the workspaces in the GOA Volume Thread workspace group. These workspaces provide detailed information so that you can analyze which threads are generating I/O activity for a single volume. Using the GOA Volume Thread workspaces, you can:� display the number of threads for the volume � monitor for threads that using a high percentage of the volume � monitor for large number of DB2 read I/Os and write I/Os
Note: The Event Manager for Object Analysis must be active to allow object analysis data collection.
Understanding the GOA Volume Thread workspace groupThe following table describes each workspace in the GOA Volume Thread workspace group.
Reminder about sorting and filtering dataIn CandleNet Portal®, you can filter the information presented in a workspace by moving from the top-level workspace to lower-level workspaces or by using the Filtering Properties dialog. See “Filtering information” on page 38 for more information. Sorting from the CandleNet Portal is covered in “Sorting Information” on page 39.
Table 7. GOA Volume Thread Workspaces
Workspace Name Associated Attribute Group
Usage
GOA Volume Thread GOA_Thread_Volume_Summary
Use this workspace to display information so that you can analyze which threads are generating I/O activity for a single volume for a single DB2 database.
GOA Volume Thread Detail
GOA_Thread_Volume_Summary
Use this workspace to display detailed information about the DB2 threads that are generating I/O for the volume.
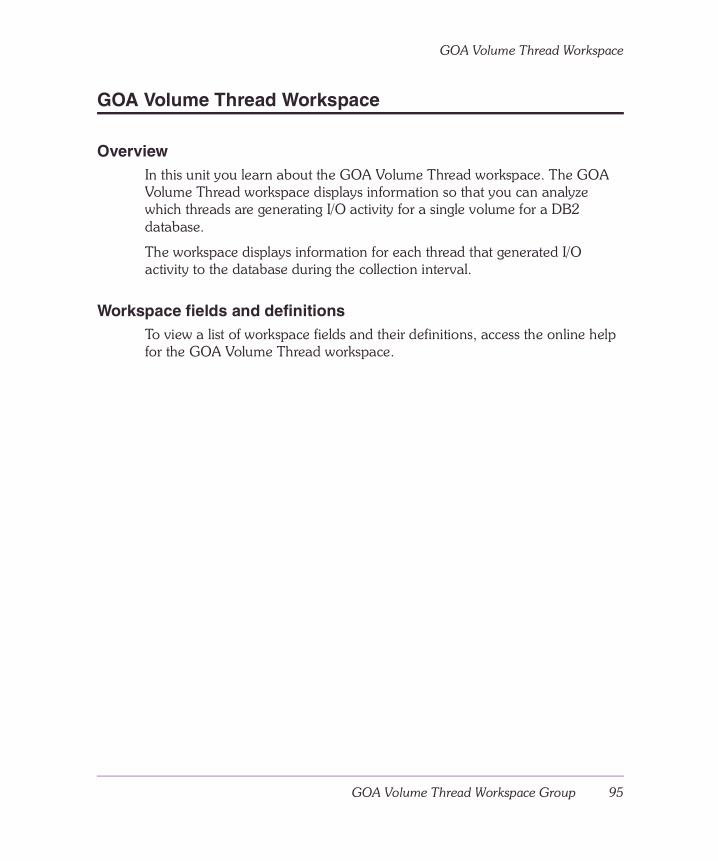
GOA Volume Thread Workspace Group 95
GOA Volume Thread Workspace
GOA Volume Thread Workspace
OverviewIn this unit you learn about the GOA Volume Thread workspace. The GOA Volume Thread workspace displays information so that you can analyze which threads are generating I/O activity for a single volume for a DB2 database.
The workspace displays information for each thread that generated I/O activity to the database during the collection interval.
Workspace fields and definitionsTo view a list of workspace fields and their definitions, access the online help for the GOA Volume Thread workspace.
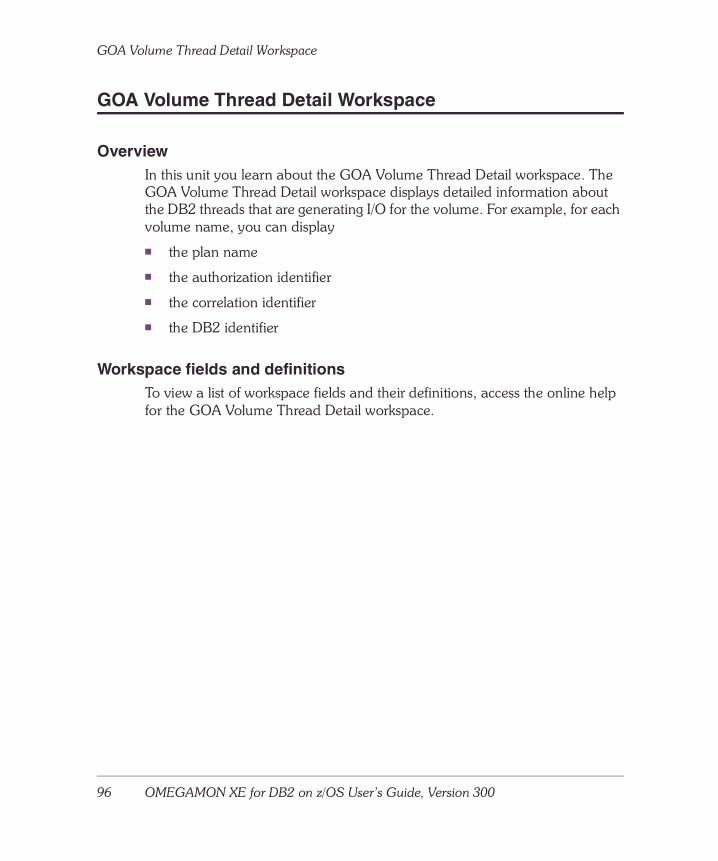
GOA Volume Thread Detail Workspace
96 OMEGAMON XE for DB2 on z/OS User’s Guide, Version 300
GOA Volume Thread Detail Workspace
OverviewIn this unit you learn about the GOA Volume Thread Detail workspace. The GOA Volume Thread Detail workspace displays detailed information about the DB2 threads that are generating I/O for the volume. For example, for each volume name, you can display
� the plan name
� the authorization identifier
� the correlation identifier
� the DB2 identifier
Workspace fields and definitionsTo view a list of workspace fields and their definitions, access the online help for the GOA Volume Thread Detail workspace.
GOA Volume Thread Workspace Group 97
Typical Scenario
Typical Scenario
OverviewIn this unit we present a scenario that describes how you can use the workspaces in the GOA Volume Thread workspace group.
Scenario: Finding bottlenecks on a volumeYou can use this workspace to identify potential bottlenecks on a volume.
For example, when too many threads attempt to access the same volume concurrently, the potential exists for a performance bottleneck. To investigate this possibility, you can evaluate which volumes currently have high DB2 thread activity. When you have determined which volumes are affected, you can drill down to obtain the details on which threads are generating the activity. You can then take corrective action to move these databases to separate volumes.

Typical Scenario
98 OMEGAMON XE for DB2 on z/OS User’s Guide, Version 300

Global Lock Conflicts Workspace 99
Global Lock ConflictsWorkspace
IntroductionThis chapter includes detailed information about the Global Lock Conflicts workspace.
Chapter contentsIntroducing the Global Lock Conflicts Workspace . . . . . . . . . . . . . . . . . . 100Workspace fields and definitions . . . . . . . . . . . . . . . . . . . . . . . . . . . . . . . 100Typical Scenarios . . . . . . . . . . . . . . . . . . . . . . . . . . . . . . . . . . . . . . . . . . 101
13
Introducing the Global Lock Conflicts Workspace
100 OMEGAMON XE for DB2 on z/OS User’s Guide, Version 300
Introducing the Global Lock Conflicts Workspace
OverviewIn this unit you learn about the Global Lock Conflicts workspace. The Global Lock Conflicts workspace provides a global view of lock conflicts for an entire data sharing group. The workspace monitors the database lock activity and provides detailed lock conflict information about your database locks.
Using the workspace you can
� identify global database lock conflicts within a data sharing group
� identify all application threads that are waiting on a database lock
� view locking data for application threads when a database lock situation evaluates to true
� evaluate and analyze database lock conflicts
� identify both the owners and waiters for a database lock
� identify the lock hierarchy chain for a specific application thread
� track lock processing for application threads over a period of time
Note: You must be running with IRLM 2.1 or above to see locking information on the Global Lock Conflicts workspaces.
Reminder about sorting and filtering dataIn CandleNet Portal®, you can filter the information presented in a workspace by moving from the top-level workspace to lower-level workspaces or by using the Filtering Properties dialog. See “Filtering information” on page 38 for more information. Sorting from the CandleNet Portal is covered in “Sorting Information” on page 39.
Workspace fields and definitionsTo view a list of workspace fields and their definitions, access the online help for the Global Lock Conflicts workspace.
Global Lock Conflicts Workspace 101
Typical Scenarios
Typical Scenarios
OverviewIn this unit we present several scenarios that describe how you can use the Global Lock Conflicts workspace.
Scenario 1: Identifying global database lock conflictsYou can use the Global Lock Conflicts workspace to monitor identify global database lock conflicts between two or more DB2 subsystems. For example, you may want to identify database lock conflicts that exist between two or more DB2 subsystems in a data sharing group.
Access the Global Lock Conflicts Workspace. Notice that the workspace displays locking data for application threads, uniquely identifying each application thread by DB2ID, plan name, and correlation identifier.
To see the Lock Status and Thread Status columns, scroll to the right. Identify threads with a WAIT_GLBLOCK thread status and a WAITER lock status. If a thread’s status is WAIT_GLBLOCK, a global lock conflict exists between this thread and a thread on another DB2 subsystem in the same data sharing group.
Identify all threads on other DB2 subsystems that have an OWNER lock status. To see the Lock Resource column for all threads, scroll to the left. When there are threads on two different DB2 subsystems that are both referencing the same lock resource, a database lock conflict exists between the two DB2 subsystems.
Scenario 2: Investigating a true database lock situationYou can use the Global Lock Conflicts workspace to investigate a database lock situation, viewing locking data for one or more application threads that caused a situation to evaluate to true.
For example, you may want to investigate the predefined situation DB2_Lock_Waiter_Time_Critical, which evaluates to true when lock elapsed time is greater than 10 seconds and lock status is Waiter.
Access the Global Lock Conflicts Workspace. Filter the workspace to show only those transactions with a lock elapsed time greater than 10 seconds. On the filtered workspace, identify all transactions with a Waiter lock status.

Typical Scenarios
102 OMEGAMON XE for DB2 on z/OS User’s Guide, Version 300

Group Buffer Pool Statistics Workspace Group 103
Group Buffer Pool StatisticsWorkspace Group
IntroductionThis chapter includes detailed information about the workspaces in the Group Buffer Pool Statistics workspace group.
Chapter contentsIntroducing the Group Buffer Pool Statistics Workspaces . . . . . . . . . . . . 104Group Buffer Pool Statistics Workspace . . . . . . . . . . . . . . . . . . . . . . . . . 105Detailed Group Buffer Pool Statistics Workspace . . . . . . . . . . . . . . . . . . 106Typical Scenarios . . . . . . . . . . . . . . . . . . . . . . . . . . . . . . . . . . . . . . . . . . 107
14
Introducing the Group Buffer Pool Statistics Workspaces
104 OMEGAMON XE for DB2 on z/OS User’s Guide, Version 300
Introducing the Group Buffer Pool Statistics Workspaces
OverviewIn this unit you learn about the workspaces in the Group Buffer Pool Statistics workspace group. These workspaces provide detailed information about the activity in a DB2 group buffer pool during the collection interval. Using the Group Buffer Pool Statistics workspaces, you can
� monitor structure utilization over a period of time
� verify the status of all connections to a structure
� view GBP statistics for a data sharing group and GBP structure
Understanding the Group Buffer Pool Statistics workspace groupThe following table describes each workspace in the Group Buffer Pool Statistics workspace group.
Reminder about sorting and filtering dataIn CandleNet Portal®, you can filter the information presented in a workspace by moving from the top-level workspace to lower-level workspaces or by using the Filtering Properties dialog. See “Filtering information” on page 38 for more information. Sorting from the CandleNet Portal is covered in “Sorting Information” on page 39.
Table 8. Group Buffer Pool Statistics Workspaces
Workspace Name Associated Attribute Group
Usage
Group Buffer Pool Statistics
GBP_Statistics Use this workspace to display group buffer pool statistics for all buffer pools defined in a data sharing group.
Detailed Group Buffer Pool Statistics
Local_GBP_Statistics_Detail
Use this workspace to display group buffer pool statistics for each DB2 subsystem using a selected buffer pool.
Group Buffer Pool Statistics Workspace Group 105
Group Buffer Pool Statistics Workspace
Group Buffer Pool Statistics Workspace
OverviewIn this unit you learn about the Group Buffer Pool Statistics workspace. The Group Buffer Pool Statistics workspace displays statistics for all defined group buffer pools for the data sharing groups. Each row contains the cumulative values for all individual DB2 systems in the data sharing group.
Use the Group Buffer Pool Statistics workspace to
� monitor the dynamic rebuild of a group buffer pool
� monitor castout paging and I/O activity
Workspace fields and definitionsTo view a list of workspace fields and their definitions, access the online help for the Group Buffer Pool Statistics workspace.
Detailed Group Buffer Pool Statistics Workspace
106 OMEGAMON XE for DB2 on z/OS User’s Guide, Version 300
Detailed Group Buffer Pool Statistics Workspace
OverviewIn this unit you learn about the Detailed Group Buffer Pool Statistics workspace. The Detailed Group Buffer Pool Statistics workspace displays group buffer pool statistics for a specific buffer pool within the data sharing group. Each row in the table view represents the amount of activity by each DB2 system in the data sharing group.
Use the Detailed Group Buffer Pool Statistics workspace to monitor
� the dynamic rebuild of a group buffer pool
� castout paging and I/O activity
Workspace fields and definitionsTo view a list of workspace fields and their definitions, access the online help for the Detailed Group Buffer Pool Statistics workspace.
Group Buffer Pool Statistics Workspace Group 107
Typical Scenarios
Typical Scenarios
OverviewIn this unit we present several scenarios that describes how you can use the workspaces in the Group Buffer Pool Statistics workspace group.
Scenario 1: Monitoring the group buffer poolsIf response time suddenly slows or if a situation is triggered against one of the buffer pool components contained within the workspace, the workspace will allow you to determine if your group buffer pools are performing as designed. If they are not performing properly after modifying the DB2 parameters, then you can use this workspace to verify that the buffer pool values are correct and that the buffer pools are working after the modifications have been made.
Scenario 2: Load balancingIf load balancing appears to be a problem, the Detailed Group Buffer Pool Statistics workspace can provide helpful information. When a large percentage of the activity to a buffer pool consistently comes from a single DB2 system, you can identify that fact by analyzing the nature of the read and write activity involving a specific buffer pool.
Armed with the details about which DB2 system is monopolizing the buffer pool, you can yield some performance improvement by offloading some of the activity to a different DB2 system.

Typical Scenarios
108 OMEGAMON XE for DB2 on z/OS User’s Guide, Version 300

Group Buffer Pool Structures Workspace Group 109
Group Buffer Pool StructuresWorkspace Group
IntroductionThis chapter includes detailed information about the workspaces in the Group Buffer Pool Structures workspace group.
Chapter contentsIntroducing the Group Buffer Pool Structures Workspaces . . . . . . . . . . . 110Group Buffer Pool Structures Workspace . . . . . . . . . . . . . . . . . . . . . . . . 111Group Buffer Pool Connections Workspace . . . . . . . . . . . . . . . . . . . . . . 112Typical Scenarios . . . . . . . . . . . . . . . . . . . . . . . . . . . . . . . . . . . . . . . . . . 113
15
Introducing the Group Buffer Pool Structures Workspaces
110 OMEGAMON XE for DB2 on z/OS User’s Guide, Version 300
Introducing the Group Buffer Pool Structures Workspaces
OverviewIn this unit you learn about the workspaces in the Group Buffer Pool Structures workspace group.
These workspaces provide detailed Coupling Facility structure information about your group buffer pool (GBP) structures. Using the Group Buffer Pool Structures workspaces you can
� verify the status of all connections to a structure� view GBP statistics for a data sharing group and GBP structure� monitor GBP structure utilization over a period of time
Note: You must be running in a data sharing environment with the Coupling Facility to take advantage of the DB2plex Group Buffer Pools feature.
Understanding the Group Buffer Pool Structures workspace groupThe following table describes each workspace in the Group Buffer Pool Structures workspace group.
Reminder about sorting and filtering dataIn CandleNet Portal®, you can filter the information presented in a workspace by moving from the top-level workspace to lower-level workspaces or by using the Filtering Properties dialog. See “Filtering information” on page 38 for more information. Sorting from the CandleNet Portal is covered in “Sorting Information” on page 39.
Table 9. Group Buffer Pool Structures Workspaces
Workspace Name
Associated Attribute Group
Usage
Group Buffer Pool Structures
Group_Buffer_Pool
Use this workspace to monitor activity rates within a structure.
Group Buffer Pool Connections
Group_BufferPool_Connection
Use this workspace to view information about the status of connections to a structure.
Group Buffer Pool Structures Workspace Group 111
Group Buffer Pool Structures Workspace
Group Buffer Pool Structures Workspace
OverviewIn this unit you learn about the Group Buffer Pool Structures workspace. This workspace provides a global view of group buffer pool structures for a specific data sharing group.
Use the Group Buffer Pool Structures workspace to
� monitor activity rates within a structure
� track structure utilization over a period of time
� view structure data for a true group buffer pool situation
Workspace fields and definitionsTo view a list of workspace fields and their definitions, access the online help for the Group Buffer Pool Structures workspaces.
Group Buffer Pool Connections Workspace
112 OMEGAMON XE for DB2 on z/OS User’s Guide, Version 300
Group Buffer Pool Connections Workspace
OverviewIn this unit you learn about the Group Buffer Pool Connections workspace. The Group Buffer Pool Connections workspace displays connection status information for all connections to a specific group buffer pool structure.
Use the Group Buffer Pool Connections workspace to
� view the status of all connections to a structure
� identify the operating system, with the associated coupling facility name and jobname
Workspace fields and definitionsTo view a list of workspace fields and their definitions, access the online help for the Group Buffer Pool Connections workspace.
Group Buffer Pool Structures Workspace Group 113
Typical Scenarios
Typical Scenarios
OverviewIn this unit we present several scenarios that describe how you can use the workspaces in the Group Buffer Pool Structures workspace group.
Scenario 1: Monitoring group buffer pool structuresYou can use the Group Buffer Pool Structures to monitor group buffer pool structures and to track structure utilization over a period of time.
For example, you may want to monitor group buffer pool structures with a low read hit percent, to determine if you need to expand the size of the group buffer pool. The optimal read hit percent is greater than 80 percent.
Access the Group Buffer Pool Structures. Notice that, by default, the workspace sorts in alphabetical order by structure name. To see the Read Hit Percent column, you may need to scroll to the right.
To track the structure read hit percent over a period of time, update or refresh the structure data on the Group Buffer Pool Structures by clicking Refresh Now on the View pull-down menu. The Group Buffer Pool Structures redisplays with the most current data available from the Candle Management Server (CMS).
Scenario 2: Investigating a true group buffer pool situationYou can use the Group Buffer Pool Structures to investigate a group buffer pool situation, viewing detailed data for group buffer pool structures that caused a situation to evaluate to true.
For example, you may want to investigate the predefined situation DB2_Group_BP_Read_Hit_Warning, which evaluates to true when Read Hit Percent is in the range of 60 to 80 percent.
Access the Group Buffer Pool Structures. To see the Read Hit Percent value for each group buffer pool structure, you may need to scroll to the right.
Note: You can continue your investigation of a group buffer pool structure by accessing a host session from CandleNet Portal to review an OMEGAMON II host session.
Typical Scenarios
114 OMEGAMON XE for DB2 on z/OS User’s Guide, Version 300
Scenario 3: Verifying that defined systems are connectedMVS and DB2 systems must be defined as being associated with a particular buffer pool. However, it is possible that one or more of these systems may not successfully connect to the coupling facility.
The Group Buffer Pool Connections workspace provides information about all MVS and DB2 systems that are currently connected to the coupling facility. You can use this workspace to verify that all designated systems have successfully connected to the coupling facility. If any systems are not connected, you can take corrective action.

Group Object Activity Database Workspace Group 115
Group Object ActivityDatabase Workspace Group
IntroductionThis chapter includes detailed information about the workspaces in the Group Object Activity Database workspace group.
Chapter contentsIntroducing the Group Object Activity Database Workspaces . . . . . . . . . 116Group Object Activity Database Workspace . . . . . . . . . . . . . . . . . . . . . . 118Group Object Activity by Spacename Workspace . . . . . . . . . . . . . . . . . . 119Group Object Activity by Spacename Detail Workspace . . . . . . . . . . . . . 120Typical Scenarios . . . . . . . . . . . . . . . . . . . . . . . . . . . . . . . . . . . . . . . . . . 121
16
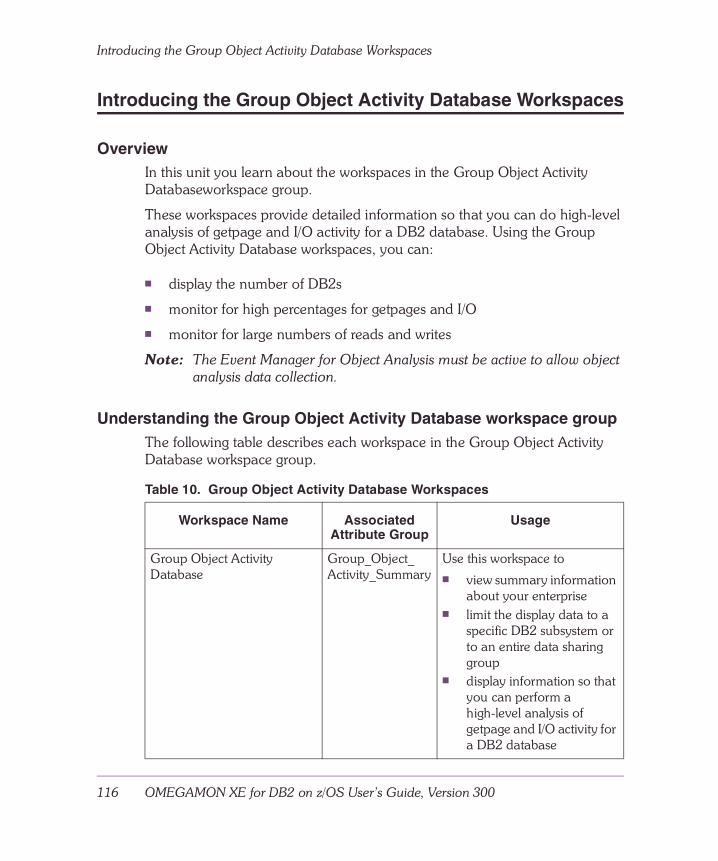
Introducing the Group Object Activity Database Workspaces
116 OMEGAMON XE for DB2 on z/OS User’s Guide, Version 300
Introducing the Group Object Activity Database Workspaces
OverviewIn this unit you learn about the workspaces in the Group Object Activity Databaseworkspace group.
These workspaces provide detailed information so that you can do high-level analysis of getpage and I/O activity for a DB2 database. Using the Group Object Activity Database workspaces, you can:
� display the number of DB2s
� monitor for high percentages for getpages and I/O
� monitor for large numbers of reads and writes
Note: The Event Manager for Object Analysis must be active to allow object analysis data collection.
Understanding the Group Object Activity Database workspace groupThe following table describes each workspace in the Group Object Activity Database workspace group.
Table 10. Group Object Activity Database Workspaces
Workspace Name Associated Attribute Group
Usage
Group Object Activity Database
Group_Object_ Activity_Summary
Use this workspace to � view summary information
about your enterprise � limit the display data to a
specific DB2 subsystem or to an entire data sharing group
� display information so that you can perform a high-level analysis of getpage and I/O activity for a DB2 database
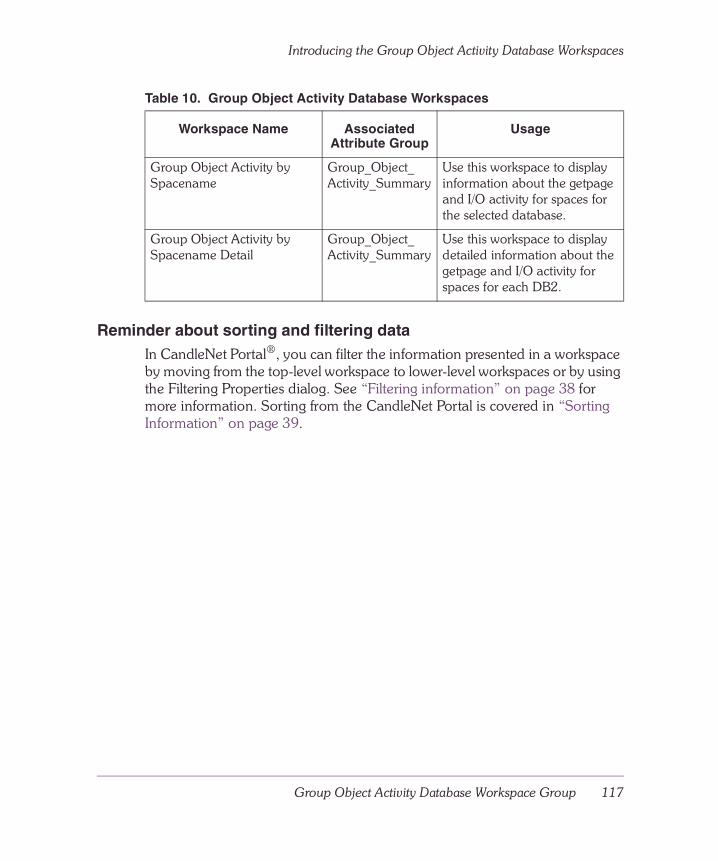
Group Object Activity Database Workspace Group 117
Introducing the Group Object Activity Database Workspaces
Reminder about sorting and filtering dataIn CandleNet Portal®, you can filter the information presented in a workspace by moving from the top-level workspace to lower-level workspaces or by using the Filtering Properties dialog. See “Filtering information” on page 38 for more information. Sorting from the CandleNet Portal is covered in “Sorting Information” on page 39.
Group Object Activity by Spacename
Group_Object_Activity_Summary
Use this workspace to display information about the getpage and I/O activity for spaces for the selected database.
Group Object Activity by Spacename Detail
Group_Object_Activity_Summary
Use this workspace to display detailed information about the getpage and I/O activity for spaces for each DB2.
Table 10. Group Object Activity Database Workspaces
Workspace Name Associated Attribute Group
Usage
Group Object Activity Database Workspace
118 OMEGAMON XE for DB2 on z/OS User’s Guide, Version 300
Group Object Activity Database Workspace
OverviewIn this unit you learn about the Group Object Activity Database workspace.
The Group Object Activity Database workspace displays information so that you can do a high-level analysis of getpage and I/O activity for a DB2 database. For each database being used in the data sharing group, this workspace displays summary information on I/O activity. The summary includes such items as
� Number of getpage requests
� Getpage requests per read I/O ratio
� Synchronous reads
� Asynchronous writes
� Prefetch reads
Workspace fields and definitionsTo view a list of workspace fields and their definitions, access the online help for the Group Object Activity Database workspace.
Group Object Activity Database Workspace Group 119
Group Object Activity by Spacename Workspace
Group Object Activity by Spacename Workspace
OverviewIn this unit you learn about the Group Object Activity by Spacename workspace.
The Group Object Activity by Spacename workspace displays information about the getpage and I/O activity for spaces for the selected database. The table view in this workspace displays a row of information for each spacename defined for the selected database name.
Use the Group Object Activity by Spacename workspace to monitor
� getpage information for the spacename � synchronous reads and asynchronous writes for the spaces
Workspace fields and definitionsTo view a list of workspace fields and their definitions, access the online help for the Group Object Activity by Spacename workspace.
Group Object Activity by Spacename Detail Workspace
120 OMEGAMON XE for DB2 on z/OS User’s Guide, Version 300
Group Object Activity by Spacename Detail Workspace
OverviewIn this unit you learn about the Group Object Activity by Spacename Detail workspace.
The Group Object Activity by Spacename Detail workspace displays detailed information about the getpage and I/O activity for spaces for each DB2. The table view displays activity by individual DB2 systems against a selected spacename within a selected database name.
For example, for each spacename you can display
� the DB2 identifier
� information about the operations (such as the number of getpages and synchronous reads)
Workspace fields and definitionsTo view a list of workspace fields and their definitions, access the online help for the Group Object Activity by Spacename Detail workspace.
Group Object Activity Database Workspace Group 121
Typical Scenarios
Typical Scenarios
OverviewIn this unit we present a scenario that describes how you can use the workspaces in the Group Object Activity Database workspace group.
Scenario 1: Identifying objects that are consuming resourcesYou can use this workspace to determine at an intermediate level, the area that appears to be consuming an unusual amount of resources.
For example, you can use the workspace to identify a tablespace or database that is consuming an unusual amount of resources. You can then use the workspace to display the Object Analysis Database workspace for the object by double-clicking on that object.
Scenario 2: Pinpointing the source of high I/O activityWhen I/O activity is relatively high for a particular database, the Group Object Activity Database workspace group can provide some helpful information. By monitoring the detailed group object activity by spacename, you can determine which DB2 system is a major contributor to the high I/O activity rate. You can use this information, along with the GOA Thread Database workspace, to find the application and threads that are contributing to the performance problem.

Typical Scenarios
122 OMEGAMON XE for DB2 on z/OS User’s Guide, Version 300
IMS Workspaces 123
IMS Workspaces
IntroductionThis chapter describes the IMF workspaces.
Reminder about sorting and filtering dataIn CandleNet Portal®, you can filter the information presented in a workspace by moving from the top-level workspace to lower-level workspaces or by using the Filtering Properties dialog. See “Filtering information” on page 38 for more information. Sorting from the CandleNet Portal is covered in “Sorting Information” on page 39.
Workspace fields and definitionsTo view a list of workspace fields and their definitions, access the online help for the Global Lock Conflicts workspace.
Chapter contentsIMS Connections Workspace . . . . . . . . . . . . . . . . . . . . . . . . . . . . . . . . . 124IMS Region Information Workspace . . . . . . . . . . . . . . . . . . . . . . . . . . . . 125
17
IMS Connections Workspace
124 OMEGAMON XE for DB2 on z/OS User’s Guide, Version 300
IMS Connections Workspace
DescriptionThe IMS Connections workspace provides an overview of DB2 thread activity originating from connected IMS subsystems. It provides information on a connection level about all IMS subsystems identified to DB2. This workspace is comprised of two views. The views are
� IMS Connections (table view)
� IMS Region Counts (bar chart)
The IMS Connections table lists the number of active threads, unconnected regions, dependent regions currently connected to this DB2 system, and dependent regions defined for this IMS connection. The IMS Region Counts chart displays this information in a graphic form.
IMS Workspaces 125
IMS Region Information Workspace
IMS Region Information Workspace
DescriptionThe IMS Region Information workspace provides detailed status information for a specific IMS dependent region.This workspace is comprised of a single view. The view is
� IMS Region Information (table view)
The IMS Region Information table lists region identification data and region status.

IMS Region Information Workspace
126 OMEGAMON XE for DB2 on z/OS User’s Guide, Version 300

Log Manager Workspace 127
Log Manager Workspace
IntroductionThis chapter describes the Log Manager workspace.
Reminder about sorting and filtering dataIn CandleNet Portal®, you can filter the information presented in a workspace by moving from the top-level workspace to lower-level workspaces or by using the Filtering Properties dialog. See “Filtering information” on page 38 for more information. Sorting from the CandleNet Portal is covered in “Sorting Information” on page 39.
Workspace fields and definitionsTo view a list of workspace fields and their definitions, access the online help for the Log Manager workspace.
Chapter contentsLog Manager Workspace . . . . . . . . . . . . . . . . . . . . . . . . . . . . . . . . . . . . 128
18
Log Manager Workspace
128 OMEGAMON XE for DB2 on z/OS User’s Guide, Version 300
Log Manager Workspace
DescriptionThe Log Manager workspace provides an overview of the DB2 log manager active logging and archiving activity. This workspace is comprised of three views. The views are
� Dataset Utilization (thermometer gauge)
� Log Manger Statistics (table view)
� Log Manager Summary (table view)
The Dataset Utilization gauge indicates the percent of the current dataset that is in use. The Log Manager Statistics table lists total counts, counts during the last sample period, and the per second count for a variety of reads, writes, and allocations associated with DB2 SRM log management. The Log Manager Summary table provides details associated with logging and archiving activity.
Monitored Systems Summary Workspace 129
Monitored SystemsSummary Workspace
IntroductionThis chapter introduces you to the Monitored Systems Summary workspace and provides navigation information.
Chapter contentsIntroducing the Monitored Systems Summary Workspace. . . . . . . . . . . . 130Typical Scenarios . . . . . . . . . . . . . . . . . . . . . . . . . . . . . . . . . . . . . . . . . . 131
19
Introducing the Monitored Systems Summary Workspace
130 OMEGAMON XE for DB2 on z/OS User’s Guide, Version 300
Introducing the Monitored Systems Summary Workspace
OverviewIn this unit you learn about the Monitored Systems Summary workspace. This workspace provides summary information about a data sharing group. Using the workspace you can
� identify the number of
– DB2 subsystems
– group buffer pool connections
– object analysis databases
� identify the number of active threads versus the number of lock conflicts
� view summary information such as object analysis status, subsystem or group type, and timestamp.
Reminder about sorting and filtering dataIn CandleNet Portal®, you can filter the information presented in a workspace by moving from the top-level workspace to lower-level workspaces or by using the Filtering Properties dialog. See “Filtering information” on page 38 for more information. Sorting from the CandleNet Portal is covered in “Sorting Information” on page 39.
Workspace fields and definitionsTo view a list of workspace fields and their definitions, access the online help for the Monitored Systems Summary workspace.
Monitored Systems Summary Workspace 131
Typical Scenarios
Typical Scenarios
OverviewIn this unit we present several scenarios that describe how you can use the Monitored Systems Summary workspace.
Scenario 1: Determine availability of individual DB2 systems for a data sharing group
You can use the Monitored System Summary workspace to verify that all DB2 subsystems defined as part of the data sharing group are currently active and being monitored.
For example, you can use the workspace threshold capabilities to highlight cases where the number of active DB2 systems is lower than the expected number.
Access the Monitored System Summary workspace. Notice that the second column (immediately following the data sharing group name) contains the count of DB2 systems currently connected to the data sharing group. Use the Properties page for the workspace and select the Threshold tab. On the first threshold line, enter the name of the data sharing group under the column “Subsystem or Group Name” and set the condition to ““EQ”. On the same line, enter the number of DB2 systems normally connected to this data sharing group under the “DB2 Count” column and set the condition on this column to “LT”. If monitoring more than one data sharing group, you can repeat these steps on the next line. Press OK to end the Properties dialog; then save the workspace. The next time the workspace is displayed, ProductName will highlight the condition if the current count of DB2 systems connected does not match the expected count for each data sharing group.
Note: The count of DB2 systems is only accurate if the Candle-provided monitoring agent for the DB2 product is running on all MVS images where DB2 subsystems are running.
Typical Scenarios
132 OMEGAMON XE for DB2 on z/OS User’s Guide, Version 300
Scenario 2: Determine if there are any global problems within a data sharing group
You can use the Monitored System Summary workspace to determine whether any threads within a data sharing group are waiting for locks .
Access the Monitored System Summary workspace. If the Lock Conflict Count field contains a number greater than zero, at least one thread within the data sharing group is waiting on a lock. If this condition persists, you can use the Global Lock Conflicts workspace to determine who is waiting on a lock and which thread within the data sharing group currently holds the lock.

Object Analysis Database Workspace Group 133
Object Analysis DatabaseWorkspace Group
IntroductionThis chapter includes detailed information about the workspaces in the Object Analysis Database workspace group.
Chapter contentsIntroducing the Object Analysis Database Workspace Group . . . . . . . . . 134Object Analysis Database Workspace . . . . . . . . . . . . . . . . . . . . . . . . . . . 136Object Analysis Spacename Workspace . . . . . . . . . . . . . . . . . . . . . . . . . 137Object Analysis Spacename Detail Workspace . . . . . . . . . . . . . . . . . . . . 138Typical Scenario . . . . . . . . . . . . . . . . . . . . . . . . . . . . . . . . . . . . . . . . . . . 139
20
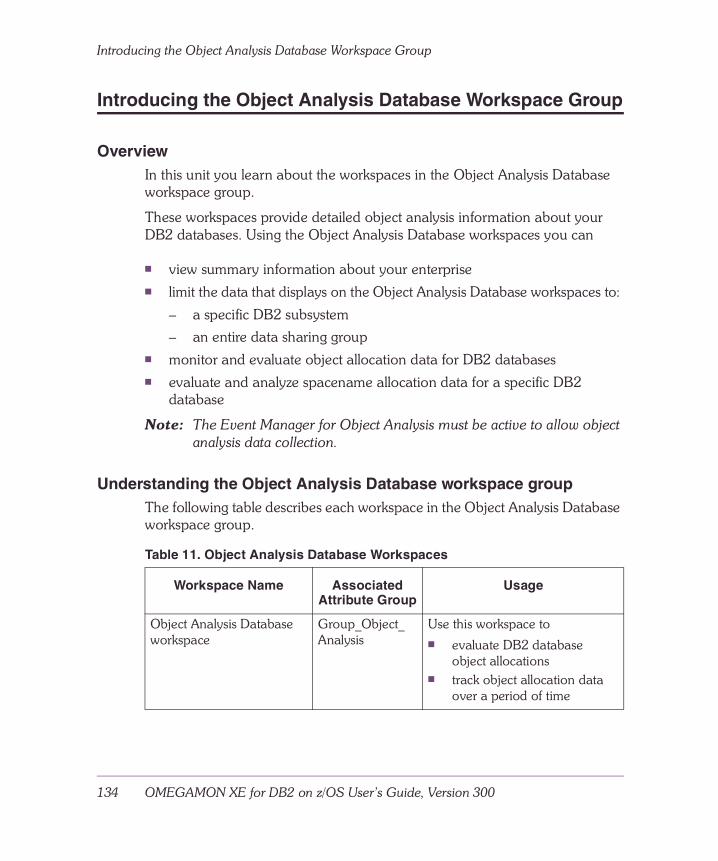
Introducing the Object Analysis Database Workspace Group
134 OMEGAMON XE for DB2 on z/OS User’s Guide, Version 300
Introducing the Object Analysis Database Workspace Group
OverviewIn this unit you learn about the workspaces in the Object Analysis Database workspace group.
These workspaces provide detailed object analysis information about your DB2 databases. Using the Object Analysis Database workspaces you can
� view summary information about your enterprise� limit the data that displays on the Object Analysis Database workspaces to:
– a specific DB2 subsystem
– an entire data sharing group� monitor and evaluate object allocation data for DB2 databases� evaluate and analyze spacename allocation data for a specific DB2
database
Note: The Event Manager for Object Analysis must be active to allow object analysis data collection.
Understanding the Object Analysis Database workspace groupThe following table describes each workspace in the Object Analysis Database workspace group.
Table 11. Object Analysis Database Workspaces
Workspace Name Associated Attribute Group
Usage
Object Analysis Database workspace
Group_Object_Analysis
Use this workspace to � evaluate DB2 database
object allocations� track object allocation data
over a period of time
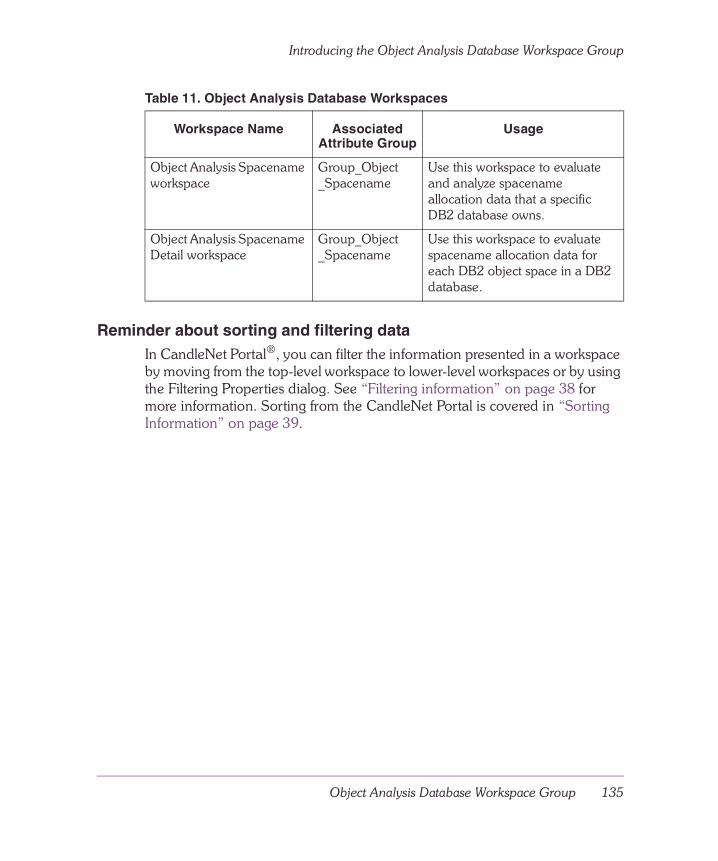
Object Analysis Database Workspace Group 135
Introducing the Object Analysis Database Workspace Group
Reminder about sorting and filtering dataIn CandleNet Portal®, you can filter the information presented in a workspace by moving from the top-level workspace to lower-level workspaces or by using the Filtering Properties dialog. See “Filtering information” on page 38 for more information. Sorting from the CandleNet Portal is covered in “Sorting Information” on page 39.
Object Analysis Spacename workspace
Group_Object_Spacename
Use this workspace to evaluate and analyze spacename allocation data that a specific DB2 database owns.
Object Analysis Spacename Detail workspace
Group_Object_Spacename
Use this workspace to evaluate spacename allocation data for each DB2 object space in a DB2 database.
Table 11. Object Analysis Database Workspaces
Workspace Name Associated Attribute Group
Usage
Object Analysis Database Workspace
136 OMEGAMON XE for DB2 on z/OS User’s Guide, Version 300
Object Analysis Database Workspace
OverviewIn this unit you learn about the Object Analysis Database workspace. The Object Analysis Database workspace provides a global view of object allocation data for a specific data sharing group.
� monitored databases for a data sharing group
� monitored DB2 systems
� object analysis databases
The Object Analysis Database workspace is a selection workspace. It allows you to display data at the level of the data sharing group. From this level, you can drill down to the detailed information for an individual DB2 subsystem.
The Object Analysis Database workspace displays only databases that contain spaces currently allocated to the DB2 subsystems that are part of the data sharing group you are monitoring. You can use the Object Analysis Database workspace to
� evaluate DB2 database object allocations
� monitor object allocation data over a period of time
� analyze spacename allocation data for a specific DB2 database
Workspace fields and definitionsTo view a list of workspace fields and their definitions, access the online help for the Object Analysis Database workspace.
Object Analysis Database Workspace Group 137
Object Analysis Spacename Workspace
Object Analysis Spacename Workspace
OverviewIn this unit you learn about the Object Analysis Spacename workspace.
The Object Analysis Spacename workspace displays spacename allocation data for a specific DB2 database. You can use the Object Analysis Spacename workspace to evaluate and analyze the spacename allocation data that a specific DB2 database owns.
Workspace fields and definitionsTo view a list of workspace fields and their definitions, access the online help for the Object Analysis Spacename workspace.
Object Analysis Spacename Detail Workspace
138 OMEGAMON XE for DB2 on z/OS User’s Guide, Version 300
Object Analysis Spacename Detail Workspace
OverviewIn this unit you learn about the Object Analysis Spacename Detail workspace.
The Object Analysis Spacename Detail workspace displays detail object analysis data for each DB2 object space in a DB2 database. You can use the Object Analysis Spacename Detail workspace to evaluate spacename allocation data for each DB2 object space in a DB2 database.
Workspace fields and definitionsTo view a list of workspace fields and their definitions, access the online help for the Object Analysis Spacename Detail workspace.
Object Analysis Database Workspace Group 139
Typical Scenario
Typical Scenario
OverviewIn this unit we present a scenario that describes how you can use the workspaces in the Object Analysis Database workspace group.
Scenario 1: Identifying resource consumption in a databaseYou can use these workspaces to display details about the resource consumption for a particular resource in a database.
For example, if a response time situation is triggered, you can use the workspace to determine the resource consumption (such as the size of the tablespace or the number of tables per tablespace).

Typical Scenario
140 OMEGAMON XE for DB2 on z/OS User’s Guide, Version 300
Subsystem Management Workspace 141
Subsystem ManagementWorkspace
IntroductionThis chapter describes the Subsystem Management workspace.
Reminder about sorting and filtering dataIn CandleNet Portal®, you can filter the information presented in a workspace by moving from the top-level workspace to lower-level workspaces or by using the Filtering Properties dialog. See “Filtering information” on page 38 for more information. Sorting from the CandleNet Portal is covered in “Sorting Information” on page 39.
Workspace fields and definitionsTo view a list of workspace fields and their definitions, access the online help for the Subsystem Management workspace.
Chapter contentsSubsystem Management Workspace . . . . . . . . . . . . . . . . . . . . . . . . . . . . 142
21
Subsystem Management Workspace
142 OMEGAMON XE for DB2 on z/OS User’s Guide, Version 300
Subsystem Management Workspace
DescriptionThe Subsystem Management workspace provides an overview of workload- related information about the DB2 subsystem you are monitoring. This workspace is comprised of four views. The views are
� Background Utilization (needle gauge)
� Foreground Utilization (needle gauge)
� Subsystem Management Statistics (table view)
� Subsystem Management Summary (table view)
The Background Utilization gauge displays the percent of available threads being used for background connections. The Foreground Utilization gauge displays the percent of available threads being used for foreground connections. The Subsystem Management Statistics table lists total counts, counts during the last sample period, and the per second count for a variety of subsystem requests, abends, and thread statuses associated with the System Resource Manager (SRM) system. The Subsystem Management Summary table lists thread availability and usage statistics for foreground and background connections.

System Status Workspace 143
System Status Workspace
IntroductionThis chapter describes the System Status workspace.
Reminder about sorting and filtering dataIn CandleNet Portal®, you can filter the information presented in a workspace by moving from the top-level workspace to lower-level workspaces or by using the Filtering Properties dialog. See “Filtering information” on page 38 for more information. Sorting from the CandleNet Portal is covered in “Sorting Information” on page 39.
Workspace fields and definitionsTo view a list of workspace fields and their definitions, access the online help for the System Status workspace.
Chapter contentsSystem Status Workspace . . . . . . . . . . . . . . . . . . . . . . . . . . . . . . . . . . . . 144
22
System Status Workspace
144 OMEGAMON XE for DB2 on z/OS User’s Guide, Version 300
System Status Workspace
DescriptionThe System Status workspace reflects the “health” of your DB2 system. This workspace is comprised of five views. The views are
� DDF Receive Rate (needle gauge)
� DDF Send Rate (needle gauge)
� DB Wait Percent (needle gauge)
� EDM Utilization (needle gauge)
� System State Information (table view)
The DDF Receive Rate gauge reports the receive rate of the Distributed Data Facility (DDF). The DDF Send Rate gauge reports the send rate of the Distributed Data Facility (DDF). The DB Wait Percent gauge displays the percentage of threads that are waiting for database services. The EDM Utilization gauge reports the number of current EDM pages divided by total EDM pages. The System State Information table provides activity and performance details of your DB2 system.

Thread Activity Workspace Group 145
Thread ActivityWorkspace Group
IntroductionThis chapter includes detailed information about the workspaces in the Thread Activity workspace group.
Chapter contentsIntroducing the Thread Activity Workspaces . . . . . . . . . . . . . . . . . . . . . . 146Thread Activity Workspace . . . . . . . . . . . . . . . . . . . . . . . . . . . . . . . . . . . 147Thread Statistics Workspace . . . . . . . . . . . . . . . . . . . . . . . . . . . . . . . . . . 148Typical Scenarios . . . . . . . . . . . . . . . . . . . . . . . . . . . . . . . . . . . . . . . . . . 149
23
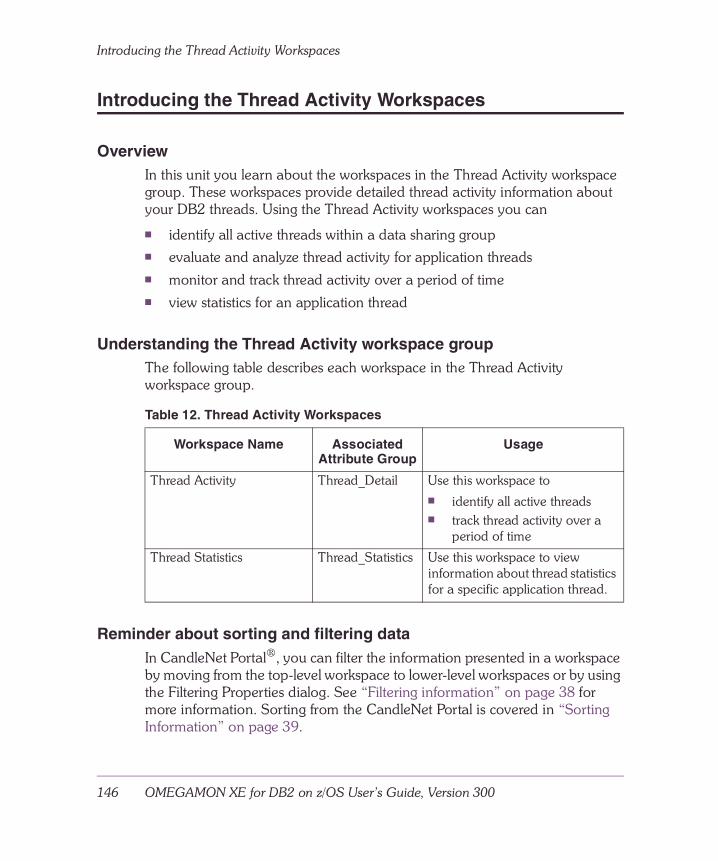
Introducing the Thread Activity Workspaces
146 OMEGAMON XE for DB2 on z/OS User’s Guide, Version 300
Introducing the Thread Activity Workspaces
OverviewIn this unit you learn about the workspaces in the Thread Activity workspace group. These workspaces provide detailed thread activity information about your DB2 threads. Using the Thread Activity workspaces you can
� identify all active threads within a data sharing group� evaluate and analyze thread activity for application threads� monitor and track thread activity over a period of time� view statistics for an application thread
Understanding the Thread Activity workspace groupThe following table describes each workspace in the Thread Activity workspace group.
Reminder about sorting and filtering dataIn CandleNet Portal®, you can filter the information presented in a workspace by moving from the top-level workspace to lower-level workspaces or by using the Filtering Properties dialog. See “Filtering information” on page 38 for more information. Sorting from the CandleNet Portal is covered in “Sorting Information” on page 39.
Table 12. Thread Activity Workspaces
Workspace Name Associated Attribute Group
Usage
Thread Activity Thread_Detail Use this workspace to � identify all active threads� track thread activity over a
period of time
Thread Statistics Thread_Statistics Use this workspace to view information about thread statistics for a specific application thread.
Thread Activity Workspace Group 147
Thread Activity Workspace
Thread Activity Workspace
OverviewIn this unit you learn about the Thread Activity workspace. The Thread Activity workspace provides a global view of thread activity for a specific DB2 subsystem or for an entire data sharing group.
Use the Thread Activity workspace to
� identify all active threads
� track thread activity for application threads over a period of time
� analyze thread data when a thread situation evaluates to true
Workspace fields and definitionsTo view a list of workspace fields and their definitions, access the online help for the Thread Activity workspace.
Thread Statistics Workspace
148 OMEGAMON XE for DB2 on z/OS User’s Guide, Version 300
Thread Statistics Workspace
OverviewIn this unit you learn about the Thread Statistics workspace. The Thread Statistics workspace displays thread statistics for a specific application thread.
If the application thread is a parallel thread, the workspace displays thread statistics for all the associated parallel threads.
Workspace fields and definitionsFor a list of workspace fields and to view definitions for each field, access the online help for the Thread Statistics workspace.
Thread Activity Workspace Group 149
Typical Scenarios
Typical Scenarios
OverviewIn this unit we present several scenarios that describe how you can use the workspaces in the Thread Activity workspace group.
Scenario 1: Monitoring thread activityYou can use the Thread Activity workspace to identify all active application threads and to track thread activity over a period of time. For example, you may want to monitor the thread elapsed and wait times for critical application threads.
Access the Thread Activity Workspace. Notice that this workspace displays thread data for application threads, uniquely identifying each application thread by DB2ID, plan name, correlation identifier, package identifier, and collection identifier. To see the Elapsed Time and Wait Time columns, scroll to the right.
You can track the thread activity over a period of time, update or refresh the thread data on the Thread Activity workspace by clicking on the Refresh icon on the CandleNet Portal toolbar. The Thread Activity workspace redisplays with the most current data available from the Candle Management Server (CMS).
Scenario 2: Investigating a true thread situationYou can use the Thread Activity workspace to investigate a thread situation, viewing detailed data for one or more threads that caused a situation to evaluate to true.
For example, you may want to investigate the predefined situation DB2_Thread_Wait_Time_Critical, which evaluates to true when Wait Time is greater than 10 seconds.
Access the Thread Activity Workspace. To see the Wait Time value for each application thread, scroll to the right.

Typical Scenarios
150 OMEGAMON XE for DB2 on z/OS User’s Guide, Version 300
Utility Jobs Workspace 151
Utility Jobs Workspace
IntroductionThis chapter describes the Utility Jobs workspace.
Reminder about sorting and filtering dataIn CandleNet Portal®, you can filter the information presented in a workspace by moving from the top-level workspace to lower-level workspaces or by using the Filtering Properties dialog. See “Filtering information” on page 38 for more information. Sorting from the CandleNet Portal is covered in “Sorting Information” on page 39.
Workspace fields and definitionsTo view a list of workspace fields and their definitions, access the online help for the Utility Jobs workspace.
Chapter contentsUtility Jobs Workspace . . . . . . . . . . . . . . . . . . . . . . . . . . . . . . . . . . . . . . 152
24
Utility Jobs Workspace
152 OMEGAMON XE for DB2 on z/OS User’s Guide, Version 300
Utility Jobs Workspace
DescriptionThe Utility Jobs workspace provides an overview of all active utilities. Workspace monitoring includes utilities that have not yet completed their run due to abnormal termination. This workspace is comprised of a single view. The view is
� Utility Jobs (table view)
The Utility Jobs table lists the phase, record counts, and status of DB2 utility jobs.

Volume Activity Workspace 153
Volume Activity Workspace
IntroductionThis chapter describes the Volume Activity workspace.
Reminder about sorting and filtering dataIn CandleNet Portal®, you can filter the information presented in a workspace by moving from the top-level workspace to lower-level workspaces or by using the Filtering Properties dialog. See “Filtering information” on page 38 for more information. Sorting from the CandleNet Portal is covered in “Sorting Information” on page 39.
Workspace fields and definitionsTo view a list of workspace fields and their definitions, access the online help for the Volume Activity workspace.
Chapter contentsVolume Activity Workspace . . . . . . . . . . . . . . . . . . . . . . . . . . . . . . . . . . 154
25
Volume Activity Workspace
154 OMEGAMON XE for DB2 on z/OS User’s Guide, Version 300
Volume Activity Workspace
DescriptionThe Volume Activity workspace provides an overview of the performance of volumes that contain DB2 objects so that DASD performance can be evaluated by volume. This workspace is comprised of two views. The views are
� Service Time (bar chart)
� Volume Activity (table view)
The Service Time chart displays the average service time for the volume since the beginning of the collection interval. The Volume Activity table includes data so that you can monitor I/O activity for individual volumes.
OMEGAMON XE for DB2 on z/OS Situations 155
OMEGAMON XEfor DB2 on z/OS Situations
IntroductionThis chapter describes the OMEGAMON XE for DB2 on z/OS predefined situations shipped with the product.
Chapter contentsSituations Delivered with OMEGAMON XE for DB2 on z/OS . . . . . . . . . 156
Overview . . . . . . . . . . . . . . . . . . . . . . . . . . . . . . . . . . . . . . . . . . . . . 156Predefined situations . . . . . . . . . . . . . . . . . . . . . . . . . . . . . . . . . . . . 156
Coupling Facility Situation Definitions . . . . . . . . . . . . . . . . . . . . . . . . . . 158Database Locks Situation Definitions . . . . . . . . . . . . . . . . . . . . . . . . . . . 159Group Buffer Pool Predefined Situation Definitions . . . . . . . . . . . . . . . . 160Threads Situation Definitions . . . . . . . . . . . . . . . . . . . . . . . . . . . . . . . . . 161DB2 Command Situation Definitions . . . . . . . . . . . . . . . . . . . . . . . . . . . 162
26
Situations Delivered with OMEGAMON XE for DB2 on z/OS
156 OMEGAMON XE for DB2 on z/OS User’s Guide, Version 300
Situations Delivered with OMEGAMON XE for DB2 on z/OS
OverviewIn this unit you learn about the situations delivered with OMEGAMON XE for DB2 on z/OS. You can use the DB2 situations
� to begin monitoring your DB2-managed systems immediately� as models for creating your own situations� as embedded situations within your own situations� to monitor and manage, through localized automation, widely dispersed
resources
Predefined situationsOMEGAMON XE for DB2 on z/OS provides the following predefined situations. � DB2_CF_Connections_Warning � DB2_CF_Structure_Use_Critical � DB2_CF_Structure_Use_Warning� DB2_CMD_Connection_Failed� DB2_CMD_Group_BP_Read_Hit_Warn� DB2_CMD_Lock_Wait_Time_Critical� DB2_CMD_Thrd_Wait_Time_Critical� DB2_Group_BP_Read_Hit_Critical� DB2_Group_BP_Read_Hit_Warning� DB2_Lock_Waiter_Time_Critical� DB2_Lock_Waiter_Time_Warning� DB2_Thread_Wait_Time_Critical� DB2_Thread_Wait_Time_Warning
You can immediately begin using these situations to monitor your DB2 system. You can also change the conditions, relational operators, and compare values to ones more appropriate for your environment.
Most of the DB2 situations have an alert status of either Critical or Warning. The following sections describe these predefined situations, including a definition and the formula.
OMEGAMON XE for DB2 on z/OS Situations 157
Situations Delivered with OMEGAMON XE for DB2 on z/OS
Additionally, predefined situations associated with the following Navigator items are also included:
� Buffer Pool Management
� CICS Connections
� Detailed Thread Exception
� IMS Connection
� Log Manager
� Subsystem Management
� System Status
� Utility Jobs
� Volume Activity
See the OMEGAMON XE for DB2 on z/OS online help for information on these product-provided situations.
Coupling Facility Situation Definitions
158 OMEGAMON XE for DB2 on z/OS User’s Guide, Version 300
Coupling Facility Situation Definitions
OverviewIn this unit you can view information about the Coupling Facility predefined situations.
DB2_CF_Connections_WarningMonitors the status of connections to coupling facility and group buffer pool structures, detecting a warning condition when Connection_Status is equal to FAIL.
Formula:
If Group_Buffer_Pool_Connections.Connection_Status = FAIL
Note: A duplicate of this predefined situation exists. It is the DB2_CMD_Connection_Failed situation. The formula is the same as above with the addition of a message that is automatically sent to a specified user.
DB2_CF_Structure_Use_CriticalMonitors the percent of structures that a coupling facility uses, detecting a critical condition when Structure_Used_Percent is greater than 90 percent.
Formula:
If Group_Buffer_Pool.Structure_Used_Percent > 90
DB2_CF_Structure_Use_WarningMonitors the percent of structures that a coupling facility uses, detecting a warning condition when Structure_Used_Percent is in the range of 80 to 90 percent.
Formula:
If Group_Buffer_Pool.Structure_Used_Percent > 80
and
Group_Buffer_Pool.Structure_Used_Percent <= 90
OMEGAMON XE for DB2 on z/OS Situations 159
Database Locks Situation Definitions
Database Locks Situation Definitions
OverviewIn this unit you can view information about the Database Locks predefined situations.
DB2_Lock_Waiter_Time_CriticalMonitors the lock elapsed time for application threads with a waiter lock status, detecting a critical condition when Lock_Elapsed_Time is greater than 10 seconds.
Formula:
If DB2_Lock_Conflict.Lock_Status = WAITER
andDB2_Lock_Conflict.Lock_Elapsed_Time > 10
Note: A duplicate of this predefined situation exists. It is the DB2_CMD_Lock_Wait_Time_Critical situation. The formula is the same as above with the addition of a message that is automatically sent to a specified user.
DB2_Lock_Waiter_Time_WarningMonitors the lock elapsed time for application threads with a waiter lock status, detecting a warning condition when Lock_Elapsed_Time is in the range of 5 to 10 seconds.
Formula:
If DB2_Lock_Conflict.Lock_Status = WAITER
andDB2_Lock_Conflict.Lock_Elapsed_Time > 5
andDB2_Lock_Conflict.Lock_Elapsed_Time <= 10
Group Buffer Pool Predefined Situation Definitions
160 OMEGAMON XE for DB2 on z/OS User’s Guide, Version 300
Group Buffer Pool Predefined Situation Definitions
OverviewIn this unit you can view information about the Group Buffer Pool predefined situations.
DB2_Group_BP_Read_Hit_CriticalMonitors the percent of read hits for group buffer pools, detecting a critical condition when Read_Hit_Percent is less than 60 percent.
Formula:
If Group_Buffer_Pool.Read_Hit_Percent < 60
DB2_Group_BP_Read_Hit_WarningMonitors the percent of read hits for group buffer pools, detecting a warning condition when Read_Hit_Percent is in the range of 60 to 80 percent.
Formula:
If Group_Buffer_Pool.Read_Hit_Percent >= 60
andGroup_Buffer_Pool.Read_Hit_Percent < 80
Note: A duplicate of this predefined situation exists. It is the DB2_CMD_Group_BP_Read_Hit_Warn situation. The formula is the same as above with the addition of a message that is automatically sent to a specified user.
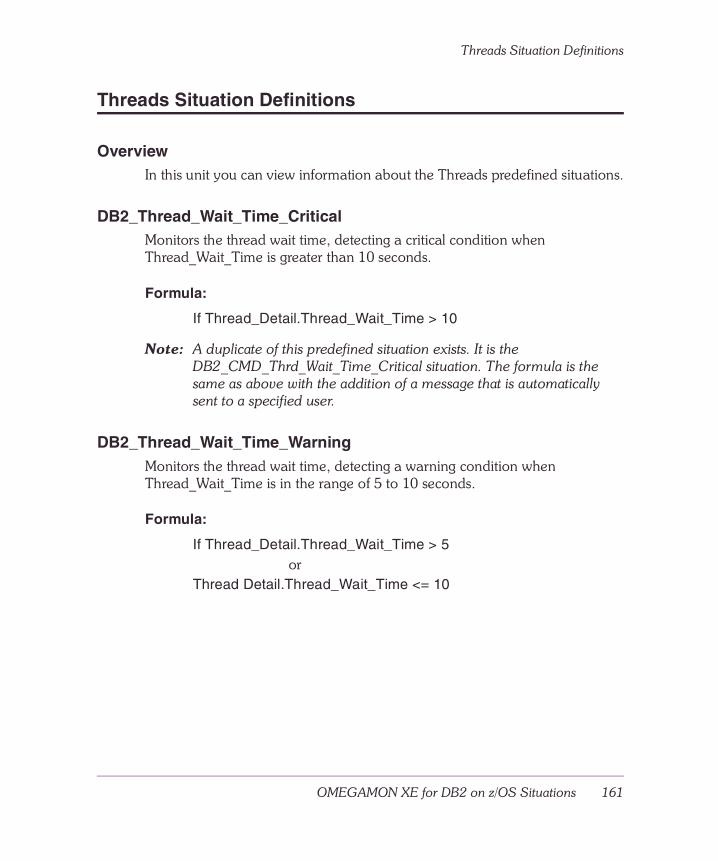
OMEGAMON XE for DB2 on z/OS Situations 161
Threads Situation Definitions
Threads Situation Definitions
OverviewIn this unit you can view information about the Threads predefined situations.
DB2_Thread_Wait_Time_CriticalMonitors the thread wait time, detecting a critical condition when Thread_Wait_Time is greater than 10 seconds.
Formula:
If Thread_Detail.Thread_Wait_Time > 10
Note: A duplicate of this predefined situation exists. It is the DB2_CMD_Thrd_Wait_Time_Critical situation. The formula is the same as above with the addition of a message that is automatically sent to a specified user.
DB2_Thread_Wait_Time_WarningMonitors the thread wait time, detecting a warning condition when Thread_Wait_Time is in the range of 5 to 10 seconds.
Formula:
If Thread_Detail.Thread_Wait_Time > 5or
Thread Detail.Thread_Wait_Time <= 10
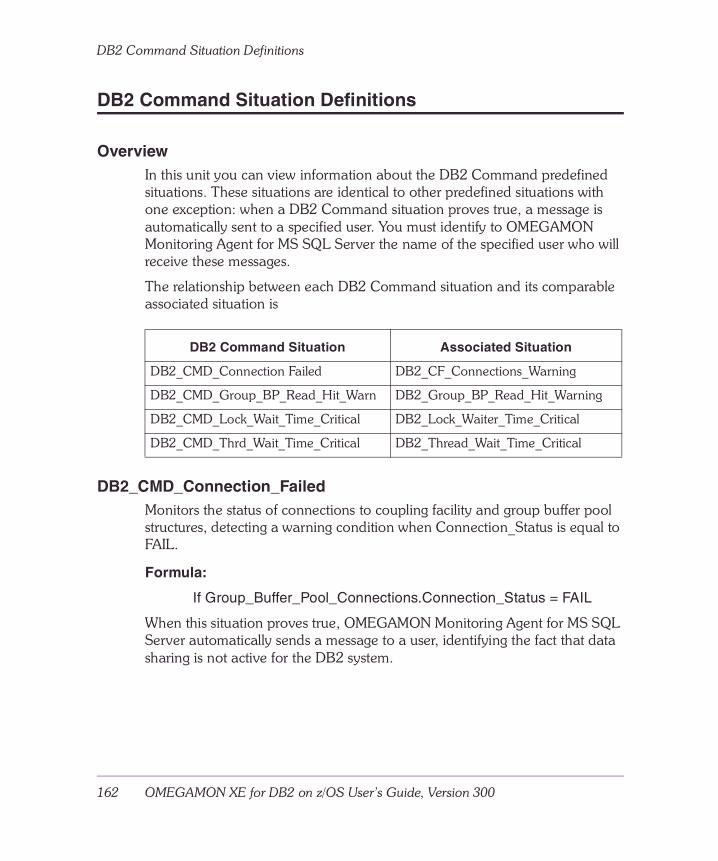
DB2 Command Situation Definitions
162 OMEGAMON XE for DB2 on z/OS User’s Guide, Version 300
DB2 Command Situation Definitions
OverviewIn this unit you can view information about the DB2 Command predefined situations. These situations are identical to other predefined situations with one exception: when a DB2 Command situation proves true, a message is automatically sent to a specified user. You must identify to OMEGAMON Monitoring Agent for MS SQL Server the name of the specified user who will receive these messages.
The relationship between each DB2 Command situation and its comparable associated situation is
DB2_CMD_Connection_FailedMonitors the status of connections to coupling facility and group buffer pool structures, detecting a warning condition when Connection_Status is equal to FAIL.
Formula:
If Group_Buffer_Pool_Connections.Connection_Status = FAIL
When this situation proves true, OMEGAMON Monitoring Agent for MS SQL Server automatically sends a message to a user, identifying the fact that data sharing is not active for the DB2 system.
DB2 Command Situation Associated Situation
DB2_CMD_Connection Failed DB2_CF_Connections_Warning
DB2_CMD_Group_BP_Read_Hit_Warn DB2_Group_BP_Read_Hit_Warning
DB2_CMD_Lock_Wait_Time_Critical DB2_Lock_Waiter_Time_Critical
DB2_CMD_Thrd_Wait_Time_Critical DB2_Thread_Wait_Time_Critical
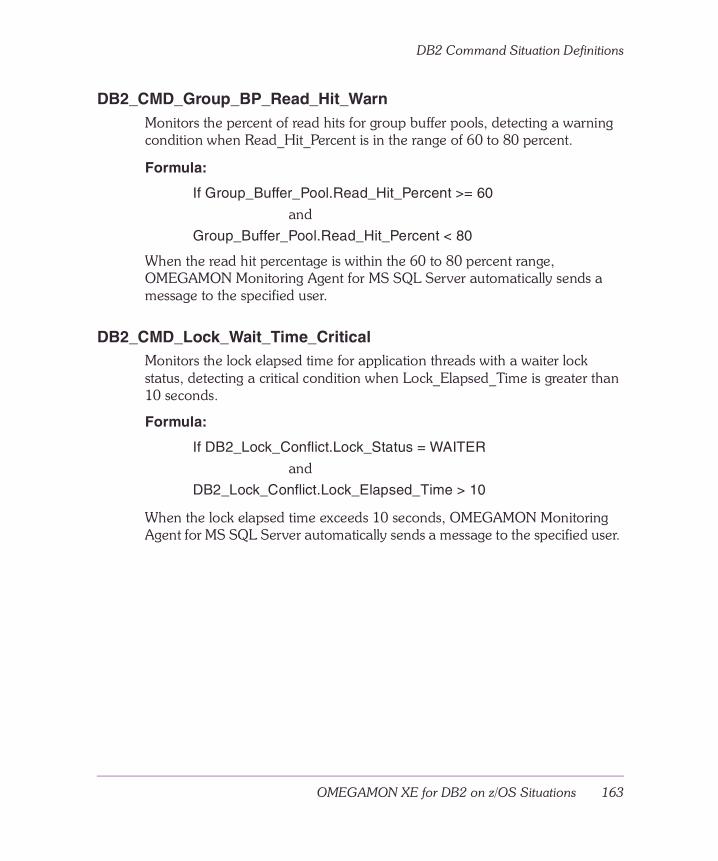
OMEGAMON XE for DB2 on z/OS Situations 163
DB2 Command Situation Definitions
DB2_CMD_Group_BP_Read_Hit_WarnMonitors the percent of read hits for group buffer pools, detecting a warning condition when Read_Hit_Percent is in the range of 60 to 80 percent.
Formula:
If Group_Buffer_Pool.Read_Hit_Percent >= 60
andGroup_Buffer_Pool.Read_Hit_Percent < 80
When the read hit percentage is within the 60 to 80 percent range, OMEGAMON Monitoring Agent for MS SQL Server automatically sends a message to the specified user.
DB2_CMD_Lock_Wait_Time_CriticalMonitors the lock elapsed time for application threads with a waiter lock status, detecting a critical condition when Lock_Elapsed_Time is greater than 10 seconds.
Formula:
If DB2_Lock_Conflict.Lock_Status = WAITER
andDB2_Lock_Conflict.Lock_Elapsed_Time > 10
When the lock elapsed time exceeds 10 seconds, OMEGAMON Monitoring Agent for MS SQL Server automatically sends a message to the specified user.
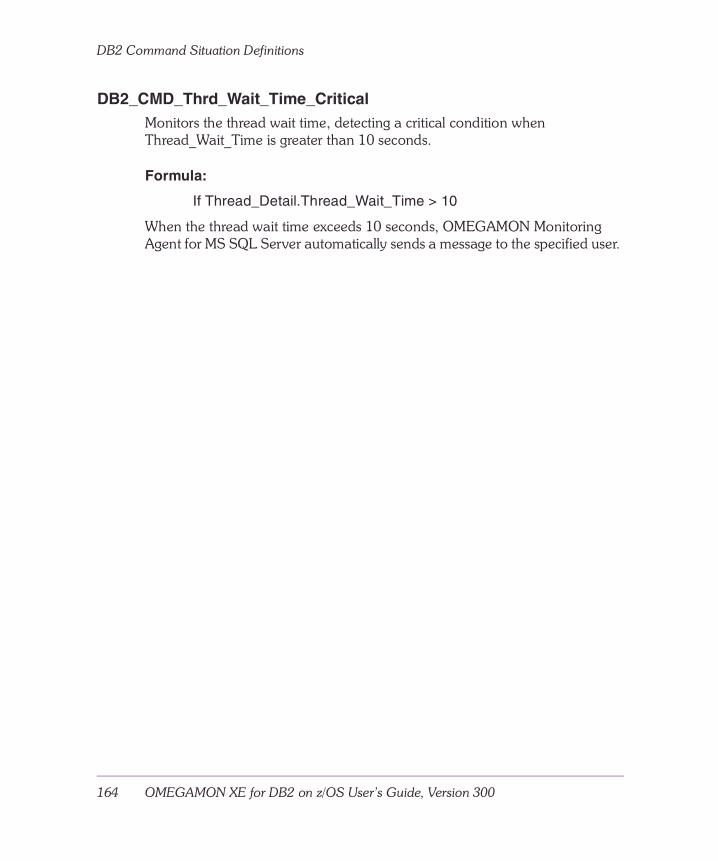
DB2 Command Situation Definitions
164 OMEGAMON XE for DB2 on z/OS User’s Guide, Version 300
DB2_CMD_Thrd_Wait_Time_CriticalMonitors the thread wait time, detecting a critical condition when Thread_Wait_Time is greater than 10 seconds.
Formula:
If Thread_Detail.Thread_Wait_Time > 10
When the thread wait time exceeds 10 seconds, OMEGAMON Monitoring Agent for MS SQL Server automatically sends a message to the specified user.
165
Index
Aaccessing workspaces
Coupling Facility Connections 65Coupling Facility Structures 64Global Lock Conflicts 100GOA Thread Database 88GOA Volume 81GOA Volume Thread 95Group Buffer Pool Statistics 105Group Buffer Pool Structures 111Group Object Activity by Spacename 119Monitored Systems Summary 130Object Analysis Database 136Object Analysis Spacename 137Thread Activity 147
Adobe portable document format 13alert status 32analyzing
coupling facility connections 67database lock conflicts 100spacename allocation data 134, 136, 137thread activity 146thread data 147
application threads 101, 148associating workspaces with attributes 29attribute 24attribute group 28attribute item 28audience for this guide 11
Bbenefits of OMEGAMON XE for DB2 26Buffer Pool Management workspace 55, 58,
76building situations 28
CCandle Management Server 21Candle Management Workstation 21CandleNet Portal
formats for information 33working with workspaces 33
CandleNet Portal server 21castout paging 105, 106CICS Connections workspace 58, 76CICS Threads workspace 59, 70, 76components of OMEGAMON XE 21connection status 65, 67, 112Coupling Facility 62, 110
structure utilization 25structures 62, 65, 110
Coupling Facility Connections workspace 65
Coupling Facility Structures workspace 61–67
creatingsituations 31
creating multiple workspaces 34
Ddata sharing environment 62data sharing group 64database
lock conflicts 25locks 100servers 25
DB2database object allocations 136databases 134object space 138threads 146
DB2 workspacesCoupling Facility Structures 64
166 OMEGAMON XE for DB2 on z/OS User’s Guide, Version 300
Detailed Group Buffer Pool Statistics 106EDM Pool 75GOA Thread Database 86GOA Thread Spacename 89GOA Thread Spacename Detail 90GOA Volume 80GOA Volume Database 81GOA Volume Spacename 82GOA Volume Spacename Detail 83GOA Volume Thread 95GOA Volume Thread Detail 96Group Buffer Pool Connections 112Group Buffer Pool Statistics 105Group Buffer Pool Structures 111Group Object Activity by Spacename 119Group Object Activity by Spacename
Detail 120Group Object Activity Database 116Monitored Systems Summary 129Object Analysis Database 136Object Analysis Spacename 137Object Analysis Spacename Detail 138Thread Activity 147Thread Statistics 148
DDF Conversations workspace 70DDF Statistics workspace 71Detailed Thread Exception workspace 74documentation set 22
Eedit a workspace 35EDM Pool workspace 76enhancing system performance 26evaluating
database lock conflicts 100database object allocations 136impact of a thread 91impact of a thread on volumes 97object allocation 134spacename allocation data 134, 137, 138thread activity 146tuning decision 29
Event Manager for Object Analysis 78, 86, 94, 116, 134
Event workspace, opening 37event, investigating 37
Ffalse contention 62
Gglobal contention 62Global Lock Conflicts workspace group 99global view of thread activity 147GOA Thread Database workspace group 85GOA Thread Database workspaces 86GOA Volume Database Workspace 81GOA Volume Spacename Detail
Workspace 83GOA Volume Spacename Workspace 82GOA Volume Thread Detail Workspace 96GOA Volume Thread Workspace 95GOA Volume Thread workspace group 93GOA Volume Workspace 80GOA Volume workspace group 77Group Buffer Pool Connections
workspace 112Group Buffer Pool Statistics workspace 105Group Buffer Pool Statistics workspace
group 103Group Buffer Pool structures 110Group Buffer Pool Structures
workspace 111Group Buffer Pool Structures workspace
group 109–113group buffer pools
dynamic rebuild 105, 106situation 111statistics 105, 106structure utilization 25structures 106, 110, 111, 112
Group Object Activity by Spacename Detail Workspace 120
Group Object Activity by Spacename
167
Workspace 119Group Object Activity Database
workspace 116Group Object Activity Database workspace
group 115, 116Group Object Activity Database workspace
group. 116group object analysis allocation 25
Hhow OMEGAMON XE for DB2 assists 26
II/O activity 105, 106identifying
active application threads 149active threads 146, 147database lock conflicts 100global database lock conflicts 101lock owners and waiters 100number of active threads 130number of DB2 subsystems 130number of group buffer pool
connections 130number of lock conflicts 130number of object analysis databases 130objects that are consuming resources 121objects with excessive I/O activity 84operating system 65, 112resource consumption in a database 139system bottlenecks 29
IMS Connections workspace 124IMS Region Information workspace 125installing OMEGAMON XE for DB2 on
z/OS 25introducing
OMEGAMON XE for DB2 19–24investigating a true situation
coupling facility 66database lock 101group buffer pool 113thread 149
investigating an event 37IRLM 2.1 100
Llearning about OMEGAMON XE for DB2 on
z/OS 27linking workspaces 36localized automation 31lock
conflict between two DB2 subsystems 101conflicts 100, 101hierarchy chain 100owners 100waiters 100
LOCK1 structures 62, 64, 66, 67
Mmanaged system 28, 29monitored databases 136monitored DB2 systems 136Monitored Systems Summary
workspace 129, 130monitoring
activity rates 64activity rates within structures 111castout paging 105, 106coupling facility structures 66data sharing groups 130database lock activity 100dynamic rebuild of group buffer pool 105,
106facilities 25Group Buffer Pool structure
utilization 110group buffer pool structures 113I/O activity 105, 106lock structure utilization 62managed systems 31multiple servers 25object allocation 134object allocation data 136performance 28, 29
168 OMEGAMON XE for DB2 on z/OS User’s Guide, Version 300
situations 30system summary 130thread activity 146, 149widely dispersed resources 31
monitoring agents 21monitoring the group buffer pools 107
Nnavigating workspace groups
Coupling Facility 78, 86, 94Coupling Facility Structures 62Group Buffer Pool Statistics 104Group Buffer Pool Structures 110Group Object Activity Database 116Object Analysis Database workspace 134Threads 146
Oobject allocation data 136object analysis 78, 86, 94, 116, 134
data 138databases 136information 134
Object Analysis Database workspace group 133–138
object space 138OMEGAMON II 21OMEGAMON XE
definition 20–21OMEGAMON XE for DB2
product features 24OMEGAMON XE for DB2 on z/OS
attributes 28benefits 26monitoring facilities 25planning and installation 25user interface 25workspace groups 46, 130workspaces 29
online help 49open a workspace 34organization of an attribute 28
Pparallel thread 148PDF files, adding annotations 14planning and installation 25predefined situations 24, 25, 66, 101, 113,
149introduction 155
printing problems 13product
features 24, 26properties
defining for a workspace 37
Rrefresh a workspace 34relationship between attributes and
workspaces 29reload a workspace 34remote agents 28
Ssaving a new workspace 36saving a workspace 36SCA structures 62, 64, 66scenarios
Coupling Facility Structures 66Global Lock Conflicts 101Group Buffer Pool Statistics 107Group Buffer Pool Structures 113Group Object Activity Summary 121Group Object Analysis Volume 84Group Object Thread Activity 91Group Object Thread Volume 97Object Analysis Database workspace 139Threads 149
server, CandleNet Portal 21setting threshold levels 25situations
introduction 155spacename allocation data 137stop a workspace 35
169
Subsystem Management workspace 142suspend a workspace 35
TThread Activity workspace group 145–149threads
activity 25, 146, 147situation 147statistics 25, 148
trackinglock processing for application
threads 100structure utilization 64, 66, 111, 113thread activity 146, 147, 149
Uunderstanding
DB2 attributes 28predefined situations 31
understanding workspace groupsCoupling Facility Structures 62Group Buffer Pool Statistics 104Group Buffer Pool Structures 110Object Analysis Database 134Threads 146
user interface 25using OMEGAMON XE for DB2 on z/OS 24
attributes 28automation situations 40information 29predefined situations 31
using this guide 11
Vverifying connection status 62, 110viewing
attribute information 29connection status 65, 112global and false contention 62global and false contention data 64Group Buffer Pool statistics 110
Group Buffer Pool structure data 111structure data 64thread statistics 146
Volume Activity workspace 154
Wwhat’s new in this release 24workspace
creating multiple 34defining properties 37linking 36opening 34refreshing 34reload 34saving 36saving new 36stop 35suspend 35
workspace groups 46–49, 130–??workspace, Event
opening 37workspaces 24
associated with workspace groups 48Buffer Pool Management 55, 58, 76CICS Connections 58, 76CICS Threads 59, 70, 76DDF Conversations 70DDF Statistics 71Detailed Thread Exception 74editing 35EDM Pool 76IMS Connections 124IMS Region Information 125introducing 45, 129Monitored Systems Summary 130Subsystem Management 142Volume Activity 154working with in CandleNet Portal 33

170 OMEGAMON XE for DB2 on z/OS User’s Guide, Version 300


