Haojie Lu,⊥,# Fan Zhong,*,⊥ Qing-Yu He,*,§ Ping Xu,*,∥ Liang Lin,*,‡ and Siqi Liu*,†,‡
†Beijing Institute of Genomics, Chinese Academy of Sciences, No. 1 Beichen West Road, Beijing 100101, China‡BGI-Shenzhen, Beishan Road, Shenzhen 518083, China§Key Laboratory of Functional Protein Research of Guangdong Higher Education Institutes, Institute of Life and Health Engineering,College of Life Science and Technology, Jinan University, 601 Huangpu Road, Guangzhou 510632, China∥State Key Laboratory of Proteomics, Beijing Proteome Research Center, National Engineering Research Center for Protein Drugs,National Center for Protein Sciences, Beijing Institute of Radiation Medicine, 27 Taiping Road, Beijing 102206, China
⊥Institutes of Biomedical Sciences, Fudan University, 130 DongAn Road, Shanghai 200032, China#Department of Chemistry, Fudan University, 220 Handan Road, Shanghai 200433, China
*S Supporting Information
ABSTRACT: Cancer genomics unveils many cancer-related mutations, including some chromosome 20 (Chr.20) genes. Themutated messages have been found in the corresponding mRNAs; however, whether they could be translated to proteins still requiresmore evidence. Herein, we proposed a transomics strategy to profile the expression status of human Chr.20 genes (555 in Ensemblv72). The data of transcriptome and translatome (the mRNAs bound with ribosome, translating mRNAs) revealed that ∼80% of thecoding genes on Chr.20 were detected with mRNA signals in three liver cancer cell lines, whereas of the proteome identified, only∼45% of the Chr.20 coding genes were detected. The high amount of overlapping of identified genes in mRNA and RNC-mRNA(ribosome nascent-chain complex-bound mRNAs, translating mRNAs) and the consistent distribution of the abundance averages ofmRNA and RNC-mRNA along the Chr.20 subregions in three liver cancer cell lines indicate that the mRNA information is efficientlytransmitted from transcriptional to translational stage, qualitatively and quantitatively. Of the 457 genes identified in mRNAs andRNC-mRNA, 136 were found to contain SNVs with 213 sites, and >40% of these SNVs existed only in metastatic cell lines,suggesting them as the metastasis-related SNVs. Proteomics analysis showed that 16 genes with 20 SNV sites were detected withreliable MS/MS signals, and some SNVs were further validated by the MRM approach. With the integration of the omics data at thethree expression phases, therefore, we are able to achieve the overall view of the gene expression of Chr.20, which is constructive inunderstanding the potential trend of encoding genes in a cell line and exploration of a new type of markers related to cancers.
■ INTRODUCTIONCancer pathogenesis is rooted in chromosomal abnormalitiesand aneuploidy in cells. It is generally believed that chromosomalimbalances play a causative role in tumorigenesis.1 Moreover,each chromosome has its own characteristic of genomic struc-ture and exerts the specific impact on intrinsic infidelity ofinheritance. For instance, recurrent gain of the long arm ofchromosome 20 (Chr.20q) was observed in many cancer cells,such as pancreatic cancer, gastric cancer, and colon cancer;however, 20q deletion is very rare in most cases reported sofar.2−7 After examining the samples of prostate cancer, Tabachet al. proposed that 13 genes in Chr.20q13 associated withChr.20q amplification play “cancer initiating genes” in thecancer-driving processes.8 A large number of somatic mutationswere found in Chr.20 as well. According to the database collectedby the Catalogue of Somatic Mutations in Cancer (COSMICv65: http://cancer.sanger.ac.uk/cancergenome/projects/cosmic/), there are in total 1684 genes with liver-cancer-relatedvariations (Table S1 in the Supporting Information), of which54 are located on Chr.20, including 50 SNVs, 2 deletions, and 2unknown types. The variation rate is ∼10% of the genes in thischromosome. Determining which somatic mutations are likely tocontribute to the cancer phenotype is the most common aim ofchromosome-based research of cancer.9
With the advancement in sequencing technology, cancergenomics has emerged for increasing the basic knowledge ofcancer biology and the opportunity to advance cancer preven-tion, diagnostics, prognostics, and treatment.10−12 A huge bodyof somatic mutations across several major tumor types has beengenerated by deep sequencing, which provided instructiveinsights into the opportunities and challenges of a genomics-driven framework in cancer.13−15 Meanwhile, these databaseshave unveiled the immense genomic complexity and strikinginter- and intratumor heterogeneity.16 Even though thousands ofcancer mutations have accumulated, a limited number offunctional changes and drives to cancer biology are learnedfrom the sequencing data. The field is urgently demanded togather systematical information related to oncological questionsand somatic mutations and to bring the benefit elicitedfrom sequencing power to clinical care. Unexpectedly, high-throughput RNA sequencing studies revealed that only a limitednumber of mutations were expressed at the mRNA level,indicating that the mutation messages at transcripts are notcompletely inherited from DNA. Moreover, even fewer mutatedproteins were confirmed on the basis of somatic mutations incancer. A transomics strategy is thus proposed, which requiresthe generation of several types of omics data from each individualcancer specimen, including genome, transcriptome, proteome,and metabolome.17,18 This strategy is expected to identify andvalidate the reliable mutations related to cancer that are altered athigh frequency.It is generally accepted that mRNA abundance is poorly cor-
related with protein abundance in a biological system, especiallyfor the expression products at low abundance. An argument hasbeen raised for years in which the amount of translating mRNAs(mRNAs bound to ribosome-nascent chain complex, RNC-mRNA) may better reflect protein abundance.19 Recently Wanget al. systematically analyzed the relative abundances of mRNAs,RNC-mRNAs, and proteins on s genome-wide scale and re-ported that a strong correlation between RNC-mRNAs andproteins in their relative abundances could be establishedthrough a multivariate linear model by integrating the mRNAlength as an element.20 The authors proposed that the intrinsic
and genome-wide translation modulations at translatomic levelat the steady state are tightly correlated with the protein abun-dance and functionally relevant to cellular phenotypes in humancells.20 On the basis of these findings, we adopted a transomicstrategy to qualitatively and quantitatively monitor the changesof gene expression in liver cancer cell lines. We expect that thestrategy with one more dimensional omics data will create a newscope to overview the expression status of the encoding genes onChr.20, which is in accordance with the aim of Chromosome-Centric Human Proteomics Project (C-HPP).21,22
In this study, we selected three liver cancer cell lines andprofiled the gene expression at three omics levels in these cells.There is a high incidence of liver cancer worldwide, and it isrecognized by serious chromosomal abnormality and genemutations. The cancer cell lines are the ideal model for thestudy of carcinogenetic mechanisms. Hep3B has p53 gene lostand behaves as a nonmetastatic cell line.23,24 MHCC97H andHCCLM3 with p53 mutations exhibit 100% lung metastasisupon orthotopic inoculation, and HCCLM3 has additionallymphonode metastasis ability.25 The three cell lines have beenwidely adopted in many research laboratories. On the basis of thequalitative and quantitative data through the transomics analysisof the three cell lines, the expression status of Chr.20 genes wasmapped onto the chromosomal positions. It was revealed thatthe mRNAs from Chr.20 were close to the correspondingRNC-mRNAs in either identification number or the abundance,while the proteins identified were obviously less than the twomRNA data sets. Accordingly, the abundance distribution of theexpressed Chr.20 genes remained as similar modes along thesubregions of Chr.20 in all three cancer cell lines. The Chr.20mutations detected at mRNA, RNC-mRNA, and protein leveland their chromosomal distribution in the three cell lines weredeeply analyzed. We obtained solid evidence, for the first time,that the SNV information in the genome could be transmittedthrough all expression stages, from mRNA to RNC-mRNA andfrom RNC-mRNA to protein. Meanwhile, the SNV types inHep3B at both mRNA and protein were found to be differentfrom those in MHCC97H and HCCLM3. It is worth inves-tigating whether these SNVs may function as the biomarkers thatenable discrimination of metastatic and nonmetastatic cancer celllines.
■ MATERIALS AND METHODS
1. Sample Preparation and Transomics Data Acquisition
The three liver cancer cell linesHep3B,MHCC97H, andHCCLM3were cultured in H-DMEM supplemented with 10% fetal bovineserum at 37 °C and 5%CO2, with strict quality control to avoid anycontaminations. The cells were then harvested at∼80% confluence,and the harvested cells were divided into two groups for RNA-Seqand LC−MS/MS analysis.For the sample preparation of transcriptomic and translatomic
analysis, ribosome-nascent chain (RNC) extraction was performedas previously reported.20 In brief, themRNA andRNC-mRNAwereisolated, respectively, from the cultured cells by using TRIzol_RNAextraction reagent (Ambion, Austin, TX). Equal amounts of mRNAor RNC-mRNA from three independent preparations were pooled;subsequently, the library was constructed by using NEBNext mRNASample Prep Master Mix Set. RNA sequencing was conducted uponIllumina HiSeq-2000 with 50 cycles.For the sample preparation of proteomic analysis, the
harvested cells were washed with ice-cold PBS three times andlysed in the buffer containing 8 M urea, 50 mM NH4HCO3, and
Journal of Proteome Research Article
dx.doi.org/10.1021/pr400899b | J. Proteome Res. 2014, 13, 200−211201
5 mM IAA. The total cells lysates were centrifuged with 12 000gfor 10 min at 4 °C to remove cell debris. The lysate was diluted toreduce the concentration of urea to∼1M, followed by sequentialin-solution protein digestion by Lys-C and trypsin at 37 °C,respectively. The resulting tryptic peptides were cleaned by C18Sep-Pak column (Waters UK, Manchester, U.K.) and fraction-ated by high-pH RP to 24 fractions. Peptides in each fractionwere then delivered to LC−MS/MS analysis by Q-Exactive(Thermo Fisher Scientific) equipped with an Easy-nLCnanoflow LC system (Thermo Fisher Scientific) and TripleTOF 5600 equipped with nano-HPLC (Eksigent Technologies),respectively. Each fraction was done in such mass spectrometryanalysis with duplicates.
2. Data Analysis of Transcriptome and Translatome
The sequencing reads were mapped to the Ensembl-v72mRNA reference sequences using FANSe2 algorithm (http://bioinformatics.jnu.edu.cn/software/fanse2/) with the param-eters of −L55 −E3 −S14.26 Alternative splicing variants weremerged. The genes with at least 10 mapped reads were set as thethreshold for confident gene identification and quantification.For single nucleotide variants (SNVs) calling, TopHat was usedfor reads alignment with the reference sequences of hg19(http://genome.ucsc.edu/cgi-bin/hgGateway), and SAMtoolsmpileup was used for statistical evaluation of the aligned reads,requiring a minimum read depth of 10 and a maximum readdepth of 2000.27,28 ANNOVAR was used to annotate the SNVs,and those SNVs in gene coding regions were collected to con-struct a database for further proteome data searching.29
The abundance of mRNA and RNC-mRNA was normalizedand estimated using the RPKM.30 The differential mRNAs andRNC-mRNAs across cell lines were evaluated with trimmedmean of M values method based on the negative binomial dis-tribution using edgeR.31
3. Data Analysis of Proteome
The raw MS/MS data were converted into MGF format by theMSconvert module32 in the Trans-Proteomic Pipeline (TPPv4.5.2), followed by protein search using Mascot 2.3.02 (MatrixScience, Boston, MA) against Swiss-Prot (20 258 proteins,release 2013_06). For the discovery of the mutated peptides, theMS/MS data were searched against the SNV database generatedfrom this study. All identified peptides matched to the FDRcriteria at ≤0.01.For protein quantification, the extracted ion chromatograms
(XICs) corresponding to peptides were constructed, and theaccurate areas under the XIC curves were calculated as the pep-tide abundance. Then, the protein abundance was determined asthe sum of all of its unique peptides. The quantification algorithmwas based on SILVER.33 The iBAQ index was represented forprotein abundance, and its median was normalized for com-parison of the same protein in different data sets.
■ RESULTS
1. Expression Status of Chr.20 Genes in Three Liver CancerCell Lines
For the sake of exploring the expression status of Chr.20 genesrelated to liver cancer, we performed a systematic investigation oftransomics in three liver cancer cell lines, Hep3B, HCCLM3, andMHCC97H, in which the expression of Chr.20 genes at mRNA,RNC-mRNA, and protein was qualitatively and quantitativelymonitored. Thedata illustrated inFigure 1a reveal that approximately79 (438/555), 78 (429/555), and 44% (245/555) of the coding
genes on Chr.20 are detected in three liver cancer cell lines usingRNA-Seq for mRNA and RNC-mRNA and LC−MS/MS forproteins. The scale of translatomic data is quite close to thetranscribed genes, and the overlapping rate of transcriptome andtranslatome is as high as 95.5% (425 Chr.20 genes shared bymRNA and RNC-mRNA), indicating that most transcripts couldbind to ribosome. However, only ∼57% (243/425) of the tran-scribed genes were detected by the proteomic approach. Addi-tionally, there are some unexplainable results: 7 genes with readnumbers >10 in RNC-mRNA but not in mRNA, while 2 proteinswith FDR < 1% by MASCOT but not detected by RNA-Seq inboth mRNA and RNC-mRNA.Further comparison of the expression status of Chr.20 genes
among the three liver cancer cell lines, as shown in Figure 1b−d,demonstrates that the expressed genes are highly overlapped inthese cell lines at all three levels, 87% (379/438) for tran-scriptome, 84% (362/429) for translatome, and 77% (189/245) forproteome, respectively. The expression data indicate that the threecell lines possibly come from close origins. Considering that thespecific expression genes in such individual cell line are relativelylower, quantitative analysis to the large number of the expressedChr.20 genes is necessary to find out the metastasis-related genes.As the early report, the chromosomal proteome data sets
generated from Chinese Human Chromosome ProteomeConsortium were assigned as CCPD, the version of CCPD inlast year was assigned as CCPD1.0, and CCPD1.0 added the dataof this year was assigned as CCPD2.0. The proteome data setselicited in this study are termed as CCPD2013. The databasesearch of LC−MS/MS signals was first against Ensembl v72 andthe proteins identified were compared with four public data-bases, GPMBD (http://gpmdb.proteome.ca/), PeptideAtlas
Figure 1. Expressed Chr.20 genes identified at three omics levels in thethree liver cancer cell lines. (a) The overlapping of the identified genes inall three cell lines among transcriptome, translatome, and proteome. (b)Overlapping of the identified genes at transcriptome among the threeliver cancer cell lines. (c) Overlapping of the identified genes attranslatome among the three liver cancer cell lines. (d) Overlapping ofthe identified genes at proteome among the three liver cancer cell lines.
Journal of Proteome Research Article
dx.doi.org/10.1021/pr400899b | J. Proteome Res. 2014, 13, 200−211202
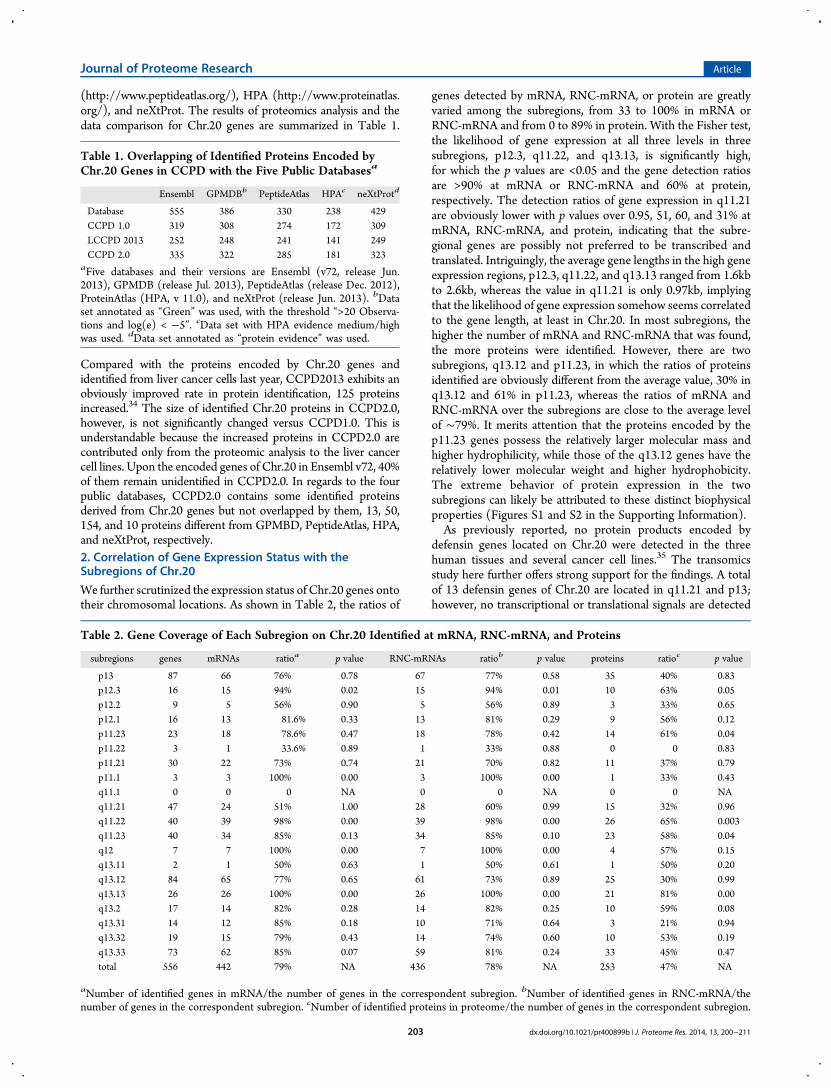
(http://www.peptideatlas.org/), HPA (http://www.proteinatlas.org/), and neXtProt. The results of proteomics analysis and thedata comparison for Chr.20 genes are summarized in Table 1.
Compared with the proteins encoded by Chr.20 genes andidentified from liver cancer cells last year, CCPD2013 exhibits anobviously improved rate in protein identification, 125 proteinsincreased.34 The size of identified Chr.20 proteins in CCPD2.0,however, is not significantly changed versus CCPD1.0. This isunderstandable because the increased proteins in CCPD2.0 arecontributed only from the proteomic analysis to the liver cancercell lines. Upon the encoded genes of Chr.20 in Ensembl v72, 40%of them remain unidentified in CCPD2.0. In regards to the fourpublic databases, CCPD2.0 contains some identified proteinsderived from Chr.20 genes but not overlapped by them, 13, 50,154, and 10 proteins different from GPMBD, PeptideAtlas, HPA,and neXtProt, respectively.2. Correlation of Gene Expression Status with theSubregions of Chr.20
We further scrutinized the expression status of Chr.20 genes ontotheir chromosomal locations. As shown in Table 2, the ratios of
genes detected by mRNA, RNC-mRNA, or protein are greatlyvaried among the subregions, from 33 to 100% in mRNA orRNC-mRNA and from 0 to 89% in protein. With the Fisher test,the likelihood of gene expression at all three levels in threesubregions, p12.3, q11.22, and q13.13, is significantly high,for which the p values are <0.05 and the gene detection ratiosare >90% at mRNA or RNC-mRNA and 60% at protein,respectively. The detection ratios of gene expression in q11.21are obviously lower with p values over 0.95, 51, 60, and 31% atmRNA, RNC-mRNA, and protein, indicating that the subre-gional genes are possibly not preferred to be transcribed andtranslated. Intriguingly, the average gene lengths in the high geneexpression regions, p12.3, q11.22, and q13.13 ranged from 1.6kbto 2.6kb, whereas the value in q11.21 is only 0.97kb, implyingthat the likelihood of gene expression somehow seems correlatedto the gene length, at least in Chr.20. In most subregions, thehigher the number of mRNA and RNC-mRNA that was found,the more proteins were identified. However, there are twosubregions, q13.12 and p11.23, in which the ratios of proteinsidentified are obviously different from the average value, 30% inq13.12 and 61% in p11.23, whereas the ratios of mRNA andRNC-mRNA over the subregions are close to the average levelof ∼79%. It merits attention that the proteins encoded by thep11.23 genes possess the relatively larger molecular mass andhigher hydrophilicity, while those of the q13.12 genes have therelatively lower molecular weight and higher hydrophobicity.The extreme behavior of protein expression in the twosubregions can likely be attributed to these distinct biophysicalproperties (Figures S1 and S2 in the Supporting Information).As previously reported, no protein products encoded by
defensin genes located on Chr.20 were detected in the threehuman tissues and several cancer cell lines.35 The transomicsstudy here further offers strong support for the findings. A totalof 13 defensin genes of Chr.20 are located in q11.21 and p13;however, no transcriptional or translational signals are detected
Table 1. Overlapping of Identified Proteins Encoded byChr.20 Genes in CCPD with the Five Public Databasesa
aFive databases and their versions are Ensembl (v72, release Jun.2013), GPMDB (release Jul. 2013), PeptideAtlas (release Dec. 2012),ProteinAtlas (HPA, v 11.0), and neXtProt (release Jun. 2013). bDataset annotated as “Green” was used, with the threshold “>20 Observa-tions and log(e) < −5”. cData set with HPA evidence medium/highwas used. dData set annotated as “protein evidence” was used.
Table 2. Gene Coverage of Each Subregion on Chr.20 Identified at mRNA, RNC-mRNA, and Proteins
subregions genes mRNAs ratioa p value RNC-mRNAs ratiob p value proteins ratioc p value
aNumber of identified genes in mRNA/the number of genes in the correspondent subregion. bNumber of identified genes in RNC-mRNA/thenumber of genes in the correspondent subregion. cNumber of identified proteins in proteome/the number of genes in the correspondent subregion.
Journal of Proteome Research Article
dx.doi.org/10.1021/pr400899b | J. Proteome Res. 2014, 13, 200−211203
by RNA-Seq or LC−MS/MS in all three liver cancer cell lines(Table S2 in the Supporting Information). There are in totalaround 40 defensin genes in the human genome, but only twogenes, DEFB1 and DEFBA104, on Chr.8 were detected withmRNA. No protein signals for the two genes were detectedeither. The sequence alignment of DEFB1 and DEFBA104 withthose defensins on Chr.20 shows little sequence homology(Figure S3 in the Supporting Information), which excludes thepossibility of bias matching of mRNA reads to the two genes.These findings are consistent with previous reports that defensingenes are usually restricted within a few of tissues and cells,such as the respiratory, gastrointestinal, and genitourinary tracts,skin, and circulating blood cells.36 There is no report about thesegenes in liver cells. Our observation here provided strongevidence of the defect expression of defensin genes in liver cancercells, either of Chr.8 or Chr.20. How the defensin genes ex-pression is regulated related to chromosome has yet to beunderstood. In addition, some defensin proteins possibly blockthe tumor proliferation and trigger antitumor immunity37,38 andwere reported to be specifically lost in cancer tissue, while they
remained at a high level in the control tissues, such asDEFB1.39,40
The expression abundance of Chr.20 genes along thechromosomal subregions is outlined in Figure 2. The patternsof mRNA abundance distribution in the subregions of Chr.20 areclose to that of RNC-mRNA, whereas that of protein abundanceseem quite distinct from the corresponding mRNAs. Because theabundance distribution of mRNA and RNC-mRNA is highlyoverlapped, the transcriptional information transferred fromChr.20 genes is expected to be mostly delivered to the earlytranslational-stage mRNA binding with ribosome. Closelylooking at the subregions with higher protein abundance suchas p13, p11.21, q11.22 and q11.23, the abundance profiles ofproteins are not so different from the corresponding mRNA andRNC-mRNA. We postulate that the difference between proteinabundance distribution and that of mRNAs on Chr.20 is likelydue to the lower ratio of protein identification. Upon Figure 2,the distribution curves of expression abundance among threecancer cell lines are compared in parallel. Although in mostsubregions the abundance profiles of mRNA and RNC-mRNA in
Figure 2.Distribution of the average abundance for the expressed genes in Chr.20 at the subregions. Upper panel and lower panel: the distribution of theaverage abundance for the expressed genes in Chr.20 p arm and q arm. The y axes assigned as RPKM and iBAQ represent the mRNA and proteinabundance, respectively. The triangles represent differential mRNAs or proteins, taking Hep3B as the reference.
Journal of Proteome Research Article
dx.doi.org/10.1021/pr400899b | J. Proteome Res. 2014, 13, 200−211204
three cell lines are similar, the abundance of mRNA and RNC-mRNA of Hep3B in some subregions, such as p12.3, p11.2, andq13.12, is slightly different from that of the other two cell lines.On the basis of the expression abundance of Chr.20 genes andtaking Hep3B as a reference, the differential genes potentiallyrelated to metastasis in MHCC97H and HCCLM3 are definedby setting stringent criteria. In MHCC97H, 46, 42, and 31differential genes were defined, while in HCCLM3, 39, 42,and 23 differential genes were found at the transcriptomic,translatomic, and proteomic levels, respectively (Table S3 in theSupporting Information). The overlapping of differential genesbetweenMHCC97H andHCCLM3 is over 80% at either mRNAor RNC, whereas it is significantly lower at protein, <50%. More-over, the abundance information from mRNA delivered toprotein is relatively lower in the two cell lines, as only ∼20% ofthe differential genes at mRNA could be detected at protein. Asshown in Figure 2, the differential genes are mapped onto thecorresponding positions on Chr.20, unveiling that the genesdefined upon the mRNA or protein abundances are unevenlydistributed on Chr.20. For instance, >20% of the genes in q11.23,q13.13, and q13.2 are suspected to be the differential genes,whereas <5% of the genes in q13.12 belong to such category.The abundance of mRNAs and proteins encoded by Chr.20hence affords plentiful information with respect to under-standing how the gene expression status relies on the chro-mosomal position.
3. SNVs of Chr.20 Genes Identified in mRNA and RNC-mRNA
A tight correlation between genome SNVs and carcinogenesis iswell-known, however, whether the variant information in agenome could be effectively transferred to mRNA, RNC-mRNA,and protein is not clearly elucidated. Considering that the scale ofexpressed genes identified at mRNA is quite close to that atRNC-mRNA but is very different from that at protein, weanalyzed the SNVs in Chr.20 genes in mRNA and RNC-mRNAin the three liver cancer cell lines, aiming at exploring the SNVsrelated to metastasis of liver cancer.Of the 555 Chr.20 genes, a total of 136 SNV genes are found
in this study, including 113 from mRNA and 116 from RNC-mRNA, and the overlapped genes were∼80% in the two data sets
(Figure 3a, Table S4 in the Supporting Information). Furtheranalysis reveals that of these genes, 82 have a single variant site,30 have 2 variant sites, and 11 have 3 or more variant sites. Twogenes contain variant sites of more than 5, LAMA5 and PRIC285,with 11 and 13, respectively. The gene LAMA5 was reported tobe involved in the regulation of cell migration, growth, andproliferation, and its mutation forms were found in cancersamples, such as gastric cancer and intestine cancer. The genePRIC285 functions as a coregulator of peroxisome proliferator-activated receptor γ, but its involvement in carcinogenesis has notyet been reported. Compared with the database of COSMIC, thepublic-cancer-related SNV database,∼88% of the identified SNVgenes are covered by the database, suggesting that these variantsites have a high likelihood of being cancer-related. The 136 SNVgenes in Chr.20 were identified with total of 203 variant sites,including 162 from mRNA and 176 from RNC-mRNA, and theoverlapped sites are also ∼80% (Figure 3b), implying that themajority of SNV information in mRNA could be accuratelytransmitted to RNC-mRNA. In a comparison of these sites withCOSMIC, only∼13% (26mutation sites) are covered, and of the26 sites, 21 are identified by both mRNA and RNC-mRNA.These SNV sites shared by the different data sets may reallyrepresent the biological correlation of liver carcinogenesis.Moreover, the SNV sites not covered byCOSMIC but confirmedby both mRNA and RNC-mRNAmay offer a new clue to explorethe potential candidate of metastasis-related biomarkers.The SNV sites in three liver cancer cell lines are clustered into
three groups, as depicted in Figure 3c. One group includes 87sites in 72 genes, found in MHCC97H and HCCLM3 but not inHep3B, while another group has 73 sites in 57 genes, found onlyin Hep3B but not in MHCC97H or HCCLM3. The third groupcontains all SNV sites through three cell lines, 25 sites in 23genes. Of the SNV sites shared by MHCC97H and HCCLM3,12 were appointed as cancer-related, such as LAMA5 atChr.20_60887581_C→T in breast cancer and DIDO1 atChr.20_61528271_G→A in gastric cancer, as shown inCOSMIC, and of the SNV sites detected only in Hep3B, 10were documented as cancer-related, such as SIRPA atChr.20_1895889_G→C in prostate cancer. The SNV sites
Figure 3. Comparison and cluster analysis to the mutated genes and sites identified in transcriptome and translatome. (a) Overlapping of the identifiedmutated genes in this study and COSMIC. (b) Ovelapping of the identified mutated sites in this study and COSMIC. (c) Heatmap of mutated sitesamong three liver cancer cell lines.
Journal of Proteome Research Article
dx.doi.org/10.1021/pr400899b | J. Proteome Res. 2014, 13, 200−211205
found in Chr.20 provide a suggestive clue to distinguish the twodifferent cell types, metastasis and nonmetastasis.Figure 4 exhibits the mapping of these SNVs on their chro-
mosomal locations. With the Fisher test, the statistic evaluationdemonstrates that the SNVs are significantly enriched in suchsubregions as p12.3, p12.1, p11.23, p11.21, q12, and q13.2, wherethe variation ratios occupy >25%. Looking at the rates ofindividual nucleic acid in each SNV site, there seems to be anorder of variation favor at A > G > T > C; however, at the rate ofsubstitution, there seems to be two dominant substitutions ofG→A and A→G with 23 and 18% in all substitution types,suggesting the two substituted changes are very active (Figure S4
in the Supporting Information). Comparison of the substitutiontypes detected by both mRNA and RNC-mRNA reveals thatmost types have no change at transcription- and ribosome-binding stages; however, some substitution types changedgreatly, such as 14 C→G, 15 C→T, and 13 T→C were detectedin mRNA whereas there were only 5, 21, and 18 of the same typein RNC-mRNA, respectively.
4. SNVs of Chr.20 Genes Identified in Proteome
Are the SNVs in cancer cells finally delivered into the functionalmolecules? Although the current technique of proteomics is stillrestricted to identify enough unique peptides covering the whole
Figure 4. Chromosomal distribution of the mutated genes and sites at mRNA, RNC-mRNA, and protein identified in this study. The mutationsidentified are mapped to their correspondent gene positions in Chr.20. The rings of black, red, purple, and green represent Chr.20 genes, the identifiedmutated genes at mRNAs, RNC-mRNA, and proteins, respectively. The characters with colors represent the different substitutions of nucleic acid at themutated sites.
Journal of Proteome Research Article
dx.doi.org/10.1021/pr400899b | J. Proteome Res. 2014, 13, 200−211206
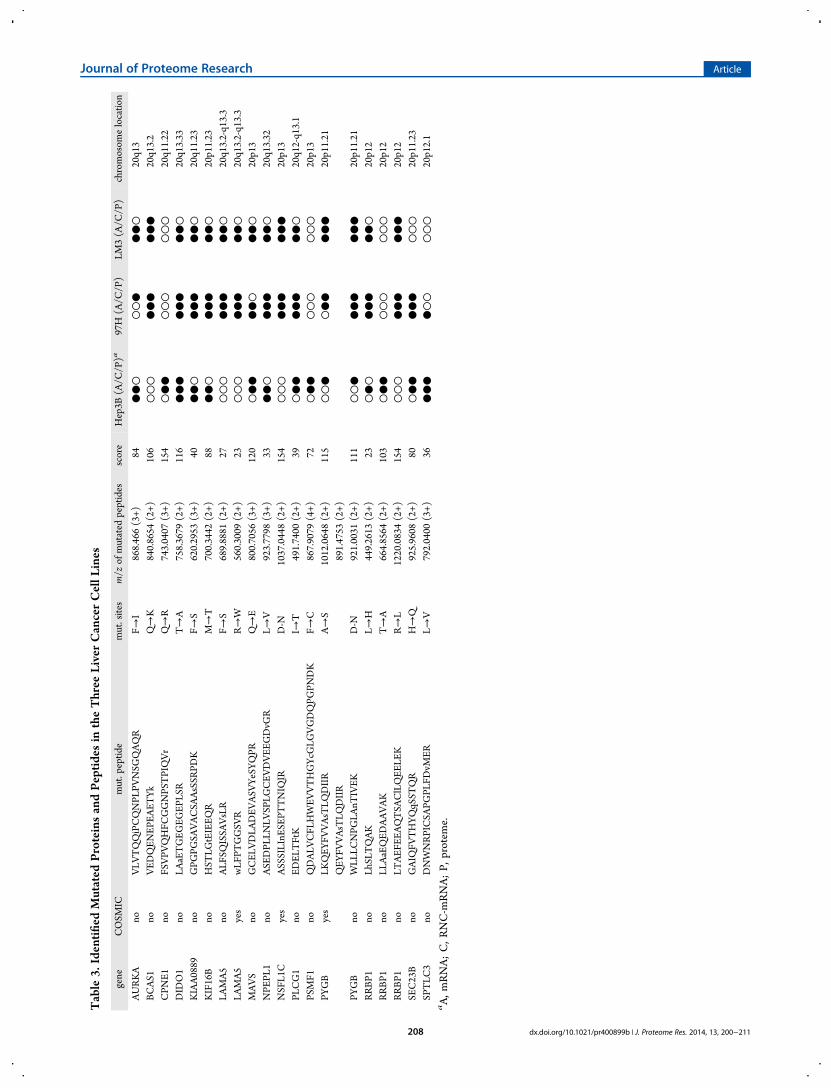
amino acid sequence of a protein, mass spectrometry with highresolution is available to detect some mutated peptides. Toensure the discovery of mutated peptides, we identified thesepeptides based on high quality and repeat of MS/MS spectra(Figure S5 in the Supporting Information). For instance, themutated sites A303S and D502N in PYGB are confirmed by 78and 88 MS/MS spectra, respectively, and the 10 mutated sites inRRBP1, DIDO1, BCAS1, NSFL1C, and CPNE1 are matchedwith more than 10 spectra at each site. We performed the MRMapproach to validate all of the mutated peptides under the LCcondition without prefractionation. Because the peptidecomplexity in the unfractionated samples is too high to detectall target peptides, only six mutated peptides were found with thesatisfied MRM signals. Figure 5 illustrates the quantitativedistribution of the twomutated peptides,wLFPTGGSVR (r→w)in LAMA5 and LAaETGEGEGEPLSR (t→a) in DIDO1 in threeliver cancer cell lines. Because the signals of the two mutatedpeptides are quite lower inHep3B, a logical deduction is that theyare likely to be representative of the two metastasis cell lines, andthe mutated peptides are the potential candidates related tometastasis. The other four mutated peptides confirmed by MRMare listed in Figure S6 in the Supporting Information.As shown in Table 3, 20 variant sites contained in 16 unique
proteins encoded by genes in Chr.20 were identified. The cor-responding mRNAs or RNC-mRNAs of the majority of mutatedproteins (10/16) have multiple SNV sites, whereas only threeproteins, LAMA5, PYGB, and RRBP1, were detected withmultiple mutated peptides. For LAMA5, 2 of the 13 sites atmRNA and RNC-mRNA were identified by proteome, ALF-SQISSAVsLR (f→s) and wLFPTGGSVR (r→w); for RRBP1, all3 variant sites, LhSLTQAK (l→h), LLAaEQEDAAVAK (t→a),and LTAEFEEAQTSAClLQEELEK (r→l); and for PYGB, bothof the 2 variant sites, LKQEYFVVAsTLQDIIR (a→s) and
RWLLLCNPGLAnTIVEK (d→n). Checking the SNV informa-tion transmitted from mRNA to protein, we found that 14 out of20 sites had the detectable variant messages through all threeexpression levels (Table 3). Of the mutated peptides, moremutation signals appear detectable for the metastasis cell lines,especially for MHCC97H. More specifically, some mutated sitesdetected only in MHCC97H and HCCLM3 at both mRNAand protein are possibly metastasis-related indicators, such asVEDQENEPEAETYk (q→k) in BCAS1, ALFSQISSAVsLR (f→s)in LAMA5, ASSSILInESEPTTNIQIR (d→n) in NSFLC, andLTAEFEEAQTSAClLQEELEK (r→l) in RRBP1. The mutatedsites detected only in Hep3B are likely to be non-metastasis-related, such as FSVPVQHFCGGNPSTPIQVr (q→r) inCPNE1, GCELVDLADEVASVYeSYQPR (q→e) in MAVS,DNWNRPICSAPGPLFDvMER (l→v) in SPTLC3, and LLA-aEQEDAAVAK (t→a) in RRBP1. This study has started tountangle the exploration of the SNVs and expressed Chr.20 genesin cancer cell lines using the transomics approaches. The transomicsevidence paves an avenue for validation of the metastasis-relatedcandidates in liver cancer in further investigations.
■ DISCUSSION
Under the guidance of C-HPP, we proposed a transomic strategyaiming at unveiling the correlations between gene expression andchromosome. It was found that the identified Chr.20 genes byRNA-Seq at mRNA are >95% overlapped with that at RNC-mRNA, and the abundance distribution along Chr.20 subregionsof the two mRNAs remains at a similar pattern. Moreover, >80%of the SNVs are shared by both mRNA and RNC-mRNA en-coded by Chr.20 genes. The high correlation leads to a clearconclusion that the delivery process of mRNA to RNC-mRNA isvery efficient with a complete conversion, at least in Chr.20.Furthermore, the transomics data from the three different
Figure 5. Validation of the mutated peptides in LAMA5 and DIDO1 by MRM. Upper panel: the overlays of MRM signals for the peptide of LAMA5,wLFPTGGSVR (r → w) in three liver cancer cell lines. Lower panel: the overlays of MRM signals for the peptide of DIDO1, LAaETGEGEGEPLSR(t → a), in three liver cancer cell lines.
Journal of Proteome Research Article
dx.doi.org/10.1021/pr400899b | J. Proteome Res. 2014, 13, 200−211207
Table3.Identified
Mutated
ProteinsandPeptidesin
theThree
LiverCancerCellL
ines
gene
COSM
ICmut.peptid
emut.sites
m/z
ofmutated
peptides
score
Hep3B
(A/C
/P)a
97H
(A/C
/P)
LM3(A/C
/P)
chromosom
elocatio
n
AURKA
noVLV
TQQiPCQNPL
PVNSG
QAQR
F→I
868.466(3+)
84●●○
○○●
●●○
20q13
BCAS1
noVED
QEN
EPEA
ETYk
Q→K
840.8654
(2+)
106
○○○
●●●
●●●
20q13.2
CPN
E1no
FSVPV
QHFC
GGNPS
TPIQVr
Q→R
743.0407
(3+)
154
○●●
○○○
○○○
20q11.22
DID
O1
noLA
aETGEG
EGEP
LSR
T→A
758.3679
(2+)
116
●●●
●●●
●●○
20q13.33
KIAA0889
noGPG
PGSA
VACSA
AsSSR
PDK
F→S
620.2953
(3+)
40●●○
●●●
●●○
20q11.23
KIF16B
noHST
LGtEIEEQ
RM→T
700.3442
(2+)
88●●○
●●●
●●○
20p11.23
LAMA5
noALF
SQISSA
VsLR
F→S
689.8881
(2+)
27○○○
●●●
●●○
20q13.2-q13.3
LAMA5
yes
wLF
PTGGSV
RR→W
560.3009
(2+)
23○○○
●●●
●●○
20q13.2-q13.3
MAVS
noGCEL
VDLA
DEV
ASV
YeSYQPR
Q→E
800.7056
(3+)
120
○●●
●●○
●●○
20p13
NPE
PL1
noASE
DPL
LNLV
SPLG
CEV
DVEE
GDvG
RL→
V923.7798
(3+)
33●●○
●●●
●●○
20q13.32
NSF
L1C
yes
ASSSILInE
SEPT
TNIQ
IRD-N
1037.0448(2+)
154
○○○
●●●
●●●
20p13
PLCG1
noED
ELTFtK
I→T
491.7400
(2+)
39○●●
●●●
●●○
20q12-q13.1
PSMF1
noQDALV
CFL
HWEV
VTHGYcG
LGVGDQPG
PNDK
F→C
867.9079
(4+)
72○●●
○○○
○○○
20p13
PYGB
yes
LKQEY
FVVAsTLQ
DIIR
A→S
1012.0648(2+)
115
○○●
○●●
●●●
20p11.21
QEY
FVVAsTLQ
DIIR
891.4753
(2+)
PYGB
noWLL
LCNPG
LAnT
IVEK
D-N
921.0031
(2+)
111
○○●
●●●
●●●
20p11.21
RRBP1
noLh
SLTQAK
L→H
449.2613
(2+)
23○●○
●●●
●●○
20p12
RRBP1
noLL
AaEQED
AAVAK
T→A
664.8564
(2+)
103
○●●
○○○
○○○
20p12
RRBP1
noLT
AEF
EEAQTSA
ClLQEE
LEK
R→L
1220.0834(2+)
154
○○○
●●●
●●●
20p12
SEC23B
noGAIQ
FVTHYQqSST
QR
H→Q
925.9608
(2+)
80○●●
●●●
○○○
20p11.23
SPTLC
3no
DNWNRPICSA
PGPL
FDvM
ERL→
V792.0400
(3+)
36●●●
●○○
○○○
20p12.1
aA,m
RNA;C,R
NC-m
RNA;P,
protem
e.
Journal of Proteome Research Article
dx.doi.org/10.1021/pr400899b | J. Proteome Res. 2014, 13, 200−211208
techniques support the discovery of the differential genes andSNVs between the metastatic and nonmetastatic cell lines. Incontrast with the high coverage and sensitivity at mRNA andRNC-mRNA, the proteomics data exhibit only half of the Chr.20genes detected at the protein level and much less for the peptideswith SNVs perceived. This is likely mainly resulting from thetechnique limitation of proteomics and the poor understandingof translation rate and protein stability.Our results regarding the SNVs related to liver cancer cell lines
are partially in agreement with other reports of cancer genomics.Importantly, we found that although as high as ∼80% of SNVscould be transmitted from mRNA to RNC-mRNA, the mutatedmRNAs bound to ribosome seems to not be translated tomutated proteins so efficiently, as only 12% of SNVs in RNC-mRNAwere verified at the protein level. We tend to attribute lowdetection of SNVs in peptides to the limitation of proteomicstechnique at current but not to a special process of biology. Oncethe peptide coverage per protein gets higher, the peptides withSNV signals are expected to dramatically augment. Even thoughthe SNV peptide detection is not so satisfied, our study doesprovide the first hand evidence in experiment that the SNVmessages are able to be delivered from mRNA to protein. Theprojects of cancer genomics have provided strong evidence withrespect to a huge number of somatic mutations in cancer tissuesand cells. An equitable hypothesis to these mutation mechanismscomes from mutations occurring within exomes, which couldchange the amino acid residues. Some changes in key residues offunctional domains may bring the protein to be activated orinactivated in cancer and lead to metabolic or signaling pathwaydistorted at all. The deduction was supported by numbers ofevidence from mRNA measurement but not from proteinvalidation, even with a few of experiments from Western blot.41
The data illustrated in Table 3 doubtlessly demonstrate that theSNVs in mRNA or RNC-mRNA are translated to the variationsin protein. Our study therefore offers a solid support to the hy-pothesis elicited from cancer genomics and reveals the trans-omics analysis as a feasible approach to explore the biomarkersrelated to cancer and metastasis based on the mutated residues.According to the transomics analysis of the Chr.20 gene in the
liver cancer cells, some genes with SNVs may be worth furtherinvestigation in cancer research, such as LAMA5 and DIDO-1.The protein product of LAMA5 is Laminin α5, which belongs tothe lamin family and was found to be collected in extracellularmatrix glycoproteins and noncollagenous components of base-ment membranes. Laminin α5 mainly combines with lamininβ and γ to form Laminin-511 (α5βγ) and Laminin-521 (α5β2γ).These proteins mediate cell-matrix adhesion and thereforeregulate migration, growth, proliferation, and differentiation ofvarious cell types, indicating the possible roles of these proteinsin cancer metastasis.42 Laminin-511 or Laminin-521 was notreported to be involved in carcinoma-related pathways; someother protein members of the LAMINS family, such as laminin-332 (α3β3γ2), were documented to mediate the invasion ofgastric carcinoma cells and improves the metastatic potentialof breast cancer cells.43−47 In our study, 13 SNV sites wereidentified by mRNA and RNC-mRNA, and 2 were confirmed byproteome. Moreover, the abundance of the proteins with SNVsin the cell lines of metastasis was different from that of thenonmetastasis cell lines. We thus hypothesize that LAMA5mutant is involved in liver cancer metastasis. It was reported thatthe overexpression of the protein of death-inducer obliteratorprotein 1 (DIDO-1) induced cell apoptosis,48 while the latest studyshows that DIDO-1 enhances expression of integrin V and
consequently promotes the attachment, migration, invasion, andapoptosis resistance of cancer cell.49 Here DIDO-1 was detected withthree mutation sites at either mRNA or RNC-mRNA, and one wasverified by proteome. Importantly, the increased abundance ofDIDO-1 mutant was perceived in metastatic liver cancer cell lines,which suggests that the role of mutated DIDO-1 is possibly to inhibitapoptosis and regulate the cell invasion ability.
■ CONCLUSIONS
From the transomics data of three liver cancer cell lines, ∼82%of Chr.20 genes are confirmed with expression signals, eithermRNA or protein, which provide us a reference of active Chr.20genes in such samples. Of these expressed genes, 136 weredetected with SNVs, and over 40% of the SNV sites aremetastatic cell specific ones, while 36% are nonmetastatic cell-specific ones, suggesting the possibility of these SNVs asmetastasis-related markers. Over 80% of the SNVs detected intranscriptome and translatome are overlapped, implying that theSNV information could be transmitted from transcripts totranslational mRNA efficiently. Furthermore, 20 SNV sites in 16genes were detected in proteomics data, with 6 sites validated byMRM approach, illustrating that the SNVs could be transmittedsequentially from mRNA to protein. The roles of some geneswith SNVs in metastasis pathways, such as DIDO and LAMA5,are valuable for further investigation. With the integration of thetransomics data, for the first time we provided evidence of SNVsat themRNA level and protein level, further providing a constructiveclue to discover metastasis-related marker genes on Chr.20.
■ ASSOCIATED CONTENT
*S Supporting Information
This work contains supplementary Table S1−S4 and Fig. S1−S6.Figure S1 and S2 show the molecular weight and hydrophobicityof proteins encoded by genes in each sub-region of Chr.20.Figure S3 is the sequence alignment of defensin protein familyusing CLUSTAL 2.1. Figure S4 exhibits the substitution types ofnucleic acids at all the mutation sites. Figure S5 lists the MS/MSspectra of all the identified mutated peptides, and Figure S6shows theMRM signals of additional validated mutated peptides.These materials are available free of charge via the Internet athttp://pubs.acs.org.
■ ACKNOWLEDGMENTSWe acknowledge the entire group of Chinese Human Chro-mosome Proteome Consortium, Guangdong Provincial Engi-neering Laboratory for Proteomics, and Shenzhen EngineeringLaboratory for Proteomics.This work is supported by grants from the 973 programs
(2010CB912700, 2011CB910700, 2012CB910600, and2013CB911200, 2013CB910802), Nature Science Foundationsof China (91131009, 31070673, 31170780, 31000379, and81372135), 863 projects (2012AA020200, 2011AA02A114, and2012AA020502), Shenzhen Municipal Government of China(20101749), Shenzhen Key Laboratory of Transomics Bio-technologies (No. CXB2011O8250096A), Key Projects in theNational Science & Technology Pillar Program (2012BAF14B00),and State Key Project Specialized for Infectious Diseases(2012ZX10002012−006).
■ REFERENCES(1) Jones, M. J.; Jallepalli, P. V. Chromothripsis: chromosomes in crisis.Dev. Cell 2012, 23 (5), 908−17.(2) Scotto, L.; Narayan, G.; Nandula, S. V.; Arias-Pulido, H.;Subramaniyam, S.; Schneider, A.; Kaufmann, A. M.; Wright, J. D.;Pothuri, B.; Mansukhani, M.; Murty, V. V. Identification of copy numbergain and overexpressed genes on chromosome arm 20q by an integrativegenomic approach in cervical cancer: potential role in progression.Genes, Chromosomes Cancer 2008, 47 (9), 755−65.(3) Buffart, T. E.; van Grieken, N. C.; Tijssen, M.; Coffa, J.; Ylstra, B.;Grabsch, H. I.; van de Velde, C. J.; Carvalho, B.; Meijer, G. A. Highresolution analysis of DNA copy-number aberrations of chromosomes8, 13, and 20 in gastric cancers. Virchows Arch. 2009, 455 (3), 213−23.(4) Davison, E. J.; Tarpey, P. S.; Fiegler, H.; Tomlinson, I. P.; Carter, N.P. Deletion at chromosome band 20p12.1 in colorectal cancer revealedby high resolution array comparative genomic hybridization. Genes,Chromosomes Cancer 2005, 44 (4), 384−91.(5) Deloukas, P.; Matthews, L. H.; Ashurst, J.; Burton, J.; Gilbert, J. G.;Jones, M.; Stavrides, G.; Almeida, J. P.; Babbage, A. K.; Bagguley, C. L.;Bailey, J.; Barlow, K. F.; Bates, K. N.; Beard, L. M.; Beare, D. M.; Beasley,O. P.; Bird, C. P.; Blakey, S. E.; Bridgeman, A. M.; Brown, A. J.; Buck, D.;Burrill, W.; Butler, A. P.; Carder, C.; Carter, N. P.; Chapman, J. C.;Clamp, M.; Clark, G.; Clark, L. N.; Clark, S. Y.; Clee, C. M.; Clegg, S.;Cobley, V. E.; Collier, R. E.; Connor, R.; Corby, N. R.; Coulson, A.;Coville, G. J.; Deadman, R.; Dhami, P.; Dunn, M.; Ellington, A. G.;Frankland, J. A.; Fraser, A.; French, L.; Garner, P.; Grafham, D. V.;Griffiths, C.; Griffiths, M. N.; Gwilliam, R.; Hall, R. E.; Hammond, S.;Harley, J. L.; Heath, P. D.; Ho, S.; Holden, J. L.; Howden, P. J.; Huckle,E.; Hunt, A. R.; Hunt, S. E.; Jekosch, K.; Johnson, C. M.; Johnson, D.;Kay, M. P.; Kimberley, A. M.; King, A.; Knights, A.; Laird, G. K.; Lawlor,S.; Lehvaslaiho, M. H.; Leversha, M.; Lloyd, C.; Lloyd, D. M.; Lovell, J.D.; Marsh, V. L.; Martin, S. L.; McConnachie, L. J.; McLay, K.;McMurray, A. A.; Milne, S.; Mistry, D.; Moore, M. J.; Mullikin, J. C.;Nickerson, T.; Oliver, K.; Parker, A.; Patel, R.; Pearce, T. A.; Peck, A. I.;Phillimore, B. J.; Prathalingam, S. R.; Plumb, R. W.; Ramsay, H.; Rice, C.M.; Ross, M. T.; Scott, C. E.; Sehra, H. K.; Shownkeen, R.; Sims, S.;Skuce, C. D.; Smith, M. L.; Soderlund, C.; Steward, C. A.; Sulston, J. E.;Swann, M.; Sycamore, N.; Taylor, R.; Tee, L.; Thomas, D. W.; Thorpe,A.; Tracey, A.; Tromans, A. C.; Vaudin, M.; Wall, M.; Wallis, J. M.;Whitehead, S. L.; Whittaker, P.; Willey, D. L.; Williams, L.; Williams, S.A.; Wilming, L.; Wray, P. W.; Hubbard, T.; Durbin, R. M.; Bentley, D.R.; Beck, S.; Rogers, J. The DNA sequence and comparative analysis ofhuman chromosome 20. Nature 2001, 414 (6866), 865−71.
(6) Karhu, R.; Mahlamaki, E.; Kallioniemi, A. Pancreatic adenocarci-noma – genetic portrait from chromosomes to microarrays. Genes,Chromosomes Cancer 2006, 45 (8), 721−30.(7) Hodgson, J. G.; Chin, K.; Collins, C.; Gray, J. W. Genomeamplification of chromosome 20 in breast cancer. Breast Cancer Res.Treat. 2003, 78 (3), 337−45.(8) Tabach, Y.; Kogan-Sakin, I.; Buganim, Y.; Solomon, H.; Goldfinger,N.; Hovland, R.; Ke, X. S.; Oyan, A. M.; Kalland, K. H.; Rotter, V.;Domany, E. Amplification of the 20q chromosomal arm occurs early intumorigenic transformation and may initiate cancer. PLoS One 2011, 6(1), e14632.(9) Ndegwa, N.; Cote, R. G.; Ovelleiro, D.; D’Eustachio, P.;Hermjakob, H.; Vizcaino, J. A.; Croft, D. Critical amino acid residuesin proteins: a BioMart integration of Reactome protein annotations withPRIDE mass spectrometry data and COSMIC somatic mutations.Database 2011, 2011, bar047.(10) Previati, M.; Manfrini, M.; Galasso, M.; Zerbinati, C.; Palatini, J.;Gasparini, P.; Volinia, S. Next generation analysis of breast cancergenomes for precision medicine. Cancer Lett. 2013, 339 (1), 1−7.(11) Wheeler, D. A.; Wang, L. From human genome to cancergenome: The first decade. Genome Res. 2013, 23 (7), 1054−62.(12) Makohon-Moore, A.; Brosnan, J. A.; Iacobuzio-Donahue, C. A.Pancreatic cancer genomics: insights and opportunities for clinicaltranslation. Genome Med. 2013, 5 (3), 26.(13) Garraway, L. A. Genomics-driven oncology: framework for anemerging paradigm. J. Clin. Oncol. 2013, 31 (15), 1806−14.(14) Grasso, C. S.; Wu, Y. M.; Robinson, D. R.; Cao, X.; Dhanasekaran,S. M.; Khan, A. P.; Quist, M. J.; Jing, X.; Lonigro, R. J.; Brenner, J. C.;Asangani, I. A.; Ateeq, B.; Chun, S. Y.; Siddiqui, J.; Sam, L.; Anstett, M.;Mehra, R.; Prensner, J. R.; Palanisamy, N.; Ryslik, G. A.; Vandin, F.;Raphael, B. J.; Kunju, L. P.; Rhodes, D. R.; Pienta, K. J.; Chinnaiyan, A.M.; Tomlins, S. A. The mutational landscape of lethal castration-resistant prostate cancer. Nature 2012, 487 (7406), 239−43.(15) Barbieri, C. E.; Bangma, C. H.; Bjartell, A.; Catto, J. W.; Culig, Z.;Gronberg, H.; Luo, J.; Visakorpi, T.; Rubin, M. A. The mutationallandscape of prostate cancer. Eur. Urol. 2013, 64 (4), 567−76.(16) Samuel, N.; Hudson, T. J. Translating genomics to the clinic:implications of cancer heterogeneity. Clin. Chem. 2013, 59 (1), 127−37.(17) Liu, L. Y.; Yang, T.; Ji, J.; Wen, Q.; Morgan, A. A.; Jin, B.; Chen,G.; Lyell, D. J.; Stevenson, D. K.; Ling, X. B.; Butte, A. J. Integratingmultiple ’omics’ analyses identifies serological protein biomarkers forpreeclampsia. BMC Med. 2013, 11 (1), 236.(18) Berghoff, B. A.; Konzer, A.; Mank, N. N.; Looso, M.; Rische, T.;Forstner, K. U.; Kruger, M.; Klug, G. Integrative ″omics″-approachdiscovers dynamic and regulatory features of bacterial stress responses.PLoS Genet. 2013, 9 (6), e1003576.(19) Pradet-Balade, B.; Boulme, F.; Beug, H.; Mullner, E. W.; Garcia-Sanz, J. A. Translation control: bridging the gap between genomics andproteomics? Trends Biochem. Sci. 2001, 26 (4), 225−9.(20) Wang, T.; Cui, Y.; Jin, J.; Guo, J.; Wang, G.; Yin, X.; He, Q. Y.;Zhang, G. Translating mRNAs strongly correlate to proteins in amultivariate manner and their translation ratios are phenotype specific.Nucleic Acids Res. 2013, 41 (9), 4743−54.(21) Legrain, P.; Aebersold, R.; Archakov, A.; Bairoch, A.; Bala, K.;Beretta, L.; Bergeron, J.; Borchers, C. H.; Corthals, G. L.; Costello, C. E.;Deutsch, E. W.; Domon, B.; Hancock, W.; He, F.; Hochstrasser, D.;Marko-Varga, G.; Salekdeh, G. H.; Sechi, S.; Snyder, M.; Srivastava, S.;Uhlen, M.; Wu, C. H.; Yamamoto, T.; Paik, Y. K.; Omenn, G. S. Thehuman proteome project: current state and future direction. Mol. Cell.Proteomics 2011, 10 (7), M111 009993.(22) Paik, Y. K.; Jeong, S. K.; Omenn, G. S.; Uhlen, M.; Hanash, S.;Cho, S. Y.; Lee, H. J.; Na, K.; Choi, E. Y.; Yan, F.; Zhang, F.; Zhang, Y.;Snyder, M.; Cheng, Y.; Chen, R.; Marko-Varga, G.; Deutsch, E.W.; Kim,H.; Kwon, J. Y.; Aebersold, R.; Bairoch, A.; Taylor, A. D.; Kim, K. Y.; Lee,E. Y.; Hochstrasser, D.; Legrain, P.; Hancock, W. S. The Chromosome-Centric Human Proteome Project for cataloging proteins encoded inthe genome. Nat. Biotechnol. 2012, 30 (3), 221−3.(23) Yang, T. P.; Lee, H. J.; Ou, T. T.; Chang, Y. J.; Wang, C. J.Mulberry Leaf Polyphenol Extract Induced Apoptosis Involving
Journal of Proteome Research Article
dx.doi.org/10.1021/pr400899b | J. Proteome Res. 2014, 13, 200−211210
Regulation of Adenosine Monophosphate-Activated Protein Kinase/Fatty Acid Synthase in a p53-Negative Hepatocellular Carcinoma Cell. J.Agric. Food Chem. 2012, 60 (27), 6891−6898.(24) Jiang, Y.; Zhou, X.; Chen, X.; Yang, G.; Wang, Q.; Rao, K.; Xiong,W.; Yuan, J. Benzo(a)pyrene-induced mitochondrial dysfunction andcell death in p53-null Hep3B cells. Mutat. Res. 2011, 726 (1), 75−83.(25) Li, Y.; Tian, B.; Yang, J.; Zhao, L.; Wu, X.; Ye, S. L.; Liu, Y. K.;Tang, Z. Y. Stepwise metastatic human hepatocellular carcinoma cellmodel system with multiple metastatic potentials established throughconsecutive in vivo selection and studies on metastatic characteristics. J.Cancer Res. Clin. Oncol. 2004, 130 (8), 460−8.(26) Zhang, G.; Fedyunin, I.; Kirchner, S.; Xiao, C.; Valleriani, A.;Ignatova, Z. FANSe: an accurate algorithm for quantitative mapping oflarge scale sequencing reads. Nucleic Acids Res. 2012, 40 (11), e83.(27) Trapnell, C.; Pachter, L.; Salzberg, S. L. TopHat: discoveringsplice junctions with RNA-Seq. Bioinformatics 2009, 25 (9), 1105−11.(28) Li, H.; Handsaker, B.; Wysoker, A.; Fennell, T.; Ruan, J.; Homer,N.; Marth, G.; Abecasis, G.; Durbin, R. The Sequence Alignment/Mapformat and SAMtools. Bioinformatics 2009, 25 (16), 2078−9.(29) Wang, K.; Li, M.; Hakonarson, H. ANNOVAR: functionalannotation of genetic variants from high-throughput sequencing data.Nucleic Acids Res. 2010, 38 (16), e164.(30) Mortazavi, A.; Williams, B. A.; McCue, K.; Schaeffer, L.; Wold, B.Mapping and quantifying mammalian transcriptomes by RNA-Seq.Nat.Methods 2008, 5 (7), 621−8.(31) Robinson, M. D.; McCarthy, D. J.; Smyth, G. K. edgeR: aBioconductor package for differential expression analysis of digital geneexpression data. Bioinformatics 2010, 26 (1), 139−40.(32) Kessner, D.; Chambers, M.; Burke, R.; Agus, D.; Mallick, P.ProteoWizard: open source software for rapid proteomics toolsdevelopment. Bioinformatics 2008, 24 (21), 2534−6.(33)Wu, S.; Li, N.; Ma, J.; Shen, H.; Jiang, D.; Chang, C.; Zhang, C.; Li,L.; Zhang, H.; Jiang, J.; Xu, Z.; Ping, L.; Chen, T.; Zhang, W.; Zhang, T.;Xing, X.; Yi, T.; Li, Y.; Fan, F.; Li, X.; Zhong, F.; Wang, Q.; Zhang, Y.;Wen, B.; Yan, G.; Lin, L.; Yao, J.; Lin, Z.; Wu, F.; Xie, L.; Yu, H.; Liu, M.;Lu, H.; Mu, H.; Li, D.; Zhu, W.; Zhen, B.; Qian, X.; Qin, J.; Liu, S.; Yang,P.; Zhu, Y.; Xu, P.; He, F. First proteomic exploration of protein-encoding genes on chromosome 1 in human liver, stomach, and colon. J.Proteome Res. 2013, 12 (1), 67−80.(34) Wang, Q.; Wen, B.; Yan, G.; Wei, J.; Xie, L.; Xu, S.; Jiang, D.;Wang, T.; Lin, L.; Zi, J.; Zhang, J.; Zhou, R.; Zhao, H.; Ren, Z.; Qu, N.;Lou, X.; Sun, H.; Du, C.; Chen, C.; Zhang, S.; Tan, F.; Xian, Y.; Gao, Z.;He, M.; Chen, L.; Zhao, X.; Xu, P.; Zhu, Y.; Yin, X.; Shen, H.; Zhang, Y.;Jiang, J.; Zhang, C.; Li, L.; Chang, C.; Ma, J.; Yao, J.; Lu, H.; Ying, W.;Zhong, F.; He, Q. Y.; Liu, S. Qualitative and quantitative expressionstatus of the human chromosome 20 genes in cancer tissues and therepresentative cell lines. J. Proteome Res. 2013, 12 (1), 151−61.(35) Wang, Q.; Wen, B.; Yan, G.; Wei, J.; Xie, L.; Xu, S.; Jiang, D.;Wang, T.; Lin, L.; Zi, J.; Zhang, J.; Zhou, R.; Zhao, H.; Ren, Z.; Qu, N.;Lou, X.; Sun, H.; Du, C.; Chen, C.; Zhang, S.; Tan, F.; Xian, Y.; Gao, Z.;He, M.; Chen, L.; Zhao, X.; Xu, P.; Zhu, Y.; Yin, X.; Shen, H.; Zhang, Y.;Jiang, J.; Zhang, C.; Li, L.; Chang, C.; Ma, J.; Yan, G.; Yao, J.; Lu, H.;Ying, W.; Zhong, F.; He, Q. Y.; Liu, S. Qualitative and quantitativeexpression status of the human chromosome 20 genes in cancer tissuesand the representative cell lines. J. Proteome Res. 2013, 12 (1), 151−61.(36)Winter, J.; Pantelis, A.; Kraus, D.; Reckenbeil, J.; Reich, R.; Jepsen,S.; Fischer, H. P.; Allam, J. P.; Novak, N.;Wenghoefer, M. Human alpha-defensin (DEFA) gene expression helps to characterise benign andmalignant salivary gland tumours. BMC Cancer 2012, 12, 465.(37) Gerashchenko, O. L.; Zhuravel, E. V.; Skachkova, O. V.;Khranovska, N. N.; Filonenko, V. V.; Pogrebnoy, P. V.; Soldatkina, M.A. Biologic activities of recombinant human-beta-defensin-4 towardcultured human cancer cells. Exp Oncol 2013, 35 (2), 76−82.(38) Li, D.; Wang, W.; Shi, H.; Fu, Y. J.; Chen, X.; Chen, X.; Liu, Y. T.;Kan, B.; Wang, Y. Gene therapy with beta defensin-2 induces anti-tumorimmunity and enhances local anti-tumor effects.Hum. Gene Ther. 2013,DOI: 10.1089/hum.2013.161.(39) Sun, C. Q.; Arnold, R.; Fernandez-Golarz, C.; Parrish, A. B.;Almekinder, T.; He, J.; Ho, S. M.; Svoboda, P.; Pohl, J.; Marshall, F. F.;
Petros, J. A. Human beta-defensin-1, a potential chromosome 8p tumorsuppressor: control of transcription and induction of apoptosis in renalcell carcinoma. Cancer Res. 2006, 66 (17), 8542−9.(40) Donald, C. D.; Sun, C. Q.; Lim, S. D.; Macoska, J.; Cohen, C.;Amin, M. B.; Young, A. N.; Ganz, T. A.; Marshall, F. F.; Petros, J. A.Cancer-specific loss of beta-defensin 1 in renal and prostatic carcinomas.Lab. Invest. 2003, 83 (4), 501−5.(41) Yoshida, K.; Sanada, M.; Ogawa, S. Deep sequencing in cancerresearch. Jpn. J. Clin. Oncol. 2013, 43 (2), 110−5.(42) Mittag, F.; Falkenberg, E. M.; Janczyk, A.; Gotze, M.; Felka, T.;Aicher, W. K.; Kluba, T. Laminin-5 and type I collagen promoteadhesion and osteogenic differentiation of animal serum-free expandedhuman mesenchymal stromal cells. Orthop. Res. Rev. 2012, 4 (4), e36.(43) Imura, J.; Uchida, Y.; Nomoto, K.; Ichikawa, K.; Tomita, S.; Iijima,T.; Fujimori, T. Laminin-5 is a biomarker of invasiveness in cervicaladenocarcinoma. Diagn. Pathol. 2012, 7, 105.(44) An, S. J.; Lin, Q. X.; Chen, Z. H.; Su, J.; Cheng, H.; Xie, Z.; Zhang,X. C.; Zhou, H. Y.; Huang, Y.; Chen, S. L.; Guo, W. B.; Wu, Y. L.Combinations of laminin 5 with PTEN, p-EGFR and p-Akt define agroup of distinct molecular subsets indicative of poor prognosis inpatients with non-small cell lung cancer. Exp. Ther. Med. 2012, 4 (2),226−230.(45) Hamasaki, H.; Koga, K.; Aoki, M.; Hamasaki, M.; Koshikawa, N.;Seiki, M.; Iwasaki, H.; Nakayama, J.; Nabeshima, K. Expression oflaminin 5-gamma2 chain in cutaneous squamous cell carcinoma and itsrole in tumour invasion. Br. J. Cancer 2011, 105 (6), 824−32.(46) Santamato, A.; Fransvea, E.; Dituri, F.; Caligiuri, A.; Quaranta, M.;Niimi, T.; Pinzani, M.; Antonaci, S.; Giannelli, G. Hepatic stellate cellsstimulate HCC cell migration via laminin-5 production. Clin. Sci. 2011,121 (4), 159−68.(47) Carpenter, P. M.; Dao, A. V.; Arain, Z. S.; Chang, M. K.; Nguyen,H. P.; Arain, S.; Wang-Rodriguez, J.; Kwon, S. Y.; Wilczynski, S. P.Motility induction in breast carcinoma by mammary epithelial laminin332 (laminin 5). Mol. Cancer Res. 2009, 7 (4), 462−75.(48) Rojas, A. M.; Sanchez-Pulido, L.; Futterer, A.; van Wely, K. H.;Martinez, A. C.; Valencia, A. Death inducer obliterator protein 1 in thecontext of DNA regulation. Sequence analyses of distant homologuespoint to a novel functional role. FEBS J. 2005, 272 (14), 3505−11.(49) Braig, S.; Bosserhoff, A. K. Death inducer-obliterator 1 (Dido1) isa BMP target gene and promotes BMP-induced melanoma progression.Oncogene 2013, 32 (7), 837−48.
Journal of Proteome Research Article
dx.doi.org/10.1021/pr400899b | J. Proteome Res. 2014, 13, 200−211211