36
Return on Investment for the Entertainment Industry Incentive Programs Submitted: January 2021

Return on Investment for the Entertainment Industry Incentive Programs
Submitted: January 2021

TableofContents
EXECUTIVE SUMMARY AND COMPARATIVE ANALYSIS ................................................................................. 1
OVERVIEW OF THE ENTERTAINMENT INDUSTRY FINANCIAL INCENTIVE AND SALES TAX EXEMPTION PROGRAMS ................................................................................................................................................... 5
METHODOLOGY ............................................................................................................................................ 9
KEY ASSUMPTIONS ...................................................................................................................................... 14
KEY TERMS .................................................................................................................................................. 16
ANALYSIS AND FINDINGS ............................................................................................................................ 17
APPENDIX: Recent Research Regarding State Film and Entertainment Incentive Programs ..................... 23

1
EXECUTIVESUMMARYANDCOMPARATIVEANALYSIS Background and Purpose Legislation enacted in 2013 and revised in 2014 directs the Office of Economic and Demographic Research (EDR) and the Office of Program Policy Analysis and Government Accountability (OPPAGA) to analyze and evaluate specific state economic development incentive programs on a recurring three‐year schedule.1 EDR is required to evaluate the economic benefits of each program, using project data from the most recent three‐year period, and to provide an explanation of the model used in its analysis and the model’s key assumptions. Economic Benefit is defined as “the direct, indirect, and induced gains in state revenues as a percentage of the state’s investment” – which includes “state grants, tax exemptions, tax refunds, tax credits, and other state incentives.”2 EDR’s evaluation also requires identification of jobs created, the increase or decrease in personal income, and the impact on state Gross Domestic Product (GDP) for each program. This is EDR’s third evaluation of the entertainment industry incentive programs.3 Two specific programs are addressed by this analysis:
Florida Entertainment Industry Financial Incentive (tax credit) Program, and
Florida Entertainment Industry Sales Tax Exemption Program.
The review period covers Fiscal Years 2016‐17, 2017‐18, and 2018‐19. Explanation of Return on Investment In this report, the term “Return on Investment” (ROI) is synonymous with economic benefit, and is used in lieu of the statutory term. This measure does not address issues of overall effectiveness or societal benefit; instead, it focuses on tangible financial gains or losses to state revenues, and is ultimately conditioned by the state’s tax policy. The ROI is developed by summing state revenues generated by a program less state expenditures invested in the program, and dividing that calculation by the state’s investment. It is most often used when a project is to be evaluated strictly on a monetary basis, and externalities and social costs and benefits—to the extent they exist—are excluded from the evaluation. The basic formula is:
(Increase in State Revenue – State Investment)
State Investment Since EDR’s Statewide Model4 is used to develop these computations and to model the induced and indirect effects, EDR is able to simultaneously generate State Revenue and State Investment from the model so all feedback effects mirror reality. The result (a net number) is used in the final ROI calculation.
1Section 288.0001, F.S. As of 2020, twenty programs are specified. 2Section 288.005(1), F.S. 3 The previous reports and several presentations related to the findings of the first report can be found at EDR’s website: http://edr.state.fl.us/Content/returnoninvestment/ 4 See the Methodology section for a description of the Statewide Model.

2
As used by EDR for this analysis, the returns can be categorized as follows:
Greater Than One (>1.0)…the program more than breaks even; the return to the state produces more revenues than the total cost of the investment.
Equal To One (=1.0)…the program breaks even; the return to the state in additional revenues equals the total cost of the investment.
Less Than One, But Positive (+, <1)…the program does not break even; however, the state generates enough revenues to recover a portion of its cost of the investment.
Less Than Zero (‐, <0)…the program does not recover any portion of the investment cost, and state revenues are less than they would have been in the absence of the program. This typically occurs because taxable activity is shifted to non‐taxable activity.
The numerical ROI can be interpreted as return in tax revenues for each dollar spent by the state. For example, a ROI of 2.5 would mean that $2.50 in tax revenues is received back from each dollar spent by the state. The basic formula for ROI is always calculated in the same manner, but the inputs used in the calculation can differ depending on the needs of the investor. Florida law requires the return to be measured from the state’s perspective as the investor, in the form of state tax revenues. In this regard, the ROI is ultimately shaped by the state’s tax code. Programs under Evaluation The Florida Entertainment Industry Financial Incentive Program began July 1, 2010 and expired June 30, 2016. During its operational existence, the program was administered by the Office of Film and Entertainment (OFE).5 The incentives took the form of tax credits that were based on qualified Florida expenditures related to film and digital media production (motion pictures, commercials, music videos, industrial or educational films, infomercials, documentary films, television series, and digital media projects). At the end of the program, a total statutory cap of $296 million in credits had been authorized by the Legislature. Those credits were available to defray either sales and use tax or corporate income tax liabilities, whether incurred by the certified production company or a third‐party transferee. Up to 30 percent of qualified purchases were eligible for the tax credit. Qualifying expenditures included production costs for goods or services purchased or leased from Florida vendors and salary and wages paid to Florida residents. The credits were allocated on a first‐come, first‐serve basis to certified production companies. While the program expired in 2016, OFE was authorized to award any remaining tax credits to productions that were certified for a credit allocation before the expiration date. In contrast, the Florida Entertainment Industry Sales Tax Exemption Program provides an ongoing tax exemption. Under this program, qualified purchases made by production companies for motion pictures, made‐for‐television motion pictures, television series, commercials, music videos or sound recordings are eligible for sales and use tax exemptions.6 The exemption program is administered by OFE and allows businesses to apply for 12‐month or 90‐day exemption certificates. An estimated $46.3 million in state sales tax was exempted during the review period.
5 Section 288.1254, F.S. 6 Section 288.1258, F.S

3
Overall Results and Conclusions The Florida Entertainment Industry Financial Incentive Program (tax credit) generated a positive ROI of 0.07 during the review period. This compares to the ROI of 0.18 found in the 2018 report and the ROI of 0.25 found in the 2015 report. [See Table below.] The ROI was determined by calculating the tax revenues actually received from the film and digital media projects that were awarded credits during the review period. Offsetting most of these tax revenues was the loss of tax receipts that would have been collected had the State made the same investment in the general market basket of goods, instead of offering tax credits.
Other factors also affected this return on investment. They include:
The assumption that all projects met the “but for” requirement;
The lack of a requirement for capital investment; and
Participation in the sales tax exemption program. The tax credit program did not condition the receipt of the incentive on a certification of the project’s dependence on the credit to commence. Further, there was no analysis of whether another Florida business, or for that matter a non‐Florida business, would have undertaken a similar project without the incentive. This prospect is doubtful with respect to feature films, but possible for digital media, video games, TV productions, commercial films, and sound recording projects. The Florida Entertainment Industry Sales Tax Exemption Program (tax exemption) generated a positive ROI of 0.49 during the review period. This compares to the ROI of 0.58 found in the 2018 report and the ROI of 0.54 found in the 2015 report. [See Table below.] The ROI was determined by calculating the tax revenues actually received from the production receiving the exemption. Offsetting a portion of these tax revenues was the loss of tax receipts that would have been collected had the State made the same investment in the general market basket of goods, instead of offering the exemption.
Other factors also affected this return on investment. They include:
The determination that some projects did not meet the “but for” requirement;
The lack of a requirement for capital investment; and
Participation in the tax credit program. As noted above, neither of these programs specifically require an applicant to certify that the subsidized activity would not have occurred in the absence of the incentives or tax exemptions. EDR assumes that the “but for” assumption holds in all cases for the tax credit program, but only in some cases for the sales tax exemption program. In practice, the only sales tax exemption projects excluded were the handful that clearly failed the test. Because the appraisal leading to a positive “but for” finding was
2021 Report 2018 Report 2015 Report
0.07 0.18 0.43
Florida Entertainment Industry Financial
Incentive Program (Tax Credit)
2021 Report 2018 Report 2015 ReportFlorida Entertainment Industry Sales Tax
Exemption Program (Tax Exemption) 0.49 0.58 0.54

4
liberally applied, the reported ROI for each program would best be viewed as the upper bound for the “true” ROI of these programs. This caveat also holds for the broader economic measures of output, state gross domestic product (GDP), state personal income and employment that are included later in the analysis. Finally, the tax credit program analysis does not address the deadweight loss associated with transfers of credits achieved by using discounted face values. This inflates the state’s cost of the program relative to a pure grant program designed to accomplish the same purpose. In comparison, the theoretical grant program would be more efficient from an allocative and budgetary perspective, benefitting only the intended recipients by the amounts they actually need and, thereby, producing a more precise ROI.7
7 A discussion of tax credit transferability can be found in EDR’s 2015 report, Return on Investment for the Entertainment Industry Incentive Programs http://edr.state.fl.us/Content/returnoninvestment/EntertainmentIndustryIncentivePrograms.pdf

5
OVERVIEWOFTHEENTERTAINMENTINDUSTRYFINANCIALINCENTIVEANDSALESTAXEXEMPTIONPROGRAMS
Background and Purpose Florida offers financial incentives to encourage the in‐state production of films; television programs; other motion picture products such as commercials and music videos; and digital media projects such as interactive games, digital animation and visual effects. Florida’s share of nationwide production has fluctuated over the years. The extent to which this variation is caused by the differing incentives available from states is contested in the literature, but that there is some degree of influence is generally accepted. The Office of Film and Entertainment (OFE) is responsible for developing, marketing, promoting and providing services to the state’s entertainment industry. The Florida Film and Entertainment Advisory Council assists OFE with ongoing revisions to the OFE’s strategic plan and provides the Department of Economic Opportunity (DEO) and OFE with “industry insight and expertise.”8 OFE and the Department of Revenue (DOR) are responsible for administering the two entertainment incentive programs offered by the state: the Entertainment Industry Financial Incentive (tax credit) and the Entertainment Industry Sales Tax Exemption (tax exemption) programs. Entertainment Industry Financial Incentive Program The Legislature developed the Entertainment Industry Financial Incentive (tax credit) Program to encourage the use of Florida “as a site for filming, for the digital production of films, and to develop and sustain the workforce and infrastructure for film, digital media, and entertainment production.”9 The program was administered by OFE, subject to DEO policies and oversight. To accomplish its objective, tax credits were provided for qualified expenditures related to filming and media production activities in Florida. The program began on July 1, 2010 and expired June 30, 2016. Prior to the transferable tax credit program’s creation, the state provided cash grants that were subject to appropriation.10 Part of the rationale for the Legislature’s redesign was to provide greater funding stability by using the state’s tax code rather than the annual appropriations process. Operatively, the tax credit was used to offset liability for the sales and use tax and corporate income tax.11 The tax credits provided a reduction in taxes due, after verification that statutory and contractual terms had been met. However, in those instances where the direct recipients had no or insignificant tax obligations, they would have been unable to benefit from the credits. To overcome this potential limitation, incentive recipients had the option to monetize the credits by selling them to an entity that had a tax obligation, either directly or through an intermediary (tax 8 Section 288.1251 and 288.1252(2), F.S. 9 Section 288.1254(2), F.S. 10 s. 2, ch. 2003‐81, L.O.F. Referred to as a refund, the cash grant program received its first legislative appropriation in FY 2004‐2005, in the amount of $2.45 million. The program received appropriations of $10 million in FY 2005‐2006; $20 million in FY 2006‐2007; $25 million in FY 2007‐2008; $5 million in FY 2008‐2009; and $10.8 million in FY 2009‐2010. The term “refund” was somewhat of a misnomer. The awards were based on certain qualified expenditures, not the amount of state taxes a production entity paid while in Florida. 11 s. 28, ch. 2010‐147, L.O.F.

6
broker), typically at a discount. The statutes also authorized the transfer of the credit back to the state for 90 percent of its face value; 12 however, this option was infeasible in practice as no state funds were appropriated for this purpose. Annual credit caps were initially set over five years, from FY 2010‐11 through FY 2014‐15, for a total of $242 million. In 2011, the Legislature increased the total to $254 million.13 In 2012, the program was extended through FY 2015‐16 and an additional $42 million in credits were authorized, for a total of $296 million over the six‐year period.14 OFE has since reported that all of the available credits were certified (or allocated to certified productions) and awarded. Qualified expenditures included production expenditures incurred by a qualified production in Florida for:
Goods purchased or leased from, or services provided by, a vendor or supplier in Florida that is registered with the Department of State (DOS) or the Department of Revenue (DOR) and is doing business in Florida. (This does not include re‐billed goods or services provided by an in‐state company from out‐of‐state vendors or suppliers.) Eligible production goods and services include:
o Sound stages, back lots, production editing, digital effects, sound recordings, sets, and set construction;
o Entertainment‐related rental equipment, including cameras and grip or electrical equipment;
o Newly purchased computer software and hardware, up to $300,000; and o Meals, travel, and accommodations.
Salary, wages, or other compensation paid to Florida residents, up to a maximum of $400,000 per resident.
Types of productions eligible for tax credits were: motion pictures; commercials; music videos; industrial or educational films; infomercials; documentary films; television series, and digital media projects (interactive games, digital animation and visual effects). Initially, three percent of the authorized tax credits were reserved for music videos, and three percent were reserved for independent and emerging media. Awards were limited to productions within 180 days of project start dates. Awards could not be granted after the productions had begun, and were capped at $8 million per project. The Entertainment Industry Sales Tax Exemption Program The Entertainment Industry Sales Tax Exemption (tax exemption) Program is available to “any production company engaged in this state in the production of motion pictures, made‐for‐TV motion pictures, television series, commercial advertising, music videos, or sound recordings…”15 This program offers sales and use tax exemptions on:
Fabrication labor used in set design and construction for qualified motion pictures;16
12 s. 288.1254(6)(a), F.S. 13 s. 26, ch. 2011‐76. L.O.F. 14 s. 15, ch. 2012‐32. L.O.F. 15 Section 288.1258, F.S. This program was initially intended as “an incentive both to recruit film production businesses to bring their work to Florida and to retain such businesses in the state.” 16 Enacted in 1969, s. 212.06(1)(b), F.S.

7
Motion picture or video equipment and sound recording equipment that is purchased or leased for use in this state for certain entertainment production activities;17
Sales of master tapes, records, films, or video tapes;18 and Leases or rentals of real property used as an integral part of the performance of qualified
motion picture production services.19
According to a Senate Staff Analysis, the Legislature authorized qualified production companies to obtain certificates of exemption in 2000, which allowed the companies to benefit from the exemptions without having to pay tax at the point of sale.20 Prior to this change, beneficiaries had to seek reimbursement of previously paid taxes. A qualified production company seeking a certificate has to submit an application to DOR to be approved by OFE. If the company has operated a business in Florida at a permanent address for at least 12 consecutive months, it is eligible for designation as a qualified production company and a one‐year certificate of exemption. A company that does not qualify for the one‐year certificate, including an out‐of‐state company, is eligible for a 90‐day certificate of exemption.
Applications include an estimate of the planned purchases of exempt items. Using information from these applications, OFE produces an annual estimate of the value of the exemptions to qualified production companies, both in‐state and out‐of‐state. OFE has estimated that all qualified production companies received $46.3 million in exemptions between FY 2016‐17 and FY 2018‐19. However, unlike the tax credit program, production companies are not required to validate actual purchases. The sales tax exemption is also available to qualified production companies receiving tax credits. Based on the qualified expenditures for that subset of companies, they may have received as much as $8.9 million in exemptions between FY 2016‐17 and FY 2018‐19. Florida Local Incentive Programs At least ten Florida counties and municipalities offer their own film and entertainment production incentives.21 The purpose of these programs is generally to expand employment opportunities in the film industry, encourage the purchase of local goods and services, and promote the respective locales as tourist destinations. These programs include the following:
17 Enacted in 1983 as a refund, changed to an exemption in 1984, s. 212.08(5)(f), F.S. Property must be used exclusively as an integral part of the production activity in this state. The equipment must be depreciable with a useful life of at least 3 years. The exemption may also be extended to parts and accessories for qualified production equipment. Includes bull horns, cameras (and cables and connectors), software, dollies, lighting, sets, tents, video recorders, sound equipment, generators and wardrobes. Does not include make‐up, meals, records, travel, vehicles, audio and video tapes, or film or location fees. http://dor.myflorida.com/dor/taxes/film_in_florida.html 18 Enacted in 1984, s. 212.08(12), F.S. The sale or lease of master tapes or master records that are used by the recording industry in reproducing audio recordings are taxable only on the value of the blank tapes or records used as a medium to transfer the master tapes or records. Likewise, the sale or lease of master films and master video tapes that are used in reproducing visual images for showing on screens or television is taxable only on the value of the blank film or tape used as a medium to transfer the master films and tapes. The value of all the major cost components of making a master, such as artistic services, processing, and copyrights or royalties, is excluded from the taxable price of the sale or lease. This tax treatment is limited to sales or leases by a recording studio to the recording industry or by a motion picture or television studio to the motion picture or television production industry. http://dor.myflorida.com/dor/taxes/film_in_florida.html 19 Enacted in 1987, s. 212.031(1)(a)9, F.S. 20 https://www.flsenate.gov/Session/Bill/2010/1752/Analyses/20101752SWPSC_2010s1752.wpsc.pdf 21 https://filmflorida.org/state‐resources/ Also see https://wusfnews.wusf.usf.edu/post/lights‐camera‐incentives‐florida‐counties‐sweeten‐pot‐filmmakers

8
Miami‐Dade County has a grant a program that provides $100,000 to qualified productions that spend at least $1 million in Miami‐Dade, if no less than forty Miami‐Dade County residents are hired as principal cast and crew members and at least 70 percent of hired vendors and contractors are county registered businesses. For productions spending between $500,000 and $1 million, a grant of up to $50,000 is available provided no less than 20 Miami‐Dade County residents are hired as principal cast and crew members and at least 70 percent of hired vendors and contractors are county registered businesses.
The city of North Miami reimburses 30 percent of production expenditures between $10,000 and $50,000 that are incurred while filming within the North Miami Community Redevelopment Agency boundary.
The city of Miami Beach offers up to nine grants of $10,000 for productions spending $25,000 in the city. In a related program, the Miami Beach Visitor and Convention Authority reimburses 25 percent of production expenditures, up to $50,000, for projects spending at least $100,000 and using no less than 200 hotel nights in Miami Beach.
Hillsborough County offers a rebate of up to 10 percent (capped at $500,000) on qualified expenditures within the county in excess of $100,000.
Duval County offers a 10 percent rebate for productions spending at least $50,000 in qualified local expenditures, provided county residents are employed in the project. The program is available to one project per year.
Palm Beach County offers discounts to productions using the G‐Star School of the Arts motion picture sound stage, provided student interns are used on set.
Sarasota County provides a refund of up to 100 percent of the fees paid to the county government for production services and up to 20 percent of qualified production and post‐production expenditures and municipal fees.
The Film St. Pete/Clearwater’s Business Development Marketing Program offers a rebate of up to 10 percent, uncapped, on qualified expenditures in Pinellas County, provided the production participates with the program in tourism marketing.
The Greater Fort Lauderdale/Broward County Office of Film and Entertainment provides a rebate for qualified production expenditures of up to $500,000.22
22 https://www.sunny.org/film‐music‐fashion‐and‐create/industry/incentives‐and‐deals/

9
METHODOLOGY Statewide Model EDR is tasked with evaluating the economic benefits of economic development incentive programs. Economic Benefit is defined as “the direct, indirect, and induced gains in state revenues as a percentage of the state’s investment” – which includes “state grants, tax exemptions, tax refunds, tax credits, and other state incentives.”23 This measure does not address issues of overall effectiveness or societal benefit; instead, it focuses on tangible financial gains or losses to state revenues, and is ultimately conditioned by the state’s tax policy. EDR used the Statewide Model to estimate the Return on Investment for the programs under review. The Statewide Model is a dynamic computable general equilibrium (CGE) model that simulates Florida’s economy and government finances.24 The Statewide Model is enhanced and adjusted each year to reliably and accurately model Florida’s economy. These enhancements include updating the base year the model uses as well as adjustments to how the model estimates tax collections and distributions.25 Among other things, the Statewide Model captures the indirect and induced economic activity resulting from the direct program effects. This is accomplished by using large amounts of data specific to the Florida economy and fiscal structure. Mathematical equations26 are used to account for the relationships (linkages and interactions) between the various economic agents, as well as likely responses by businesses and households to changes in the economy.27 The model also has the ability to estimate the impact of economic changes on state revenue collections and state expenditures in order to maintain a balanced budget by fiscal year. When using the Statewide Model to evaluate economic programs, the model is “shocked”28 using static analysis to develop the initial or direct effects attributable to the projects funded by the incentives. In this analysis, direct effects are essentially the changes experienced by the businesses receiving the grants. Generally, the combined annual direct effects (“shocks”) took the form of:
Removal of the incentive payments from the state budget, with corresponding awards to businesses as subsidies to production.
Inclusion of capital investments or residual capital benefits related to the projects.
Increased outputs based on retained and created jobs attributed to the projects.
After the direct effects are developed and estimated, the model is then used to estimate the additional—indirect and induced—economic effects generated by the programs, as well as the supply‐
23 Section 288.0001, F.S., as created by s. 1, ch. 2013‐39, Laws of Florida, and s. 1, ch. 2013‐42, Laws of Florida. 24 The statewide economic model was developed using GEMPACK software with the assistance of the Centre of Policy Studies (CoPS) at Victoria University (Melbourne, Australia). 25 Reports prior to January 1, 2017 have 2009 as the base year. Reports as of January 1, 2017 have 2011 as the base year. 26 These equations represent the behavioral responses to economic stimuli, as well as changes in economic variables. 27 The business reactions simulate the supply‐side responses to the new activity (e.g., changes in investment and the demand for labor). 28 In economics, a shock typically refers to an unexpected or unpredictable event that affects the economy, either positive or negative. In this regard, a shock refers to some action that affects the current equilibrium or baseline path of the economy. It can be something that affects demand, such as a shift in the export demand equation; or, it could be something that affects the price of a commodity or factor of production, such as a change in tax rates. In the current analyses, a counter‐factual shock is introduced to remove the impact of the incentives on the economy.

10
side responses to the new activity, where the supply‐side responses are changes in investment and the demand for labor arising from the new activity. Indirect effects are the changes in employment, income, and output by local supplier industries that provide goods and services to support the direct economic activity. Induced effects are the changes in spending by households whose income is affected by the direct and indirect activity. All of these effects can be measured by changes (relative to the baseline) in the following outcomes:
State government revenues and expenditures;
Jobs;
Personal income;
Florida Gross Domestic Product;
Gross output;
Household consumption;
Investment; and
Population. EDR’s calculation of the return on investment uses the model’s estimate of net state revenues and expenditures. Other required measures for this report include the number of jobs created, the increase or decrease in personal income, and the impact on gross domestic product, all of which are included in the model results. Evaluation Considerations As with previous evaluations, EDR’s calculation of ROI is based on the net economic impact rather than the gross economic activity generated by or attributed to program projects. The impact is due to new economic activity induced by a state subsidy after taking account of what would have occurred in the absence of this particular investment. EDR employs a number of approaches to isolate the new economic activity, including an assessment of the “but‐for” assertion and culling “Market and Resource Dependent” projects.29 The resultant net economic benefit may then be proportionately attributed to all project contributors (in this case, the tax credits and the value of the tax exemptions). Culling “Market and Resource Dependent” projects and proportionally attributing the economic benefit are two of the strategies used to derive a credible estimate of each program’s return to the state. Another consideration is the potential economic impact of “Film Induced Tourism” (FIT), which describes the phenomenon of film and television viewers visiting the specific places or regions where filming occurred or is depicted in the film. Images of and positive associations with locales as presented in films and television programs are argued to be useful promotional devices, valuable advertisements and effective marketing tools for the region.
29 If a business’ customers or clients are primarily based in Florida or the business is dependent on Florida resources to produce its products or services, the business is considered to be “market or resource dependent.” Any new activity induced by the incentives simply displaces other employment and economic activity that would have occurred in the absence of the incentive. There is no net economic expansion, as one of two events occurs: (1) existing businesses shed jobs as their market share decreases; or, (2) a competitor that would have filled the same vacuum without receiving an incentive is displaced. In these cases, neither economic benefits nor a return to the state should be assigned to the projects. In contrast, a business is not considered market or resource dependent if it is likely that it exports a majority of its goods and services out of the state.

11
EDR’s 2015 “Literature Review Regarding the Impact of State Film and Related Entertainment Incentive Programs” addressed independent research evaluating FIT and the reservations of independent analysts regarding proponent studies.30 The Review concluded the following:
“As for the potential to recover state program costs through film‐induced tourism, many independent analysts are skeptical, concluding the economic benefits are largely unsubstantiated and likely overstated. However, they do acknowledge that to the extent that state subsidies result in a significant number of popular productions where the physical site is a prominent feature favorably shown, is an essential “character” or component of the show, or the productions popularize new or emerging site‐specific activities, and visiting the physical site is the primary reason for out‐of‐state travel, then film‐induced tourism may have quantifiable economic and fiscal benefits sufficient to fund, to some extent, film subsidies. While there may be individual prominent exceptions, on the whole most productions fail to satisfy these criteria, and state programs do not generate enough of the exceptions to support the public subsidies.
Further, EDR’s 2015 analysis of the tax credit program cited a 2015 survey of Florida’s destination marketing organizations revealing they do not “believe filmed locations impacted tourists’ decisions” and the “substantial marketing efforts made by governmental and private sources” outweighed the state’s investment in the film and television incentives.31 A 2018 update of this survey identified no tourism activity that was primarily attributable to television or films. Description of the Data: Tax Credit Program The Office of Film and Entertainment (OFE), Department of Economic Opportunity (DEO) and the Department of Revenue (DOR) were the primary sources of data for the review. These agencies provided EDR with information for each project or business that received state dollars during Fiscal Years 2016‐17, 2017‐18 and 2018‐19. For the purpose of this analysis, the term “award” refers to the final authorization for the tax incentive, regardless of whether it has been taken. For the tax credit program, OFE provided the following information:
The number of productions awarded tax credits from FY 2016‐17 through FY 2018‐19.
Total jobs created by productions that completed their audit reviews and were awarded tax credits within the review period. Many of these positions were not full‐time.
Wages paid to Florida residents by certified productions that have completed their audit reviews and were awarded tax credits within the review period.
Qualified expenditures for the productions that have completed their audit reviews and were awarded tax credits within the review period.
The amount of tax credits that were awarded to productions that have completed their audit reviews within the review period. These may or may not reflect tax credits used on a tax return during the time period.
DOR provided information on the amount of tax credits used and remaining in the review period.
30 Appendix, “Return on Investment for the Entertainment Industry Incentive Programs, 1/1/15.” Available at http://edr.state.fl.us/Content/returnoninvestment/EntertainmentIndustryIncentivePrograms.pdf 31 Ibid. p. 7.
12
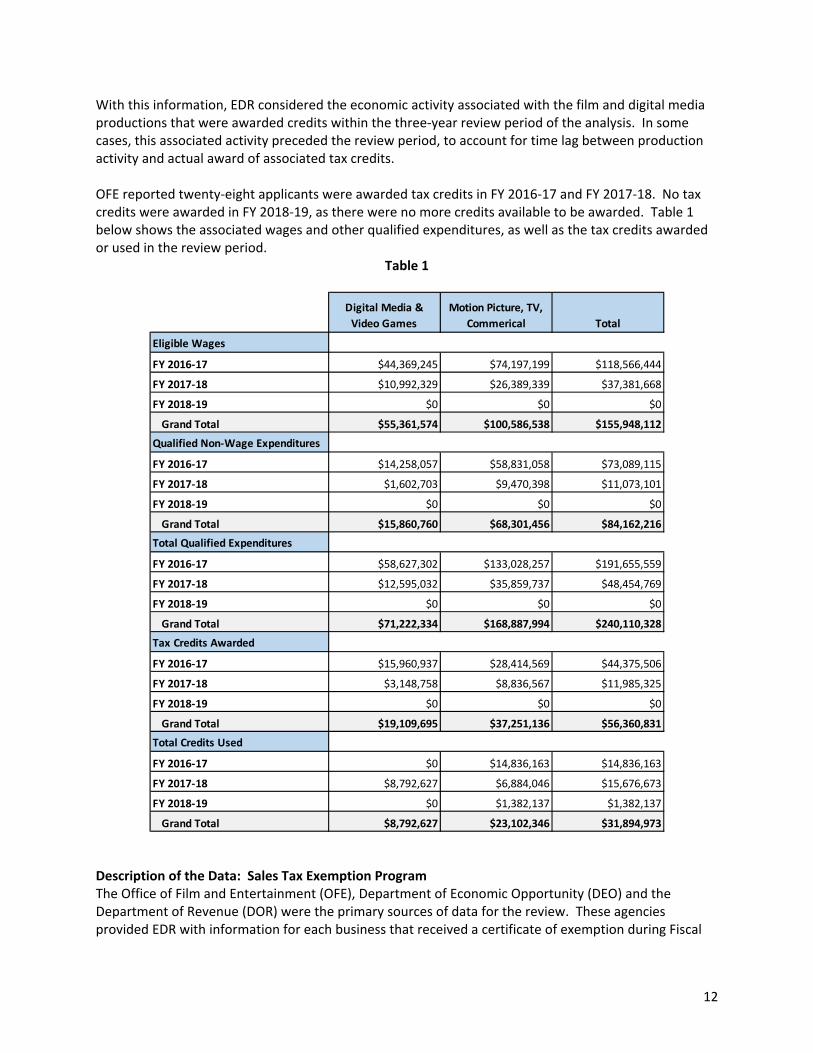
With this information, EDR considered the economic activity associated with the film and digital media productions that were awarded credits within the three‐year review period of the analysis. In some cases, this associated activity preceded the review period, to account for time lag between production activity and actual award of associated tax credits.
OFE reported twenty‐eight applicants were awarded tax credits in FY 2016‐17 and FY 2017‐18. No tax credits were awarded in FY 2018‐19, as there were no more credits available to be awarded. Table 1 below shows the associated wages and other qualified expenditures, as well as the tax credits awarded or used in the review period.
Table 1
Description of the Data: Sales Tax Exemption Program The Office of Film and Entertainment (OFE), Department of Economic Opportunity (DEO) and the Department of Revenue (DOR) were the primary sources of data for the review. These agencies provided EDR with information for each business that received a certificate of exemption during Fiscal
Digital Media &
Video Games
Motion Picture, TV,
Commerical Total
Eligible Wages
FY 2016‐17 $44,369,245 $74,197,199 $118,566,444
FY 2017‐18 $10,992,329 $26,389,339 $37,381,668
FY 2018‐19 $0 $0 $0
Grand Total $55,361,574 $100,586,538 $155,948,112
Qualified Non‐Wage Expenditures
FY 2016‐17 $14,258,057 $58,831,058 $73,089,115
FY 2017‐18 $1,602,703 $9,470,398 $11,073,101
FY 2018‐19 $0 $0 $0
Grand Total $15,860,760 $68,301,456 $84,162,216
Total Qualified Expenditures
FY 2016‐17 $58,627,302 $133,028,257 $191,655,559
FY 2017‐18 $12,595,032 $35,859,737 $48,454,769
FY 2018‐19 $0 $0 $0
Grand Total $71,222,334 $168,887,994 $240,110,328
Tax Credits Awarded
FY 2016‐17 $15,960,937 $28,414,569 $44,375,506
FY 2017‐18 $3,148,758 $8,836,567 $11,985,325
FY 2018‐19 $0 $0 $0
Grand Total $19,109,695 $37,251,136 $56,360,831
Total Credits Used
FY 2016‐17 $0 $14,836,163 $14,836,163
FY 2017‐18 $8,792,627 $6,884,046 $15,676,673
FY 2018‐19 $0 $1,382,137 $1,382,137
Grand Total $8,792,627 $23,102,346 $31,894,973

13
Years 2016‐17, 2017‐18 and 2018‐19. However, there are limitations regarding the data that could greatly distort the results of the analysis. Sales tax exemptions are generally used to reduce the costs of targeted household items or the transfer of goods between businesses. Exemptions are also provided for life necessities such as food and medicine, or to organizations that benefit the general public such as non‐profits. These types of exemptions are generally industry specific. Unlike the tax credit program, the relevant exemptions are not contingent on any performance‐based criteria such as job creation or capital investment. The tax exemption data supplied by OFE is compiled from information provided by applicants for exemption certificates. An exemption certificate is required to receive an exemption from sales tax on qualified purchases. These responses are estimates made by production companies of the expenditures they will make in the future. (See Table 2 in the Analysis and Findings section for reported estimates.) Data provided by OFE for exemption expenditures was not audited or validated. The companies must simply reapply every year if they wish to continue receiving new certificates. This lack of information regarding the actual purchases could influence the validity of the results. Another limitation regarding the data is the assumption that “but‐for” the tax exemption, the economic activity would not have occurred. Ideally, the ROI analysis would only include expenditure data from production companies that were induced to make purchases because of the exemption. Exemptions granted to companies that do not meet the “but‐for” assumption represent a straight revenue loss to the state as those production companies would have made those purchases whether or not there was a sales tax exemption.

14
KEYASSUMPTIONS The following key assumptions are used in the analysis to determine the outcomes of the programs under review. Some of the assumptions are used to resolve ambiguities in the literature, while others conform to the protocols and procedures adopted for the Statewide Model.
1. The analysis assumes that state incentives were the determining factor in business retention, expansion, or location decisions, provided the program was created and designed to attract new business activity to the state. The analysis further assumes that for bundled projects,32 the total value of the incentive package was the deciding factor for the business, not the individual components of the package.
2. The analysis assumes all data provided by DEO, DOR, and other state entities related to projects
and tax incentives was complete and accurate. The data was not independently audited or verified by EDR; however, data discrepancies between agencies were addressed.
3. The analysis assumes businesses received the full value of the state incentives, whether or not
those who transferred the credits did so at a discount, and that related costs due to federal taxes or consultant fees are immaterial to the decision making process.
4. The analysis assumes that given the time span under review, applying discount rates would not
prove material to the outcome.
5. The analysis assumes that any expenditure made for incentives is a redirection from the general market basket of goods and services purchased by the state. Similarly, any revenue gains from increased business activities are fully spent by the state.
6. The analysis assumes the relevant geographic region is the whole state, not individual counties
or regions. The Statewide Model does not recognize that any economic benefit arises from intrastate relocation. However, the model accounts and makes adjustments for the fact that industries within the state cannot supply all of the goods, services, capital, and labor needed to produce the state’s output.
7. The analysis assumes that businesses treated the incentives as subsidies. The subsidies lowered
the cost of production for each individual firm.
8. The analysis assumes the distribution of capital purchases by each business was the same as the industry in which it operates. This assumption was made because data was not available regarding the specific capital purchases associated with each project. It is also assumed that the businesses benefiting from a particular program were not large enough to affect the rate of return on capital within the industries in which the businesses operated.
9. The analysis assumes that the output from projects did not displace the market for goods and
services of existing Florida businesses. To do this, output associated with the businesses was
32 The only bundling that was assumed to take place was the combination of the Sales Tax Exemption and Film Tax Credit programs. No information was available as to the possible local incentives offered in conjunction with the state incentives.

15
assumed to be exported to the rest of the world. The “rest of the world” is defined as other states or the international market.
10. The analysis assumes that businesses are indifferent between tax credits and cash awards and will not change their behavior based on the type of incentive award given.

16
KEYTERMS In the pages that follow, the analysis for each program includes diagnostic tables describing the composition and statistics of the projects under review. Key terms used in the tables are described below: State Payments in the Window $(M) – Represents the amount of state payments made to the program in each fiscal year. Total Net State Revenues $(M) – Represents the amount of new state revenue generated by the program in each fiscal year. Personal Income (Nominal $(M)) – Reflects income received by persons from all sources. It includes income received from participation in production as well as from government and business transfer payments. It is the sum of compensation of employees (received), supplements to wages and salaries, proprietors' income with inventory valuation adjustment (IVA) and capital consumption adjustment (CCAdj), rental income of persons with CCAdj, personal income receipts on assets, and personal current transfer receipts, less contributions for government social insurance. Real Disposable Personal Income (Fixed 2019‐20 $(M)) – Reflects total after‐tax income received by persons; it is the income available to persons for spending or saving. Real Gross Domestic Product (Fixed 2019‐20 $(M)) – Measures the state's output; it is the sum of value added from all industries in the state. GDP by state is the state counterpart to the Nation's gross domestic product. Consumption by Households and Government (Fixed 2019‐20 $(M)) – Reflects the goods and services purchased by persons plus expenditures by governments consisting of compensation of general government employees, consumption of fixed capital (CFC), and intermediate purchases of goods and services less sales to other sectors and own‐account production of structures and software. It excludes current transactions of government enterprises, interest paid or received by government, and subsidies. Real Output (Fixed 2019‐20 $(M)) – Consists of sales, or receipts, and other operating income, plus commodity taxes and changes in inventories. Total Employment (Jobs) – Provides estimates of the number of jobs, full time plus part time, by place of work. Full time and part time jobs are counted at equal weight. Employees, sole proprietors, and active partners are included, but unpaid family workers and volunteers are not included. Population (Persons) – Reflects first of year estimates of people, includes survivors from the previous year, births, special populations, and three types of migrants (economic, international, and retired).
17
ANALYSISANDFINDINGS Tax Credit Program For this analysis, the Office of Film and Entertainment (OFE) provided information regarding the estimated qualified expenditures for film and digital media productions participating in the tax credit program by type of project. In addition, information was provided on the tax incentives awarded, transferred and used on a return. The known qualified production expenditures represent a significant portion of the total value of the commodity produced by these projects; however, they do not account for the nonqualified expenditures, particularly return‐to‐capital and out‐of‐state purchases. To gain a better understanding of the output value produced by these projects, information from IBISWorld,33 an industry‐based research provider, was reviewed. Additionally, an analysis of the underlying Statewide Model base data on the relationship between in‐state and out‐of‐state purchases of intermediate inputs was undertaken. To develop total spending, EDR first produced an estimate of the additional “non‐qualified” expenditures. The analysis of the base data contained in the Statewide Model indicated that between 20 and 42 percent of the total purchased inputs for the affected entertainment industries come from outside the state. Assuming that the non‐qualified expenditures lean more heavily to out‐of‐state purchases, the calculations use 40 percent.34 To include the effect of return‐to‐capital, one further adjustment is needed: a transformation of estimated expenditures from costs of production to the market value of output. This is a necessary step to correctly run the scenarios through the Statewide Model. The adjustment was based on information taken from the IBISWorld report referenced above. It was further assumed that all activity associated with the tax credit program was new to the state. That is, it would not have occurred absent the incentives. In an unknown number of instances, this would have been an erroneous assumption. There were likely some projects that were market or resource dependent; that is, the production was specific to Florida markets or was dependent on filming in a Florida‐specific location. To the extent that this activity would have taken place whether or not the incentives were available, or that the activity displaced local non‐incentivized activity, the analysis will overstate the benefits to Florida. Finally, a portion of the economic benefit was attributed to the tax exemption program as tax credit recipients were also granted tax exemptions for qualified purchases.
33 IBISWorld – Industry Market Research, accessed 6/2020. 34 There is an incentive to purchase inputs from local suppliers that are more generally purchased from out‐of‐state since the item would be more likely to be included in qualified expenditures for purposes of calculating the award.

18
Results for the Tax Credit Program
The tax credit program has a projected ROI of 0.07. While the ROI is positive, the program only returns seven cents in tax revenues for every dollar of tax credits awarded. This result falls below the ROI of 0.18 reported in the 2018 analysis and the ROI of 0.43 reported in 2015 analysis.35 There was a total of $240.1 million in qualified expenditures during the review period. EDR estimated that there was an additional $192.7 million in non‐qualified expenditures. Of the total projected expenditures of $432.8 million, EDR calculates that $148.7 million was spent on taxable items that were exempt from sales taxes under the tax exemption program. The total expenditures result in an annual average increase in real state output of $165.0 million in the incentivized industries. Because the tax credit and tax exemption incentives were “bundled,” not all of this increased output can be assumed to have occurred solely because of the tax credit program. Assuming that a dollar saved in sales taxes on exempt purchases has the same inducement as a dollar received in tax credits, an average of $15.2 million per year (in real dollars) of the estimated output was allocated to the tax exemption program. Therefore, the net average annual increase in real output in the incentivized industries is $149.8 million per year ($165.0 ‐ $15.2). This results in an economy‐wide increase in real output of $397.5 million per year across all sectors. There are both winners and losers in the analysis. The sectors most positively impacted besides digital media and the motion picture and
35 In the 2015 analysis, two scenarios were run. The first analysis measured the cost of the program by tax credits used on a return during the review period, and resulted in an ROI of 0.43. This scenario reflects the lag between the time a credit is awarded and when it is actually used against a tax obligation. This was the official reported result. The second analysis measured the cost of the program by tax credits awarded during the review period, and resulted in an ROI of 0.25. This scenario included the full potential cost of the credits to the state, whether or not they were used on a return during the review period.
FY2017 FY2018 FY2019 Total
State Payments in the Window Nominal $ (M) 14.84 15.68 1.38 31.89
Total Net State Revenues Nominal $ (M) 21.95 (13.81) (6.00) 2.15
Return‐on‐Investment by Year 1.48 (0.88) (4.34)
Return‐on‐Investment for the 12 year period 0.07
FY2017 FY2018 FY2019 TotalAverage
per Year
Personal Income Nominal $ (M) 720.4 37.9 (103.1) 655.1 218.4
Real Disposable Personal Income Fixed 2019‐20 $ (M) 670.3 30.8 (94.9) 606.2 202.1
Real Gross Domestic Product Fixed 2019‐20 $ (M) 868.3 8.4 (142.0) 734.6 244.9
Consumption by Households and Government Fixed 2019‐20 $ (M) 820.5 (7.6) (140.7) 672.2 224.1
Real Output Fixed 2019‐20 $ (M) 1,358.1 26.7 (192.2) 1,192.6 397.5
FY2017 FY2018 FY2019Minimu
m
Maximu
m
Average
per Year
Total Employment Jobs 3,211 (942) (1,145) (1,145) 3,211 375
Population Persons 0 712 824 0 824 512
19
sound industries are construction, trade, and broadcast and television. The principal industries that show a contraction are state government and manufacturing. The state’s incentives during the review period are divided into credits awarded based on qualified expenditures and credits actually used on a return. There were $56.4 million in credits awarded within the review period; this means the production had finished its audit and that DEO had approved the credits to be used on a return. During the same period, $31.9 million in credits were used on tax returns.36 Of the credits used, nearly all were transferred—that is, sold at a discount—to an unaffiliated party. Of the credits used, 89.2 percent were sales tax credits and 11.8 percent were corporate tax credits. None of the sales tax credits were used by the original recipient. Notwithstanding the failure of the program to break even from the state’s perspective, it does have broader economic value to the state as a whole. Personal income (in nominal dollars) is on average $218.4 million per year higher during the period, and real GDP within the state is $244.9 million (in 2019‐20 dollars) higher per year. In addition, there are an average of 375 more jobs each year during the analysis period. Most of these are filled by current residents, but some are filled by new residents attracted to the state by the increased economic activity—Florida resident population is on average 512 persons higher per year than it would be in the absence of the program. Finally, Net State Revenues are significantly lower than shown in the 2018 report (a net of $2.15 million in this report versus $23.4 million in the 2018 report). This is because the formal program had expired immediately prior to the review period, leaving the program to operate with the diminished credit amount that was still available for distribution, at the same time that previously awarded credits were being used. The two negative numbers (2017‐18 and 2018‐19) are driven by the lag between the end of the qualified project and the actual application of the credits against a tax obligation. This lag affects the ROI calculation by separating the positive benefits from the true program costs across the review periods. At the end of the program, the costs become more apparent as the new activity dwindles.
36 This total includes credits awarded prior to the review period.
20
Sales Tax Exemption Program For this analysis, the Office of Film and Entertainment (OFE) provided projected expenditures from each business that received a certificate of exemption during the period of review. As discussed previously, the projected expenditures are likely overstated, and the results should be reviewed with this in mind. Notwithstanding the data limitations caused by the program’s design, this analysis generally assumes that the tax exemption program induces companies to undertake new or expanded activity in Florida. In a few instances, this assumption was relaxed. First, since it is unlikely that long‐established Florida companies have been induced to undertake activity that they otherwise would not, the analysis only considers the projected tax‐exempt expenditures from companies established after 2000. This year was chosen because the Legislature created a single application process to obtain a certificate of exemption from sales and use taxes in that year. The analysis assumes that any activity by production companies that were established in Florida prior to 2000 was impervious to the exemption program. Second, projected expenditures from production companies that are reliant on Florida’s markets or resources were excluded from the data as well. These were expenditures from companies that are:
Filming a commercial for a business or location in Florida (hospitals, theme parks, beaches); or
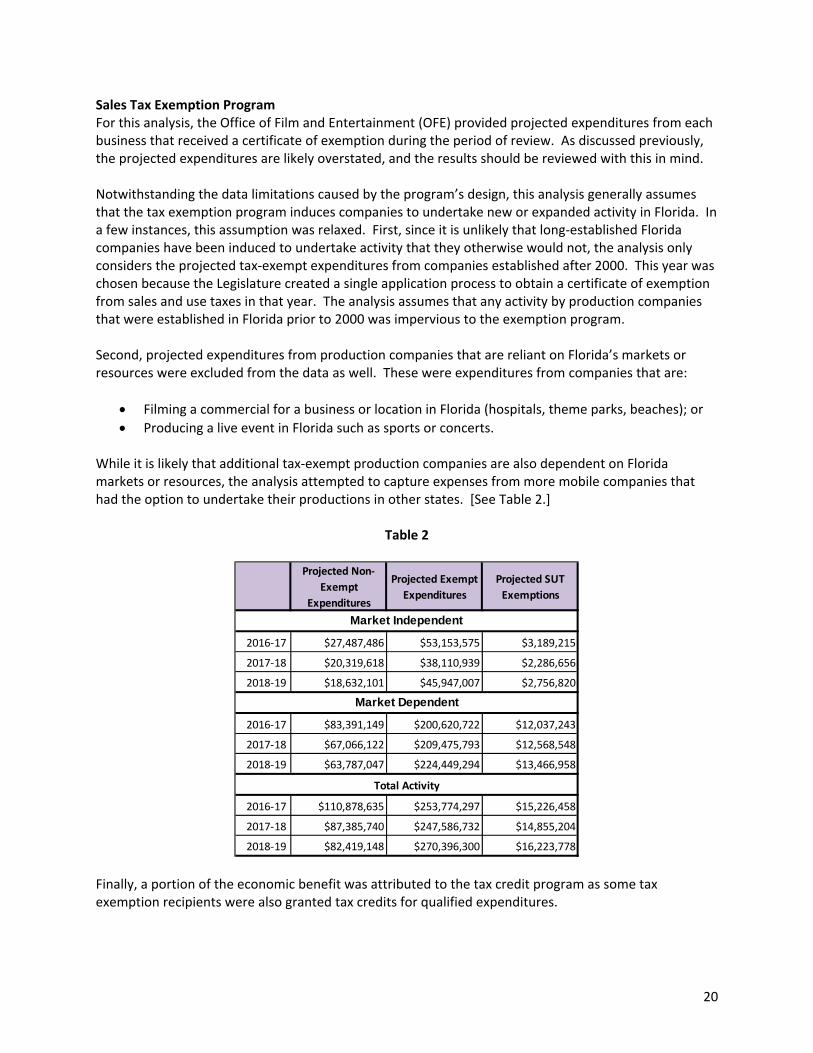
Producing a live event in Florida such as sports or concerts. While it is likely that additional tax‐exempt production companies are also dependent on Florida markets or resources, the analysis attempted to capture expenses from more mobile companies that had the option to undertake their productions in other states. [See Table 2.]
Table 2
Finally, a portion of the economic benefit was attributed to the tax credit program as some tax exemption recipients were also granted tax credits for qualified expenditures.
Projected Non‐
Exempt
Expenditures
Projected Exempt
Expenditures
Projected SUT
Exemptions
2016‐17 $27,487,486 $53,153,575 $3,189,215
2017‐18 $20,319,618 $38,110,939 $2,286,656
2018‐19 $18,632,101 $45,947,007 $2,756,820
2016‐17 $83,391,149 $200,620,722 $12,037,243
2017‐18 $67,066,122 $209,475,793 $12,568,548
2018‐19 $63,787,047 $224,449,294 $13,466,958
2016‐17 $110,878,635 $253,774,297 $15,226,458
2017‐18 $87,385,740 $247,586,732 $14,855,204
2018‐19 $82,419,148 $270,396,300 $16,223,778
Market Independent
Total Activity
Market Dependent

21
Results for the Sales Tax Exemption Program
The analysis of the tax exemption program resulted in a ROI of 0.49. That is, for every dollar of foregone sales tax collections, the program returned forty‐nine cents in new state revenue collections. This is lower than the ROI of 0.58 reported in the 2018 analysis or the 0.54 reported in 2015 analysis. Even though total expenditures were higher in the current review ($3.49 billion, versus the reported $3.36 billion in 2018 and $3.15 billion in 2015), only 14.3 percent of the spending was market independent. This percentage was 47.1 percent in the 2018 analysis.
The analysis suggests that approximately $2.99 billion in output would have occurred even without the tax exemptions. Most of this is the estimated output of firms that have a permanent presence in Florida. The remainder is related to productions at Florida locations or events that did not meet the “but‐for” assumption. The sales tax exemption program had an estimated $772 million in tax‐exempt spending at a cost of $46.3 million in foregone sales tax revenue. After making all of the adjustment described above, this translates into just $166 million in new activity per year. While the total output of businesses receiving sales tax exemption certificates is not directly addressed by the analysis, the impact of the reduced cost of inputs is included. The fact that the gross price of the inputs purchased by businesses is lower because of the exempt nature of the purchases does have a positive effect on the cost of production and is accounted for in the analysis. Similar to the tax credit program, this program also has a broader economic value to the state as a whole. Personal income (in nominal dollars) is on average $462.3 million per year higher during the period, and real GDP within the state is $493.2 million (in 2019‐20 dollars) higher on average per year. In addition, there was an average of 1,887 more jobs each year during the analysis period.
FY2017 FY2018 FY2019 Total
State Payments in the Window Nominal $ (M) 15.23 14.86 16.22 46.31
Total Net State Revenues Nominal $ (M) 11.97 3.28 7.39 22.64
Return‐on‐Investment by Year 0.79 0.22 0.46
Return‐on‐Investment for the 12 year period 0.49
FY2017 FY2018 FY2019 TotalAverage
per Year
Personal Income Nominal $ (M) 558.8 360.4 467.7 1,386.9 462.3
Real Disposable Personal Income Fixed 2019‐20 $ (M) 518.4 327.3 418.9 1,264.5 421.5
Real Gross Domestic Product Fixed 2019‐20 $ (M) 620.9 374.4 484.2 1,479.6 493.2
Consumption by Households and Government Fixed 2019‐20 $ (M) 607.9 372.5 498.9 1,479.3 493.1
Real Output Fixed 2019‐20 $ (M) 1,103.4 680.7 875.9 2,660.0 886.7
FY2017 FY2018 FY2019 Minimum MaximumAverage
per Year
Total Employment Jobs 2,971 1,134 1,555 1,134 2,971 1,887
Population Persons 0 752 1,192 0 1,192 648

22
Conclusion The analysis shows that both the tax credit and the tax exemption programs have positive ROIs, although neither generates sufficient tax revenues to offset the cost of the programs. In addition, both programs contributed to the broader economic health of the Florida economy, producing additional income, state gross domestic product (GDP) and jobs. However, caution should be used in interpreting these results. The results are sensitive to the underlying assumptions—particularly the assumption that much of this activity is new to the state. While an effort was made to exclude activity in the sales tax exemption program that clearly did not meet the “but for” assumption, all activity under the tax credit program was assumed to be new to the state. Tellingly, the continued use of the tax exemption program indicates that production in Florida endures despite the expiration of the tax credit program. In contrast, there are also issues that potentially produce downward pressure on the two programs’ ROIs. First, capital investments are only reported when they are used to earn the incentive. In this regard, capital investments can be captured if they are qualified expenditures in the tax credit program, or if they are within an exempt expenditure category in the tax exemption program. Any other capital investment goes unreported. Requiring the reporting of all capital expenditures would positively affect the ROI for each program and produce more accurate results. Another issue that affects the tax credit program’s efficiency, if not its ROI, is the transferability of credits. While transferability was introduced as a workaround for award recipients that had limited or no liability, the recipient projects do not receive the full benefit of the intended award level when the credits are sold at a discount. This introduces economic and allocative inefficiencies to the extent that the indirect subsidy causes the purchasing entity to engage in production activity that the state has no direct interest in supporting. Further, to the extent that these transfers take place at discounts, the tax credit program could be replaced by a grant program funded at the discounted value of the credits, while maintaining the same level of supported production activity. This analysis does not account for the deadweight loss of discounting, which overstates the true cost of the program relative to a pure grant program attempting to accomplish the same end.
23
APPENDIX:RecentResearchRegardingStateFilmandEntertainmentIncentivePrograms
Historically, the film and television industry37 in the United States was concentrated in California and New York, the bicoastal headquarters for major production enterprises. Other states and metropolitan areas developed indigenous industries in response to the demand for local and regional content, as well as productions specific to their unique geographic characteristics. IBISWorld, an industry research provider, reports that the movie and video production industry38 is “concentrated in regions that have developed significant studio and production facilities. Close proximity to these resources greatly benefits industry establishments by providing specialization, cooperation and easy access to local movie and video production talent.”39 California alone accounts for 39.4 percent of all industry establishments, while New York holds 14 percent. Florida and Texas lead the remaining states.40 Motion picture production is not limited to studio facilities, as “many movies are filmed on location throughout the country. These on‐site shoots contribute to most of the industry's scattered employment in other states and are, therefore, subject to fluctuation. Changes in state tax incentives often stimulate various shifts in on‐location productions by state.”41 State tax incentive programs have proliferated in the last three decades.42 At one point, 45 states had enacted incentive programs, but at least eleven have terminated them since 2009. (Thom 2017, 87) Of those that continue them, some have even increased their offerings. In 2019, Thom reported that:
“In 2017, according to state government reports, over thirty states granted the industry a combined US $1.7 billion in corporate income tax expenditures, not including the value of other program services. About 77 percent was concentrated in five high‐expenditure states (New York, Louisiana, Georgia, Connecticut, and Massachusetts) that represented only 58 percent of expenditures five years earlier. Cumulative spending in these states rival those for prominent economic development megadeals.” (Thom 2019, 94)
In 2009, California authorized $100 million per year in film production incentives. In 2015, it increased the annual cap to $330 million. (LAO 2019, 1) The program was extended in 2018 through 2025. In 2004, New York authorized $100 million per year in incentives through 2019. Program funding was expanded to $420 million per year in 2010 and was recently extended through 2022. (NY 2019, 5) Georgia’s Film Tax Credit expenditures increased from $407 million in 2013 to $915 million in 2017 – with over $3 billion awarded in the five year period. (DOAA 2020, 5)43
37 The industry includes the development, production, distribution, marketing and sales of film, television and video content. 38 IBISWorld’s definition of the Movie and Video Production industry includes operators which produce and distribute motion
pictures and videos. This definition excludes third‐party distributors and disc manufacturers and products produced for TV, such as TV shows and made‐for‐TV movies. US Industry (NAICS) Report 51211a, IBISWorld, p. 4. Accessed 7‐21‐20. 39 US Industry (NAICS) Report 51211a, IBISWorld, p. 23. Accessed 7‐21‐20. 40 Ibid. 41 US Industry (NAICS) Report 51211a, IBISWorld, p. 24. Accessed 7‐21‐20. 42 While some state incentives programs were initially limited to motion picture production, many now include incentives for
television, commercial video and digital media production. A few state incentive programs offer grants in lieu of tax credits. 43 The Georgia Department of Audits and Accounts (DOAA) found that only 12% of tax credits ($79.5m) awarded in 2016 went to companies with permanent Georgia locations. Further, “labor is production companies’ largest expense, and most labor

24
Incentive proponents argue such programs increase employment and job creation, and create or expand the film industries in their respective states. Employment data compiled from employer withholdings of Federal Unemployment Insurance Taxes shows that California and New York’s shares of film industry jobs and wages have remained relatively stable since 2001.44 [See TABLE 1 below.] Florida’s share has decreased from 3.17% (jobs) and 1.97% (wages) in 2001 to 2.64% (jobs) and 1.9% (wages) in 2019. Relative to its history, Florida’s share of jobs and wages did not appreciably increase during the period when its Entertainment Industry Financial Incentive Program was active. Notably, Georgia markedly increased its share of industry jobs and wages over this period.
TABLE 1
Research suggests that job gains are short term and contingent upon maintaining subsidies, with efforts to establish new production and post‐production industries proving to be largely unsuccessful. Additionally, the overwhelming body of government research finds that state film incentive programs are not cost‐effective. In 2015, EDR addressed the cost‐effectiveness of state film incentive programs in its evaluation of return on investment for the Florida Entertainment Industry Financial Incentive program.45 This Appendix updates that literature review and summarizes state film incentive program ROI evaluations by non‐affiliated, independent state entities.
Post‐2015 Research
Most of the recent research has explored state film incentive programs’ impact on employment growth and the development of in‐state production infrastructure. Generally, the research finds incentives
income went to nonresident workers. Higher paying jobs such as principal actors, directors, and department heads are generally filled by nonresidents. Lower paying jobs such as security, grips, and extras are more frequently filled by Georgia residents.” (DOAA 2020, 28‐29) While nonresidents represented 20% of employment, they represented 53% of labor income for productions receiving incentives in 2016. (DOAA 2020, 58) 44 This data tracks workers employed in firms incorporated or registered in the respective states. Generally, when work is done in other states on behalf of their employer, their wages are captured in their home state – unless the firm is also incorporated or registered in the host state. Given the nomadic nature of film and entertainment production, out‐of‐state workers typically fill many positions in the production process. 45 Appendix: Literature Review Regarding the Impact of State Film and Related Entertainment Incentive Programs, “Return on Investment for the Entertainment Industry Incentive Programs, 1/1/15.” P. 40. Available at http://edr.state.fl.us/Content/returnoninvestment/EntertainmentIndustryIncentivePrograms.pdf
2001 2002 2003 2004 2005 2006 2007 2008 2009 2010 2011 2012 2013 2014 2015 2016 2017 2018 2019
California 50.21% 57.39% 58.76% 62.83% 59.89% 59.43% 58.15% 57.61% 56.90% 54.94% 54.86% 52.94% 52.13% 52.30% 51.58% 53.41% 46.90% 45.90% 46.15%
New York 21.76% 17.61% 16.37% 14.80% 16.14% 16.22% 15.92% 16.07% 17.31% 19.84% 20.69% 20.81% 21.17% 20.83% 19.43% 17.62% 19.51% 19.75% 19.18%
Georgia 1.38% 1.51% 1.28% 1.00% 1.04% 0.98% 0.98% 0.97% 1.38% 1.23% 1.34% 1.49% 1.78% 1.92% 3.51% 4.11% 6.11% 6.01% 6.58%
Florida 3.17% 2.92% 2.68% 2.18% 2.44% 2.32% 2.44% 2.31% 2.17% 1.83% 1.85% 2.04% 2.00% 2.40% 2.27% 2.43% 2.88% 2.91% 2.64%
Texas 2.30% 2.12% 2.41% 1.77% 1.70% 1.68% 1.73% 1.53% 1.57% 1.52% 1.56% 1.66% 2.18% 2.05% 2.27% 2.23% 2.42% 2.45% 2.43%
Louisiana 0.36% 0.34% 0.68% 0.95% 1.16% 0.97% 1.36% 1.72% 0.85% 1.26% 1.10% 1.73% 2.49% 2.33% 2.67% 1.54% 1.22% 1.32% 1.39%
New Mexico 0.15% 0.22% 0.19% 0.24% 0.50% 0.87% 1.07% 1.08% 0.94% 0.98% 0.76% 0.99% 0.76% 0.67% 0.73% 0.83% 0.76% 0.76% 0.89%
2001 2002 2003 2004 2005 2006 2007 2008 2009 2010 2011 2012 2013 2014 2015 2016 2017 2018 2019
California 61.54% 68.48% 68.32% 69.95% 68.57% 67.23% 65.46% 64.85% 64.75% 64.63% 62.66% 61.67% 59.38% 59.54% 60.47% 60.23% 60.04% 59.21% 58.58%
New York 18.72% 16.68% 16.69% 15.92% 16.59% 17.22% 18.17% 18.41% 18.73% 19.76% 21.51% 22.12% 23.39% 24.18% 21.66% 20.97% 19.62% 19.73% 19.50%
Georgia 0.89% 0.80% 0.75% 0.62% 0.63% 0.69% 0.75% 0.78% 1.01% 0.88% 0.96% 1.10% 1.41% 0.88% 1.75% 3.01% 4.18% 3.90% 4.23%
Florida 1.97% 1.74% 1.81% 1.73% 2.08% 1.92% 2.12% 2.07% 1.59% 1.19% 1.29% 1.48% 1.48% 1.65% 1.71% 1.90% 2.07% 1.98% 1.90%
Texas 1.66% 1.31% 1.43% 1.10% 1.17% 1.22% 1.27% 1.16% 1.26% 1.15% 1.17% 1.25% 1.43% 1.29% 1.36% 1.42% 1.36% 1.32% 1.40%
Louisiana 0.11% 0.12% 0.16% 0.26% 0.47% 0.38% 0.63% 0.71% 0.57% 0.85% 0.84% 0.92% 1.10% 1.14% 1.26% 0.73% 0.61% 0.86% 0.91%
New Mexico 0.05% 0.09% 0.06% 0.05% 0.27% 0.37% 0.43% 0.57% 0.50% 0.48% 0.43% 0.61% 0.48% 0.48% 0.62% 0.67% 0.53% 0.51% 0.66%
Share of Film Total Wages Relative to the US (2001‐2019) (Private Sector Only)
Share of Film Industry Jobs Relative to the US (2001‐2019) (Private Sector Only)

25
resulted in little to no meaningful, sustained impact, and that the production industry remains largely intact in California and New York.46 In 2019, Thom studied whether the incentive programs in New York, Louisiana, Georgia, Connecticut, and Massachusetts (five high expenditure states, as measured by cumulative expenditures reported through 2017) contributed to job growth in each state’s motion picture industry. He found that “in most cases, Motion Picture Incentive programs had no statistically significant employment impact. Findings that achieved statistical significance nevertheless failed to show practical significance…” (2019, 100) Thom’s 2018 examination of California’s Film and Production Tax Credit program found no “significant effect on changes in three occupational categories associated with the motion picture industry.” He concludes that California’s motion picture industry employment “instead appears to track the national labor market.” (2018a, 1) Swenson (2017, 65) measured the direct impact of state movie production tax incentives on film production industry employment (excluding independent contractors) from 1998 to 2011. He found that while film production employment and establishments increased in California and New York, there was no discernable increase across all states. He concludes that “(m)uch of this non‐effect appears because of a ‘crowding out’ effect due to the sheer number of states with incentives.”
Button (2019, 315) estimated the effect of state film incentives through 2017, finding some increase in television filming, but “no meaningful effect on feature films, and employment, wages, and establishments in the film industry and in related industries.” He concludes that “the ability for tax incentives to affect business location decisions and economic development is mixed, suggesting that even with aggressive incentives, and ‘footloose’ filming, incentives can have little impact.” In a study limited to Louisiana and New Mexico, Button (2018, 1) evaluated whether incentives could be effective in creating a new state film industry. His results showed increases in feature films, but not TV series filming, and no increases in employment or business establishments.
Owens and Rennhoff (2019, 1) reviewed the impact of incentives on filming location choices for movies produced from 1999 to 2013, finding that “the impact depends on the type of incentive offered, studio characteristics and inherent location geographic characteristics.” They found no strong evidence that film incentives result in a more permanent movie industry in a state. Additionally, their cost‐benefit analysis indicates that film incentive programs are revenue‐negative for states.
Thom (2018b) examined the effectiveness state film incentive programs to entice film production industries out of California and New York. His findings suggest “that most of the incentives included under these programs had little to no sustained impact on employment or wage growth and that none of the incentives affected the motion picture industry (Gross State Product) or concentration.” (13) Thom offered that “program design choices are partially to blame” and identifies underlying issues which undermined state incentive efficacy. (11)
O’Brien & Lane (2018, 872‐873) provided an overview of project‐based film incentive programs between 1998 and 2010 across the United States. They found that specific economic development outcomes are related not only to the existence and value of financial incentives, but also to ecological factors, organizational diversity, and the presence of dominant firms. Despite the presence of incentive
46 These studies did not specifically address the impact of the countervailing incentives offered by California (adopted in 2009) and New York (adopted in 2004) to retain in‐state production and post‐production infrastructure.

26
programs in other states, they note that the existing production industry in California and New York “remains largely intact, despite billions in incentives aimed at disrupting it.” They suggest that “rather than outspend one another through costly tax credits, states might achieve better results by tailoring existing incentives to increase organizational diversity, particularly by targeting companies associated with distribution, marketing and sales.”
Three recent papers examine the proliferation of state film incentive programs. Leiser’s study (2017, 255) combined quantitative event history analysis and qualitative interview methods to review three states (Michigan, Mississippi and Washington), finding that “the analysis suggests that the diffusion processes in state adoptions of film incentives can be largely explained by two factors: (a) the size and sophistication of the existing film industry in the state and (b) a competitive “bandwagon” effect based on the total number of states that had already adopted film incentives.” Sewordor and Sjoquist’s (2016, 5) review of programs enacted from 1992 to 2010 echoed Leiser’s finding regarding the “mimicking phenomenon” and added that “fiscal stress results in faster adoption of film tax credits.” Thom & An (2017, 98‐99) found that the key drivers of program enactments were likely rising unemployment and the popularity of the concept. The most substantial drivers of program termination were falling unemployment, termination of programs in other states, and prior‐year reductions in program spending. Summary of State Film Incentive Program ROI Evaluations Independent analysts conclude that state film subsidy programs are not self‐supporting, as they generate less in state tax revenue than the state payments funding the incentives. At the current subsidy levels and under present‐day tax structures, the tax revenues from direct expenditures by subsidy recipients, including any indirect and induced effects, are insufficient to recoup the costs of state incentive programs. As reported in EDR’s 2015 report, independent analysts have challenged the methodology and conclusions reached by proponents of state film incentive programs.47 The following is a summary of the more common deficiencies and “problematic approaches” in proponent economic analyses:
Failure to calculate the return on investment to the state;
Failure to consider opportunity costs;
Overstating employment outcomes;
Failure to account for flight of capital out‐of‐state;
Attributing all in‐state film‐related activities to incentives;
Including gains in local revenues in assessments of state‐funded incentives;
Using generous multipliers in the calculation of economic impact; and
Over‐attributing economic outcomes to film‐induced tourism. TABLE 2 lists a number of State film incentive program evaluations by non‐affiliated, independent state entities. These evaluations consider program features unique to each state,48 and use methodologies that are generally consistent with the assumptions and best practices identified in the academic
47 See Literature Review Regarding the Impact of State Film and Related Entertainment Incentive Programs in EDR’s 2015 report, “Return on Investment for the Entertainment Industry Incentive Programs, 1/1/15.” P. 40. Available at http://edr.state.fl.us/Content/returnoninvestment/EntertainmentIndustryIncentivePrograms.pdf 48 All state programs identified in TABLE 2 incentivized film production, most incentivized television programing and commercials, many incentivized music videos, and at least six (including Florida) incentivized digital media production (interactive games, digital animation and visual effects). Georgia and New York also provided incentives for post‐production expenditures. Qualified expenditures varied between the states.

27
literature. Variations in methodologies include the method of assessing incentive costs to the state, use of a “balanced budget” analysis in the evaluation, and selected program review period. The method of assessing incentive costs to the state has implications for the measure of ROI, as the full cost may not be included if the tax credits are not used in the period of economic activity under review. For example, state incentive programs typically award tax credits to qualified productions, subsequent to production activity and after validation of qualified expenditures. Most states also allow the tax credits to be carried forward to succeeding tax years. Consequently, the cost to the state for the incentives can occur well past the production activity and the period of review, resulting in a higher short‐term ROI than a longer term evaluation would produce.49 Some evaluations correct for this by pulling all credits awarded for incentivized productions into the review period rather than including just the credits actually used in the review period. While the tax expenditure may be unrealized in the review period, it is nonetheless a cost to the state and may provide a more accurate assessment of program ROI. This approach also corrects for mature program incentive expansions or contractions, and irregular annual credit redemptions due to the tax credit holder’s needs. Further, evaluations may attribute any economic activity preceding the review period if this activity was generated by productions awarded credits within the review period. A “balanced budget” analysis (or offset) is used to derive a net economic impact of new economic activity induced by the state subsidy, as it accounts for the opportunity costs of tax reductions or forgone funding on other state priorities. This is in contrast to analyses which simply measure gross economic activity generated by or attributed to program projects. While many of the state evaluations listed in TABLE 2 acknowledge the importance of accounting for opportunity costs, more than half do not use balanced budget analyses in the their calculations of ROI. These evaluations overestimate the economic impact of the program and tend to report greater program ROIs than those that do use balanced budget analyses. [Note: The underlined state names in TABLE 2 indicate those states that use a balanced budget analysis.] The selected program review period is another important consideration as a single‐year or short‐term evaluation may only offer a “snapshot” of the program. Ideally, multi‐year program evaluations provide a more complete assessment of the value and effectiveness of such programs.50 However, it should be noted that data limitations may make longer‐term reviews infeasible. The state film incentive program evaluations by non‐affiliated, independent state entities are also useful in assessing the validity of studies commissioned by incentive proponents. For example, the Georgia Department of Audits and Accounts (DOAA) issued a report on the Georgia Film Tax Credit in 2020.51 The report evaluated the “effectiveness of the credit as a tax incentive and economic development program, including the economic and fiscal impact of the credit” and offered recommendations to make the credit more cost‐efficient. (DOAA 2020, i.) The DOAA concluded that:
49 The estimate of ROI would be determined by calculating the tax revenues that resulted from incentivized projects that were awarded credits within the review period, but include only the cost to the state of those credits used during that period. 50 As listed in TABLE 2, the following state evaluations review six or more years of consecutive program activity: Massachusetts (10), Connecticut (8), New Mexico (7), and Pennsylvania (6). Florida now has completed three triennial reviews spanning the full duration of the program. 51 Georgia Department of Audits and Accounts (DOAA) 2020. “Impact of the Georgia Film Tax Credit.” https://www.audits.ga.gov/rsaAudits/

28
“While Georgia’s film tax credit has increased the production of movies, television, and interactive entertainment in the state, the information available to decision makers regarding the credit’s impact has been incomplete and inaccurate. The economic impact and jobs attributable to the credit have been overstated, even before considering the cost of the credit.” (DOAA 2020, i.)
In contrast to previous economic impact estimates reported by the Georgia Department of Economic Development, the DOAA evaluation included only jobs related to productions incentivized by the credit; differentiated between the impact of spending by residents and nonresidents employed in productions; used a reasonable output multiplier to measure the direct, indirect and induced effects of the subsidy; and measured the net rather than gross impact of the credit.52 The evaluation also included the economic impact of studio construction and film tourism. The DOAA concluded that, for 2016, the $667 million in credits “resulted in an estimated $602 million net revenue loss to the state” for a return on investment of 0.10 (or 0.21 if local revenues are included). (DOAA 2020, 21). Incentive proponents also attribute economic benefits to Film Induced Tourism (FIT), which describes the phenomenon of film and television viewers visiting the specific places or regions where filming occurred or is depicted in the film. Images of and positive associations with locales as presented in films and television programs are argued to be a useful promotional device, a valuable advertisement or significant marketing tool for the region. (EDR 2018, 11) While the potential economic benefit of FIT is acknowledged in some state film incentive program evaluations, few have attempted to quantify it, citing the lack of consensus in economic literature about how to isolate and measure its impact.53 However, two studies did include FIT in their calculations of ROI. Georgia estimated the number of non‐resident tourists in 2016 that were at least partially motivated by film and that participated in tourism and sight‐seeing activities, using survey data from a 2011 study by the Motion Picture Association. (DOAA 2020, 16 & 47‐49) In addition, the Virginia grant program leverages in‐kind advertising from associated film productions, resulting in commercials aired during television programs or a short video on feature film DVDs. Virginia provided upper and lower bound estimates of the economic impact, derived from surveys of local visitor bureaus, estimates of ancillary marketing benefits from the in‐kind advertising, and information from a 2011 study of the Georgia film and television industry. Their analysis estimated a range of $139,000 to $5.3 million in revenue annually from FIT, on average, noting it is “unlikely that the state achieves the high estimate…” (VA 2017, 20‐21) For illustrative purposes, TABLE 2 also includes evaluations commissioned by state film incentive programs in states with major production activity. Of note, New York, California and Louisiana do not use balanced budget analyses. It is also important to acknowledge that a program’s ROI is influenced by the respective state’s tax structure. This is especially evident in California and New York.
52 Charles Bradbury echoes the DOAA findings in “A Comment on Georgia Department of Economic Development Report: The Economic Impact of the Film Industry in Georgia.” https://papers.ssrn.com/sol3/papers.cfm?abstract_id=3526169. Also see Bradbury, John Charles. “Film Tax Credits and the Economic Impact of the Film Industry on Georgia’s Economy,” Kennesaw State University, Bagwell Center Policy Brief, July 2019. https://coles.kennesaw.edu/econopp/docs/GA_FilmTaxCredit_policybrief1‐1.pdf 53 See MA (2020, 26); MD (2015, 47‐48); NY (2019, 18‐19); NC (2014, 7); OK (2016, 12); and PA (2019, 22). The Massachusetts Department of Revenue did not include the impact of FIT in their analysis, as they were “not aware of any published and peer‐reviewed study from a non‐interested party, measuring the direct and indirect impact of film credit‐induced tourism in an unbiased, objective manner. In fact, there have been some reports indicating that the findings and methodologies of those that do exist are controversial relative to the prevailing literature or otherwise “biased.”” (MA 2020, 26)

29
TABLE 2
State Film Incentive Program ROI Evaluations By Non‐Affiliated, Independent State Entities.
Year of Research or % of Reimbursement for ROI to the
State Report Report Sponsor Qualified Expenditures, etc. State
Alabama 2017 Department of Revenue 25 ‐ 35% ‐‐ 54 Alaska* 2012 Legislative Budget & Audit Cm 30 ‐ 44% $0.07 California 2014 Legislative Analyst’s Office 20 ‐ 25% $0.65 Florida* 2021 Office of Economic & Dem. Research 20 ‐ 30% $0.07
2018 Office of Economic & Dem. Research 20 ‐ 30% $0.18 2015 Office of Economic & Dem. Research 20 ‐ 30%
Credits Awarded, with Total Potential Costs Of redemptions in the 3‐Year review period: $0.25 Credits Awarded and Redeemed in 3‐Year Review Period: $0.43
Georgia 2020 Department of Audit & Accounts 20 ‐ 30% $0.10 Louisiana 2005 Legislative Fiscal Office $0.16 ‐ $0.18 Maryland 2015 Department of Legislative Services 25 ‐ 27% $0.06 Massachusetts 2020 Department of Revenue 25% $0.14 Michigan* 2010 Senate Fiscal Agency 42% $0.11 Mississippi 2015 Joint Legislative Committee, PEER 25 ‐ 35% $0.49 New Mexico 2008 Legislative Finance Committee 25% $0.14 North Carolina 2014 Legislative Services Office 25% $0.46 Oklahoma 2016 Incentive Evaluation Commission 35 ‐ 37% $0.13 Pennsylvania 2019 Independent Fiscal Office 25 ‐ 30% $0.13
2013 Independent Fiscal Office 25 ‐ 30% $0.14 Rhode Island 2018 Department of Revenue 25% $0.27 2008 Department of Revenue 25% $0.28 Virginia 2017 Joint Leg. Audit & Review Commission 15 ‐ 35% $0.20, 0.30 55 Washington 2016 Joint Leg. Audit & Review Committee 30 ‐ 35% $0.06
Evaluations by Affiliated State Entities Arizona* 2008 Department of Commerce 20 ‐ 30% $0.27 56 Connecticut 2017 Dept. of Economic & Com. Dev. 10 ‐ 30% ‐$0.8457
2013 Dept. of Economic Development 30% $0.11 2008 Dept. of Economic & Com. Dev. 30% $0.08
Louisiana 2019 Dept. of Economic Development 18 ‐ 25% $0.19 2013 Dept. of Economic Development 30 ‐ 35% $0.24
2011 Dept. of Economic Development 30 ‐ 35% $0.20 New York 2019 Empire State Development 30% (Production) $0.4858
30% (Post‐Production) $0.38 Oregon 2016 Gov. Office of Television and Film 20 ‐ 26% $0.67
An underlined state used a balanced budget analysis or offset in their calculation of ROI. For some evaluations, the ROI to the state was calculated by EDR using data provided in the published report. For Arizona, the ROI reflects combined state and local revenue as a separate breakout was not provided. * Sunset or Repealed as of June, 2020. The Florida Entertainment Industry Financial Incentive Program sunset 7‐1‐16.
54 While the report does not specify the ROI for the program, it does include tax expenditures and collections for two periods: 2009 – 2014, and 2015‐16, resulting in ROIs of $0.05 and $0.08, respectively. 55 The ROI for the tax credit program is $0.22, and $0.30 for the grant program. 56 The ROI includes revenue generated by local governments. 57 The ROI of the Connecticut program for 2006‐2014 does not take payroll into account as they assume most of it is removed from the state. However, the analysis does account for the payroll taxes in state revenue collections. 58 New York includes all production and post‐production expenditures from the incentivized projects in its analysis, rather than just the costs from qualified expenditures.

30
REFERENCES Bradbury, John Charles. 2020. A Comment on Georgia Department of Economic Development Report: “The Economic Impact of the Film Industry in Georgia” https://papers.ssrn.com/sol3/papers.cfm?abstract_id=3526169 Bradbury, J.C. 2020. Do Movie Production Incentives Generate Economic Development? Contemporary Economic Policy. 38(2): 327‐42. https://papers.ssrn.com/sol3/papers.cfm?abstract_id=3526169 Bradbury, John Charles. 2019. Film Tax Credits and the Economic Impact of the Film Industry on Georgia’s Economy. Bagwell Center Policy Brief, July 2019. https://coles.kennesaw.edu/econopp/docs/GA_FilmTaxCredit_policybrief1‐1.pdf Bradbury, John Charles. 2019. Can Movie Production Incentives Grow the Economy? Evidence from Georgia and North Carolina. http://dx.doi.org/10.2139/ssrn.3432035 Button, Patrick. 2019. Do tax incentives affect business location? Evidence from motion picture production incentives. Regional Science and Urban Economics, July 2019: 315‐339. https://www.sciencedirect.com/science/article/abs/pii/S0166046218300152
Button, Patrick. 2018. Can Tax Incentives Create a Local Film Industry? Evidence from Louisiana and New Mexico. Journal of Urban Affairs. December 2018. https://www.tandfonline.com/doi/abs/10.1080/07352166.2018.1530570
Cardoso, Lucilia, CMS Estevao, CI Fernandes & H Alves. 2017. Film Induced Tourism: A Systematic Literature Review. Tourism and Management Studies. 13(3). IBISWorld “US Industry (NAICS) Report 51211a,” Accessed 7‐21‐20 Leiser, Stephanie. 2017. The Diffusion of State Film Incentives: A Mixed‐Methods Case Study. Economic Development Quarterly. 31(3), 255‐267. https://journals.sagepub.com/doi/abs/10.1177/0891242417710715 MNP, LLP. New Mexico Film Production: Tax Incentive Study. Phase III Report, July 2016. Analysis of the effects that the film and television industry has on the New Mexico tourism industry. MNP, LLP. https://www.ncsl.org/Portals/1/Documents/fiscal/evaluation_database/New_Mexico_Film_Production_Tax_Incentive_Study_PhaseIII_Report.pdf MNP, LLP. New Mexico Film Production Tax Incentive Study, Phase I Report, July 21, 2014. MNP, LLP. https://www.ncsl.org/Portals/1/Documents/fiscal/evaluation_database/New_Mexico_Film_Production_Tax_Incentive_Study_PhaseI_Report.pdf
MNP, LLP. 2013. Economic and Social Impacts of the Florida Film and Entertainment Industry Financial Incentive Program. https://www.motionpictures.org/wp‐content/uploads/2014/01/Economic‐and‐Social‐Impacts‐of‐the‐Florida‐Film‐and‐Entertainment‐Industry‐Financial‐Incentive‐Program.pdf
MNP, LLP. 2013. Supplementary Report on Film Induced Tourism. O’Brien, Nina O. and Christianne J. Lane. 2018. Effects of economic incentives in the American film industry: an ecological approach. Regional Studies, 52(6): 865–875 Owens, M. and Rennhoff, A. 2019. Motion picture production incentives and filming location decisions: A discrete choice approach. Journal of Economic Geography. 20(3), 679‐709. (https://academic.oup.com/joeg/advance‐article‐abstract/doi/10.1093/jeg/lby054/5205905).

31
Pollard, Randle B. (2017) "Cut ‐ and That's a Wrap" ‐ The Film Industry's Fleecing of State Tax Incentive Programs. Akron Law Review. 50:3, Article 2. http://ideaexchange.uakron.edu/akronlawreview/vol50/iss3/2 Sewordor, Emefa and David L. Sjoquist. 2016. Lights, Camera, Action: The adoption of State Film Tax Credits. Public Budgeting and Finance, 36(2): 5‐25 Swenson, C.W. (2017). Preliminary evidence on film production and state incentives. Economic Development Quarterly, 31(1): 65‐80. (https://journals.sagepub.com/doi/full/10.1177/0891242416674807 ) Thom, Michael. 2019. Do State Corporate Tax Incentives Create Jobs? Quasi‐experimental Evidence from the Entertainment Industry. State and Local Government Review. 51(2): 92‐103. https://journals.sagepub.com/doi/full/10.1177/0160323X19877232 Thom, Michael. 2018a. Time to Yell “Cut?” An Evaluation of the California Film and Production Tax Credit for the Motion Picture Industry. California Journal of Politics and Policy, 10(1): 1‐20. https://escholarship.org/content/qt3rf6v988/qt3rf6v988.pdf Thom Michael. 2018b. Lights, Camera, but No Action? Tax and Economic Development Lessons From State Motion Picture Incentive Programs. The American Review of Public Administration. 48(1): 33‐51. https://journals.sagepub.com/doi/full/10.1177/0275074016651958 Thom, Michael, and Brian An. 2017. Fade to Black? Exploring Policy Enactment and Termination through the Rise and Fall of State Tax Incentives for the Motion Picture Industry. American Politics Research 45(1): 85–108. https://journals.sagepub.com/doi/abs/10.1177/1532673X16661819 Xu, Tina. 2016. “Staying In Hollywood and The Big Apple: The Effectiveness And Design Of Film Production Tax Credits In New York And California” Columbia Business Law Review, 2016(2): 426‐474. Zinn, David. 2010. “Film Incentives in Michigan.” Report issued by the Michigan Senate Fiscal Agency. http://www.senate.michigan.gov/sfa/publications/issues/filmincentives/film incentives.pdf

32
REFERENCES for State Film Incentive Program ROI Evaluations in TABLE 2) Alabama
Murray, Matthew and Donald Bruce. 2017. Evaluation of Alabama’s Entertainment Industry Incentive Program and New Markets Development Program, Alabama Department of Revenue, March 9, 2017. http://media.al.com/news_mobile_impact/other/AL%20ENTERTAIN%20NEWMKTS%203%209%2017.pdf https://revenue.alabama.gov/tax‐incentives/tax‐incentive‐reports/ Addy, Samuel. 2015. “An Evaluation of the Alabama Entertainment Industry Incentives Program.” Report prepared for the University of Alabama Center for Economic Development.
Alaska “Special Report on the Alaska Film Production Tax Incentive Program,” Legislative Budget and Audit Committee, Division of Legislative Audit, Alaska State Legislature, August 8, 2012. http://www.legaudit.state.ak.us/pages/audits/2012/pdf/30066rpt.pdf
Arizona “Motion Picture Production Tax Incentives Program, Annual Report (2008),” Arizona Department of Commerce.
California “An Update on California's Film Tax Credit Programs,” Legislative Analyst’s Office, July 2019. https://lao.ca.gov/LAOEconTax/Article/Detail/388
“Film and Television Tax Credit Programs: Progress Report,” California Film Commission (November 2019). http://film.ca.gov/wp‐content/uploads/CA‐Tax‐Credit‐Progress‐Report‐2019.pdf
“Film and Television Tax Credit Programs: Progress Report,” California Film Commission (November 2018). http://film.ca.gov/wp‐content/uploads/CA‐Tax‐Credit‐Progress‐Report‐FINAL‐DRAFT‐11‐2‐18.pdf “California’s First Film Tax Credit Program,” Legislative Analyst’s Office, September, 2016. https://www.ncsl.org/Portals/1/Documents/fiscal/evaluation_database/2016_Californias_First_Film_Tax_Credit_Program.pdf
“Overview of Motion Picture Industry and State Tax Credits (2014),” Legislative Analyst Office. http://www.lao.ca.gov/reports/2014/finance/tax‐credit/film‐tv‐credit‐043014.pdf
Connecticut “An Assessment of Connecticut’s Tax Credit and Abatement Programs,” Department of Economic and Community Development, September 2014. http://www.ct.gov/ecd/lib/ecd/decd_sb_501_sec_27_report_revised_2013_final.pdf
“The Economic and Fiscal Impacts of Connecticut’s Film Tax Credit,” Department of Economic & Community Development, February 2008. http://www.ct.gov/cct/lib/cct/Film_Tax_Credit_Study_‐_Final.pdf
Florida “Return‐on‐Investment for the Entertainment Industry Incentive Programs,” Office of Economic & Demographic Research, January 2021. http://edr.state.fl.us/Content/returnoninvestment/EntertainmentIndustryIncentivePrograms2021.pdf
“Return‐on‐Investment for the Entertainment Industry Incentive Programs,” Office of Economic & Demographic Research, January 2018. http://edr.state.fl.us/Content/returnoninvestment/EntertainmentIndustryIncentivePrograms2018.pdf “Return‐on‐Investment for the Entertainment Industry Incentive Programs,” Office of Economic & Demographic Research, January 2015. http://edr.state.fl.us/Content/returnoninvestment/EntertainmentIndustryIncentivePrograms.pdf
Georgia Georgia Department of Audits and Accounts (DOAA) 2020. “Impact of the Georgia Film Tax Credit. https://www.audits.ga.gov/rsaAudits/
“Impact of the Georgia Film Tax Credit, “Georgia Department of Economic Development. January, 2020. https://www.audits.ga.gov/rsaAudits/
Louisiana “Film and Video Tax Incentives: Estimated Economic and Fiscal Impacts,” Greg Albrecht, Chief Economist, LA Legislative Fiscal Office, March, 2005. http://lfo.louisiana.gov/files/revenue/FilmVideoIncentives.pdf
“Economic and Fiscal Impact of Louisiana Entertainment Tax Credits.” Camoin Associates, 2019. https://louisianaentertainment.gov/docs/default‐source/default‐library/2019‐economic‐fiscal‐impact‐of‐louisiana‐entertainment‐tax‐credits.pdf

33
“The Economic Impact of Louisiana’s Entertainment Tax Credit Program.” Loren C. Scott & Associates, Inc., April 2013. http://louisianaentertainment.gov/docs/main/2013_OEID_Program_Impact_Report_(FINAL).pdf
“Fiscal & Economic Analysis of Louisiana’s Entertainment Incentives,” BaxStarr Consulting Group, LLC., April 18, 2011. http://louisianaentertainment.gov/docs/main/louisiana_entertainment_2011_economic_impact_analysis.pdf
Maryland “Evaluation of the Maryland Film Production Activity Tax Credit,” Maryland Department of Legislative Service, Office of Policy Analysis, September, 2015. https://www.ncsl.org/Portals/1/Documents/fiscal/evaluation_database/Evaluation_of_the_Maryland_Film_Production_Activity_Tax_Credit.pdf
Massachusetts Massachusetts Department of Revenue. 2020. Report on the Impact of Massachusetts Film Industry Tax Incentives through Calendar Year 2016. https://archives.lib.state.ma.us/bitstream/handle/2452/821522/ocn898214406‐2016.pdf?sequence=1&isAllowed=y
Massachusetts Department of Revenue. 2009. Report on the Massachusetts Film Industry Tax Incentive. file:///C:/Users/COOPER.DAVID/Documents/EDI%20‐%20Film/Mass%20DOR%202009%20film%20incentive%20report%20.pdf
Michigan “Film Incentives in Michigan,” David Zin, Economist, Senate Fiscal Agency, September 2010. http://www.senate.michigan.gov/sfa/publications/issues/filmincentives/filmincentives.pdf
Mississippi Joint Legislative Committee on Performance Evaluation and Expenditure Review (PEER). 2015. An evaluation of the effectiveness of the Mississippi film office. Report to the Mississippi Legislature. Peer Report 602. https://www.peer.ms.gov/reports/rpt602.pdf
New Mexico “The Film Industry in New Mexico and the Provision of Tax Incentives,” Anthony V. Pop and James Peach, Arrowhead Center, Office of Policy Analysis, New Mexico State University, August 26, 2008. http://arrowheadcenter.nmsu.edu/sites/default/files/uploadecd/filmindustryfinal.pdf
New York “Economic Impact Of The Film Industry In New York State, 2017 & 2018,” Prepared for Empire State Development. May, 2019. https://esd.ny.gov/sites/default/files/Camoin_NYS‐FilmReport‐2017‐18.pdf
North Carolina McHugh, Patrick and Barry Boardman, Fiscal Research Division of the Legislative Services Office of the North Carolina General Assembly, Memo to Representative Rich Catlin, RE: Preliminary Review of Handfield Film Study, 4/03/14. http://www.wral.com/asset/news/state/nccapitol/2014/10/10/14064037/Review_of_Handfield_Film_Study_‐_Rep_Catlin_1_.pdf
Oklahoma State of Oklahoma Incentive Evaluation Commission: “Film Enhancement Rebate Program, Final Report.” November 28, 2016. https://iec.ok.gov/sites/g/files/gmc216/f/Film%20Incentive%20Rebate%20Final%20Evaluation_112817.pdf
Oregon The Media Industry in Oregon: Incentive and Impact Analysis,” Northwest Economic Research Center College of Urban and Public Affairs, December, 2016. https://www.pdx.edu/nerc/sites/www.pdx.edu.nerc/files/NERC%202016%20Oregon%20Film%20Report%20Final%202‐2.pdf
Pennsylvania Pennsylvania Film Production Tax Credit: An Evaluation of Program Performance, January, 2019. Pennsylvania Independent Fiscal Office. https://www.pafia.org/resources/Documents/TC_2019_Film_Production_Tax_Credit_Report.pdf
“Uncapping the Film Production Tax Credit: A Fiscal and Economic Analysis,” Special Report 2013‐5, Independent Fiscal Office of the PA General Assembly, May 31, 2013. http://finance.pasenategop.com/files/2013/10/IFO‐Report‐on‐Film‐Production‐Tax‐Credit.pdf
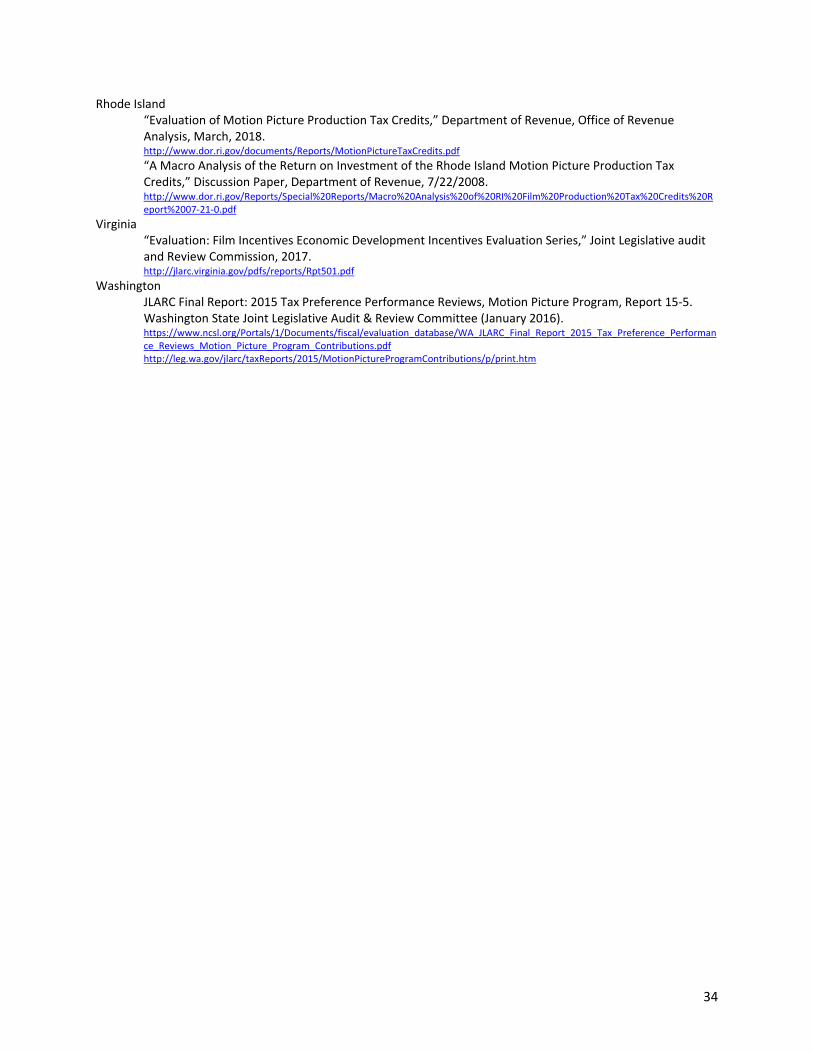
34
Rhode Island “Evaluation of Motion Picture Production Tax Credits,” Department of Revenue, Office of Revenue Analysis, March, 2018. http://www.dor.ri.gov/documents/Reports/MotionPictureTaxCredits.pdf
“A Macro Analysis of the Return on Investment of the Rhode Island Motion Picture Production Tax Credits,” Discussion Paper, Department of Revenue, 7/22/2008. http://www.dor.ri.gov/Reports/Special%20Reports/Macro%20Analysis%20of%20RI%20Film%20Production%20Tax%20Credits%20Report%2007‐21‐0.pdf
Virginia “Evaluation: Film Incentives Economic Development Incentives Evaluation Series,” Joint Legislative audit and Review Commission, 2017. http://jlarc.virginia.gov/pdfs/reports/Rpt501.pdf
Washington JLARC Final Report: 2015 Tax Preference Performance Reviews, Motion Picture Program, Report 15‐5. Washington State Joint Legislative Audit & Review Committee (January 2016). https://www.ncsl.org/Portals/1/Documents/fiscal/evaluation_database/WA_JLARC_Final_Report_2015_Tax_Preference_Performance_Reviews_Motion_Picture_Program_Contributions.pdf http://leg.wa.gov/jlarc/taxReports/2015/MotionPictureProgramContributions/p/print.htm


