3 On-line Optodynamic Monitoring of Laser Materials Processing Janez Diaci and Janez Možina University of Ljubljana, Faculty of Mechanical Engineering Slovenia 1. Introduction A new term “optodynamics” has been introduced to describe a wide range of optically induced dynamic phenomena (Možina & Hrovatin, 1996). A laser pulse is considered not only as a tool in laser material processing but also as a generator of information about the material transformation. The information is retained and conveyed by different kinds of optically induced mechanical waves generated during laser material interaction. Several generation/detection schemes have been developed to extract this information especially in the field of non-destructive material evaluation (laser ultrasonics). In a wider aspect these techniques can be used for optodynamic monitoring and characterization of laser cutting, drilling, welding and other laser material processing methods. Fig. 1. Optodynamic phenomena during laser material interaction Fig. 1 shows a schematic of optodynamic (OD) phenomena that occur during pulsed laser - material interaction. Material irradiated by short laser pulses becomes rapidly locally overheated. Its temperature may exceed vaporization temperature, the mixture of vapor and surrounding gas may become ionized forming a plasma cloud above the irradiated surface. This local thermal nonequilibrium relaxes through emission of light, heat conduction and various forms of macroscopic material motion, e.g. mechanical waves that propagate through the workpiece and the surrounding gas. Blast and acoustic waves, which propagate www.intechopen.com
Transcript
3
On-line Optodynamic Monitoring of Laser Materials Processing
Janez Diaci and Janez Možina University of Ljubljana, Faculty of Mechanical Engineering
Slovenia
1. Introduction
A new term “optodynamics” has been introduced to describe a wide range of optically induced dynamic phenomena (Možina & Hrovatin, 1996). A laser pulse is considered not only as a tool in laser material processing but also as a generator of information about the material transformation. The information is retained and conveyed by different kinds of optically induced mechanical waves generated during laser material interaction. Several generation/detection schemes have been developed to extract this information especially in the field of non-destructive material evaluation (laser ultrasonics). In a wider aspect these techniques can be used for optodynamic monitoring and characterization of laser cutting, drilling, welding and other laser material processing methods.
Fig. 1. Optodynamic phenomena during laser material interaction
Fig. 1 shows a schematic of optodynamic (OD) phenomena that occur during pulsed laser - material interaction. Material irradiated by short laser pulses becomes rapidly locally overheated. Its temperature may exceed vaporization temperature, the mixture of vapor and surrounding gas may become ionized forming a plasma cloud above the irradiated surface. This local thermal nonequilibrium relaxes through emission of light, heat conduction and various forms of macroscopic material motion, e.g. mechanical waves that propagate through the workpiece and the surrounding gas. Blast and acoustic waves, which propagate
www.intechopen.com
Advanced Knowledge Application in Practice
38
in air surrounding the workpiece, have been studied using microphone detection as well as various set-ups of the laser beam deflection probe (LBDP). These techniques provide time resolved information at certain points in space. Various fast imaging techniques have been used on the other hand to acquire spatially resolved information at certain points in time. Ultrasonic waves propagating through the workpiece have been studied using piezoelectric transducers and laser interferometers. In the first part of this chapter we present various OD detection methods which have been developed during our research work in this field in recent years. In the subsequent part we discuss applications of these methods in particular laser processing applications focusing on the ones that exhibit the potential for on-line process monitoring.
2. Optodynamic detection
2.1 OD waves in air Suitable detection methods represent one of the foundations of on-line process monitoring methods. When it comes to detection of sonic waves in air, the microphone comes forward as an almost obvious choice. It is widely available, the technology is mature and well understood, it has high sensitivity, it is simple to set-up and use, all of which are important advantages from the viewpoint of a potential application. It does, however, suffer from serious drawbacks in terms of detection bandwidth and dynamic range which are needed when very short acoustic and blast waves of high amplitude are to be detected, a quite common requirement in pulsed laser process monitoring. The LBDP is a newer technique that allows non-contact, high bandwidth detection of high amplitude waves close to the processing spot. We hypothesize that the signal detected in that region contains more information about the process than the signals detected in the far-field region. Fig. 2 shows a schematic of a typical LBDP set-up employed to study OD phenomena during pulsed laser processing (Diaci & Možina, 1994).
Fig. 2. A typical LBDP set-up
We ablate the samples by a Q-switched Nd:YAG laser with the beam focused to a spot of 0.5 mm in diameter on the ablated surface (Fig. 2). The sample assembly and the focusing lens are mounted together on a mechanical translator allowing precise setting of the distance rs while maintaining constant focusation of the ablation beam. Nearly spherical blast waves are generated by the ablation laser pulse and propagated in air. A He-Ne laser is used as a source of the probe beam, aligned parallel to the irradiated surface and perpendicular to the
www.intechopen.com
On-line Optodynamic Monitoring of Laser Materials Processing
39
ablation beam. Refractive index gradients that exist within the region encompassed by the blast wave due to density gradients cause transient deflection of the probe beam. We detect this deflection by means of a quadrant photodetector with a 2.5 MHz bandwidth. Alternative detection method by a knife edge and a photodiode can also be used (Diaci & Možina, 1992), especially if a high-speed quadrant photodetector is not available. The two discussed OD detection methods (microphone and LBDP) have their own strengths and weaknesses. To examine them in a quantitative way we conducted a comparative study of the two detection systems (Diaci & Možina, 1992). We have examined blast waves generated in air during laser ablation of absorbing samples with Nd:YAG laser pulses. Blast waves were detected simultaneously by a wideband microphone and a LBDP set-up. In order to explain the experimental data we employed the weak shock solution of the point explosion model. The blast energy of each signal was determined, using measured wavefront transition times and the theoretical shock trajectory. Comparing detected signals with the corresponding theoretical pressure waveforms in the time and frequency domain, we found good agreement on several waveform evolution features. A further proof of the adequacy of the adopted model was obtained by examination of response functions, determined by applying deconvolution to measured signals and the corresponding theoretical pressure waveforms. With both detection systems we found that response functions, obtained from quite different signals, matched very well. In addition, the microphone transfer function agreed with the calibration data supplied by the manufacturer.
Fig. 3. A comparison of microphone (left) and LBDP (right) OD signals and their spectra. Reprinted from (Diaci & Možina, 1992) with kind permission from Springer Science+Business Media
We find the microphone somewhat easier to use, but the performance of the laser probe could be improved in this respect by building it as a compact instrument. With the laser probe, all the important performance parameters (bandwidth, dynamic range, sensitivity) can be changed and adapted optimally to a particular experimental situation, while with the microphone they are fixed. We therefore consider the laser probe as a more versatile tool for studying laser generated blast waves. Most beam deflection studies employ a relatively simple arrangement where the probe beam interacts with the wave only once. Much more information about the wave field, however, can be gained by using an arrangement where the beam interacts with the wave field several
www.intechopen.com
Advanced Knowledge Application in Practice
40
times. For this purpose we have developed a novel “multiple-pass” LBDP arrangement for detection of acoustic and weak shock waves in fluids (Diaci & Možina, 1995). The probe beam is folded by two parallel plane mirrors in such a way that the probe beam passes the wave propagation region several times before it reaches the deflection-detecting photodetector (Fig. 4 - left). In this way the probed wave interacts with several segments of the probing beam in sequence. A single oscilloscope trace of the photodetector output thus opens the possibility to study the evolution of the probed wave at several distances from the source. A large number (40 at present) of reflections is possible which can be altered easily by changing the angle of incidence. To demonstrate the potentials of the arrangement we present waveforms of spherical blast waves detected in air during laser ablation of solid samples (Fig. 4 - right). Two variants of the folded arrangement were examined. The one with the probe beam traveling from the laser to the detector in a zigzag path in the same direction as the acoustic wave we call the “co-directional” arrangement while the other one where the two directions are opposite we label the “counter-directional” one. We have developed a theoretical model that qualitatively explains the most characteristic features of both arrangements. The counter-directional arrangement exhibits low sensitivity for strong signals and high sensitivity for weak signals, a property which is very convenient in many cases. Measurement of time delays between successive pulses, for example, is much easier and more precise when the successive pulses have equal amplitudes. The other advantage is a clear visualization of the evolution of wave forms.
Fig. 4. Multiple-pass LBDP in a counter-directional arrangement (left) and the corresponding detected signals (right). Reprinted from (Diaci & Možina, 1995) with kind permission from American Institute of Physics
While microphone and LBDP provide time resolved information at certain points in space, various fast imaging techniques have been developed to acquire spatially resolved information at certain points in time. As these two approaches are single-pointed in one domain, a problem arises if the space-time evolution of the event needs to be assessed. With the techniques referred to above it is still possible to average by repeating the measurement and varying the single-pointed parameter. However, to obtain meaningful results in such a case, the phenomenon under study has to be reasonably reproducible. We have developed a
www.intechopen.com
On-line Optodynamic Monitoring of Laser Materials Processing
41
set-up employing two complementary techniques that allows monitoring the spatial and temporal evolution of non-reproducible optodynamic events (Diaci et al., 1996). A high-speed cineholography system provides a sequence of spatially resolved information (8 holograms separated by 28 ns) while a beam deflection probe provides temporally resolved information at 6 discrete spatial points over a 4.5 mm distance above the target. A schematic of the key part of the combined system is shown in Fig. 5. The holographic recording beams (Fig. 5 — top view) were generated by a high-power frequency-doubled Q-switched Nd:YAG laser. Its output beam was directed into a phase-front-preserving optical delay line. A specially made step-graded beam splitter allowed light to exit the cell in the form of 8 beams of equal energy. Each output beam from the delay line was split into object and reference beams. The object beams were arranged so that lay on a plane parallel to the ablated surface and that each interrogated the test volume at a slightly different angle. The object beams were then combined with the corresponding reference beams at the film plane. As a result of the beam diameter at the film plate and the angular separation between beams, the holographic images were spatially and angularly multiplexed. The second technique was a multiple-pass LBPD, similar to the one described above. A He-Ne probe beam was directed into the test volume where it passed six times between two parallel silver mirrors, separated by 20 mm, in a plane perpendicular to the ablated surface (Fig. 1 — side view). A long focal length lens was used to focus the probe beam to a 0.3 mm waist located within the test volume. In this way the segments of the beam that interacted with the shock lay in the Rayleigh range of the beam.
Fig. 5. A set-up for simultaneous detection of shock waves by a high-speed cineholography system and a multiple-pass LBDP. Reprinted from (Diaci et al., 1996) with kind permission from Elsevier
These techniques have been applied to investigate the shock dynamics resulting from the laser ablation of metallic samples. With the holographic set-up we examined the early
www.intechopen.com
Advanced Knowledge Application in Practice
42
period of shock evolution (the strong shock region) and with the beam deflection probe the subsequent transition through the intermediate into the weak shock range. By combining the two techniques we were able to examine a fairly broad range of the shock lifetime in time and space domain. The described holographic set-up is rather complex and difficult to set-up. We have subsequently developed a much simpler method which can provide quite similar results (Perhavec & Diaci, 2010). A novel double-exposure shadowgraph method allows visualization of an expanding shock wave in two time instances on a single image. The shock wave is illuminated by pulsed green laser light coupled into two optical fibers (Fig. 6) of different lengths to establish two illumination flashes separated by a fixed time delay. An image of the shock wave region, acquired by a digital still camera, exhibits two well separated shock wavefronts. The optical set-up was analyzed using a paraxial ray model to explain the observed eccentricity of the two acquired wavefronts and provide guidelines for assembling the set-up. The method has been developed to study shock waves generated in air during interaction of Er:YAG laser light with water and biological tissues.
Fig. 6. A novel double-exposure shadowgraph set-up. Reprinted from (Perhavec & Diaci, 2010) with kind permission from Strojniški vestnik – Journal of Mechanical Engineering
2.2 OD waves in the workpiece OD waves propagating through the workpiece have been studied using piezoelectric transducers and laser interferometers. A arm compensated Michelson interferometer has been developed to study the laser ablation process from a novel, optodynamic aspect (Hrovatin & Možina, 1995). Fig. 7 shows the schematic of the set-up. The beam from a He-Ne laser is split into the reference and measurement arm. The reference beam is reflected from a mirror mounted on a piezoelectric device driven by a low frequency stabilizer circuit to maintain the optimum optical path difference. The detected signals are amplified and digitized by a sampling oscilloscope. The interferometer detects normal ultrasonic displacements with bandwidth between 150 kHz and 60 MHz, governed by the amplifier. The sensitivity in the linear part of the
characteristics is S = 4πV0/λ, where V0 is the peak output voltage when a long displacement
is observed by the unstabilized interferometer and λ is the laser wavelength. Simultaneous detection of OD waves in air and workpiece using a LBDP/microphone and interferometer, respectively was used to characterize the ablation dynamics. In this way the
www.intechopen.com
On-line Optodynamic Monitoring of Laser Materials Processing
43
Fig. 7. A set-up for simultaneous detection of OD wave is air and in the workpiece. Reprinted from (Hrovatin & Možina, 1995) with kind permission from Elsevier
influence of the laser pulse parameters and of the interacting material on the ablation process was assessed. By the analysis of the laser drilling process of thin layered samples the material influence was demonstrated. Besides the ultrasonic evaluation of the laser pulse power density the plasma shielding for 10 ns laser pulses was analyzed by the same method. A practical optodynamic study was performed to determine the usability of different lengths of laser pulses for the generation of ultrasonic transients in a solid material (Hrovatin et al., 2006). The aim of the study was to evaluate the possibility of a dual use for a laser pulse - for laser material processing on the one hand, and for the ultrasonic wave generation on the other - with both processes being combined on the same production line. The ultrasonic transients generated by ‘classical’ nanosecond laser pulses were compared with the transients generated by industrial laser pulses with duration of a few tenths of a microsecond. The experimental results were compared with the results of a time-of-flight analysis that also involved part of a mode-conversion analysis for both regimes in a layered material structure. The differences between the two waveforms were assessed in terms of their visibility, wavelength and resolution. The possibility of using an industrial marking laser for laser ultrasound generation was thus demonstrated. Recently, a homodyne quadrature laser interferometer (HQLI) has been developed as a powerful tool to study OD motion with high temporal resolution on longer time scales (Gregorčič et al., 2009). A schematic of the HQLI set-up is presented in Fig. 8. The light from a stabilized He-Ne laser is polarized at a 45° angle in the xy plane. The beam splitter (BS) splits
the beam into reference and measurement arms. A λ/8 wave plate (OWP) is placed in the reference arm. Two transitions (back and forth) through the OWP in the reference arm, gives
rise to the λ/4 phase difference between the orthogonal polarizations. The orthogonal polarizations in the measurement arm experience an equal phase shift due to the displacement of the target mirror. The polarizing beam splitter (PBS) transmits the x-polarization and reflects the y-polarization. Two interfering beams with polarizations in the x-plane, one from the reference arm and the other from the measurement arm, reach the photodiode PDx. Similarly, the perpendicular polarizations coming from both arms illuminate the photodiode PDy.
www.intechopen.com
Advanced Knowledge Application in Practice
44
Ideally, the interference signals on the photodiodes are shifted by λ/4 , which can be achieved with a properly rotated OWP. Two signals in quadrature (sin-cos) are thus obtained which allow measuring of a few hundred micrometer displacements with nanometer resolution. Band-pass filters (BFP) are placed in front of photodiodes to attenuate the scattered light. The high reflectivity (HR) mirror of the reference arm is driven by a piezoelectric transducer (PZT) which provides harmonic vibration that aids the system setting-up. The sample with a mirror-polished rear surface is placed in the measurement arm. The ultrasonic displacement (u(t)) is caused by the laser ablation of the front surface.
Fig. 8. Top view of a homodyne quadrature laser interferometer (HQLI)
The influence of quadrature phase shift on the measured displacement error was experimentally investigated using a HQLI (Gregorčič et al., 2009). Common nonlinearities, including the phase-shift error, were determined and effectively corrected by a robust data-processing algorithm. The measured phase-shift error perfectly agrees with the theoretically determined phase-shift error region. This error is systematic, periodic and severely asymmetrical around the nominal displacement value. We performed a single-shot, contactless measurement of ultrasonic waves on a laser-propelled rod with a HQLI during the entire duration of its motion (Požar et al., 2009). This is the first such experimental demonstration of a laser-induced, elastic-body motion, where all the most important mechanisms that reveal the nature of its motion are presented and explained from a single-shot measurement. Furthermore, these measurements quantitatively demonstrate that the HQLI is an appropriate tool for monitoring high-amplitude (>1 μm) and high-frequency (up to 200 MHz) ultrasonic waves on moving objects. It has a constant sensitivity and can measure a total displacement of ~1mm with a resolution and accuracy of 1 nm, i.e., it covers a dynamic range of 106.
3. Applications
3.1 Laser drilling Laser drilling is used to machine very small holes, unusual-shaped holes, blind holes, precisely tapered holes, holes at steep angles, holes with small diameter and high aspect
www.intechopen.com
On-line Optodynamic Monitoring of Laser Materials Processing
45
ratio, etc. It makes possible to drill holes into difficult-to-machine materials. Current industrial laser drilling stations employ monitoring and control systems that rely parameters such as the laser power, pulse duration, energy, beam quality, the distance between the workpiece and the focusing lens etc. More refined systems would allow monitoring the result of the process on-line. A promising approach to developing such monitoring systems is based on the acquisition and analysis of OD signals, generated during the process. We have conducted several studies to develop and refine OD monitoring methods in laser drilling using a variety of lasers and materials. We studied laser drilling of different woods using a free-running pulsed Er:YAG laser (Grad & Možina, 1998). Very long and narrow holes with depth-to-diameter ratio above 100 could be achieved which is an indication of the occurrence of laser beam trapping within the hole. The process has been investigated as a typical optodynamic process. Optoacoustic waves in air above the irradiate surface were detected by microphone and analyzed to monitor the hole depth produced by consecutive laser pulse exposure of the same spot. Measurements of laser drilling rate were performed. Fig. 9shows a typical result that illustrates the potential of OD detection for process monitoring. The macro photography in the upper part shows a high-aspect-ratio hole running horizontally from left to right and the growth rings running diagonally through the image. The diameter of the entry hole is 1 mm.
Fig. 9. Energy of optoacoustic signals vs. wood density profile. Reprinted from (Grad & Možina, 1998) with kind permission from Elsevier
Below the image is a diagram, which relates energy EOA
2
1
2( )t
OA tE y t dt= ∫ (1)
of the microphone signal y(t) with the depth H of the hole, which has been determined from the number N of successive laser pulses. The relation between H and N had been established by another experiment where several holes were drilled in the wood sample using different number N of laser pulses. The sample was subsequently ground in a parallel plane to the holes’ axis to determine the hole depth H corresponding to a particular N. As evident from Fig. 1, local peaks of EOA correspond to local areas of increased wood density. Information on inner density profile of the wood can be obtained through these measurements. Pulsed laser drilling of laminated aluminum with a Q-switched Nd:YAG laser was studied to explore the possibility of on-line monitoring of the hole depth growth (Strgar, et al., 2000).
www.intechopen.com
Advanced Knowledge Application in Practice
46
The optodynamic responses were acquired by means of a single LBDP which detected shock waves generated in surrounding air during the drilling process. Detected signals were processed and analyzed to extract the optodynamic characteristics of the drilling process. The characteristics were correlated with geometric properties of the holes. A simple and reliable method for determining the depth of holes was developed. Specimens were produced by firmly pressing together a stack of thin sheets of uniform and equal thickness. After the processing the sheets were separated. The resulting hole depth was estimated from the number of sheets pierced. Experiments were performed to examine how the LBDP signal characteristics, hole depth, and material removal rate change with the number of consecutive laser pulses. A strong correlation between the depth of the laser-drilled hole and an optodynamic response was found and examined. It was found, however, that supersonic propagation of the shock wavefront introduces a systematic error into the OD depth measurement. To evaluate this phenomenon more closely we employed simultaneous detection of OD waves in air and in the workpiece by means of a LBDP and a piezoelectric transducer, respectively (Strgar & Možina, 2002a). Fig. 10 shows the set-up.
Fig. 10. A schematic of the set-up for simultaneous detection of OD signals by a LBDP and a piezoelectric transducer (top). Typical detected signals by the piezoelectric transducer (bottom-left) and LPDP (bottom-right). Reprinted from (Strgar & Možina, 2002a) with kind permission from Elsevier
The increasing depth H of the hole and its maximum extent were estimated from changes in the propagation time (tw and ta) of the ultrasonic waves traveling from the bottom of the hole to both detectors. Measurements of the maximum hole depth were compared with the predictions of a theoretical model and they were found to be in a good agreement. A further study (Strgar & Možina, 2002b) in this area concentrated on the relationship
between the propagation time of the longitudinal stress wave in workpiece and the number
www.intechopen.com
On-line Optodynamic Monitoring of Laser Materials Processing
47
of consecutive laser pulses. The aim was to develop a method for determining the depth of
laser-drilled holes in real time. Piezoelectric detection was used. Fig. 11 shows a typical
obtained result.
Fig. 11. Propagation time of the longitudinal stress waves vs. the number of consecutive laser pulses during laser drilling of a 1.2-mm thick stainless-steel sample. Experimental data are fitted with an exponential curve. Reprinted from (Strgar & Možina, 2002b) with kind permission from Springer Science+Business Media
We found that during laser drilling of a blind hole the propagation time tm(N) of the longitudinal stress waves in material decreases with the number of consecutive laser pulses N in a way which could be approximated by an exponential function:
tm(N) = tmf+(tmi−tmf)·exp(−N/N0) (2)
where tmi and tmf are the initial and the final propagation times, respectively, and N0 is the characteristic laser pulse number. The initial and final propagation times were measured while the characteristic laser pulse number was determined from a comparison of the calculated values and the experimental data. We have verified that the final depth Hf of the hole can be determined from:
Hf = cm (tmi−tmf) (3)
where cm is the propagation velocity of the longitudinal stress wave through the material. Building on these observations, a further study was conducted aimed at analyzing pulsed laser micro-drilling of different metals (Petkovšek et al., 2006). The OD waves were detected by using the arm compensated Michelson interferometer. Monitoring of the main parameters of the micro drilling such as material ablation rate and efficiency was realized by analysis of the optodynamic signals. The process is characterized by decreasing ablation rate that leads to the finite hole depth. In order to describe decreasing ablation rate a theoretical model based on the energy balance has been proposed. It considers the energy/heat transfer from the laser beam to the material and predicts a decreasing drilling rate with an increasing number of successive laser pulses. According to the proposed model, the finite depth of the hole appears as a consequence of the increasing surface area through which the energy of
www.intechopen.com
Advanced Knowledge Application in Practice
48
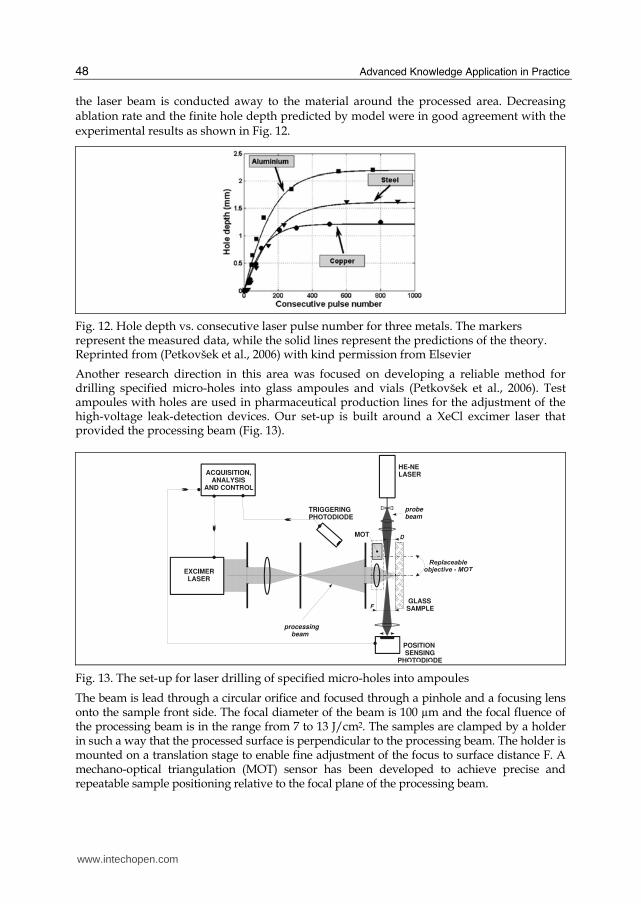
the laser beam is conducted away to the material around the processed area. Decreasing ablation rate and the finite hole depth predicted by model were in good agreement with the experimental results as shown in Fig. 12.
Fig. 12. Hole depth vs. consecutive laser pulse number for three metals. The markers represent the measured data, while the solid lines represent the predictions of the theory. Reprinted from (Petkovšek et al., 2006) with kind permission from Elsevier
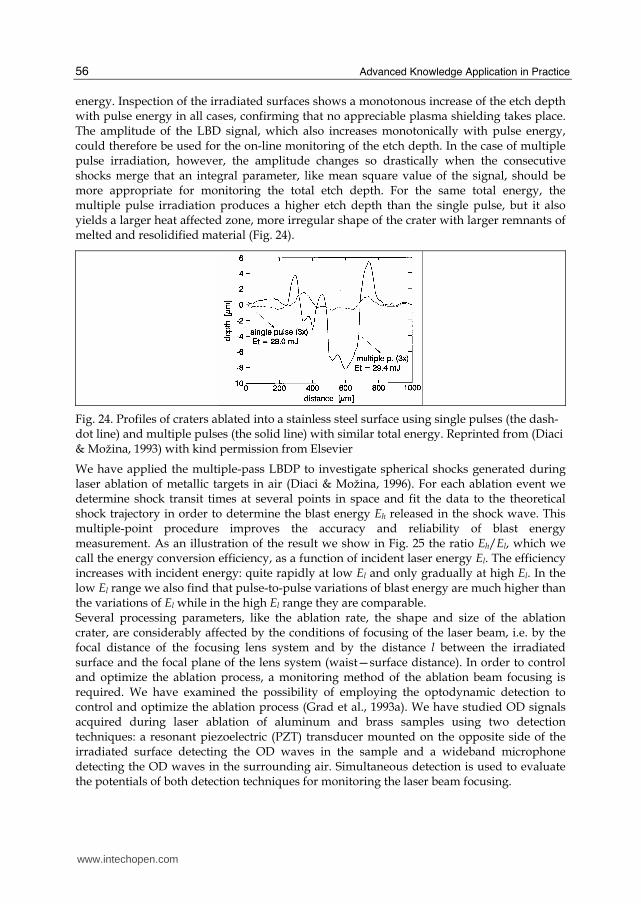
Another research direction in this area was focused on developing a reliable method for drilling specified micro-holes into glass ampoules and vials (Petkovšek et al., 2006). Test ampoules with holes are used in pharmaceutical production lines for the adjustment of the high-voltage leak-detection devices. Our set-up is built around a XeCl excimer laser that provided the processing beam (Fig. 13).
GLASSSAMPLE
HE-NELASER
POSITION SENSINGPHOTODIODE
F
TRIGGERINGPHOTODIODE
D
ACQUISITION, ANALYSISAND CONTROL
EXCIMER LASER
processing beam
probebeam
MOT
Fig. 13. The set-up for laser drilling of specified micro-holes into ampoules
The beam is lead through a circular orifice and focused through a pinhole and a focusing lens onto the sample front side. The focal diameter of the beam is 100 µm and the focal fluence of the processing beam is in the range from 7 to 13 J/cm2. The samples are clamped by a holder in such a way that the processed surface is perpendicular to the processing beam. The holder is mounted on a translation stage to enable fine adjustment of the focus to surface distance F. A mechano-optical triangulation (MOT) sensor has been developed to achieve precise and repeatable sample positioning relative to the focal plane of the processing beam.
www.intechopen.com
On-line Optodynamic Monitoring of Laser Materials Processing
49
The key novelty of the developed solution is an accurate and reliable method for the detection of perforation of the ampoule wall during the processing. The method is based on the detection of shock waves generated in the air during the drilling process using a LBDP. An analysis of the detected optodynamic signals gives important information about the progress of the drilling process, and we employed this as the basis for the presented online process-monitoring method. A significant change in the signal's amplitude is observed when the wall of a liquid-filled ampoule is perforated and the exit process point is in contact with the liquid. This signal change can serve as an indicator of wall perforation. We have verified this optodynamic method by examining the processed holes using optical and electron microscopy as well as with a non-destructive gas-leakage test method. Holes with a
diameter of less than 10 μm were produced in the walls of 0.5 mm thick glass ampoules. The test ampoules are successfully applied in the pharmaceutical production. In a further development (Petkovšek et al., 2008) of the described microdrilling method we augmented the experimental set-up by means of a digital micrographic system (Fig. 14) which enables the acquisition of images of the plasma plume and of the hole cross-section during a drilling sequence.
Fig. 14. The set-up for laser drilling of specified micro-holes into ampoules. Reprinted from (Petkovšek et al., 2008) with kind permission from Springer Science+Business Media
The first processing phase, called “incubation,” is characterized by 3D plasma plume expansion (Fig. 15b, image a). The initial hole has a shape close to a half-sphere with radius related to the processing beam radius. The nonuniformity of the process at this phase manifests itself in the LBDP amplitude variation greater than ±10% (Fig. 15a). During the second phase (“the deep hole ablation”), a self-focusing effect appears leading to the recessing hole diameter that is more prominent at lower processing beam fluences. Recession also depends on numerical aperture and focus adjustment of the processing beam. One-dimensional expansion of the plasma plume (Fig. 15b, images b and c) leads to a strong attenuation of the processing beam and consecutively to a strong (approximately exponential) decrease of the LBDP signal amplitude (Fig. 15a). By comparing the hole cross-section and plasma plume images we see that in this phase the plasma plume originates and expands in the hole. LBDP signal amplitude exhibits less variation in this phase than during the previous one. The hole is crack-free.
www.intechopen.com
Advanced Knowledge Application in Practice
50
Fig. 15. Phases of the micro-drilling process evident in (a) LBDP signal amplitude diagram and (b) characteristic micrograph images of the hole cross-section and the corresponding plasma plume. Reprinted from (Petkovšek et al., 2008) with kind permission from Springer Science+Business Media
The third phase occurs when ablation tends to stop due to the predominant absorption by the side walls in a deep hole. Plasma energy and consequently its visibility decrease (Fig. 15b, image d), and consequently the LBDP signal amplitude decreases below the noise level (Fig. 15a). At the moment of sample perforation, the plasma plume vanishes (Fig. 15b, image e). During this phase, the hole apex can exhibit an unpredictable form (branched hole apex). A further study in this area (Petkovšek & Možina, 2007) has been devoted to developing a theoretical model, which serves as a basis for understanding the physical background of the developed method for pulsed-laser microdrilling of glass using nanosecond pulses. The model considers plasma formation and shockwave propagation (Fig. 16).
Fig. 16. Plasma formation and shock wave propagation during laser micr-drilling. Reprinted from (Petkovšek & Možina, 2007) with kind permission from American Institute of Physics
3.2 Laser engraving We have examined OD signals detected by a microphone and a laser beam deflection probe
during laser engraving of printed circuits (Gorkič et al., 2009). The experimental set-up (Fig.
17) has been built around a diode pumped pulsed Nd:YVO4 engraving laser (1) with
average output power up to 15W, pulse repetition frequency up to 100 kHz, and pulse
duration of 20-60 ns. The processing laser beam was translated over the workpiece (2) using
www.intechopen.com
On-line Optodynamic Monitoring of Laser Materials Processing
51
a scanner head (3). The workpiece was mounted on a clamping device which had two
electrodes for measuring engraved gap conductance (4). OD waves, propagated in the air
above the processed surface, were detected by a condenser microphone (5) and a laser beam
deflection probe (LBDP). A LBDP beam from a He-Ne laser (6) was aligned parallel to the
line engraving and intersecting the processing beam at the right angle. Deflection of the
probe beam by the transition of the OD transient wave was detected by a fast photodiode
with a preamplifier (7) (40 MHz bandwidth). According to the manufacturer specification
the microphone had a 100 kHz bandwidth. Another fast photodiode (8) was used to detect
stray processing laser light, reflected from the workpiece, in order to acquire the time
history of the processing beam and to trigger the oscilloscope (9).
Fig. 17. Experimental set-up for OD analysis of laser engraving. Reprinted from (Gorkič et al., 2009) with kind permission from Springer Science+Business Media
Different process regimes were studied varying laser power, pulse repetition frequency and beam translation speed. The detected OD signals had the form of a train of well separated pulses. Comparing microphone and LBDP signal pulses we found the latter to be shorter as expected due to the higher detecting bandwidth of the LBDP. We observed that during the process both kinds of OD signals exhibited characteristic amplitude variations which could be related to the process outcome. An efficient windowed peak-to-peak signal processing algorithm for amplitude extraction was developed to process the signals and examine their relation to the engraving quality. The results of signal analysis were compared to the engraving surface topography, measured by means of optical microscopy with extended depth of field digital photography. We have found that microphone and LBDP signal amplitude was larger in the cases of optimal engravings than in the cases of shallow and overburnt engravings (Fig. 18). The results show that the signals could be applied to on-line monitoring of the process of laser engraving PCBs. We examined different combinations of processing parameters, which would uniquely
describe different processing regimes: shallow, good and obverburnt engraving. We found
that the parameter, defined as
Es = PL/νL (4)
www.intechopen.com
Advanced Knowledge Application in Practice
52
where PL and vL are laser power and beam translation speed, respectively, suited well for
this purpose. ES [J/m] represents incident pulse energy, averaged over a pulse repetition
period, per unit length of an engraving. We have found in our case that using parameters
that gave ES < 77 J/m we obtained shallow engravings. Using parameter combinations that
gave ES > 90 J/m we observed excessive substrate burn.
Fig. 18. 3D scans (left) and amplitudes of OD signals (right) of a shallow (a) and good (b) engraving. Reprinted from (Gorkič et al., 2009) with kind permission from Springer Science+Business Media
3.3 Laser cleaning We have investigated laser cleaning as an optodynamic process in which the optically induced removal of a liquid or a solid contaminant from a substrate is accompanied by an optodynamic wave in the surrounding air (Bregar & Možina, 2002). In our experiments we used both dry and steam laser-cleaning techniques for various samples. OD waves, produced by the abrupt heating and detachment of the contaminants, were detected with a laser beam deflection probe. Analyzing the acquired signals we observed supersonic propagation velocities, density profiles matching the shock-wave profile, and reasonable agreement between the shock-wave theory and measured data. Two characteristic parameters of the optodynamic wave: the amplitude and the time-of-flight of the wavefront were examined as possible indicators of the contaminant removal. Analysis of the OD signals has indicated possible sound generating mechanisms. During a sequence of successive cleaning laser pulses we have observed a decrease of the amplitude and the propagating velocity of the detected OD waves. When both parameters reached constant values, the cleaning process ceased (Bregar & Možina, 2003). Fig. 19 presents times of flight (TOFs) measured during the cleaning of two samples with different surface contaminant particle densities. As expected, the higher density and consequently the higher particle
www.intechopen.com
On-line Optodynamic Monitoring of Laser Materials Processing
53
removal rate correlates with a significantly larger change in both OD parameters; for the first few pulses stronger and faster shockwaves are generated, with the propagation velocities up to 470 m/s. By OD signal detection and analysis the progress of the cleaning process could be monitored on-line.
Fig. 19. Times of flight of the OD signals detected during the laser cleaning of a stainless-steel surface with low (×) and high (◦) surface contaminant particle density. Reprinted from (Bregar & Možina, 2003) with kind permission from Springer Science+Business Media
We have studied the removal of paint layers from metal surfaces using excimer and pulsed Nd:YAG lasers (Jezeršek et al., 2004). The effects of each individual laser pulse were monitored by a three-probe system (Fig. 20). Ultrasonic signals from the rear surface of the substrate were obtained using an arm compensated Michelson interferometer (ACMI), the OD waves in the surrounding air were detected using a LBDP and the 3D shape of the growing crater was measured using a laser anamorph profilometer.
Fig. 20. Experimental set-up used for monitoring the laser-based decoating (left). The shape of the ablated area after (a) the first and (b) the tenth Nd:YAG laser pulse measured by the laser anamorph profilometer (right). Reprinted from (Jezeršek et al., 2004) with kind permission from Elsevier
www.intechopen.com
Advanced Knowledge Application in Practice
54
The Nd:YAG laser proved to be more efficient in terms of decoating rate. When using ACMI the integral of the ultrasonic signal was found to be a representative parameter that has a linear correlation with the decoating rate (Fig. 21). In a similar way, the amplitude and the time-of-flight are appropriate parameters when using the LBDP, but they have an exponential relation versus decoating rate. From a process-control point of view the above measurement techniques make it possible to monitor the laser-based decoating process in real-time.
Fig. 21. The correlation between the ablated mass per laser pulse and (a) the interferometric integral and (b) the TOF. Reprinted from (Jezeršek et al., 2004) with kind permission from Elsevier
3.4 Laser writing We have investigated the direct laser writing of graduation lines in Cr thin films on glass substrates (Kopač et al., 1996a; 1996b). A Nd-YAG laser and an astigmatic optical system have been used to write rectangular holes in the Cr film. The optimal writing parameters: the laser pulse energy, the Cr layer thickness and the substrate-objective distance were determined using the probe beam deflection method to detect the evaporation of the material. We have shown that evaporation was the essential process in the laser writing of graduation lines. The rims formed by the surface tension gradient at the hole edges have indicated that the laser writing of graduation lines is a typical two-phase removal process. Based on this assumption the process was analyzed experimentally and theoretically. The transmitted portion of the incoming laser pulse and the optodynamic wave amplitude have been detected and used in monitoring the line opening dynamics in real time. Fig. 22 shows AFM images of the graduation lines for different writing parameters. The region of the removed material is located in the middle of the AFM image, while the rims of resolidified Cr can be seen at the edges of these regions. Fig. 23 shows the variations of OD amplitudes for the sequentially written graduation lines while the writing parameters were changing. For the first 50 written lines, the pulse energy
was varied from 150 to 315 μJ; for the next 75 lines the refocus was simulated. The next 50 lines were written with the system set to the optimal writing parameters and the last lines were written in the Cr layer with the inhomogeneous adhesion. All the experiments were performed on the 40 nm thick Cr layer with the laser beam impacting through the glass substrate. Comparing these results with OM, SEM and AFM analysis of the same graduation pattern, one can conclude that the OD signal amplitude is a good measuring parameter for the on-line evaluation of the quality of the graduation pattern, since the graduation lines written in the OD amplitude range between 130 and 160 mV satisfy the quality requirements.
www.intechopen.com
On-line Optodynamic Monitoring of Laser Materials Processing
55
Fig. 22. AFM images of graduation lines for different writing parameters (size 11×11 μm). Reprinted from (Kopač et al., 1996a) with kind permission from Springer Science+Business Media
Fig. 23. On-line OD monitoring of the graduation lines quality. Reprinted from (Kopač et al., 1996b) with kind permission from Elsevier
3.5 Laser ablation The LBDP has been employed to study ablation of metallic surfaces by sequences of 1.06 μm Nd:YAG laser pulses separated by less than 1 μs (Diaci & Možina, 1993). A fluence threshold has been found, below which the effects of individual pulses can be resolved by the laser probe. Above that, the deflection signal has a similar form as if the surface were irradiated with a single pulse. Analysis of the signal in terms of the spherical blast wave theory shows that a pulse sequence generates a weaker blast wave than a single pulse of equal total
www.intechopen.com
Advanced Knowledge Application in Practice
56
energy. Inspection of the irradiated surfaces shows a monotonous increase of the etch depth with pulse energy in all cases, confirming that no appreciable plasma shielding takes place. The amplitude of the LBD signal, which also increases monotonically with pulse energy, could therefore be used for the on-line monitoring of the etch depth. In the case of multiple pulse irradiation, however, the amplitude changes so drastically when the consecutive shocks merge that an integral parameter, like mean square value of the signal, should be more appropriate for monitoring the total etch depth. For the same total energy, the multiple pulse irradiation produces a higher etch depth than the single pulse, but it also yields a larger heat affected zone, more irregular shape of the crater with larger remnants of melted and resolidified material (Fig. 24).
Fig. 24. Profiles of craters ablated into a stainless steel surface using single pulses (the dash-dot line) and multiple pulses (the solid line) with similar total energy. Reprinted from (Diaci & Možina, 1993) with kind permission from Elsevier
We have applied the multiple-pass LBDP to investigate spherical shocks generated during laser ablation of metallic targets in air (Diaci & Možina, 1996). For each ablation event we determine shock transit times at several points in space and fit the data to the theoretical shock trajectory in order to determine the blast energy Eh released in the shock wave. This multiple-point procedure improves the accuracy and reliability of blast energy measurement. As an illustration of the result we show in Fig. 25 the ratio Eh/El, which we call the energy conversion efficiency, as a function of incident laser energy El. The efficiency increases with incident energy: quite rapidly at low El and only gradually at high El. In the low El range we also find that pulse-to-pulse variations of blast energy are much higher than the variations of El while in the high El range they are comparable. Several processing parameters, like the ablation rate, the shape and size of the ablation crater, are considerably affected by the conditions of focusing of the laser beam, i.e. by the focal distance of the focusing lens system and by the distance l between the irradiated surface and the focal plane of the lens system (waist—surface distance). In order to control and optimize the ablation process, a monitoring method of the ablation beam focusing is required. We have examined the possibility of employing the optodynamic detection to control and optimize the ablation process (Grad et al., 1993a). We have studied OD signals acquired during laser ablation of aluminum and brass samples using two detection techniques: a resonant piezoelectric (PZT) transducer mounted on the opposite side of the irradiated surface detecting the OD waves in the sample and a wideband microphone detecting the OD waves in the surrounding air. Simultaneous detection is used to evaluate the potentials of both detection techniques for monitoring the laser beam focusing.
www.intechopen.com
On-line Optodynamic Monitoring of Laser Materials Processing
57
Fig. 25. Conversion efficiency vs. incident laser energy during laser ablation metallic targets. Reprinted from (Diaci & Možina, 1996) with kind permission from Elsevier
Fig. 26. Normalized amplitude dependence of the microphone (left) and piezoelectric (right) signals on the waist—surface distance at two different laser pulse energies.
With all samples we find that both signals have maximum amplitudes when the target surface is in the focal plane of the ablation beam (l = 0 in Fig. 26). The peaks associated with the longitudinal wavefront arrivals are used for the comparison of the PZT signals. The curves, normalized with their focal values, exhibit more complex shapes than those from the microphone signals. In all cases the curves narrow when the incident laser energy E, decreases. The results indicate that it is possible to use the OD signal amplitudes to determine the position of the ablation beam focus and to detect displacements of the sample surface from the focus. The same simultaneous detection technique was applied to study excimer laser ablation of ceramic samples at different laser pulse energies and laser beam spot sizes (Grad & Možina, 1993b; Grad & Možina, 1995). Several techniques of OD signal analysis were used to study the correlation between OD signal parameters and the ablation rate. Combining the parameters of the microphone and PZT signals an ablation parameter was defined whose dependence on the ablated mass was found to be linear. The investigations have shown that the ablation rate changes with the increasing number of the laser pulses applied.
www.intechopen.com
Advanced Knowledge Application in Practice
58
Fig. 27. Comparison between the measured and the calculated microphone signals. Reprinted from (Grad & Možina, 1996) with kind permission from Elsevier
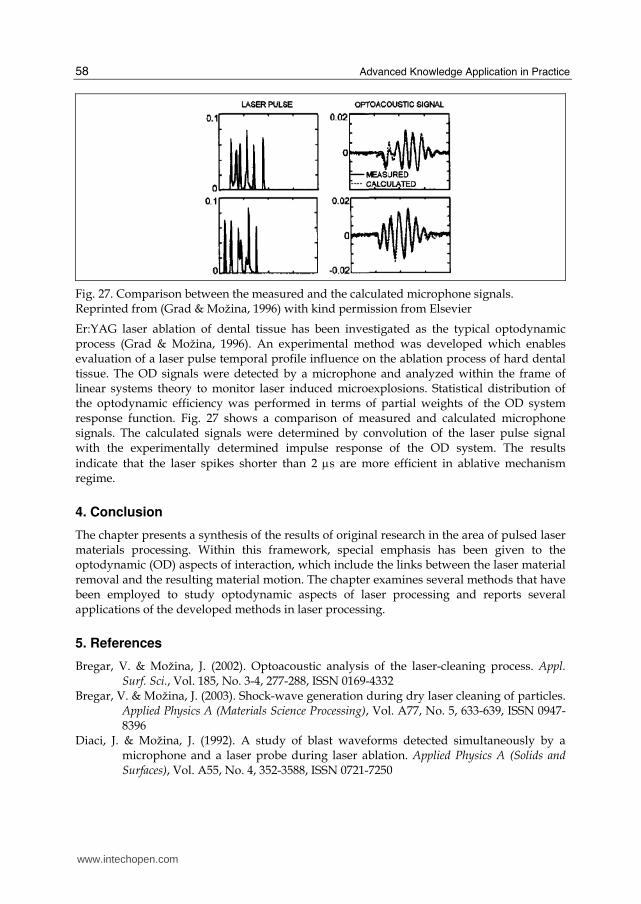
Er:YAG laser ablation of dental tissue has been investigated as the typical optodynamic process (Grad & Možina, 1996). An experimental method was developed which enables evaluation of a laser pulse temporal profile influence on the ablation process of hard dental tissue. The OD signals were detected by a microphone and analyzed within the frame of linear systems theory to monitor laser induced microexplosions. Statistical distribution of the optodynamic efficiency was performed in terms of partial weights of the OD system response function. Fig. 27 shows a comparison of measured and calculated microphone signals. The calculated signals were determined by convolution of the laser pulse signal with the experimentally determined impulse response of the OD system. The results
indicate that the laser spikes shorter than 2 μs are more efficient in ablative mechanism regime.
4. Conclusion
The chapter presents a synthesis of the results of original research in the area of pulsed laser materials processing. Within this framework, special emphasis has been given to the optodynamic (OD) aspects of interaction, which include the links between the laser material removal and the resulting material motion. The chapter examines several methods that have been employed to study optodynamic aspects of laser processing and reports several applications of the developed methods in laser processing.
5. References
Bregar, V. & Možina, J. (2002). Optoacoustic analysis of the laser-cleaning process. Appl. Surf. Sci., Vol. 185, No. 3-4, 277-288, ISSN 0169-4332
Bregar, V. & Možina, J. (2003). Shock-wave generation during dry laser cleaning of particles. Applied Physics A (Materials Science Processing), Vol. A77, No. 5, 633-639, ISSN 0947-8396
Diaci, J. & Možina, J. (1992). A study of blast waveforms detected simultaneously by a microphone and a laser probe during laser ablation. Applied Physics A (Solids and Surfaces), Vol. A55, No. 4, 352-3588, ISSN 0721-7250
www.intechopen.com
On-line Optodynamic Monitoring of Laser Materials Processing
59
Diaci, J. & Možina, J. (1993). Laser-beam deflection monitoring of Nd-YAG laser ablation - pulse shape and repetition rate effects. Appl. Surf. Sci., Vol. 69, No. 1-4, 321-325, ISSN 0169-4332
Diaci, J. & Možina, J. (1994). Study of energy conversion during Nd:YAG laser ablation of metal surfaces in air by means of a laser beam deflection probe. Journal de Physique IV, Vol. 4, No. 7, 737-740, ISSN 1155-4339
Diaci, J. & Možina, J. (1995). Multiple-pass laser beam deflection probe for detection of acoustic and weak shock waves in fluids. Rev. Sci. Instrum., Vol. 66, No. 9, 4644-4648, ISSN 0034-6748
Diaci, J. & Možina, J., (1996). Measurement of energy conversion efficiency during laser ablation by a multiple laser beam deflection probe. Ultrasonics, Vo. 34, No. 2-5, 523-525, ISSN 0041-624X
Diaci, J. et al., (1996). Simultaneous monitoring of ablative shocks in air by high-speed cineholography and multiple-pass beam deflection probe. Appl. Surf. Sci., Vol. 96-98, 154-158, ISSN 0169-4332
Jezeršek, M. et al., (2004). Real-time optodynamic monitoring of pulsed laser decoating rate. Ultrasonics, Vol. 42, 37-41, ISSN 0041-624X
Jezeršek, M., Gruden, V. & Možina, J. (2004). High-speed measurements of steel-plate deformations during laser surface processing. Opt. Express, Vol. 12, No. 20, 4905–4911, ISSN 1094-4087
Gorkič, A., Kovačič, D. & Diaci, J. (2009). Analysis of sonic waves generated during laser engraving of printed circuits. Int. J. Adv. Manuf. Technol., Vol. 42, No. 1-2, 138-144, ISSN 1433-3015
Grad, L. & Možina, J. (1993a). Optoacoustic monitoring of laser beam focusing. Lasers in Engineering, Vol. 1, No. 4, 275-282, ISSN 0898-1507
Grad, L. & Možina, J. (1993b). Acoustic insitu monitoring of excimer-laser ablation of different ceramics. Appl. Surf. Sci., Vol. 69, No. 1-4, 370-375, ISSN 0169-4332
Grad, L. & Možina, J. (1995). Optodynamic monitoring of excimer-laser drilling of ceramics. Lasers in Engineering, Vol. 4, No. 4, 255-262, ISSN 0898-1507
Grad, L. & Možina, J. (1996). Optodynamic studies of Er:YAG laser induced microexplosions in dentin. Appl. Surf. Sci., Vol. 96-8, 591-595, ISSN 0169-4332
Grad, L. & Možina, J. (1998). Optodynamic studies of Er : YAG laser interaction with wood. Appl. Surf. Sci., Vol. 127, 973-976, ISSN 0169-4332
Gregorčič, P., Požar, T. & Možina, J. (2009). Quadrature phase-shift error analysis using a homodyne laser interferometer. Opt. Express, Vol. 17, No. 18, 16322–16331, ISSN 1094-4087
Hrovatin, R. & Možina, J. (1995). Optodynamic aspect of a pulsed laser ablation process. Appl. Surf. Sci., Vol. 86, No. 1-4, 213-218, ISSN 0169-4332
Hrovatin, R. et al., (2006). The applicability of a material-treatment laser pulse in non-destructive evaluations. Ultrasonics, Vol. 44, 1199-1202, ISSN 0041-624X
Kopač, S., Pirš, J. & Možina, J. (1996a). Optodynamic analysis of direct laser writing of graduation lines. Applied Physics A (Materials Science Processing), Vol. A62, No. 1, 77-82, ISSN 0947-8396
Kopač, S., Pirš, J. & Možina, J. (1996b). Optodynamics of laser ablation of graduation lines in chromium thin film on glass. Appl. Surf. Sci., Vol. 96-8, 420-424, ISSN 0169-4332
www.intechopen.com
Advanced Knowledge Application in Practice
60
Možina, J. & Hrovatin, R. (1996). Optodynamics – a synthesis of optoacoustics and laser processing, Progress Nat. Sci., Vol. 6, S709-S714, ISSN 1002-0071
Perhavec, T. & Diaci, J. (2010). A novel double-exposure shadowgraph method for observation of optodynamic shock waves using fiber-optic illumination. Stroj. vestn. – J. Mech. Eng., accepted for publication, ISSN 0039-2480
Petkovšek, R. et al. (2006). Optodynamic study of multiple pulses micro drilling. Ultrasonics, Vol. 44, 1191-1194, ISSN 0041-624X
Petkovšek, R., Babnik, A. & Diaci, J. (2006). Optodynamic monitoring of the laser drilling of through-holes in glass ampoules. Meas. Sci. & Technol., Vol. 17, No. 10, 2828-2834, ISSN 0957-0233
Petkovšek, R., Možina, J. (2007). Monitoring of the laser microdrilling of glass by the optodynamic method. J. Appl. Phys., Vol. 102, no. 4, pp. 44905-44909, ISSN 0034-6748
Petkovšek, R. et al. (2008). Optodynamic monitoring of laser micro-drilling of glass by using a laser probe. Applied Physics A (Materials Science Processing), Vol. A93, No. 1, 141-145, ISSN 0947-8396
Požar, T., Gregorčič, P. & Možina, J. (2009). Optical measurements of the laser-induced ultrasonic waves on moving objects. Opt. Express, Vol. 17, No. 25, 22906–22911, ISSN 1094-4087
Strgar, S., Diaci, J. & Možina, J. (2000). Optodynamic measurements of Q-switched Nd: YAG laser drilling of laminated aluminium. Lasers in Engineering, Vol. 10, No. 4, 243-253, ISSN 0898-1507
Strgar, S. & Možina, J. (2002a). An optodynamic determination of the depth of laser-drilled holes by the simultaneous detection of ultrasonic waves in the air and in the workpiece. Ultrasonics, Vol. 40, No. 1-8, 791-795, ISSN 0041-624X
Strgar, S. & Možina, J. (2002b). An optodynamic method for the real-time determination of the depth of a laser-drilled hole. Applied Physics A (Materials Science Processing), Vol. A74, No. 2, 321-323, ISSN 0947-8396
www.intechopen.com
Advanced Knowledge Application in PracticeEdited by Igor Fuerstner
ISBN 978-953-307-141-1Hard cover, 378 pagesPublisher SciyoPublished online 02, November, 2010Published in print edition November, 2010
InTech ChinaUnit 405, Office Block, Hotel Equatorial Shanghai No.65, Yan An Road (West), Shanghai, 200040, China
Phone: +86-21-62489820 Fax: +86-21-62489821
The integration and interdependency of the world economy leads towards the creation of a global market thatoffers more opportunities, but is also more complex and competitive than ever before. Therefore widespreadresearch activity is necessary if one is to remain successful on the market. This book is the result of researchand development activities from a number of researchers worldwide, covering concrete fields of research.
How to referenceIn order to correctly reference this scholarly work, feel free to copy and paste the following:
Janez Diaci and Janez Možina (2010). On-line Optodynamic Monitoring of Laser Materials Processing,Advanced Knowledge Application in Practice, Igor Fuerstner (Ed.), ISBN: 978-953-307-141-1, InTech,Available from: http://www.intechopen.com/books/advanced-knowledge-application-in-practice/on-line-optodynamic-monitoring-of-laser-materials-processing