Ž . Journal of Mol ecular Catalysis A: Chemical 13 8 1999 155–176 Hydroformylation of ethene with triphenylphosphine modified rhodium catalyst: kinetic and mechanistic studies G. Kiss a, ) , E.J. Mozeleski b , K.C. Nadler c , E. VanDriessche c , C. DeRoover c a Corporate Research Laboratories, Exxon Research and Engineering, Annandale, NJ 08801, USA b Exxon Chemical, Annandale, NJ 08801, USA c Exxon Chemical International, B-1831 Machelen, Hermeslaan 2, Belgium Received 9 March 1998; accepted 29 April 1998 Abstract The kinetics of ethene hydroformylation with triphenylphosphine modified rhodium catalyst has been investigated. The reaction is first order in rhodium. The kinetic order for ethene is also one for most of the reaction conditions investigated, however, the combination of low phosphine and high olefin concentration leads to a saturation in ethene. The kinetic effects of CO and triphenylphosphine are also a function of their concentrations: both inhibit the reaction above a threshold value, while below the threshold a positive kinetic response can be observed. Hydrogen concentration has little effect on the rate ofhydroformylation. The olefin hydrogenation selectivity is generally low and can be described as a linear function of the H rCO partial pressure ratio. Hydrogenation of the product propionaldehyde cannot be detected by GC. Based on a refined 2 w Wilkinson mechanis m C.A. Tolman, J.W. Faller, Mechanistic studies of catalytic reactions using spectrosc opic and kinetic Ž . technique s, in: L.H. Pignolet Ed. , Homogene ous Catalys is with Meta l Phos phine Compl exes, Plenu m Press , New York, x 1983. , a kinetic model has been developed which fits all experimental observations and can be used to predict reaction rates and selectivities over a wide range of reaction conditions. q1999 Elsevier Science B.V. All rights reserved. Keywords: Hydroformylation; Oxo reaction; Phosphine modified rhodium catalyst; Ethene; Kinetics; Mechanism 1. Introduction Ž . w x World wide hydrofor mylat ion or oxo capac ity in 1993 exceede d 6 million tons ryear 2 . Approxi- Ž . mat ely 60% of that capac ity is based on the low pressure oxo proce ss LPO usi ng phosphine-mod- Ž . ifi ed rhodi um carbonyl s as cat alysts . LPO is used to convert li ght ol efi ns mai nly C and C , CO, 2 3 Ž Ž .. and H to C and C al dehyde s Eq. 1 . Oxo al de hydes ar e ma inly conver te d to C al cohols and 2 3 4 nG8 Ž . used in the man ufact ure of polyvinyl c hlori de PVC plast icize rs and det ergents. R–CH5CH qCO qH ™R–CH –CH –CHOqR–CH CHO –CH RsH or CH 1 Ž . Ž . 2 2 2 2 3 3 Ž . The mos t widel y used liga nd in LPO is tri phe nyl phosphine PPh . The pioneering work of Evans 3 w x w x w x Ž . et al. 3,4 , Yagupsky et al. 5 and Brown and Wilkinson 6 has established that I in the ) Corresponding author. Fax: q1-908-730-3198; e-mail: [email protected]m 1381-1169r99r$ - see front matter q 1999 Elsevier Science B.V. All rights reserved. Ž . PII: S1381-1169 98 00166-6
Ž .Journal of Molecular Catalysis A: Chemical 138 1999 155–176
Hydroformylation of ethene with triphenylphosphine modifiedrhodium catalyst: kinetic and mechanistic studies
G. Kiss a, ) , E.J. Mozeleski b, K.C. Nadler c, E. VanDriessche c, C. DeRoover c
a Corporate Research Laboratories, Exxon Research and Engineering, Annandale, NJ 08801, USAb Exxon Chemical, Annandale, NJ 08801, USA
c Exxon Chemical International, B-1831 Machelen, Hermeslaan 2, Belgium
Received 9 March 1998; accepted 29 April 1998
Abstract
The kinetics of ethene hydroformylation with triphenylphosphine modified rhodium catalyst has been investigated. Thereaction is first order in rhodium. The kinetic order for ethene is also one for most of the reaction conditions investigated,however, the combination of low phosphine and high olefin concentration leads to a saturation in ethene. The kinetic effectsof CO and triphenylphosphine are also a function of their concentrations: both inhibit the reaction above a threshold value,while below the threshold a positive kinetic response can be observed. Hydrogen concentration has little effect on the rate of hydroformylation. The olefin hydrogenation selectivity is generally low and can be described as a linear function of theH r CO partial pressure ratio. Hydrogenation of the product propionaldehyde cannot be detected by GC. Based on a refined2
wWilkinson mechanism C.A. Tolman, J.W. Faller, Mechanistic studies of catalytic reactions using spectroscopic and kineticŽ .
techniques, in: L.H. Pignolet Ed. , Homogeneous Catalysis with Metal Phosphine Complexes, Plenum Press, New York,x1983. , a kinetic model has been developed which fits all experimental observations and can be used to predict reaction ratesand selectivities over a wide range of reaction conditions. q 1999 Elsevier Science B.V. All rights reserved.
Ž . w xWorldwide hydroformylation or oxo capacity in 1993 exceeded 6 million tons r year 2 . Approxi-Ž .mately 60% of that capacity is based on the low pressure oxo process LPO using phosphine-mod-
Ž .ified rhodium carbonyls as catalysts. LPO is used to convert light olefins mainly C and C , CO,2 3
Ž Ž ..and H to C and C aldehydes Eq. 1 . Oxo aldehydes are mainly converted to C alcohols and2 3 4 n G 8Ž .used in the manufacture of polyvinyl chloride PVC plasticizers and detergents.
R–CH 5 CH q CO q H ™ R–CH –CH –CHO q R–CH CHO –CH R s H or CH 1Ž . Ž .2 2 2 2 3 3
Ž .The most widely used ligand in LPO is triphenylphosphine PPh . The pioneering work of Evans3w x w x w x Ž .et al. 3,4 , Yagupsky et al. 5 and Brown and Wilkinson 6 has established that I in the
( )G. Kiss et al. r Journal of Molecular Catalysis A: Chemical 138 1999 155–176 156
Scheme 1. The main steps of the Heck–Breslow hydroformylation mechanism.
Ž .Ž .Rhr PPh -catalyzed hydroformylation the stable HRh CO PPh monocarbonyl hydride complex is3 3 3Ž .a direct catalyst precursor, II the major Rh-component present under reaction conditions is the
Ž . Ž . Ž .dicarbonyl hydride HRh CO PPh , and III the main steps in the catalytic cycle follow the2 3 2w x Ž .Heck–Breslow mechanism 7–10 developed for the Co-catalyzed oxo reaction Scheme 1 . In order
to explain the effect of PPh concentration on product selectivities, Wilkinson proposed two different3
paths: a dissociative one and an associative one. The former is initiated by the dissociation of COfrom the dicarbonyl hydride, and the catalytic cycle follows the 16 r 18-electron path. The latter isinitiated by the association of the olefin with the hydride leading directly to an 18-electron alkyl
w xintermediate via a 20-electron transition state. Later spectroscopic studies 11–25 further refined thew xdetails of the mechanism and today it is widely accepted 1,2 that the likely kinetic path is the one
which involves 16- and 18-electron species only, i.e., the dissociative mechanism.While the main features of the mechanism have been well established by identifying spectroscopi-
w xcally observable intermediates, the kinetics of the process have not been thoroughly studied 2 .w xAlthough there are some kinetic studies 26–32 which address the effect of several process variables
w xwith the goal of developing a kinetic model, only one of them 26 offers an analysis correlatingpropylene hydroformylation kinetic data with a reaction mechanism. Other publications either offer
w xempirical models 27–32 or focus on a limited number of variables and address only certain aspectsŽ . w xmostly phosphine effect of the reaction 33–43 . This paper reports the results of a parametric studyof the hydroformylation of ethene with triphenylphosphine-modified Rh catalyst. A kinetic model has
w xbeen developed by correlating the kinetic data with a refined Wilkinson mechanism 1 .
2. Experimental
2.1. Materials
Ž .Solvents anhydrous toluene, tetraetheneglycol dimethyl ether, dioctyl phthalate , methylcyclohex-Žane as GC internal standard, all from Aldrich; 2,2,4-trimethyl-1,3-pentanediol monoisobutyrate or
.Texanol from Eastman or ACROS, and isoamyl butyrate from ACROS were thoroughly deaeratedŽbut otherwise were used as received. All gases 1:1 H r CO, methane, and ethene from MG Industries2
. Ž . Ž .Ž . Ž .or Air Liquide , triphenylphosphine from Aldrich , and Rh acac CO from Strem or Aldrich were2Žused as received. All organic compounds were checked for purity by GC Perkin Elmer Autosystem
.or Hewlett-Packard 5890, Hewlett-Packard Pona column .For the kinetic measurements Rh stock solutions were prepared by using the appropriate solvent.
Ž . Ž .Ž . ŽThe stock solution was made by weighing 0.1 mg accuracy the solvent, Rh acac CO acac s2. Ž .acetylacetonato , and PPh P r Rh ratio of ca. 10 into a bottle. A vigorous evolution of CO suggested3
Ž .Ž .Ž .the formation of the Rh acac CO PPh complex. Catalyst solutions for the hydroformylation of 3
ethene with the desired composition were prepared by weighing the Rh stock solution, additionalphosphine, and solvent.
( )G. Kiss et al. r Journal of Molecular Catalysis A: Chemical 138 1999 155–176 157
2.2. Apparatus
Ž .The batch kinetic experiments were performed in 300 or 500 ml autoclaves Autoclave Engineersequipped with speed-controlled mechanical stirrers. The configuration of all units were identical. The
Ž .reactors were connected to their gas feed vessels PVT tanks through a high precision pressure-regu-lator valve. All volumes in the system were measured by gas volumetric methods. The reactors and
feed vessels were equipped with certified Omega digital thermocouples and pressure gauges. Thetemperature of the reactors was maintained within " 18C.
Ž .The continuous-flow continuous stirred tank reactor or CSTR kinetic experiments were carriedŽ .out in 500 ml autoclaves Autoclave Engineers . The reactors were equipped as in the batch units. The
gas feed components were fed individually via Brooks mass-flow controllers which were calibratedŽ .in-house. All units were equipped with on-line gas chromatographs MTI or Hewlett-Packard which
sampled both the feed and the effluent. The constant unit pressure was maintained with a back-pres-Ž .sure regulator. The effluent flow was measured with wet-test meters American meter or Ritter .
The absence of mass transfer limits was verified by variable stirrer-speed experiments. Masstransfer rates for CO, H , and C H in tetraglyme at different stirrer speeds were also measured2 2 4
w xusing literature methods 44 . The Rh charge at each condition was adjusted to ensure that the liquidphase concentration of the reactants would be above the 95% level of the gas–liquid equilibriumvalues. Rate and selectivity values obtained in two different reactors at the same condition werestatistically indistinguishable. Reproducibility was checked by carrying out at least two runs at eachcondition.
2.3. Batch kinetic experiments
In a typical experiment, carried out in the 300 ml autoclave, 65 ml of catalyst solution wasŽ .Ž .Ž .prepared in a vacuum atmospheres glove-box from the Rh acac CO PPh stock solution, PPh , and3 3
the solvent. The solution was charged into the reactor under nitrogen. The reactor then was flushedŽ .and pressurized with syngas a 1:1 mixture of H and CO to ca. 500 kPa. Approximately 15 mmol of 2
ethene was also charged into a 75 ml injection bomb which then was mounted into the syngasŽ .feed-line of the reactor. The catalyst was preformed in syngas approximately 500 kPa at the reaction
temperature. NMR and IR experiments were carried out under identical conditions to verify theformation of the equilibrium mixture of rhodium hydrides with a general formula of
Ž . Ž . Ž .HRh CO PPh xs 1 and 2 . x 3 4y x
The reaction was initiated by injecting ethene into the reactor and bringing the pressure up to 1000kPa with syngas. Blank experiments were carried out to test the efficiency of the injection method. Inthese blank experiments the temperature and pressure in the PVT tank and the reactor equilibratedwithin 2 min or less. The pressure in the reactor was maintained constant by making up the consumed
syngas from the PVT tank. The conversion was followed by recording the pressure drop in the PVTtank. The reaction was stopped by rapid cooling of the reactor typically after 80–95% olefinconversion.
After cooling the reaction mixture, a gas sample was taken into a 50 ml stainless steel bomb. Theliquid product was removed under nitrogen. Aliquot samples of the product were prepared undernitrogen for GC analysis by adding known amounts of methyl cyclohexane as a GC internal standard.Mass balances were established for all organic components and were typically 100 " 5%, except forPPh for which the mass balances were typically 100 " 20%. The conversions and product selectivi-3
ties were determined from the mass balance for ethene based on GC analysis of the final liquid and
( )G. Kiss et al. r Journal of Molecular Catalysis A: Chemical 138 1999 155–176 158
gas phase, liquid product weight, and gas volume. The later was determined at each reactiontemperature from blank experiments.
The rate of reaction was calculated by assuming that the gas consumption, and thus the pressuredrop in the PVT tank, is a linear function of conversion. This assumption is valid as long as thepressure of the reactor is constant. The initial pressure of the PVT tank was obtained by extrapolating
Ž .to time zero on a pressure vs. reaction time plot. The turnover frequency TOF used in the kinetic
analysis was defined as the rate of olefin conversion by 1 mol of rhodium and expressed as molesethene converted to aldehydes per mole of Rh per second:
d n 1olefinTOF sy 2Ž .½ 5ž /d t nRh
The rate of olefin conversion was calculated from the PVT pressure vs. time data by approximatingŽ . Ž .the differential d n r d t with the finite difference D n r D t and utilizing the fact that for theolefin t olefin t
consumed olefin D n s constant D p :olefin PVT
d n r d t ( D n r D t s constant D p r D t 3Ž . Ž . Ž . Žt t t olefin olefin PVTi i i
whereconstant s total mole of aldehyde product r total PVT pressure drop 4Ž . Ž . Ž .
Ž . Ž .For a reaction which is first order in both the catalyst Rh and the substrate olefin , the reactionrate can be expressed as follows:
y d n r d t s k Rh olefin V s kn olefin 5Ž .olefin liq. Rh
Ž . Ž .where V s liquid volume, and k s reaction rate constant. Then from Eqs. 5 and 2 :liq.
TOF s k olefin s kp r H 6Ž .olefin olefin
where p and H are the partial pressure and the Henry’s constant of the olefin, respectively.olefin olefinŽ .From Eq. 6 the rate constant, k , can be obtained by using the initial turnover frequency if the initial
partial pressure and the Henry’s constant of ethene are known. In the text this data analysis will bereferred to as ‘differential method’.
Another way of analyzing the raw kinetic data is based on the analytical solution of the differentialŽ .mass balance for the olefin integral method . For a reaction which is first order in Rh and olefin:
d n V V d p polefin gas liq. olefin olefiny s y q s k Rh V 7Ž .liq.ž / ž /ž /d t RT H d t H olefin olefin
where V s free gas volume in the reactor, R s universal gas constant, T s temperature, othergas
Ž . Ž . Ž .annotations as in Eqs. 2 – 6 . From Eq. 7 : p t Ž .olefin
( )G. Kiss et al. r Journal of Molecular Catalysis A: Chemical 138 1999 155–176 159
Since
p t Ž .olefins 1 y conversion t 9Ž . Ž .
p t s 0Ž .olefin
ln 1 y conversion t sy k Rh r F t s constant t 10Ä 4Ž . Ž .Ž .Ä Ž .4
The ln 1 y conversion t vs. time plot therefore is linear if the reaction is first order in olefin. Therate constant can be calculated from its slope if the free gas and liquid volumes, and the partialpressure and Henry’s constant for ethene at the reaction temperature are known.
2.4. CSTR kinetic experiments
The continuous-flow hydroformylation of ethene was carried out in 500 ml Autoclave Engineers’zipperclaves. The catalyst solution was prepared and charged into the reactor as described earlier for
Žthe batch experiments. The gaseous feed components, H , CO, C H , and CH used as GC internal2 2 4 4.standard and inert diluent , were individually fed via Brooks mass-flow controllers.
Mass balances for each component were obtained independently of each other and typically were100 " 10% for CO and H , and 100 " 5% for ethene. The GC analyses were performed by MTI’s2
M200 micro GC or a custom modified HP 6890. Since both chromatographs sampled at constantŽ .atmospheric pressure, they allowed independent calibration for each gas component, including theproduct aldehyde. Calibrations were based on certified master blends prepared by Scott SpecialtyGases or Air Liquide. At the end of the experiment the composition of the catalyst solution and the
31 Ždegree of oxidation of the phosphine ligand were determined by P NMR and by GC HP5890,.WCOT Ultimetal with FID detection . The Rh concentration was measured by atomic absorption
spectroscopy.The hydroformylation turnover frequency was calculated as an average from the mass balances for
ethene and propanal. The hydrogenation turnover frequency was determined from the rate of
formation of ethane.
3. Results and discussions
3.1. Parametric study of reaction Õ ariables
The kinetic response to solvents and to changes in the concentration of ethene, Rh, and PPh was3
first tested in batch reactors. The experiments were carried out at 100 8C, and 1000 kPa total pressurewith a H r CO ratio of one, as described in Section 2.3. The initial partial pressure of ethene in the2
reactor was between approximately 80 and 160 kPa.At PPh concentrations higher than approx. 50 mmol r l the turnover frequency vs. ethene3Ž .conversion plots Fig. 1 are linear with a zero intercept, suggesting first order kinetics for ethene.
w x Ž .Also, since the TOF is independent of Rh , the reaction is first order in Rh. The ln 1 y conversionŽ .vs. time plots Fig. 2 are also linear for more than three half lives which is also consistent with a first
Ž .order in ethene cf. Section 2.3 . The hydroformylation selectivity at these conditions is high,approximately 99.7%. The only other product detected is ethane, forming at 0.2–0.4% selectivity.
Ž .Unexpectedly, at low PPh concentrations - ca. 50 mmol r l a saturation kinetics can be observed3
for ethene. As shown in Fig. 3, the data are reproducible. Interestingly, the first order kinetic regime
( )G. Kiss et al. r Journal of Molecular Catalysis A: Chemical 138 1999 155–176 160
Fig. 1. Hydroformylation rate of ethene as a function of conversion at three different Rh concentrations.
can be expanded to higher ethene concentrations, and the reaction can be accelerated by increasing theH r CO ratio in the reactor. Although mass-transfer limitation can lead to similar kinetic response2w x Ž .45 , it can be excluded in our experiments because: I At the observed maximum gas-uptake rate the
Ž .calculated gas concentration for all reactants is within 5% of the gas–liquid equilibrium level; and IIThe TOF is independent of the concentration of Rh. Using constant partial pressure of CO, the etheneconcentration at which the kinetic saturation occurs becomes lower with lower PPh concentration.3
The effect of PPh will be discussed later in more detail.3
This saturation kinetics in olefin hydroformylation is not without precedent. Thus, saturation, oreven substrate inhibition kinetics with Rh r PPh catalyst has also been reported for 1-hexene by3
w x w xDeshpande and Chaudhari 31 , for 1-decene by Divekar et al. 29 , and for 1-dodecene by Bhanage et
Fig. 2. Integral method plot for the hydroformylation of ethene.
( )G. Kiss et al. r Journal of Molecular Catalysis A: Chemical 138 1999 155–176 161
Fig. 3. Saturation kinetics in ethene hydroformylation at low PPh concentrations.3
w x w xal. 27 . The fractional kinetic order for propylene found by the Montedison group 26 may be theresult of an operation in the intermediate kinetic regime. Similar kinetic response has been described
w xby Brown and Wilkinson 6 for the hydroformylation of 1-hexene in benzene at 25 8C withŽ .Ž .HRh CO PPh , but with no excess PPh present. In their study the maximum TOF does depend on3 3 3
Ž .the concentration of Rh. However, at their conditions no excess ligand the kinetic order for Rh isw xless than one, while with excess ligand it is one for a variety of substrates and ligands 15,26–31 .
Ž .Data obtained in the present study are also consistent with a first order Rh dependence Fig. 4 .Ethene saturation at low PPh concentrations suggests a rate-limiting step before which there is a3
quasi-equilibrium involving the olefin. In the dissociative 16 r 18-electron mechanism proposed by
Fig. 4. Hydroformylation rate of ethene as a function of Rh concentration at constant PPh concentration.3
( )G. Kiss et al. r Journal of Molecular Catalysis A: Chemical 138 1999 155–176 162
w x Ž .Ž . Ž .Tolman and Faller 1 the earliest such equilibrium step is the formation of HRh C H CO PPh2 4 x 3 3y xŽ . w Ž . Ž . x w xs 1–3 but can also involve the alkyl C H –Rh CO PPh or acyl C H CO–2 5 x 3 4y x 2 5
Ž . Ž . x Ž .Rh CO PPh xs 1–4 intermediates as well. The corresponding rate-limiting steps are olefin x 3 4y xw xand CO insertion or H activation, respectively. Tolman and Faller have proposed 1 that at the2
saturation limit the rate limiting step is H activation, while at low olefin concentrations the limiting2Ž . Ž . Ž . Ž . Ž .rate is olefin addition to HRh CO PPh xs 1–2 or CO dissociation from HRh CO PPh . x 3 3y x 2 3 2
The build-up of a non-acyl intermediate has been reported from in situ CIR-FTIR studies of w xreacting phosphine-modified Rh catalyst systems 20 . The authors have assigned the observedw xIR-spectrum to an 18-electron alkyl complex. They also proposed 20 that the shift from first to zero
order in olefin is due to a shift in the rate-limiting step from CO insertion in the alkyl intermediate toŽ . Ž . Ž .CO dissociation from HRh CO L L s phosphine ligand , which latter complex is the dominating2 2
w xspecies under typical oxo conditions with Rh r PPh . NMR kinetic data 16,17,21 , however, make this3
latter scenario less likely, since it has been found that the dissociation of CO or phosphine is muchfaster than the rate of catalytic hydroformylation.
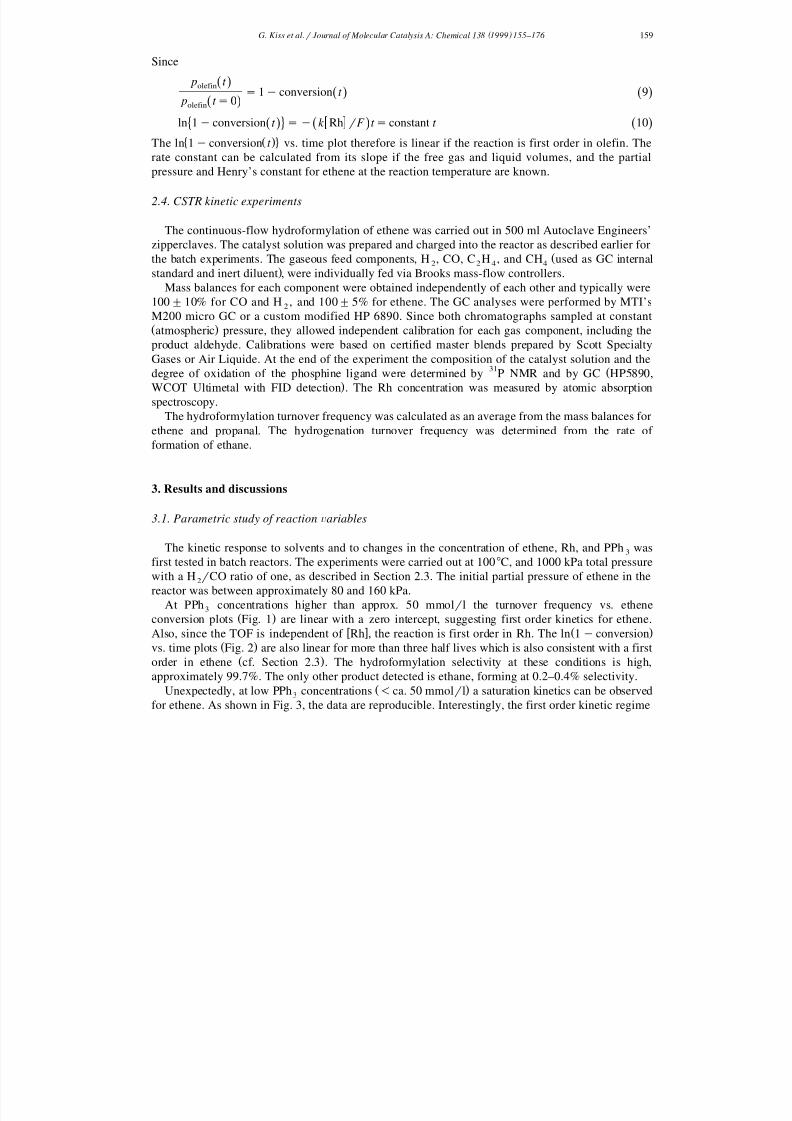
Our data support Tolman’s proposal regarding a shift in the rate-limiting step. As illustrated by Fig.5, the turnover frequency is little affected by changes in the H r CO ratio at high conversion, i.e., in2
the ethene first order regime. In contrary, using the same catalyst composition, the reaction rate isŽ . Ž .increased at low conversion zero order regime by increasing the H r CO ratio Fig. 3 . Furthermore,2
a comparison between Figs. 3 and 5 clearly shows that the first order regime expands with increasingphosphine concentration. The changing kinetic response suggests that the rate of hydrogen activationis comparable to the rate of an earlier step in the mechanism. By increasing the rate of hydrogenactivation the rate limiting step shifts back to that earlier stage of the catalytic cycle.
w xBased on the dissociative mechanism of the reaction 1,46 it should be clear that the distribution of Rh intermediates at different CO r phosphine ligand ratios, and with it reaction rate and productselectivity, depends on the relative concentrations of CO and PPh . At constant partial pressure of CO3
the determining factor thus becomes the concentration of the phosphine ligand. Our results are in fullagreement with this prediction. The data plotted in Fig. 1, for example, show that at the same reaction
Fig. 5. The effect of H r CO ratio in ethene hydroformylation at low PPh concentrations.2 3
( )G. Kiss et al. r Journal of Molecular Catalysis A: Chemical 138 1999 155–176 163
w xcondition the TOF r ethene is the same as long as the phosphine concentration is the same. Thisw xobservation is also in agreement with the conclusion of an earlier report by d’Oro et al. 26 . Although
it is customary in the hydroformylation literature to report kinetic and selectivity data as a function of w xthe Pr Rh ratio 2,32–34 , we have not found any correlation between those values when excess
Ž . w xphosphine P r Rh ) 3 is present. We have found rather that the TOF r ethene values are independentof the Pr Rh ratio, and solely depend on the concentration of the phosphine, as long as other reaction
variables are constant.The effect of PPh concentration can be best characterized by defining two regimes depending on3
Ž .the kinetic order of ethene. In the ethene first order regime high conversion data the catalyticŽ .activity is inhibited by PPh Fig. 6 . At our reaction conditions, as was mentioned earlier, only the3
first kinetic order regime can be observed for ethene if the phosphine concentration is higher than0.05 mol r l. The second order rate constant is a monotonous function of the phosphine concentration.From our data, obtained at 80 and 100 8C, 270 and 480 kPa of CO, and from 2.5 to 15.0 wt.% PPh ,3the kinetic order for the phosphine is between y 0.41 and y 0.49. In the hydroformylation of
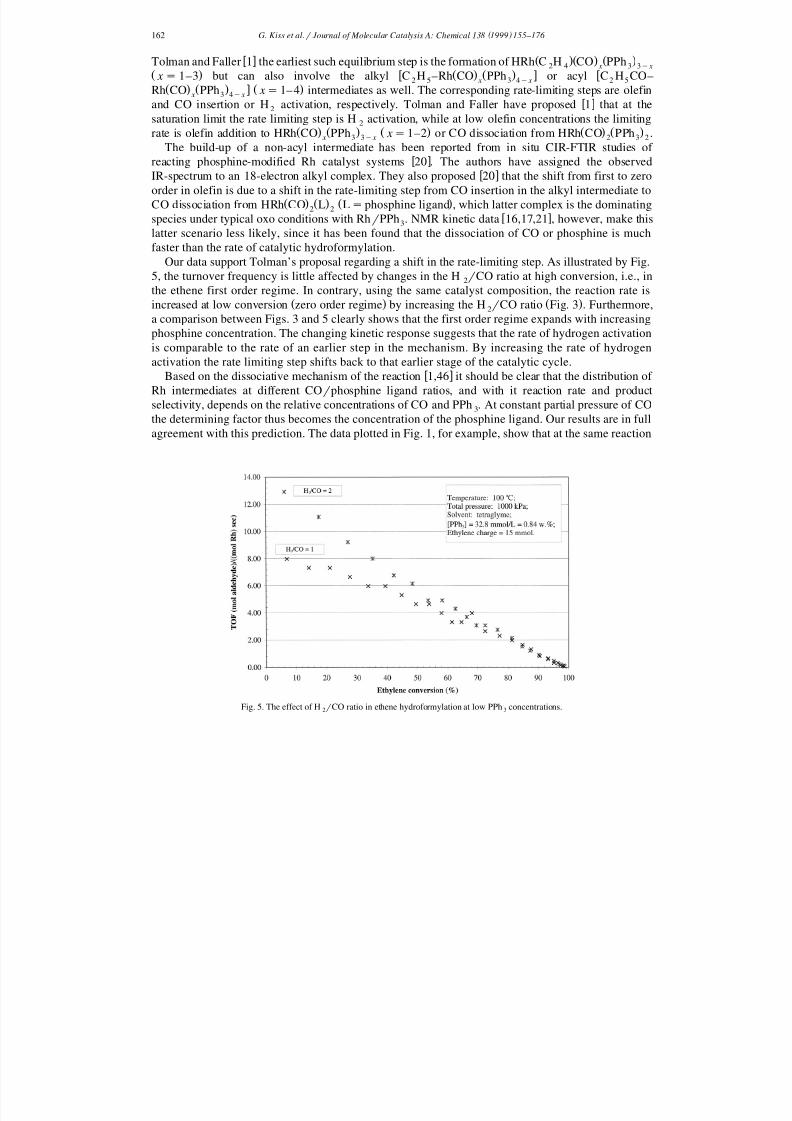
w x Žpropylene d’Oro et al. 26 reported a similar value, y 0.65. In the ethene zero order regime low.ethene conversion , on the other hand, the reaction rate has a maximum at approximately 30 mmol r l
Ž .phosphine concentration Fig. 7 . A maximum in the reaction rate vs. phosphine concentrationw x w xfunction has also been reported for the hydroformylation of propylene 47 , 1-hexene 38–40 , and
w xiso -butene 32 . It has to be mentioned that these literature data represent initial rates and thus weremeasured at high olefin concentrations. It is therefore quite possible that at low olefin concentrationsthese olefins, too, would show a monotonous inhibition function for the phosphine.
The positive kinetic response to the phosphine at low phosphine concentrations has been proposedw x32 to be due to the break-up of Rh dimers thus providing a higher concentration of the catalyticallyactive mononuclear rhodium hydrides. At high phosphine concentrations the dominating species are
w xmononuclear 1 , and the kinetic behavior reflects the trapping of a 16-electron intermediate by thephosphine. It can explain the large shift in the kinetic order of PPh in the low phosphine3
concentration regime. The mechanistic implications will be discussed in more detail later in Section3.2.
Fig. 6. Catalytic activity as a function of PPh concentration in the first order regime of ethene hydroformylation with Rh r PPh catalyst.3 3
( )G. Kiss et al. r Journal of Molecular Catalysis A: Chemical 138 1999 155–176 164
Fig. 7. Maximum observed rate as a function of PPh concentration in ethene hydroformylation with Rh r PPh catalyst.3 3
The kinetic effect of CO and H was investigated in continuous-flow reactors as described in2
Section 2.4. In these experiments all other variables were kept constant, while the partial pressure of either CO or H was changed using methane as an inert balance to maintain constant pressure.2
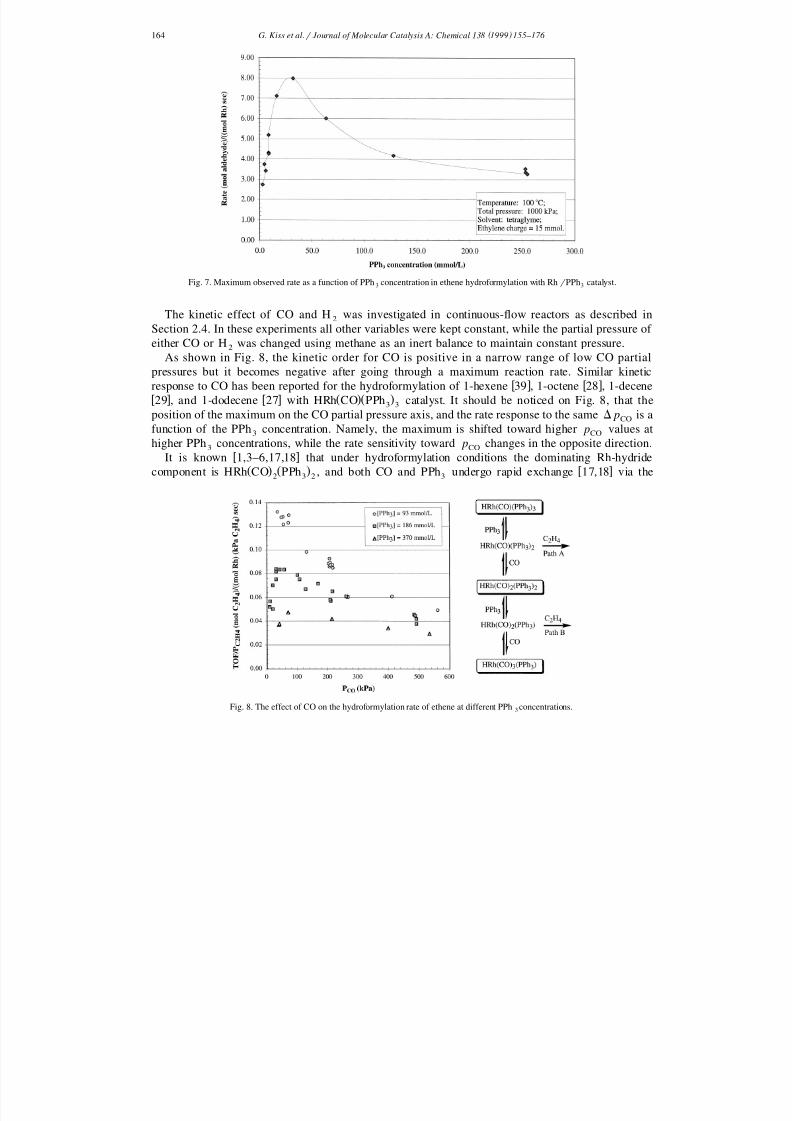
As shown in Fig. 8, the kinetic order for CO is positive in a narrow range of low CO partialpressures but it becomes negative after going through a maximum reaction rate. Similar kinetic
w x w xresponse to CO has been reported for the hydroformylation of 1-hexene 39 , 1-octene 28 , 1-decenew x w x Ž .Ž .29 , and 1-dodecene 27 with HRh CO PPh catalyst. It should be noticed on Fig. 8, that the3 3
position of the maximum on the CO partial pressure axis, and the rate response to the same D p is aCO
function of the PPh concentration. Namely, the maximum is shifted toward higher p values at3 CO
higher PPh concentrations, while the rate sensitivity toward p changes in the opposite direction.3 COw xIt is known 1,3–6,17,18 that under hydroformylation conditions the dominating Rh-hydride
Ž . Ž . w xcomponent is HRh CO PPh , and both CO and PPh undergo rapid exchange 17,18 via the2 3 2 3
Fig. 8. The effect of CO on the hydroformylation rate of ethene at different PPh concentrations.3
( )G. Kiss et al. r Journal of Molecular Catalysis A: Chemical 138 1999 155–176 165
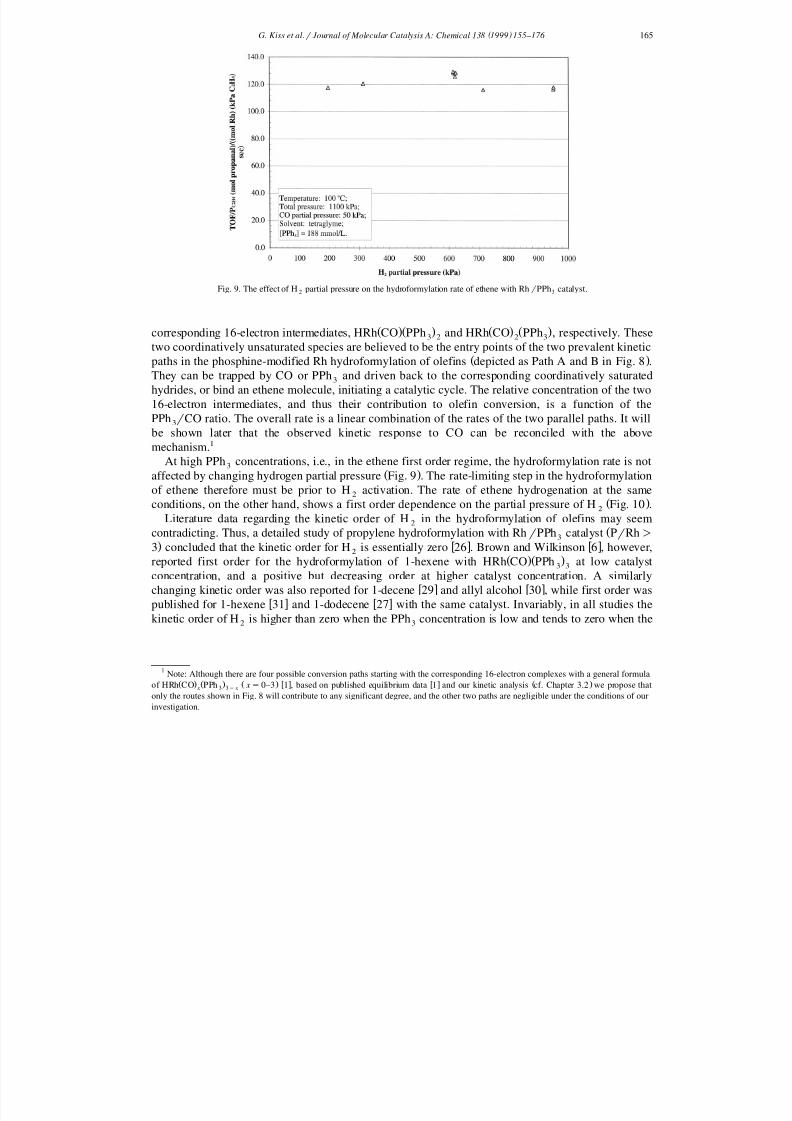
Fig. 9. The effect of H partial pressure on the hydroformylation rate of ethene with Rh r PPh catalyst.2 3
Ž .Ž . Ž . Ž .corresponding 16-electron intermediates, HRh CO PPh and HRh CO PPh , respectively. These3 2 2 3
two coordinatively unsaturated species are believed to be the entry points of the two prevalent kineticŽ .paths in the phosphine-modified Rh hydroformylation of olefins depicted as Path A and B in Fig. 8 .
They can be trapped by CO or PPh and driven back to the corresponding coordinatively saturated3
hydrides, or bind an ethene molecule, initiating a catalytic cycle. The relative concentration of the two16-electron intermediates, and thus their contribution to olefin conversion, is a function of thePPh r CO ratio. The overall rate is a linear combination of the rates of the two parallel paths. It will3
be shown later that the observed kinetic response to CO can be reconciled with the above
mechanism. 1
At high PPh concentrations, i.e., in the ethene first order regime, the hydroformylation rate is not3Ž .affected by changing hydrogen partial pressure Fig. 9 . The rate-limiting step in the hydroformylation
of ethene therefore must be prior to H activation. The rate of ethene hydrogenation at the same2Ž .conditions, on the other hand, shows a first order dependence on the partial pressure of H Fig. 10 .2
Literature data regarding the kinetic order of H in the hydroformylation of olefins may seem2Žcontradicting. Thus, a detailed study of propylene hydroformylation with Rh r PPh catalyst P r Rh )3
. w x w x3 concluded that the kinetic order for H is essentially zero 26 . Brown and Wilkinson 6 , however,2Ž .Ž .reported first order for the hydroformylation of 1-hexene with HRh CO PPh at low catalyst3 3
concentration, and a positive but decreasing order at higher catalyst concentration. A similarly
w x w xchanging kinetic order was also reported for 1-decene 29 and allyl alcohol 30 , while first order wasw x w xpublished for 1-hexene 31 and 1-dodecene 27 with the same catalyst. Invariably, in all studies thekinetic order of H is higher than zero when the PPh concentration is low and tends to zero when the2 3
1 Note: Although there are four possible conversion paths starting with the corresponding 16-electron complexes with a general formulaŽ . Ž . Ž .w x w x Ž .of HRh CO PPh x s 0–3 1 , based on published equilibrium data 1 and our kinetic analysis cf. Chapter 3.2 we propose that x 3 3y x
only the routes shown in Fig. 8 will contribute to any significant degree, and the other two paths are negligible under the conditions of ourinvestigation.
( )G. Kiss et al. r Journal of Molecular Catalysis A: Chemical 138 1999 155–176 166
Fig. 10. The effect of H partial pressure on the hydrogenation rate of ethene with Rh r PPh catalyst.2 3
phosphine concentration is high. In our experiments, covering a wide range of PPh concentrations,3Žthe kinetic orders for both ethene and H are dependent on the concentration of PPh cf. Figs. 3 and2 3
.5, and discussion on the effect of ethene . The mechanistic implications will be discussed in Section3.2.
The hydroformylation rates of ethene in toluene, tetraglyme, dioctyl phthalate, Texanol, andŽ .isoamyl butyrate at 100 8C, 1 MPa CO r H 1:1 , 5 wt.% PPh are nearly the same. The reaction rates2 3
Ž .measured in n-butanal and propanal at 80 8C, 1 MPa CO r H 1:1 , 5 wt.% PPh , on the other hand,2 3
are significantly different from that of measured in tetraglyme, and have a ratio of 0.73:0.56:1,
respectively. Literature reports suggest increased rates when the solvent is changed from non-polar
Fig. 11. Temperature effect in the hydroformylation of ethene with Rh r PPh catalyst.3
( )G. Kiss et al. r Journal of Molecular Catalysis A: Chemical 138 1999 155–176 167
Fig. 12. Temperature effect in the hydrogenation of ethene with Rh r PPh catalyst.3
hydrocarbons to oxygenates. Thus, in the hydroformylation of propylene the product butanal has beenw xreported 42 to increase the reaction rate in benzene. We did not observe similar effect in the batch
hydroformylation of ethene or propylene in toluene. Substantial solvent effects have also beenw x w xreported in the hydroformylation of allyl alcohol 35 and 1-octene 33 . The later two papers suggest
metal–solvent interactions. In our study we have not found spectroscopic evidence for solventcoordination to the metal.
Ž . Ž .The effect of temperature on the rate of hydroformylation Fig. 11 and hydrogenation Fig. 12 of ethene was tested in tetraglyme between 80 and 110 8C at 210 kPa partial pressure of CO and 93mmol r l concentration of PPh . The kinetic data for both reactions were obtained from the same3
ŽCSTR experiments. The activation energy for hydroformylation has been found to be lower 18.2. Ž .kcalr mol than for hydrogenation 21.9 kcal r mol . The activation energy for ethene hydroformyla-
tion obtained from batch experiments at 460 kPa CO and 180–360 mmol r l PPh concentration is3
somewhat higher, 19.1 " 0.2 kcalr mol, but increasing ethane selectivity at higher temperaturesindicates higher activation energy for hydrogenation than for hydroformylation in the batch results, aswell. Literature values for the activation energy in the hydroformylation of olefins scatter consider-
w x w xably. The 20.6 and 19 kcal r mol reported for propylene 26,48 and 22 kcal r mol for 1-butene 16 arew x w xrelatively close to our values. Bhanage et al. 27 , Divekar et al. 29 and Deshpande and Chaudhari
w x31 , however, published activation energies ranging from 11.8 to 28 kcal r mol for the hydroformyla-
tion of 1-hexene, 1-decene, and 1-dodecene. Their data were obtained from empirical fits of theexperimental data, thus the activation energies can be model dependent, which may explain their widevariance and some of the unusually low values.
3.2. Kinetic model for the hydroformylation and hydrogenation of ethene
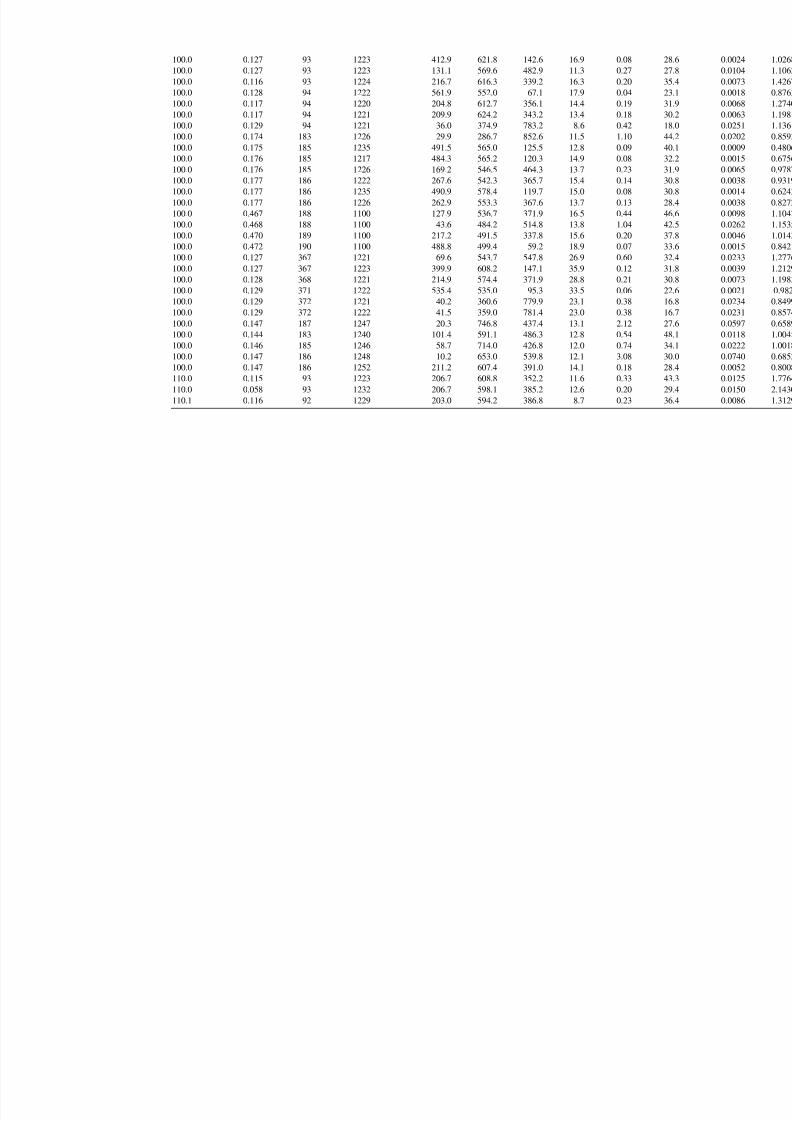
The database for the kinetic model development was generated in CSTR experiments as describedin Section 2.4. The range of operating conditions covered in these continuous-flow runs is given inTable 1. The kinetic data are summarized in the Appendix A.
Ž . Ž .CH as inert balance partial pressure kPa 55.5 8534 Ž .Total reactor pressure kPa 1100 1252Ž .PPh concentration mmol r l 93 3723
Ž .Rh concentration mmol r l 0.058 0.932
3.2.1. Kinetic model for ethene hydroformylationAs we discussed in Section 3.1, all of our kinetic observations can be reconciled with a refined
Wilkinson mechanism in which two parallel catalytic cycles are initiated by the coordination of etheneŽ . Ž . Ž .to the 16-electron hydrides with the general formula of HRh CO PPh , xs 1 or 2 . We have x 3 3y x
Ž .excluded the two extreme combinations xs 0 and 3 since their concentrations at our conditions areexpected to be much lower than for xs 1 or 2, and there is no reason to assume that they wouldsignificantly contribute to the conversion of ethene. It can be shown, however, that the form of the
Žkinetic expression would not be different for any other neighboring combinations i.e., 0 and 1 or 2.and 3 . Furthermore, since it is reasonable to assume that energetically the associative route would be
strongly disfavored over the dissociative path, only the latter is considered. Indeed, in agreement withw xliterature analyses 1,2 , we have found that the kinetics of ethene hydroformylation can be described
satisfactorily without invoking the associative route.In accounting for the Rh in solution, we can assume that only the coordinatively saturated
components are present in significant concentrations, and all other species are negligible. NMR resultsw x Ž .indicate 14,16 that the concentration of binuclear Rh complex es is also low at the reaction
Ž . Ž .conditions of the present study. In fact, the vast majority of Rh is present as HRh CO PPh , x 3 4y xwhere xs 1 or 2. The 16-electron initiators of the catalytic cycles are formed by the dissociation of CO or PPh from these 18-electron complexes.3
ŽIn our kinetic analysis we have considered four possible rate-limiting steps: H activation Eq.2Ž .. Ž Ž .. Ž Ž .. Ž Ž ..11 , CO insertion Eq. 12 , ethene insertion Eq. 13 , and ethene addition Eq. 14 .
C H CO–Rh CO PPh q H ™ C H –COH q HRh CO PPh , xs 1or2Ž . Ž . Ž . Ž . x x2 5 3 2 2 5 33y x 3y x
11Ž .
C H –Rh CO PPh ™ C H CO–Rh CO PPh , xs 2 or 3 12Ž . Ž . Ž . Ž . Ž x x y 12 5 3 2 5 34y x 4y x
HRh C H CO PPh ™ C H –Rh CO PPh , xs 1 or 2 13Ž .Ž . Ž . Ž . Ž . Ž x x2 4 3 2 5 33y x 3y x
HRh CO PPh q C H ™ HRh C H CO PPh , xs 1 or 2 14Ž . Ž . Ž .Ž . Ž . Ž x x3 2 4 2 4 33y x 3y x
As we mentioned earlier, the initiation of the catalytic cycle by the dissociation of CO or PPh from3Ž . Ž . Ž .HRh CO PPh xs 1–3 should not be rate-limiting since it has been found to be fast on the x 3 4y x
w xtime scale of hydroformylation 16,17,21 .At high PPh concentrations, i.e., at the conditions of our modeling study, the kinetic order for H3 2
is zero, thus the rate-limiting step has to be prior to H activation. We have also rejected CO insertion2
as the rate-limiting step, since it could not be reconciled with a negative kinetic order for CO. TheŽ Ž . Ž .rate-determining step therefore is either the addition or the insertion of ethene Eqs. 14 and 13 ,
( )G. Kiss et al. r Journal of Molecular Catalysis A: Chemical 138 1999 155–176 169
.respectively . Our kinetic data cannot resolve the two reactions but, as will be shown later, it does notaffect the final form of the kinetic model since it is the same for both scenarios. For further analysisethene insertion is chosen as a rate-determining step. This choice will conveniently allow thediscussion of both cases and will not influence the final results.
The mechanism derived from the previous analysis is depicted in Scheme 2. The scheme includes aRh-dimer to show how H can increase the concentration of the catalytically active mononuclear2
Rh-species. However, since the process-variable range covered in our modeling database falls into thezero order regime for H , the concentration of these dimers must be negligible and therefore they are2
not included in the Rh-balance. The total Rh in solution therefore can be accounted for by fiveŽ . Ž . Ž . Ž .mononuclear 18-electron complexes, HRh CO PPh x s 1–3 , and HRh C H - x 3 4y x 2 4
Ž . Ž . Ž .CO PPh xs 1 or 2 . These complexes are at equilibrium via rapid exchange of C H , CO, x 3 3y x 2 4Ž .Ž . Ž .and PPh . The Rh-species reacting in the rate-determining step are HRh C H CO PPh or3 2 4 2 3
Ž .Ž .Ž .HRh C H CO PPh . Since the k and k paths are parallel, the overall rate is the sum of two2 4 3 2 1 2
rates. This mechanism yields the following rate expression for ethene hydroformylation:
p pC H C H2 4 2 4k K K q k K K 1 1 11 2 2 21PPh p3 COTOF s 15Ž . p p p PPhC H C HCO 32 4 2 41 q K K q K K q K K q K K 1 11 1 0 2 3 2 21PPh PPh p p3 3 CO CO
where K , K , K , K , K , and K are equilibrium constants and k and k are rate constants.0 1 2 3 11 21 1 2
Since all reactions take place in the liquid phase, the equilibrium constants will implicitly containŽ .the vapor–liquid equilibrium proportionality Henry’s coefficient for each of the gaseous compo-
nents. These Henry’s coefficients are assumed to be independent of the gas phase composition.Ž .It should be noticed that at high ethene and low PPh or CO concentrations Eq. 15 leads to zero3
Žorder in ethene, which has been observed experimentally for the high ethene r low PPh case cf.3
.Chapter 3.1 . However, the conditions of the modeling database cover the ethene first order kineticregime only and the analysis will be limited to this region. At these conditions the concentration of
Scheme 2. Mechanism for ethene hydroformylation with Rh r PPh catalyst.3
( )G. Kiss et al. r Journal of Molecular Catalysis A: Chemical 138 1999 155–176 170
Ž .Ž . Ž . Ž .the ethene complexes HRh C H CO PPh xs 1 or 2 must be low and, in turn, the2 4 x 3 3y x
ethene-containing terms in the denominator are negligible. Furthermore, the lack of equilibrium dataŽ .does not allow the resolution of the individual equilibrium constants. Eq. 15 therefore can be
Ž .simplified to Eq. 16 : p pC H C HX X2 4 2 4k q k 1 2PPh p3 CO
TOF s 16Ž . p PPhCO 3X X1 q K q K 1 2PPh p3 CO
where k X s k K K , k X s k K K , K X s K K , and K X s K K . It can be easily shown that the1 1 1 11 2 2 2 21 1 1 0 2 2 3Ž .final kinetic expression would be the same as Eq. 16 if the rate-determining step were ethene-ad-
dition, as well.Ž . X X X X Ž .The four constants in Eq. 16 , k , k , K , K , have been regressed using all data 44 data points1 2 1 2
Ž X X Xin the modeling database at 100 8C. The results from three regression cases k s 0; k s 0; and k ,1 2 1X .k / 0 are shown in Table 2.2
The regression results suggest that the dominating conversion path is k X . Without the k X term1 1
Ž .X X
Case 1 the standard error is high, and the equilibrium constant K is negative. The k route alone1 1Ž . X Ž .Case 2 gives an excellent fit. The inclusion of k Case 3 brings no improvement in the standard2
error, and results in a non-physical, negative value for k X . Thus it is justifiable to assume that k X is 0.2 2
Mechanistically, this implies that the main pathway for ethene hydroformylation is through theŽ .Ž . Ž .H Rh C H C O PPh interm ediate, and the contribution of the path through2 4 2 3Ž .Ž .Ž .HRh C H CO PPh is negligible. The final kinetic expression therefore simplifies to:2 4 3 2
pC HX 2 4k 1 PPh 3TOF s 17Ž . p PPhCO 3X1 q K q K 1 2
PPh p3 CO
The experimental data and the fit by the above kinetic model are shown in Fig. 13, where theŽ . w xaverage error is 7.6%. Eq. 17 is first order in p and Rh , zero order in p , monotonouslyC H H2 4 2
w xdecreasing with PPh and has a maximum with respect to p . The model therefore correctly3 COŽ .describes the kinetic correlations observed experimentally cf. Section 3.1 .
3.2.2. Kinetic model for hydrogenation selecti Õ ity in ethene hydroformylationIn the kinetic analysis of hydroformylation we have concluded that the rate-determining step either
Ž .is, or preceeds the formation of a 16-electron alkyl intermediate see Scheme 2 . That 16-electron
Table 2Ž .Regression results for Eq. 16 using CSTR data for ethene hydroformylation with Rh r PPh catalyst at 100 8C3
X X X X 2Ž .k k K K Ý error1 2 1 2
Case 1 0 7.68 y 0.000345 396.0 80.9Case 2 0.0176 0 0.000496 31.8 0.409Case 3 0.0173 y 0.318 0.000473 2.53 0.401
Ž . Ž .TOF in mol aldehyde r mol Rh s .w xPPh in mol r l.3Pressures in kPa.
( )G. Kiss et al. r Journal of Molecular Catalysis A: Chemical 138 1999 155–176 171
Fig. 13. Model fit for the hydroformylation of ethene with Rh r PPh catalyst in tetraglyme at 100 8C.3
intermediate can react with CO, PPh , or H . The former two reactions would yield acyl-inter-3 2Ž .mediates after CO insertion, and ultimately lead to the formation of the aldehyde Scheme 1 . The
addition of H to the coordinatively unsaturated alkyl intermediate, on the other hand, will yield2
ethane. Therefore the hydroformylation vs. hydrogenation selectivity is determined by the competitionof CO and PPh vs. H for the unsaturated alkyl intermediate.3 2
Scheme 3 depicts all possible routes leading to propanal and ethane. There are two branchingpoints between hydroformylation and hydrogenation. Based on our previous discussions, however,only the route via k needs to be considered, since that is the dominating path under the conditions of 1
Ž .this study cf. Section 3.2.1 . By this mechanism the rate of hydrogenation should be first order in H , 2Ž .and indeed, that is what was found experimentally see Fig. 10 . Furthermore, the hydrogenation vs.
Scheme 3. Mechanism for ethene hydrogenation under hydroformylation conditions with Rh r PPh catalyst.3
( )G. Kiss et al. r Journal of Molecular Catalysis A: Chemical 138 1999 155–176 172
hydroformylation selectivity is expected to be the function of the relative concentrations of H vs. CO2Ž .and PPh , as shown by Eq. 18 :3
TOF p k C H H 1H2 6 2s 18Ž .TOF p k q PPh k C H CHO CO 12 3 112 5
Experimentally, ethane selectivity is found to be a linear function of p r p and independent of H CO2
Ž .the concentration of PPh Fig. 14 . It suggests that the hydrogenation vs. hydroformylation3Ž .selectivity is determined by the competition between H and CO k vs. k route , and can be2 1H 12
simply expressed as:
TOF pC H HX2 6 2s k 19Ž .TOF pC H CHO CO2 5
X Ž .The regressed value for k at 1008C is 0.00202, and Eq. 19 provides an excellent fit over more thantwo orders of magnitude.
3.2.3. Temperature effectsAt temperatures other than 100 8C, there are not enough data available for a full regression of Eq.
Ž . X X17 to determine the temperature dependence of the equilibrium constants, K and K . However,1 2
since the heat of reaction for the CO r PPh ligand-exchange is expected to be small, and the gas3
solubilities are not strongly temperature dependent, K X and K X probably are not strong functions of 1 2
temperature. Assuming therefore that K X and K X are not temperature dependent will likely give an1 2
acceptable fit. Applying the above approximation in a regression of all the data in the Appendix yieldsactivation energies of 17.0 kcal r mol for hydroformylation and 20.4 kcal r mol for hydrogenation.These values are indeed not much different from the ones obtained experimentally at constant
Fig. 14. Model fit for the hydrogenation vs. hydroformylation selectivity of ethene with Rh r PPh catalyst at 100 8C.3
( )G. Kiss et al. r Journal of Molecular Catalysis A: Chemical 138 1999 155–176 173
Ž .COr PPh ratios see Chapter 3.1 . The hydroformylation rates and hydrogenation selectivities at3
other than 100 8C thus can be calculated as follows:17000 1 1
y pž / C H1.987 373 T 2 40.0176ePPh 3TTOF s 20Ž .Propanal p PPhCO 3
1 q 0.000496 q 31.8PPh p3 CO
and3400 1 1
y pTOF ž / HEthane 1.987 373 T 2s 0.00202e 21Ž .TOF pPropanal CO
Ž . Ž . w xTOF is in mol product r mol Rh s , pressures are in kPa, and PPh is in mol r l.3
4. Conclusions
Ž .The kinetics of ethene hydroformylation with Rh r PPh catalyst P r Rh ) 3 is first order in3
rhodium. The kinetic order for ethene is also one at the industrially important conditions, when theŽ .PPh concentration is relatively high ) 50 mmol r l . However, the combination of low phosphine3
and high olefin concentration leads to a saturation in ethene. The kinetic effect of the CO and PPh 3
ligands is also a function of their concentration: both inhibit the reaction above a threshold value,below which a positive fractional order can be observed. Hydrogen has little effect on the rate of hydroformylation in the ethene first order kinetic regime. It does have an effect, however, whenethene saturation occurs: increasing hydrogen pressure increases the reaction rate by expanding theethene first order regime. This phenomenon may be linked to a shift in the rate determining step of the reaction. Activation energies obtained at constant PPh r CO ratios range between 18.2 and 19.13
kcalr mol for hydroformylation and 22 kcal r mol for hydrogenation.Under typical hydroformylation conditions the selectivity for propionaldehyde is nearly 100%. TheŽ .olefin hydrogenation selectivity is low approximately 0.2–0.4 mol% and can be described by a
linear function of the p r p ratio. Ethane selectivity increases with increasing temperature,H CO2
indicating that the activation energy for olefin hydrogenation is higher than hydroformylation. Thealdehyde hydrogenation selectivity is very low. Propanol can only be detected in long term CSTRruns.
Our kinetic data suggest that the rate-determining step in the ethene first order regime is olefinw xaddition or olefin insertion. Based on a refined Wilkinson mechanism 1 , a kinetic model has been
developed to predict the rates of ethene hydroformylation and hydrogenation. In this model thehydrogenation vs. hydroformylation selectivity is determined by the competition of H vs. CO for a2
16-electron alkyl intermediate in a post-rate-determining step. The model has proved to be veryaccurate even at operating conditions which are outside of its database.
Acknowledgements
The authors would like to thank the management of Exxon Research and Engineering and ExxonChemical for their support. We would also like to thank Dr. Roy L. Pruett and Dr. Harry W.Deckman for the many useful discussions.
( )G. Kiss et al. r Journal of Molecular Catalysis A: Chemical 138 1999 155–176 176
References
w x Ž .1 C.A. Tolman, J.W. Faller, Mechanistic studies of catalytic reactions using spectroscopic and kinetic techniques, in: L.H. Pignolet Ed. ,Homogeneous Catalysis with Metal Phosphine Complexes, Plenum, New York, 1983.
w x Ž . Ž .2 C.D. Frohning, Ch. W. Kohlpaintner, Hydroformylation oxo synthesis, Roelen reaction , in: B. Cornils, W.A. Herrmann Eds. ,Applied Homogeneous Catalysis with Organometallic Compounds, Vol. 1, VCH, New York, 1996.
w x Ž . Ž .3 D. Evans, G. Yagupsky, G. Wilkinson, J. Chem. Soc. A 1968 2660.w x Ž . Ž .4 D. Evans, J.A. Osborn, G. Wilkinson, J. Chem. Soc. A 1968 3133.w x Ž . Ž .5 G. Yagupsky, C.K. Brown, G. Wilkinson, J. Chem. Soc. A 1970 1392.w x Ž . Ž .6 C.K. Brown, G Wilkinson, J. Chem. Soc. A 1970 2753.w x Ž .7 R.F. Heck, D.S. Breslow, J. Am. Chem. Soc. 82 1960 4438.w x Ž . Ž .8 D.S. Breslow, R.F. Heck, Chem. Ind. London 1960 467.w x Ž .9 R.F. Heck, D.S. Breslow, J. Am. Chem. Soc. 83 1961 4023.
w x Ž .10 R.F. Heck, D.S. Breslow, J. Am. Chem. Soc. 84 1962 2499.w x Ž .11 D.E. Morris, H.B. Tinker, CHEMTECH 1972 554.w x Ž .12 T. Ueda, Proc. 5th Int. Congr. Catal. 1 1973 431.w x Ž .13 R.B. King, A.D. King, M.Z. Iqbal, J. Am. Chem. Soc. 101 1979 4893.w x Ž .14 A.A. Oswald, J.S. Merola, E.J. Mozeleski, R.V. Kastrup, J.C. Reisch, ACS Symp. Ser. 171 1981 503.w x15 A.A. Oswald, D.E. Hendriksen, R.V. Kastrup, J.S. Merola, J.C. Reisch, Preprints Div. Petr. Chem., ACS Natl. Meeting, Las Vegas,