Eastern Michigan University DigitalCommons@EMU Master's eses and Doctoral Dissertations Master's eses, and Doctoral Dissertations, and Graduate Capstone Projects 2007 e effect of the reducing agent triphenylphosphine on arachidonic acid metabolism by prostaglandin H2 synthase Lalini Ailaboina Follow this and additional works at: hp://commons.emich.edu/theses Part of the Chemistry Commons is Open Access esis is brought to you for free and open access by the Master's eses, and Doctoral Dissertations, and Graduate Capstone Projects at DigitalCommons@EMU. It has been accepted for inclusion in Master's eses and Doctoral Dissertations by an authorized administrator of DigitalCommons@EMU. For more information, please contact [email protected]. Recommended Citation Ailaboina, Lalini, "e effect of the reducing agent triphenylphosphine on arachidonic acid metabolism by prostaglandin H2 synthase" (2007). Master's eses and Doctoral Dissertations. 19. hp://commons.emich.edu/theses/19
Transcript
Eastern Michigan UniversityDigitalCommons@EMU
Master's Theses and Doctoral Dissertations Master's Theses, and Doctoral Dissertations, andGraduate Capstone Projects
2007
The effect of the reducing agenttriphenylphosphine on arachidonic acidmetabolism by prostaglandin H2 synthaseLalini Ailaboina
Follow this and additional works at: http://commons.emich.edu/theses
Part of the Chemistry Commons
This Open Access Thesis is brought to you for free and open access by the Master's Theses, and Doctoral Dissertations, and Graduate Capstone Projectsat DigitalCommons@EMU. It has been accepted for inclusion in Master's Theses and Doctoral Dissertations by an authorized administrator ofDigitalCommons@EMU. For more information, please contact [email protected].
Recommended CitationAilaboina, Lalini, "The effect of the reducing agent triphenylphosphine on arachidonic acid metabolism by prostaglandin H2 synthase"(2007). Master's Theses and Doctoral Dissertations. 19.http://commons.emich.edu/theses/19
Figure 30. Mass spectrum of standard PGE2……………………………................................40
Figure 31. Synthetic scheme for the production of derivative of 12(s) HpETE……....……..41
Figure 32. Chromatogram of standard 12 hydroperoxyeicasinotetranoic acid
treated with triphenylphosphine (12-hydroxyeicasinotetraenoic acid).…............41
Figure 33. Mass spectrum of the peak presented in Figure 32………………………..……...42
Figure 34. Chromatogram of 15-hydroxyeicosatetranoic acid………………….…………....42
Figure 35. Mass spectrum of 15-hydroxyeicasinotetranoic acid……………………..……....43
Figure 36. Chromatogram of 5, 15-Di-HeTE methyl ester-oxime-silyl derivative
following hydrogenation………………………………………………...........…44
Figure 37. Mass spectrum of 5, 15-Di-HeTE methyl ester-oxime-silyl derivative
following hydrogenation…………………………………………….....................44 Figure 38. Gas chromatogram of standard 5, 15- DiHeTE…...……………………………...45 Figure 39. Mass spectrum of 5, 15-DiHeTE derivative sample…………………...………....45 Figure 40. Gas chromatogram of 11, 12-DiHETrE……………………………………..……46
x
xi
Figure 41. Mass spectrum of 11, 12-DiHETrE…………..…………………………………..46 Figure 42. Formation and stimulatory function of 12-HpETE on the cycloxygenase.
Triphyenylphosphine (TPP) may be involved in stimulating the production of
12-HETE, presumably via the 12-HpETE, and the reduction in the level of
12- HpETE lowers the activity of COX and, hence reduces the PGE2
produced during metabolism………………………………………………….…..49
Chapter 1. Introduction
1.1 Research objective
The main research objective was to investigate the role of hydroperoxides contained
in arachidonic acid preparations and in PGHS preparations in stimulating cyclooxygenase
activity. The project used the reducing agent triphenylphosphine to remove the
hydroperoxides during metabolism and in arachidonic acid preparations.
1.2 Arachidonic acid
1.2a. Lipids and fatty acids
The class of biological molecules that are insoluble in aqueous solvents but are
soluble in organic solvents are known as lipids (1). Lipids not only comprise the biological
membranes that provide a semi-permeable barrier into and out of the cell but are also a store-
house of energy-yielding molecules. The lipids are classified into fatty acids, steroids,
triglycerides, phospholipids, and sphingolipids.
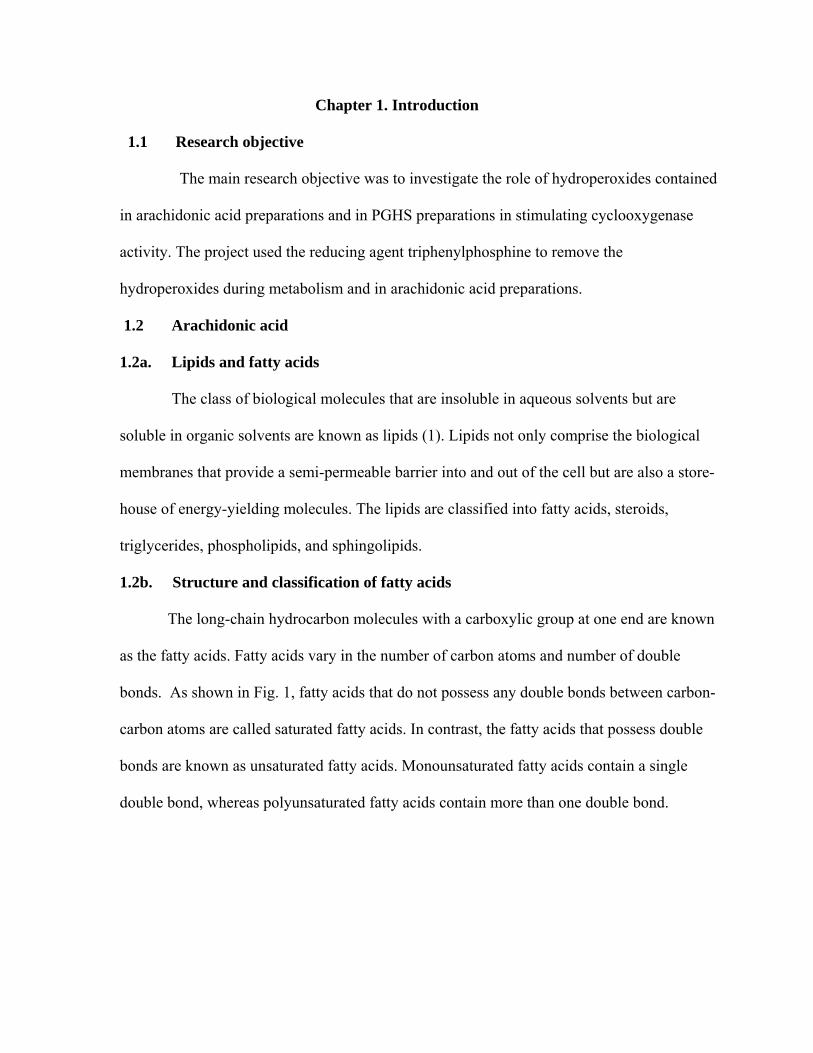
1.2b. Structure and classification of fatty acids
The long-chain hydrocarbon molecules with a carboxylic group at one end are known
as the fatty acids. Fatty acids vary in the number of carbon atoms and number of double
bonds. As shown in Fig. 1, fatty acids that do not possess any double bonds between carbon-
carbon atoms are called saturated fatty acids. In contrast, the fatty acids that possess double
bonds are known as unsaturated fatty acids. Monounsaturated fatty acids contain a single
double bond, whereas polyunsaturated fatty acids contain more than one double bond.
COOH
CH3
Palmitic acid
COOH
CH3
Stearic Acid
CH3COOH
Palmitoleic acid
CH3COOH
Oleic acid
CH3COOH
Arachidonic acid
Figure 1. Structures of saturated and unsaturated fatty acids.
These fatty acids occur naturally in plants but not in animals. Some of the fatty acids
have to be taken through diet, and they are referred to as essential fatty acids. Examples of
essential fatty acids are linoleic, linolenic, and arachidonic acid. The other forms of fatty
acids that are produced in the body and thus are not required in the diet are known as
nonessential fatty acids.
1.2c. Nomenclature of fatty acids
According to the International Union of Pure and Applied Chemistry system of
nomenclature, these fatty acids are named based on number of carbon atoms and the position
of the double bond as shown in Table 1. The carboxylic carbon is numbered as one, and all
2
other carbon atoms are numbered relative to the carboxylic carbon. For example, in 9, 12-
octadecanoic acid, the 9, 12 indicates the positions of double bonds at the carbon atoms.
An alternative nomenclature for fatty acids is based on the omega reference,
indicating the number of carbon atoms, double bonds, and the position of the double bond
relative to the omega carbon, which is the terminal carbon at the methyl end of the fatty acid
eicosatrienoic acid), and 5, 15- DiHETE (5, 15-dihydroxy eicosatetraenoic acid) as there
were no carbonyl groups in their structures for the preparation of oxime derivatives.
2.9 GC-MS conditions
25
All of the derivatized samples were analyzed on a model 3800 Saturn Varian gas
chromatograph with a model 2200 mass spectrometer. The carrier gas was helium, which is
inert, with a fused silica column, which was 30 m long with a diameter of 0.25mm and 0.25
μm film thickness. The mode of ionization of the samples was by electron impact ionization
by injecting 1μL of the sample on the GC column. The column oven temperature conditions
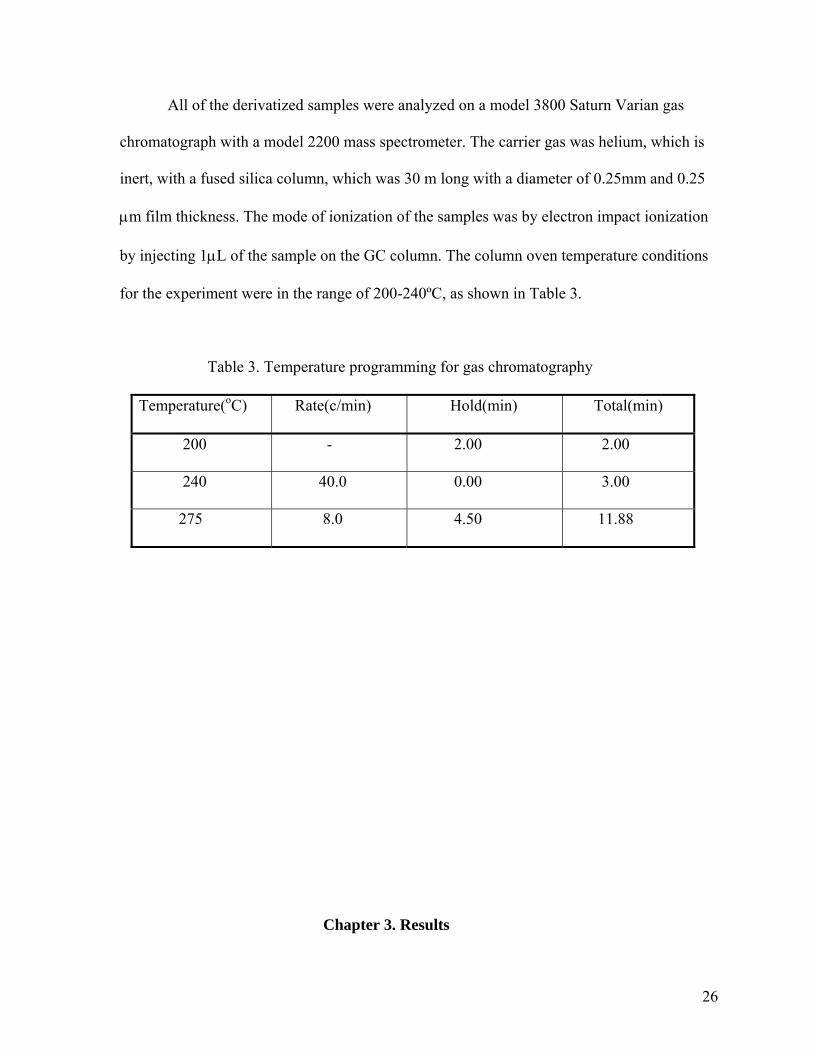
for the experiment were in the range of 200-240ºC, as shown in Table 3.
Table 3. Temperature programming for gas chromatography
Temperature(oC) Rate(c/min) Hold(min) Total(min)
200 - 2.00 2.00
240 40.0 0.00 3.00
275 8.0 4.50 11.88
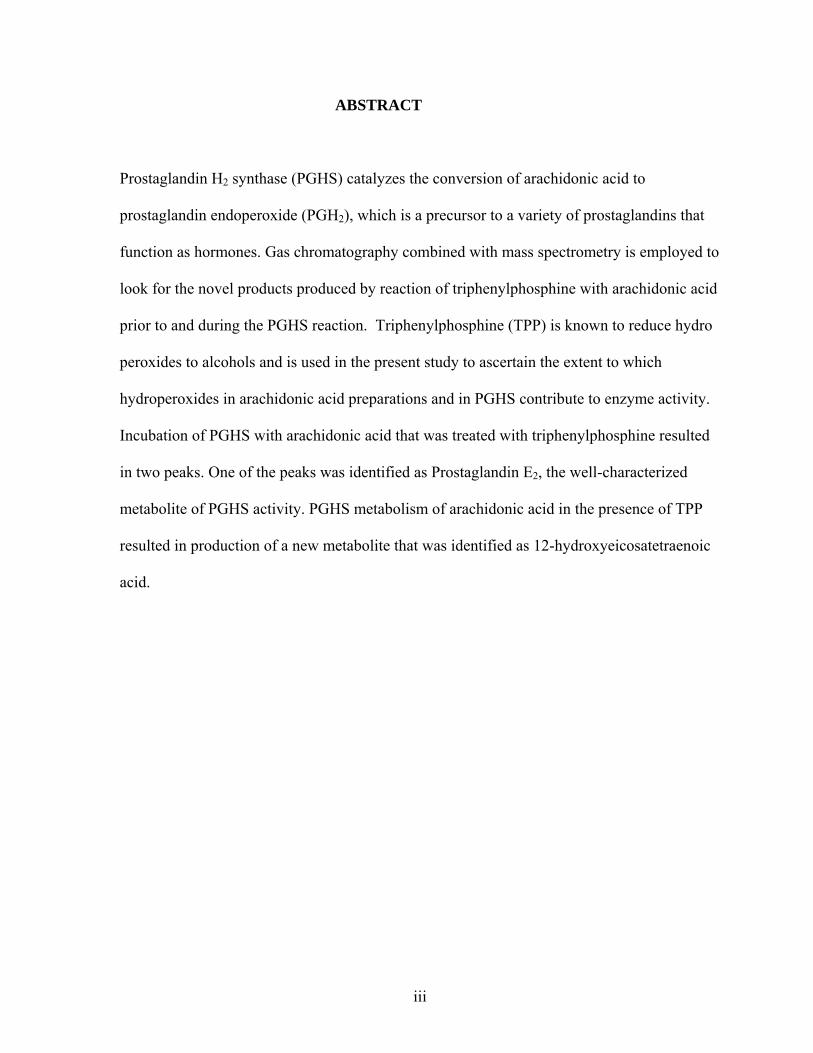
Chapter 3. Results
26
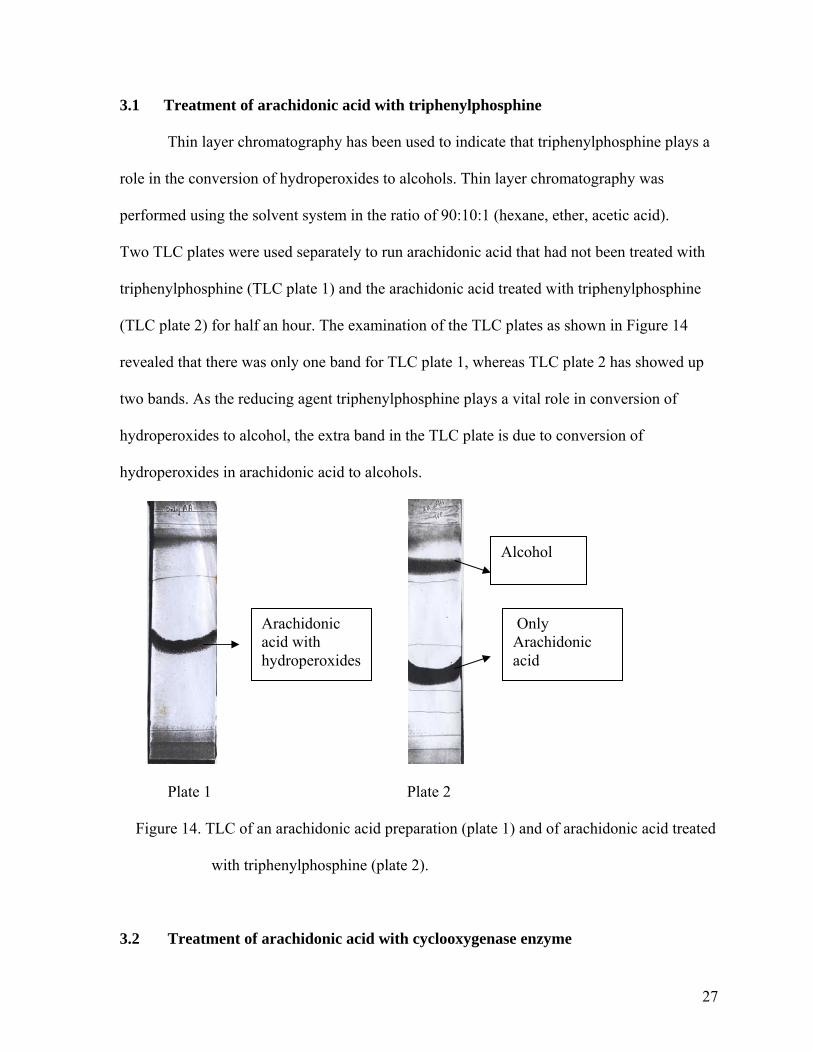
3.1 Treatment of arachidonic acid with triphenylphosphine Thin layer chromatography has been used to indicate that triphenylphosphine plays a
role in the conversion of hydroperoxides to alcohols. Thin layer chromatography was
performed using the solvent system in the ratio of 90:10:1 (hexane, ether, acetic acid).
Two TLC plates were used separately to run arachidonic acid that had not been treated with
triphenylphosphine (TLC plate 1) and the arachidonic acid treated with triphenylphosphine
(TLC plate 2) for half an hour. The examination of the TLC plates as shown in Figure 14
revealed that there was only one band for TLC plate 1, whereas TLC plate 2 has showed up
two bands. As the reducing agent triphenylphosphine plays a vital role in conversion of
hydroperoxides to alcohol, the extra band in the TLC plate is due to conversion of
hydroperoxides in arachidonic acid to alcohols.
Alcohol
Arachidonic acid with hydroperoxides
Only Arachidonic acid
Plate 1 Plate 2
Figure 14. TLC of an arachidonic acid preparation (plate 1) and of arachidonic acid treated
with triphenylphosphine (plate 2).
3.2 Treatment of arachidonic acid with cyclooxygenase enzyme
27
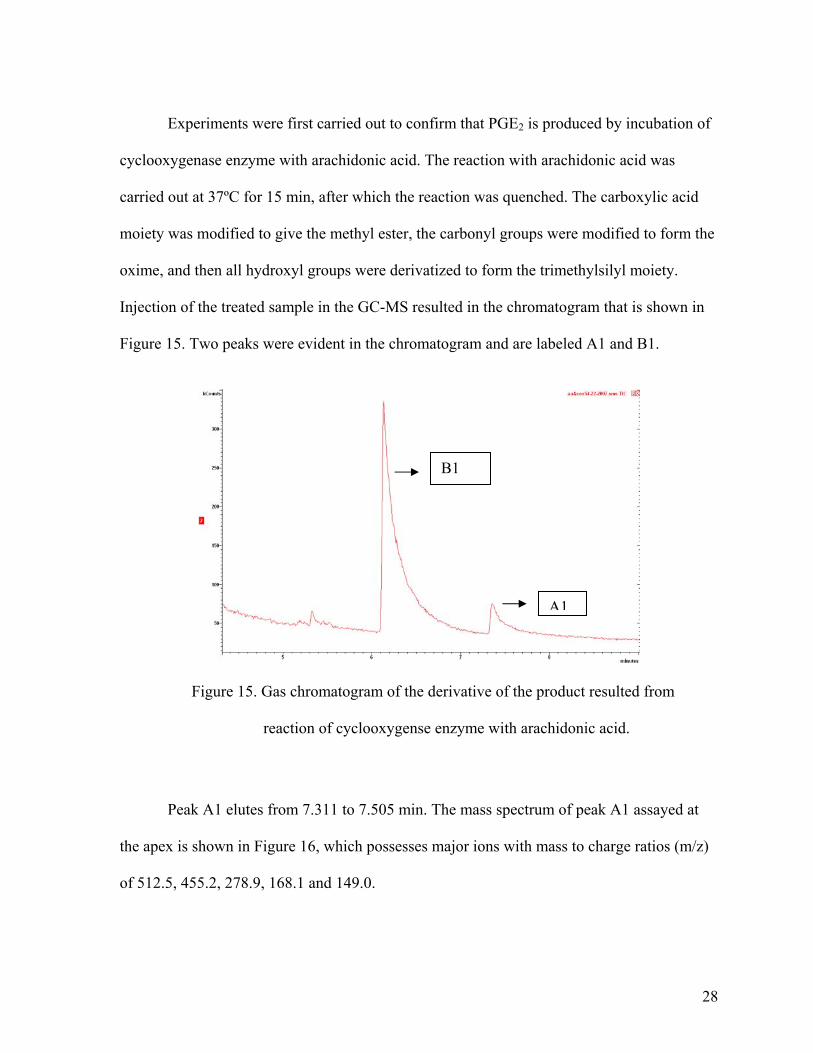
Experiments were first carried out to confirm that PGE2 is produced by incubation of
cyclooxygenase enzyme with arachidonic acid. The reaction with arachidonic acid was
carried out at 37ºC for 15 min, after which the reaction was quenched. The carboxylic acid
moiety was modified to give the methyl ester, the carbonyl groups were modified to form the
oxime, and then all hydroxyl groups were derivatized to form the trimethylsilyl moiety.
Injection of the treated sample in the GC-MS resulted in the chromatogram that is shown in
Figure 15. Two peaks were evident in the chromatogram and are labeled A1 and B1.
B1
A1
Figure 15. Gas chromatogram of the derivative of the product resulted from
reaction of cyclooxygense enzyme with arachidonic acid.
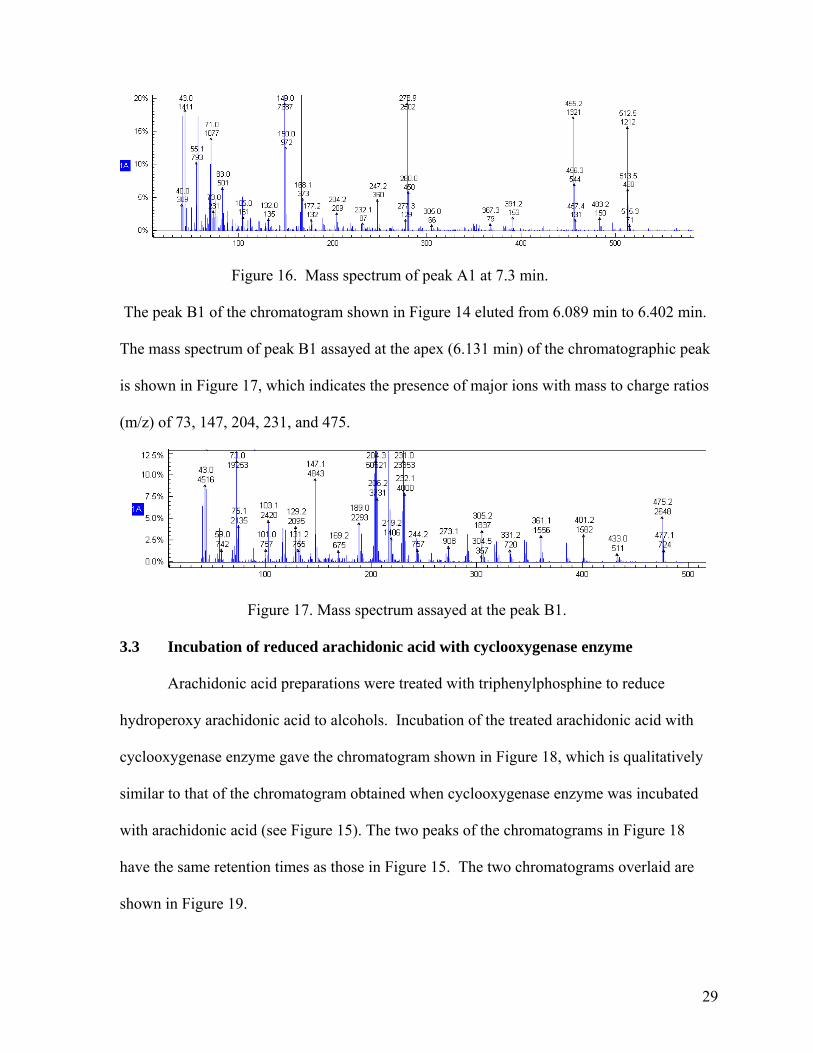
Peak A1 elutes from 7.311 to 7.505 min. The mass spectrum of peak A1 assayed at
the apex is shown in Figure 16, which possesses major ions with mass to charge ratios (m/z)
of 512.5, 455.2, 278.9, 168.1 and 149.0.
28
Figure 16. Mass spectrum of peak A1 at 7.3 min.
The peak B1 of the chromatogram shown in Figure 14 eluted from 6.089 min to 6.402 min.
The mass spectrum of peak B1 assayed at the apex (6.131 min) of the chromatographic peak
is shown in Figure 17, which indicates the presence of major ions with mass to charge ratios
(m/z) of 73, 147, 204, 231, and 475.
Figure 17. Mass spectrum assayed at the peak B1.
3.3 Incubation of reduced arachidonic acid with cyclooxygenase enzyme
Arachidonic acid preparations were treated with triphenylphosphine to reduce
hydroperoxy arachidonic acid to alcohols. Incubation of the treated arachidonic acid with
cyclooxygenase enzyme gave the chromatogram shown in Figure 18, which is qualitatively
similar to that of the chromatogram obtained when cyclooxygenase enzyme was incubated
with arachidonic acid (see Figure 15). The two peaks of the chromatograms in Figure 18
have the same retention times as those in Figure 15. The two chromatograms overlaid are
shown in Figure 19.
29
B2
A2
Figure 18. Gas chromatogram of the derivative of product produced by treatment of
reduced arachidonic acid with cyclooxygenase enzyme
B1
B2
A1
A2
Figure 19. Chromatograms generated by reaction of cyclooxygenase enzyme with
. arachidonic acid (light line) or with arachidonic acid treated with
triphenylphosphine (dark line) prior to incubation with cyclooxygenase
enzyme.
The total ion intensity of peak B1 and B2 as shown in Figure 19 is greater than the
ion intensity of peak A1 and A2, indicating that the product associated with this peak is most
30
likely produced to a greater extent than the product that gave rise to peaks A1 and A2. The
two very small peaks eluted at 5.3 min, as shown in Figure 19, which are generated by
reaction of cyclooxygenase with arachidonic acid and treatment of arachidonic acid with
triphenylphosphine prior to incubation with cyclooxygenase enzyme, was due to the
ethylacetate solvent background.
The A2 metabolite eluted from 7.303 min to 7.506 min. The mass spectrum of peak
A2 has major ions with mass to charge ratios (m/z) of 512.5, 455.3, 391.3, 279.1, 149.1 and
71 as shown in Figure 20.
Figure 20. Mass spectrum of peak A2 produced by incubation of cyclooxygenase
enzyme with arachidonic acid treated with triphenylphosphine.
The methyl ester, oxime, and silylated derivative of the analyte obtained by reaction
of reduced arachidonic acid reaction with cyclooxygenase enzyme was analyzed by gas
chromatography and mass spectrometry. One peak in the resultant chromatogram
characterized as B2 elutes from 6.093 to 6.409 min. The mass spectrum of the peak B2
assayed at 6.134 min has major ions with mass to charge ratios (m/z) of 73.0, 147.1, 204.3,
231.1, and 475.2, as shown in Figure 21, which are the same ions as are observed for the B1
metabolite presented earlier. Thus, the identity of the B2 metabolite produced by
31
cyclooxygenase is the same as that of the B1 metabolite produced during incubation of
arachidonic acid with cyclooxygenase.
Figure 21. Mass spectrum of peak B2.
3.4 Incubation of reduced arachidonic acid and triphenylphosphine with
cyclooxygenase enzyme
The treatment of arachidonic acid with cyclooxygenase enzyme and the incubation of
reduced arachidonic acid with cyclooxygenase enzyme have generated similar
chromatograms with elution of peaks A1, A2 and B1, B2 at identical retention times. So one
more experiment was conducted where the cyclooxygenase enzyme was treated with
triphenylphosphine with the assumption that any peroxides present in cyclooxygenase
enzyme-I would be reduced with triphenylphosphine.
The prepared derivatives of the product resulting from reaction between
cyclooxygenase enzyme treated with triphenylphosphine and reduced arachidonic acid were
injected onto the GC and gave three different peaks as shown in Figure 22. This reaction
possessed an extra peak C relative to those obtained for the other experiments carried out
with cyclooxygenase enzyme. Peak A3 elutes from 7.324 to7.509 min and the mass
32
spectrum of peak A3 has major ions with mass to charge ratios (m/z) of 512, 455, 279, 168,
149, and 73 as shown in Figure 23.
C
B3
A3
Figure 22. Chromatogram of the derivative of product produced by incubation of reduced
arachidonic acid and cyclooxyenase enzyme treated with triphenylphosphine.
Figure 23. Mass spectrum of peak A3 of the product of the reaction between cyclooxygenase
enzyme and triphenylphosphine-treated arachidonic acid and triphenylphosphine.
33
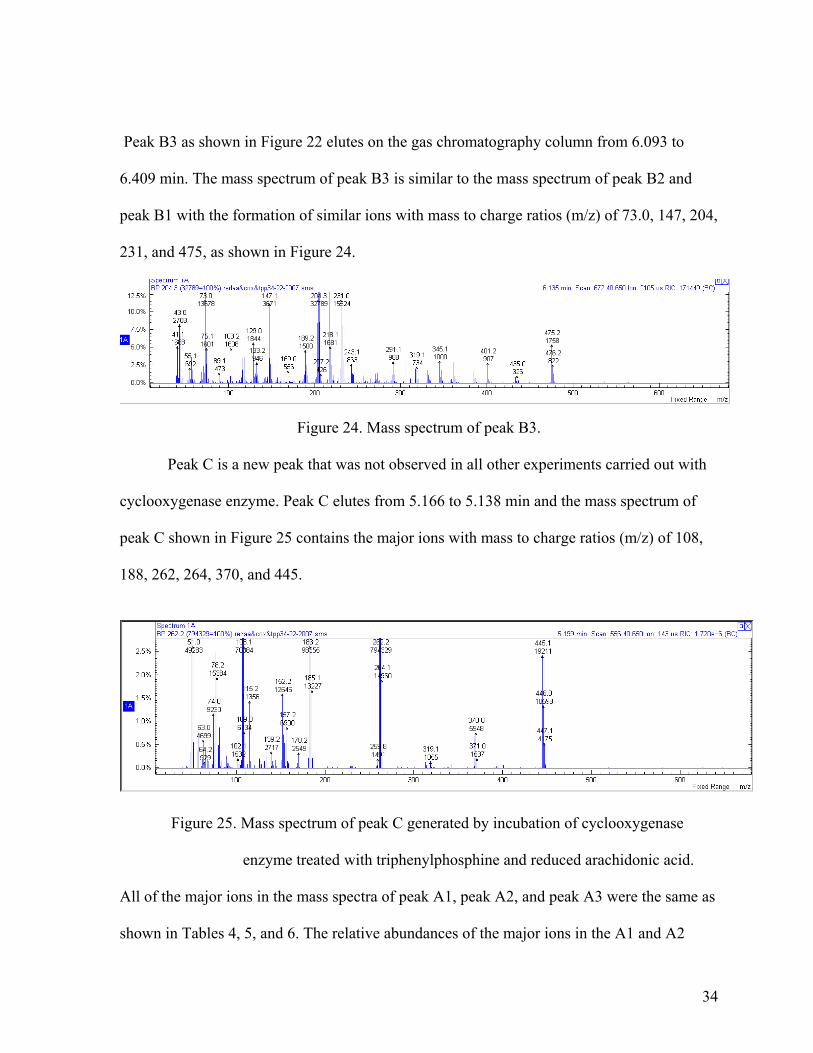
Peak B3 as shown in Figure 22 elutes on the gas chromatography column from 6.093 to
6.409 min. The mass spectrum of peak B3 is similar to the mass spectrum of peak B2 and
peak B1 with the formation of similar ions with mass to charge ratios (m/z) of 73.0, 147, 204,
231, and 475, as shown in Figure 24.
Figure 24. Mass spectrum of peak B3.
Peak C is a new peak that was not observed in all other experiments carried out with
cyclooxygenase enzyme. Peak C elutes from 5.166 to 5.138 min and the mass spectrum of
peak C shown in Figure 25 contains the major ions with mass to charge ratios (m/z) of 108,
188, 262, 264, 370, and 445.
Figure 25. Mass spectrum of peak C generated by incubation of cyclooxygenase
enzyme treated with triphenylphosphine and reduced arachidonic acid.
All of the major ions in the mass spectra of peak A1, peak A2, and peak A3 were the same as
shown in Tables 4, 5, and 6. The relative abundances of the major ions in the A1 and A2
34
mass spectra were identical. However, the relative abundance of the ions 279.2, 167.2, and
149.2 for the mass spectrum of A3 were lowered relative to their abundance for A1 and A2.
Table 4. Major ions and their abundances relative to the 512.5 ion in the mass spectrum
of the metabolite associated with peak A1.
Major ions in peak
A1 mass spectrum
Peak Area
Abundance
Abundance relative to the
m/z 512.5
512.5 1212 1.00
455.3 1312 1.08
279.2 2502 2.06
167.2 2926 2.41
149.2 7687 6.34
Table 5. Abundances of the major ions relative to that of the m/z 512.5 ion in the A2 mass
spectrum.
Major ions in peak
A2 mass spectrum
Peak Area
Abundance
Abundance relative to the
m/z 512.5
512.5 969 1.00
455.3 938 1.00
279.2 2026 2.09
167.2 2986 3.018
149.2 6005 6.19
35
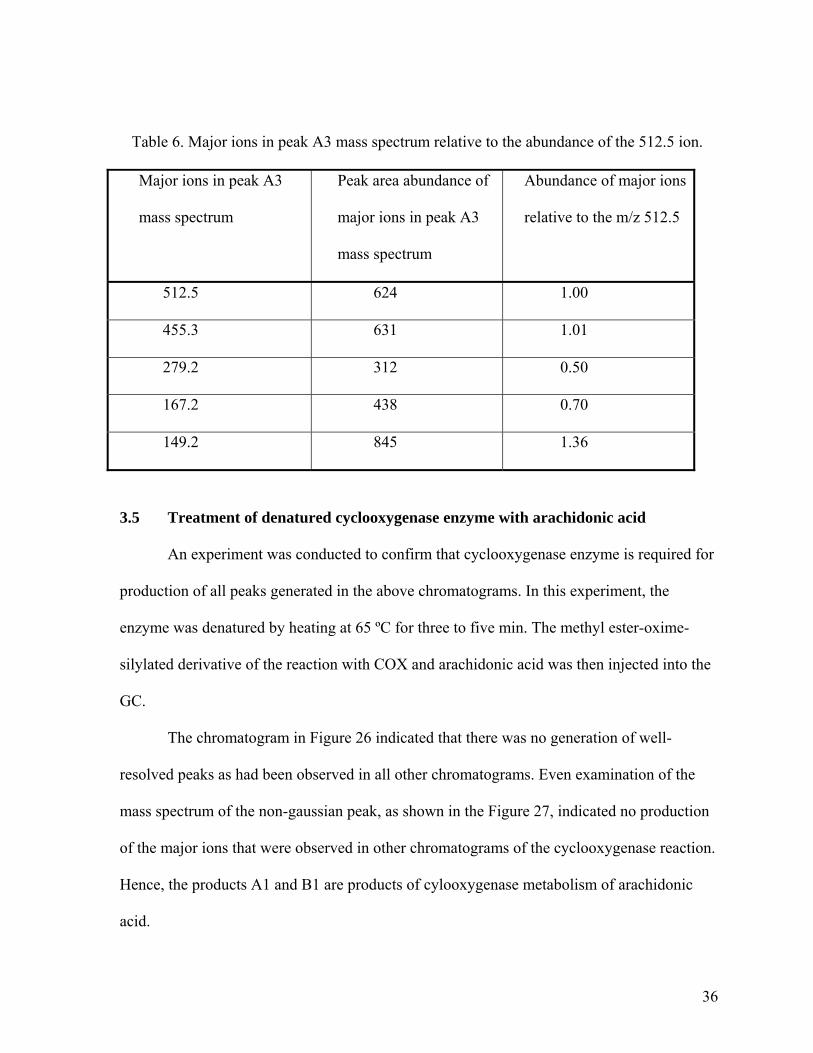
Table 6. Major ions in peak A3 mass spectrum relative to the abundance of the 512.5 ion.
Major ions in peak A3
mass spectrum
Peak area abundance of
major ions in peak A3
mass spectrum
Abundance of major ions
relative to the m/z 512.5
512.5 624 1.00
455.3 631 1.01
279.2 312 0.50
167.2 438 0.70
149.2 845 1.36
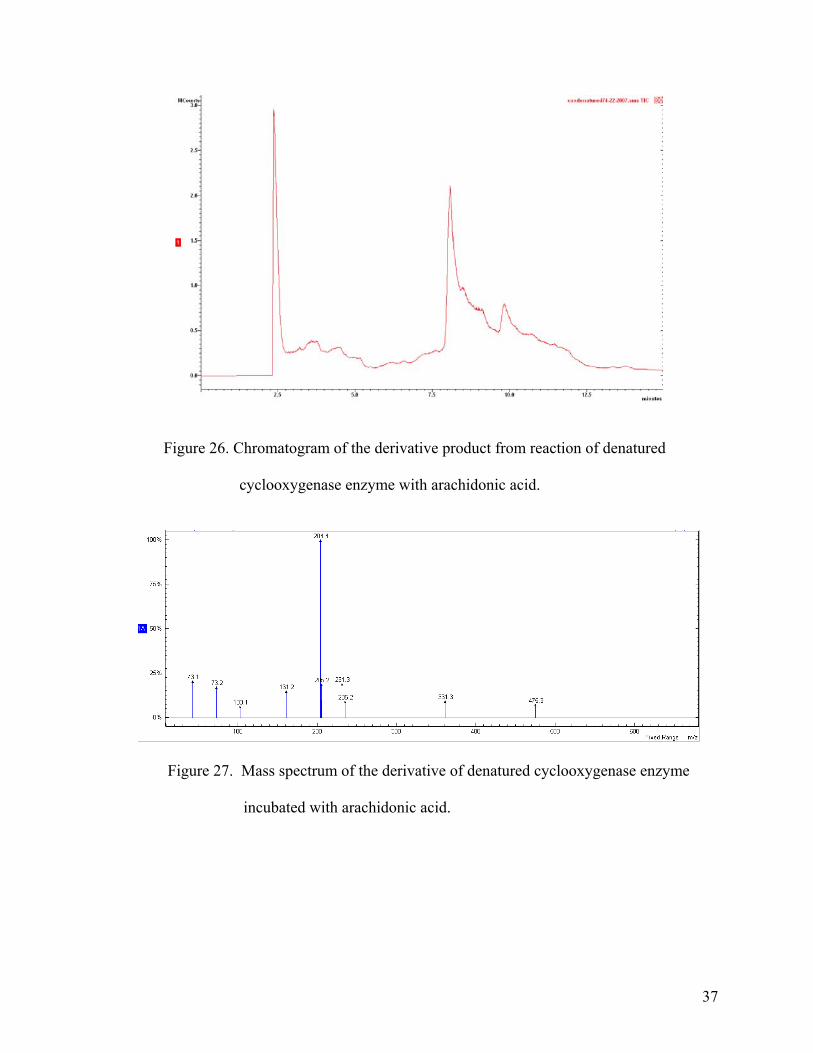
3.5 Treatment of denatured cyclooxygenase enzyme with arachidonic acid
An experiment was conducted to confirm that cyclooxygenase enzyme is required for
production of all peaks generated in the above chromatograms. In this experiment, the
enzyme was denatured by heating at 65 ºC for three to five min. The methyl ester-oxime-
silylated derivative of the reaction with COX and arachidonic acid was then injected into the
GC.
The chromatogram in Figure 26 indicated that there was no generation of well-
resolved peaks as had been observed in all other chromatograms. Even examination of the
mass spectrum of the non-gaussian peak, as shown in the Figure 27, indicated no production
of the major ions that were observed in other chromatograms of the cyclooxygenase reaction.
Hence, the products A1 and B1 are products of cylooxygenase metabolism of arachidonic
acid.
36
Figure 26. Chromatogram of the derivative product from reaction of denatured
cyclooxygenase enzyme with arachidonic acid.
Figure 27. Mass spectrum of the derivative of denatured cyclooxygenase enzyme
incubated with arachidonic acid.
37
3.6 Identification of chromatographic peaks
Attempts were made to identify the peaks produced under various conditions of
incubation of arachidonic acid and cyclooxygenase enzyme. Figure 28 is an overlay of all
three chromatograms produced by different experiments conducted with the cyclooxygenase
enzyme. In all of the experiments, peaks at 7.3 min and 6.2 min were observed. The mass
spectrum of peaks A1, A2, and A3 at 7.3 min are qualitatively the same in all of the three
cases with major ions of mass to charge ratio of m/z of 512, 455, 391, 279, 73, and all have
the same retention time. Even the mass spectrum of peaks B1, B2, and B3 at 6.091 min are
identical with the presence of major ions with m/z of 73.0, 147.1, 204.3, 231.0, and 475.2.
C
B1
B3
B2A1
A2 A3
Figure 28. Superimposed chromatograms of derivatives of products resulting from reaction
between cyclooxygenase enzyme and arachidonic acid (A1, B1), cyclooxygenase
enzyme and triphenylphosphine-treated arachidonic acid (A2,B2), or
cyclooxygenase enzyme treated with triphenylphosphine and triphenylphosphine
treated with arachidonic acid (A3, B3, C).
38
Under identical conditions for preparation of the derivative and assay by GC-MS,
various standards were run to identify the peaks produced in the cyclooxygenase reactions.
3.6a Identification of peak at 7.3 min (A1, A2, and A3) The peak at 7.3 min was identified as prostaglandin E2 (PGE2), which has similar
mass spectrum and retention time similar to that of standard PGE2. The standard PGE2 peak
eluted from 7.325 to 7.842 min as observed in the Figure 29, and the mass spectrum has been
taken with peak apex at 7.394 min. The mass spectrum of standard PGE2 has shown all the
major ions of mass to charge ratios (m/z) of 512.5, 455.5, 391.2, 279.1, 149.1, and 73, as
shown in Figure 30, and has qualitatively the same mass spectrum as those for peaks A1, A2,
and A3 (see Figures 16, 20, and 23 for comparison).
Figure 29. Gas chromatogram of the methyl ester-oxime-silylated derivative of the
standard prostaglandin E2.
39
Figure 30. Mass spectrum of standard PGE2. 3.6b Identification of peak at 5.2 min (Peak C) The additional peak at 5.2 min was identified as one of the monohydroxy compounds
as shown in Figure 31. The standard 12-hydroperoxyeicosatetraenoic acid (HpETE) was
treated for 30 min with triphenylphosphine (5mg) dissolved in ether (100µL). The methyl
ester and silylated derivative was then prepared according to the procedure described in the
experimental section, and the synthetic scheme is shown in Figure 31. As there are no
carbonyl groups in the chemical structure of 12-hydroperoxy-eicosatetraenoic acid, the
methoximation or oxime derivative was not prepared. The hydroperoxide in the HpETE was
reduced to an alcohol by the treatment with the triphenylphosphine. The reduced product of
HpETE is 12-hydroxyeicosatetraenoic acid (12-HETE). Peak C elutes at the same time as 12-
hydroxyeicosatetraenoic acid at 5.2 min as shown in Figure 32, and the mass spectrum of
peak C exactly matches that of 12-HETE shown in Figure 33. Based on retention time and
mass spectrum, the peak at 5.2 min (C) has been identified as 12-hydroxyeicosatetraenoic
acid.
40
CO
OH
OOH
CO
OH
OH
CO
O
OH
CH3CO
O
O
CH3
Si CH3
CH3
CH3
TPP
TMSD
BSTFA
TMCS
12(s)HpETE
Figure 31. Synthetic scheme for the production of derivative of 12(s) HpETE.
Figure 32. Chromatogram of standard 12-hydroperoxyeicasinotetraenoic acid treated with triphenylphosphine (12-hydroxyeicasinotetraenoic acid).
41
Figure 33. Mass spectrum of the peak presented in Figure 32.
3.6c Attempts to identify the peak at 6.2 min (B1, B2, B3)
Attempts were made to identify the metabolite at 6.2 min, although neither the mass
spectra of the standards nor the retention time matched those of this product. As one of the
peaks at 5.2 min had been identified as a monohydroxy fatty acid, it was suspected that
peaks B1, B2, and B3 were monohydroxy fatty acid as well. The methyl ester-oxime-silyl
derivative of the standard 15-hydroxyeicosatetraenoic acid was submitted to evaluation on
GC-MS, and the peak eluted from 5.149 to 5.431 min, as shown in Figure 34. The mass
spectrum of the 15-hydroxyeicasinotetraenoic acid is shown in Figure 35.
Figure 34. Chromatogram of 15-hydroxyeicosatetraenoic acid.
42
Figure 35. Mass spectrum of 15-hydroxyeicasinotetraenoic acid.
The mass spectrum of 15-hydroxyeicosatetraenoic acid did not match the mass
spectrum of the peak at 6.2 min, so more trials were attempted with standard
dihydroxycompounds. Similarly derivatized dihydroxy compounds were injected onto the
gas chromatograph and analyzed following mass fragmentation. Some of the standards were
hydrogenated, which involves the reduction of the double bond, as some of the standard
samples did not yield a respectable, gaussian peak. Hydrogenation was performed by
addition of 50 μL glacial acetic acid and addition of a small amount of palladium oxide
catalyst, and then the preparation was treated with hydrogen gas for 15 min. After the
hydrogenation step, the methyl ester-oxime-silylated derivative was prepared. The standard
eluted from 5.280 to 5.468 min, as shown in Figure 36. The mass spectrum is shown in the
Figure 37 with a peak apex at 5.323 min.
43
Figure 36. Chromatogram of 5,15-Di-HeTE methyl ester-oxime-silyl derivative
following hydrogenation.
Figure 37. Mass spectrum of 5, 15-Di-HeTE methyl ester-oxime-silyl derivative following
hydrogenation.
A second sample of 5,15 Di-HeTE derivative was prepared but without
hydrogenation and was injected onto the GC. The retention time of the sample was 5.285 to
5.465 min, as shown in Figure 38. The mass spectrum of the sample is shown in Figure 39
for the peak apex at 5.319min. The mass spectrum was very complex with no identifiable
prominent ions.
44
Figure 38. Gas chromatogram of standard 5, 15-DiHeTE.
Figure 39. Mass spectrum of 5, 15-DiHeTE derivative sample. Finally, an 11, 12-DiHETrE sample was hydrogenated and then injected onto the GC,
which resulted in a chromatogram as shown in Figure 40 with a retention time ranging from
5.280 to 5.453 min and the mass spectrum as shown in Figure 41.
45
Figure 40. Gas chromatogram of 11, 12-DiHETrE.
Figure 41. Mass spectrum of 11, 12-DiHETrE.
46
Chapter 4. Discussion Many scientists have done extensive research to understand the basis of the enzymatic
mechanism of the cyclooxygenase enzyme. In the process of exploring its enzymatic activity,
many of the researchers emphasized the importance of characterizing the metabolites
produced by the cyclooxygenase enzyme. The principle metabolite from arachidonic acid
metabolism by COX, PGE2, is thought to be mainly responsible for the development of
inflammation, which plays a major role in the development of various chronic diseases. In a
departure from the usual methods or assays that have been developed for analysis of PGE2 by
cyclooxygenase enzyme, triphenylphosphine, a reducing agent, was incorporated into the
reaction mixture along with substrate in the present study. It is known that
triphenylphosphine reduces hydroperoxides of arachidonic acid leading to production of
alcohols (52). The reducing agent was used to generate a peroxide-free preparation of
arachidonic acid that was then used as a substrate in the cyclooxygenase reaction. Peroxide-
containing species were found in the preparations of arachidonic acid as judged by thin layer
chromatography.
All samples were derivatized according to previously established procedures for the
analysis of fatty acids and prostaglandins (53). Under all conditions examined, a peak at 7.3
min and another peak at 6.2 min have been observed in the chromatogram. Identification of
the peak at 7.3 min as PGE2 was accomplished by comparison of the mass spectrum with that
of PGE2 standard. Peaks A1, A2, and A3 are produced in decreasing order, indicating that
the amount of production of PGE2 decreases by the treatment of either arachidonic acid with
triphenylphosphine or both arachidonic acid and cyclooxygenase enzyme with
triphenylphosphine. The peak at 6.2 min, which has been observed in all experiments, eluted
47
at the same time and has an identical mass spectrum in all of the chromatograms. The
identification of this peak at 6.2 min was not successful despite the preparation and analysis
of a number of eicosanoid standards.
A unique peak at 5.2 min has been observed with the reaction of cyclooxygenase
enzyme treated with triphenylphosphine and arachidonic acid treated with
triphenylphosphine. This peak has been identified as 12-hydroxyeicosanotetraenoic acid, as
this peak has a similar retention time and a similar mass spectrum pattern as that of the
standard 12-hydroxyeicosatetraenoic acid. The12-hydroxyeicosatetraenoic acid metabolite is
usually produced by metabolism of arachidonic acid via the lipoxygenase pathway. It is not
certain how the 12-hydroxyeicosatetraenoic acid was produced in this experiment and
whether it was cyclooxygenase enzyme or triphenylphosphine that played a role in its
production.
Reports in the literature indicate that hydroperoxides are required for cyclooxygenase
activity (54, 55). Our results are in agreement with this hypothesis, in that 12-
hydroperoxyeicosatetraenoic acid may stimulate the cyclooxygenase activity, thereby
facilitating more production of PGG2, which results in increased amount of PGE2.
Alternatively, it may be stimulating the peroxidase activity of cyclooxygenase enzyme,
which results in increased production of prostaglandin endoperoxide (PGH2) and PGE2. 12-
hydroperoxy eicosatetraenoic acid is reduced to12-hydroxyeicosatetraenoic acid by the
treatment with triphenylphosphine, thereby removing a stimulatory effect on the COX, which
leads to a decrease in the level of PGE2 formed. The hypothetical scheme is shown in Figure
42, which also hypothesizes that TPP directly stimulates the enzyme to generate 12-HETE
via formation of 12-HpETE.
48
Figure 42. Formation and stimulatory function of 12-HpETE on the cycloxygenase.
Triphyenylphosphine (TPP) may be involved in stimulating the production of 12-
HETE, presumably via the 12-HpETE, and the reduction in the level of 12-
HpETE lowers the activity of COX and, hence, reduces the PGE2 produced
during metabolism.
49
One of the future experiments that can be performed is just carrying out the reaction
between arachidonic acid and cyclooxygenase enzyme. After addition of a required amount
of standard 12-hydroperoxyeicasinoteraenoic acid to the reaction mixture, possible increased
production of PGE2 can be observed in comparison to the amount of PGE2 produced by
reaction between cyclooxygenase enzyme and arachidonic acid. This would reveal or
confirm the hypothesis that 12-hydroperoxyeicasinoteraenoic acid is regulating the
production of PGE2. Even further experiments can be carried out to investigate how 12-
hydroperoxyeicasinotetraenoic acid is produced.
50
References
1. Nelson. L. D. Lehninger Principles Of Biochemistry. 3rd Edition. Worth Publishers,
2004, 363-383.
2. Psota. L. T.; Gebauer. K. S.; Etherton. K. P. Am. J. Cardiol . 2006, 98, 3-18.
3. Davidson. F. F.; Dennis. E. A. J. Mol. Evol. 1990, 31, 228-238.
4. Lin. L. L.; Wartmann. M.; Lin. A. Y.; Knopf. J. L.; Seth. A.; Davis. R. J. Cell. 1993, 72,
269-278.
5. Clark. J. D.; Lin. L. L.; Kriz. R. W.; Ramesha. C. S.; Sultzman. L. A.; Lin. A. Y.; Milona.
N.; Knopf. J. L. Cell. 1991, 65, 1043-1051.
6. Porter. N. A.; Funk. M. O. J. Org. Chem. 1975, 40, 3614-3615.
7. Pryor. W. A.; Stanley. J. P. J. Org. Chem. 1975, 40, 3615-3617.
8. Samuelson. D. W. Biol. Bull. 1987, 173, 92-109.
9. Jason. D. M.; Hill. K. E.; Burk. F. R.; Nammour. M. T.; Badr. F. K.; Jackson. R. II. L.
Proc. Natl. Acad. Sci. 1990, 87, 9383-9387.
10. Von Euler. U. J. Physiol. 1936, 88, 213-34.
11. Eliasson. R. Acta Physiol Scand. 1959, 46, 1-73. 12. Smith. W. L. Biochem. J. 1989, 259, 315-324. 13. Schaafsma. D.; Gosens. R.; Bos. T. S.; Meurs. H.; Zaagsma. J. Respiratory Research.
50. Moore, K.; Roberts, L. J. Free. Rad. 1998, 28, 659-671.
51. www.kore.co.uk/graphics/MS-200_tof.gi.
52. Bryant. W. R.; Balley. J. M.; Schewet. T.; Rapoport. M. S. J. Biol. Chem. 1982, 257,
6050-6055.
53. Maas. L. R.; Turk. J.; Oates. A. J.; Brash. A. R. J. Biol. Chem. 1981, 257, 7056-7067.
54. Kulmacz, J. R.; Pendleton, B. R.; Lands, E. M. J. Biol. Chem. 1994, 269, 5527-5536. 55. Kulmacz, J. R.; Wang, L. J. Biol. Chem. 1995, 270, 24019-24023.


![€¦ · (D) Na2[PtC16] In the reaction H 2201 + 111-120 the role of sulphuric acid is[ll (A) oxidising agent (C) dehydrating agent q 21-122011 + I (B) sulphonating agent (D) reducing](https://static.documents.pub/doc/80x56/5f7ebb0a394858652d27fe30/d-na2ptc16-in-the-reaction-h-2201-111-120-the-role-of-sulphuric-acid-isll.jpg)


![UvA-DARE (Digital Academic Repository) Turbulent drag · PDF file... with the drag reducing agent, ... Most Widely Used Drag Reducing Polymer agents [15]. Xanthan gum Polyethylene](https://static.documents.pub/doc/80x56/5aa65ede7f8b9a185d8e899d/uva-dare-digital-academic-repository-turbulent-drag-with-the-drag-reducing.jpg)


