ON-SITE VS. OFF-SITE MANAGEMENT OF ENVIRONMENTAL RESTORATION WASTE: A COST EFFECTIVENESSANALYSIS Michael A. Morse Terradigm, Inc. Albuquerque, NM 87108 Paul L. Aamodt Los Alamos National Laboratory Los Alamos, NM 87545 Warren B. Cox Sandia National Laboratories Albuquerque, NM 87185 ABSTRACT The Sandia National Laboratories Environmental Restoration Project is expected to generate relatively large volumes of hazardous waste as a result of cleanup operations. These volumes will exceed the Laboratories ’ existing waste management capaciv. Thispaper presentsfour optionsfor managing remediation wastes, including three alternativesfor on-site waste management utilizing a corrective action management unit ( C A W ) . Costs are estimatedfor each of thefour options based on current volumetric estimates of hazardous waste. Cost equations are derivedfor each of the options with the variables being waste volumes , the major unknowns in the analysis. These equations provide a means to update cost estimates as volume estimates change. This approach may be helpful to others facing similar waste management decisions. BACKGROUND Sandia National Laboratories(SNL), a Department of Energy (DOE) laboratory located in Albuquerque, New Mexico, is aggressively implementing an Environmental Restoration (ER) Project that is planned to be completed in the year 2000. There are currently 157 solid waste management units (SWMUs) identified as candidates for assessment and remediation at SNL’s New Mexico facilities and test areas. These sites include landiills, septic systems and drain fields, fring sites and burn pits, outfalls, surface storage areas, underground tanks, and miscellaueous test areas and discrete sites. The waste materials, or contaminants of concern, include hazardous constituents, low-level radiological constituents, mixed hazardous and low-level radiologicalconstituents, and some Toxic Substances and Control Act (TSCA) regulated constituents, as well as sanitary or non-regulated constituents. The total estimated volume of ER waste likely to be generated is 60,800 cubic yards, incluaig 37,000 cubic yards of hazardous, 2,500 cubic yards of low-level radioactive,3,700 cubic yards of mixed, 5,700 cubic yards of TSCA, and 1 1,900 cubic yards of non-regulated. Hazardous and Solid Waste Amendments (HSWA) permit. As such, there is a specified schedule for the major assessment and remediation activities associated with each SWMU. The relatively large quantities of waste that are to be generated by the ER Project will exceed the waste management capabilities of SNL, which are sized to support only the day-to-day operations. Consequently, the ER Project must develop an independent strategy for waste management to assure that it can meet the HSWA permit schedule and do so with maximum efficiency. A temporary unit (TU) to store ER-generated waste for one year, with a possibiiity for a one-year extension, and a corrective action management unit ( CAW to store, treat, and possibly dispose of ER waste over the duration of the ER Project, are critical elements of the SNL ER strategy. The Environmental Protection Agency (EPA) promulgated the TU/CAMU Rule in 1993 specifically to give greater flexibilityto owners of large restoration projects that were being constrained by lack of treatment, storage, and disposal (TSD) facilities capable of meeting land disposal restrictions (LDRs) and minimum technology requirements (MTRs). The TU/CAMU Rule provides the means to The SNL ER Project is regulated under a Resource Conservation and Recovery Act (RCRA)
Transcript
ON-SITE VS. OFF-SITE MANAGEMENT OF ENVIRONMENTAL RESTORATION WASTE: A COST EFFECTIVENESS ANALYSIS
Michael A. Morse Terradigm, Inc.
Albuquerque, NM 87108
Paul L. Aamodt Los Alamos National Laboratory
Los Alamos, NM 87545
Warren B. Cox Sandia National Laboratories
Albuquerque, NM 87185
ABSTRACT
The Sandia National Laboratories Environmental Restoration Project is expected to generate relatively large volumes of hazardous waste as a result of cleanup operations. These volumes will exceed the Laboratories ’ existing waste management capaciv. This paper presents four options for managing remediation wastes, including three alternatives for on-site waste management utilizing a corrective action management unit (CAW). Costs are estimated for each of the four options based on current volumetric estimates of hazardous waste. Cost equations are derivedfor each of the options with the variables being waste volumes , the major unknowns in the analysis. These equations provide a means to update cost estimates as volume estimates change. This approach may be helpful to others facing similar waste management decisions.
BACKGROUND
Sandia National Laboratories (SNL), a Department of Energy (DOE) laboratory located in Albuquerque, New Mexico, is aggressively implementing an Environmental Restoration (ER) Project that is planned to be completed in the year 2000. There are currently 157 solid waste management units (SWMUs) identified as candidates for assessment and remediation at SNL’s New Mexico facilities and test areas. These sites include landiills, septic systems and drain fields, fring sites and burn pits, outfalls, surface storage areas, underground tanks, and miscellaueous test areas and discrete sites. The waste materials, or contaminants of concern, include hazardous constituents, low-level radiological constituents, mixed hazardous and low-level radiological constituents, and some Toxic Substances and Control Act (TSCA) regulated constituents, as well as sanitary or non-regulated constituents. The total estimated volume of ER waste likely to be generated is 60,800 cubic yards, incluaig 37,000 cubic yards of hazardous, 2,500 cubic yards of low-level radioactive, 3,700 cubic yards of mixed, 5,700 cubic yards of TSCA, and 1 1,900 cubic yards of non-regulated.
Hazardous and Solid Waste Amendments (HSWA) permit. As such, there is a specified schedule for the major assessment and remediation activities associated with each SWMU. The relatively large quantities of waste that are to be generated by the ER Project will exceed the waste management capabilities of SNL, which are sized to support only the day-to-day operations. Consequently, the ER Project must develop an independent strategy for waste management to assure that it can meet the HSWA permit schedule and do so with maximum efficiency. A temporary unit (TU) to store ER-generated waste for one year, with a possibiiity for a one-year extension, and a corrective action management unit ( C A W to store, treat, and possibly dispose of ER waste over the duration of the ER Project, are critical elements of the SNL ER strategy. The Environmental Protection Agency (EPA) promulgated the TU/CAMU Rule in 1993 specifically to give greater flexibility to owners of large restoration projects that were being constrained by lack of treatment, storage, and disposal (TSD) facilities capable of meeting land disposal restrictions (LDRs) and minimum technology requirements (MTRs). The TU/CAMU Rule provides the means to
The SNL ER Project is regulated under a Resource Conservation and Recovery Act (RCRA)
f
DISCLAIMER
This report was prepared as an account of work sponsored by an agency of the United States Government. Neither the United States Government nor any agency thereof, nor any of their employees, makes any warranty, express or implied, or assumes any legal liability or responsi- bility for the accuracy, completeness, or usefulness of any information, apparatus, product, or process disclosed, or represents that its use would not infringe privately owned rights. Refer- ence herein to any specific commercial product, process, or service by trade name, trademark, manufacturer, or otherwise does not necessarily constitute or imply its endorsement, recam- mendation, or favoring by the United States Government or any agency thereof. The views and opinions of authors expressed herein do not necessarily state or reflect those of the United States Government or any agency thereof.
Portions of this document may be iIIegible in electronic jmqge products. h a g s are produced from the best adhble original dOl.ument.
1
excavate ER waste without triggering either LDR or MTR requirements because the waste is not considered to be “generated” if it goes to a TU/CAMU for treatment, storage, andor disposal.
offer reduced treatment, storage, and disposal costs as well as an accelerated cleanup schedule, it was decided that analyses should be performed to verify benefits and quantify the potential savings. This paper summarizes the results of an analysis of costs (and savings) for each of four waste management options. A previous study concluded that the availability and cost of off-site treatment and disposal for the estimated volumes of ER-generated radiological, mixed, TSCA, and non-regulated wastes was such that the CAMU could be used for hazardous wastes only, thus simplifying the permitting process. Therefore, the options analysis summarized below includes only hazardous waste volumes and associated treatment technologies in its underlying assumptions. The results of this analysis will be used to determine the optimal solution(s) for managing ER wastes, in terms of cost, under various waste volume scenarios.
Once it was determined that a waste management strategy utilizing both a TU and CAMU might
COST ANALYSIS
Four discrete options for the storage, treatment, and disposal of hazardous ER wastes were evaluated to assess their cost effectiveness. Option 1 assumes that all hazardous wastes will be sent off site for treatment and disposal at permitted TSD facilities. The other three options consider various combinations of on-site and off-site storage, treatment, and disposal, and thus require implementation of a C A W . The second option assumes that the C A W will be used for interim storage only with off-site treatment and disposal. The third assumes that the CAMU will be used for on-site storage and treatment. Non-regulated materials, i.e., treated materials, will be reused as fill and concentrated materials will be sent off site for disposal. The fourth option is similar to the third except that the treated materials are assumed to be placed into an engineered disposal cell in the C A W . This option is considered important because until treatability studies are completed on SNL wastes, the actual efficiency of selected treatments for the various waste streams (especially those containing toxic metals) cannot be known with enough certainty to safely assure that the “cleany7 treatment residues will be below levels of regulatory concern. These options are summarized in Table I.
TABLE I Description of Analyzed Options
Option Description No CAMU - Off-site treatment and disposal using truck shipment CAMU - On-site storage; off-site treatment and disposal using rail shipment CAMU - On-site storage and treatment; treated materials used as clean fill; off-site disposal of concentrated materials using rail shipment C A W - On-site storage and treatment; disposal of non-regulated materials in CAMU cell; off- site disuosal of concentrated materials using rail shiDment
Transportation by rail assumes that wastes can be bulk stored and aggregated until there are sufficient quantities to ship. Option 1 does not allow for on-site storage, therefore, truck transportation is assumed. Options 2, 3, and 4 provide for on-site storage, therefore, rail transportation is assumed.
Waste Volume Estimates
equipment (PPE) as shown in Table 11. Debris and PPE are assumed to be sent off site for disposal. Decontamination water will be disposed in the sanitary sewer, if clean, or evaporated on-site. Thus, contaminated soils, which are the major hazardous waste source, are the basis for this cost analysis.
contaminated with metals, 12,900 cubic yards are in a landfill and are believed to be contaminated with chromium as chromic acid. The remaining 3,400 cubic yards are primarily surface soils contaminated with lead. It is assumed that the lead can be recovered in the field, and thus these soils are assumed not to be treated in the C A W . Of the 8,400 cubic yards of soil contaminated with both organics and metals, 6,200
The hazardous waste can be subdivided into contaminated soil, debris, and personal protective
The principal organic contaminant is trichloroethylene (TCE). Of the 16,300 cubic yards of soil
2
cubic yards are contaminated with chromium (chromic acid) and TCE. The remaining 2,200 cubic yards come from sites that will probably be remediated in situ. Therefore, for purposes of this analysis, the only wastes that are considered relevant for evaluating whether a CAMU is economically feasible are 11,800 cubic yards of soil contaminated with organics, 12,900 cubic yards contaminated with metals, and 6,200 cubic yards contaminated with both organics and metals.
TABLE I1 Hazardous Waste Volume Estimates
Waste Matridcontaminant Volume (cubic yards) Soil - Contaminated with Organics 11,800 Soil - Contaminated with Metals 16,300 Soil - Contaminated with Organics and Metals 8,400 Debris and PPE 500
Cost Estimatinp Methodolorn SNL’s sites are predominantly at the feasibility study stage. Conceptual cost estimates were thus
prepared to compare the total project cost (TPC) for each of the options. The cost estimates assume that ER waste management activities will be performed by a prime contractor who will subcontract specific work elements to specialty contractors. It is assumed that Sandia will provide oversight of ER waste management operations.
estimates for each of the options. A work breakdown structure (WBS), based on the DOE Code of Accounts, was developed to encompass the range of activities assumed to be required for the four options. The first three levels of the WBS are shown in Table 111; however, much of the estimate was prepared at the fourth level. For example, the level below Other Structures (1.2.7) includes a disposal cell, engineered cap, monitoring wells, etc. The WBS, and the cost estimates, exclude items common to all four options because recognition of these costs will not affect the results. Common items include removal of contaminated materials from the sites and the Temporary Unit. Quantities of labor, material, and equipment were estimated based on current hazardous waste volume estimates, a conceptual site plan for the C W J (Figure l), and from discussions with Sandia project personnel. In general, vendors were consulted for the major cost drivers; i.e., treatment, transportation and disposal. In addition to vendor pricing, published cost estimating manuals were used to obtain costs. The Remedial Action Cost Engineering and Requirements System (RACER) was used to estimate costs for the engineered cap and long-term monitoring in Option 4.
Options 1 and 2 assume that wastes are transported off site for treatment and disposal. Option 1 assumes that wastes are transported via truck, whereas in Option 2 transportation by rail is assumed. Soil contaminated with organics (and organics with metals) is transported approximately 800 miles to a RCRA landfill for incineration. Incineration disposal is estimated at $600 per ton (direct cost) based on a vendor quote and includes final disposal of the ash. Soil contaminated with metals is transported approximately 500 miles to a RCRA facility for stabilization and landfill disposal. Stabilization and landfill disposal are estimated at $185 per ton (direct cost), also based on a vendor quote.
organics with metals) is assumed to be treated using low-temperature thermal desorption to remove organic contaminants from the soil. The variable cost quoted for low-temperature thermal desorption is $66 per ton (direct cost). Soil contaminated with metals, including the residual from the thermal desorption process containing metals, is assumed to be treated using soil washing to remove the metallic contaminants. Metallic contaminants adsorb onto soil fines and clays, and the soil washing process separates these finer, contaminated particles from the coarser, uncontaminated particles. A 6: 1 volume reduction is assumed for soil washing. The variable cost for soil washing is estimated at $150 per ton (direct cost); however, there is some uncertainty in this unit cost. One vendor quoted a range of between $7 and $500 per ton depending on soil characteristics and contaminants. Treatability studies will have to be performed to obtain more
A combination of bottoms-up and parametric estimating techniques was used to prepare cost
Options 3 and 4 assume that wastes are treated on site. Soil contaminated with organics (and
3
definitive costs for SNL wastes. In Option 3, treated soils are assumed to be non-regulated, and thus are reused as fill. In Option 4, an engineered disposal cell is estimated for disposal of treated (but not below levels of regulatory concern) soils. Option 4 also includes an engineered cap over the disposal cell, four groundwater monitoring wells, and 30 years of groundwater and vadose zone monitoring. The 1/6 concentrated residual from the soil washing process is sent off site for stabilization and disposal in both Options 3 and 4.
TABLE I11 Work Breakdown Structure
WBS Number 1 1.1 1.2 1.2.1 1.2.2 1.2.3 1.2.4 1.2.5 1.2.6 1.2.7 1.2.8 I .2.9 1.2.10 1.3 1.4 1.4.1 I .4.2 1.4.3 1.4.4 I .4.5 1.4.6 1.4.7 1.4.8 1.4.9 1.4.10 1.5 2 2.1 2.2 2.3 3 3.1 3.2 3.3 3.4
Item Zorrective Action Management Unit (CAMU)
Pre-Title 1 Design Activities CAMU Capital Costs
Permitting Engineering, Design, Inspection Project Management /Construction Management Land and Land Rights Sitework Buildings Other Structures Utilities Special Facilities Standard Equipment
Operating Labor Operating Equipment Utilities Miscellaneous Office and Field Supplies Storage Thermal Desorption Soil Washing Load & Haul Disposal of "Clean" Material Groundwater and Vadose Zone Monitoring
CAMU Closure Transportation \r
Truck Transport of Bulk Soil to Landfill Truck Transport of Bulk Soil to Rail Spur Rail Transport of Bulk Soil to Landfill
Indirect costs include contractor's overhead and profit (OH&P), bond, SNL loading factors, escalation, and contingency. Prime contractor's OH&P was applied at the rate of 10% and prime contractor's markup on subcontractors was applied at the rate of 5%. Performance and payment bonds were estimated at 0.75%. SNL loads were based on fiscal year (FY) 1996 spend plan rates issued by the SNL financial organization. The June 1995 DOE escalation rates for Environmental Restoration were used to estimate escalation. Escalation was applied at the rate sf 8.74% assuming a schedule mid-point of July
1998 and a five-year schedule for ER waste operations beginning in January 1996. Contingency was estimated for each WBS element based on an assessment of cost risk within the scope of work assumed for the analysis. In general, contingency was estimated at 15% for low-risk elements, and at 50% for high-risk elements. High-risk elements include operating labor, operating equipment, soil washing, and C A W closure. The overall applied contingency rates are 15% for Option 1, 16% for Option 2 ,3 1% for Option 3, and 30% for Option 4. According to the DOE Cost Assessment Team (CAT) Cost Estimating Handbook for Environmental Restoration, the allowable contingency range for the remediation phase of an ER Project at the feasibility study stage is 10% to 60%; therefore, the contingency applied to each of the options is at the low end of the allowable range.
Cost Analvsis Results Table IV compares the TPC for each of the four options. Without considering the time value of
money (see Sensitivity Analysis below), Options 1 and 2 are the least cost effective. The cost to transport, treat, and dispose of waste off site (Options 1 and 2) is considerably higher than the cost to treat and manage wastes on site (Options 3 and 4). In addition to the relatively lower unit costs of treating and managing wastes on site, Options 3 and 4 also avoid the associated transportation costs. Between Option 3 and Option 4, Option 3 is more cost effective because the costs associated with the engineered disposal cell and long-term monitoring in Option 4 are avoided.
TABLE IV Comparison of Total Project Cost for the Four Options
Cost Element Direct Costs
CAMU Costs Pre-Title I Design Capital Costs S+&-Up costs Operating Costs Closure Subtotal CAMU Costs
Transportation to Landfill Landfill Disposal
Total Direct Costs Indirect Costs TOTAL PROJECT COST
The major variables affecting cost are the volumes of wastes to be managed. Therefore, it is advantageous to have general formulae for estimating the TPC of each of the four options as waste volume estimates are continually revised. The cost estimates for each of the four options (at the given waste volumes) were segmented into fKed and variable cost components, with respect to volumes, and equations were derived such that:
TCn = %,n + al,nV, + a2,,,V2 + a3,nV3, where TC, =the total cost of Option n, n = 1...4,
V , = volume of organic waste in cubic yards, V, = volume of metals waste in cubic yards, V, = volume of organic plus metals waste in cubic yards, %,, = fixed costs associated with Option n, And
=the variable cost associated with Vi for Option n, i = 1 ... 3.
5
Fixed costs include Pre-Title I design, CAMU capital costs (excluding the disposal cell and engineered cap in Option 4), post-construction startup activities, CAMU operating costs (excluding storage and the variable portion of treatment), and CAMU closure. Variable costs include storage, the variable portion of treatment, transportation, disposal, and in Option 4, the disposal cell and engineered cap. Following are the total cost equations derived for the four options.
(1) TC, = $1,474 VI + $643 Vi+ $1,474 V3
TC2 = $2,528,000 + $1,420 VI + $590 Vz+ $1,420 Vs (2)
TC3 = $5,459,000 + $220 VI + $565 V,+ $692 v3 (3)
TC4 = $7,200,000 + $246 Vi + $591 V2+ $718 V3 (4)
These expressions provide an effective and efficient means of estimating the cost of each option given a change in the volumetric estimate of waste. It should be noted that these equations are applicable only to SNL because the underlying costs are specifically related to the scope of work at SNL. However, the general method used to derive the model can be used by others. It should also be noted that these relationships are valid within an unspecified range for the variables. For example, at significantly higher or lower volumes, fixed costs may be appreciably different because the scale of operations, equipment capacities, etc. will be different. In other words, fixed costs will likely increase or decrease in a stepwise fashion with changes in volume. Similarly, variable costs quoted by vendors for treatment are a function of quantity. Larger quantities typically imply lower unit costs.
Other analyses that can be performed include break-even analysis and net present value. Break- even analysis can be performed in situations where there is a single contaminant of concern. The volume at which the total cost of two options is identical is the break-even volume and is determined by simultaneously solving two total cost equations. At volumes above or below the break-even volume one or the other option would yield a lower cost. Although not reported here, SNL used break-even analysis to determine the volume at which it would be more economical to send wastes off site assuming metals could be remediated in situ.
Net present value (NPV) analysis recognizes the time value of money to determine the most cost- effective alternative. Future cash flows are discounted to the present using specified discount factors. Annual cash flows are discounted to the present by dividing the cash flows, stated in current dollars, by the discount factor, (1 + i)" , where i is discount rate and n is the year in which the cash flows are realized, beginning with n = 0 for the current year. NPV is equal to total discounted benefits minus total discounted costs in the case of benefit-cost analysis, and is equal to the total discounted cost in the case of cost- effectiveness analysis. The alternative having the greatest NPV, or the least net present cost, is the preferred alternative. The Office of Management and Budget specifies a discount rate of 7% for use in benefit-cost and cost-effectiveness studies performed for the Federal government.
Activities for the four options were scheduled over a 5-year period resulting in the allocation shown in Table V. Table VI gives the discounted cash flows using a 7% discount rate. The discount factors used to discount the values in Table V are given at the bottom of Table VI.
TABLE V Cash Flows in Current Dollars ($ thousands)
The use of present value analysis does not change the order of the alternatives in terms of cost. Option 3 is still the most cost-effective and Option 2 is still the least. However, this will not always be the case. The longer the schedule and the higher the discount factor, the more dramatic will be the effect of discounting. Also, alternatives that require large expenditures early in the schedule, will be less affected by discounting than those that are weighted later in the schedule.
OTHER CONSIDERATIONS
In addition to the cost analysis results, the SNL ER Project considered other, qualitative criteria in reaching a final decision on which of the four options to select. The decision-making process involved SNL and DOE technical staff and managers, the regulators and the local public. Both the TU and CAMU are permitted facilities that must go through a public hearing and comment process, thus the early involvement of both the permitting agency and the public is an important means for expediting the resolution of issues and thereby reducing the time to obtain the permits.
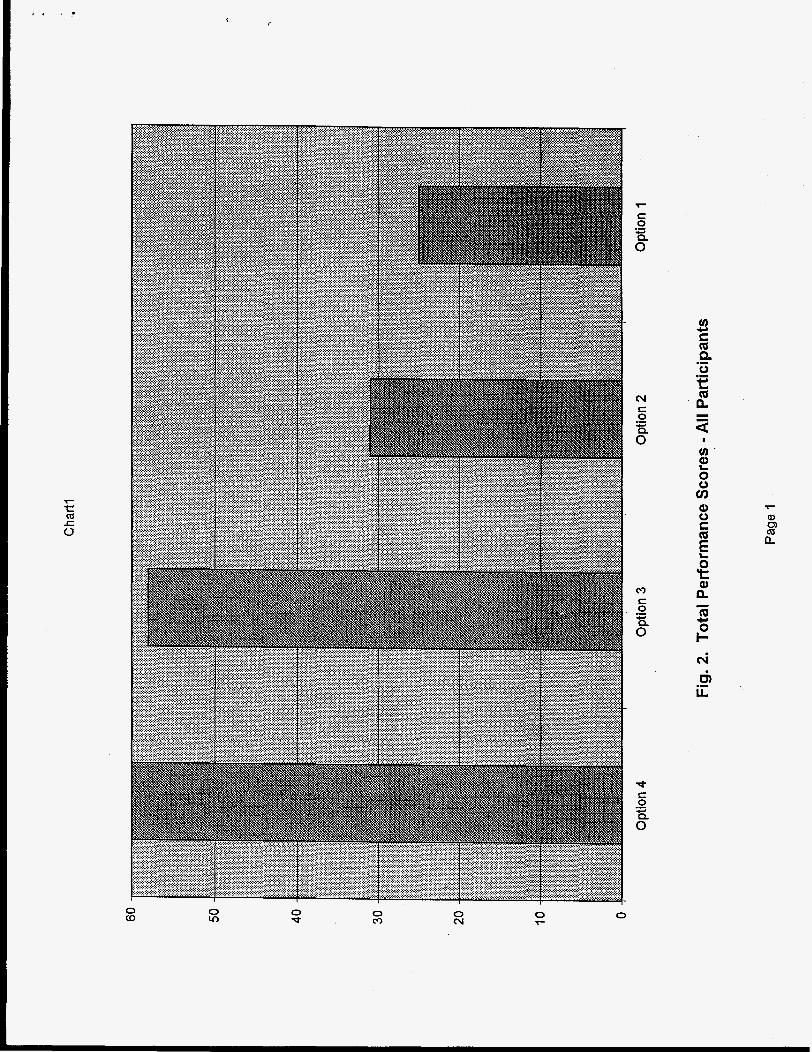
The qualitative criteria included worker and public health and safety as related to each of the four options. On-site and off-site handling and transportation, CAMU operations with and without treatment and disposal, ecological impacts, aesthetics, etc. were considered arid ranked as to their relative importance for the ultimate decision, and finally they were weighted (along with cost) to yield a quantitative relative value. The results of this process are shown in Figure 2. Options 3 and 4, CAMU with storage and treatment, and CAMU with storage, treatment and disposal, respectively, were clearly preferred based on the resulting values. These are also the options having the feast total cost-cost was a dominant factor for each of the groups. (For those who may be interested, separate reports are available on the entire options analysis and on the process used to involve the stakeholders. These reports can be obtained by contacting the authors of this paper.) I
As an outcome of the cost analyses and the stakeholder options evaluation, SNL will pursue permitting a full treatment, storage, and disposal CAMU as defined under Option 4. The disposal cell will not be constructed until it is clear that it will be needed. That need could result if the treated residues, especially for metals-contaminated soil, contain after-treatment concentrations above levels that would allow unrestricted reuse.
I
CONCLUSIONS
The least cost-effective solutions for managing ER hazardous wastes, given the constraints and assumptions of this study, are those that involve off-site treatment and disposal (Options 1 and 2). The most cost effective solution is a CAMU combining on-site treatment of hazardous soils with reuse of the cleaned soil as fill (Option 3). A CAMU combining on-site treatment of hazardous soils with on-site disposal of treated soils comes in a close second (Option 4). However, the ultimate decision regarding disposition of environmental restoration waste will depend on stakeholders' perception of risk as well as on cost.
relatively low volume of waste, the capital costs associated with the CAMU may not be justified. However, if current hazardous waste estimates are accurate, then a CAMU can indeed be justified under the assumptions of this analysis. As current hazardous waste estimates change with the incorporation of
The volume of waste to be treated and managed greatly influences the optimal solution. At a
7
newly gathered data, the total cost equations can be used to evaluate the continued economic viability of the chosen waste management options.
REFERENCES
1. Federal Register, “Corrective Action Management Units and Temporary Units; Corrective Action Provisions; Final Rule,” Volume 58, Number 29, February 16,1993.
2. U.S. Department of Energy, Albuquerque Field Office, Project Management Division. 1988. AL 5700.2C: Cost Estimating.
3. U.S. Department of Energy, Field Management, Ofice of Infrastructure Acquisition, June 1995. Departmental Price Change Index, FY I998 Guihnce, Anticipated Economic Escalation Rates, Environmental Restoration and Waste Management Projects.
4. U.S. Department of Energy, Environmental Restoration and Waste Management Cost Assessment Team. 1990. Cost Estimating Handbook for Environmental Restoration.