The Astrophysical Journal, 693:186–206, 2009 March 1 doi:10.1088/0004-637X/693/1/186 C 2009. The American Astronomical Society. All rights reserved. Printed in U.S.A. ON THE DYNAMICAL EVOLUTION OF H ii REGIONS: AN INVESTIGATION OF THE IONIZED COMPONENT OF W4, AGALACTIC CHIMNEY CANDIDATE. II. KINEMATICS AND DYNAMICS IN THE LATITUDE RANGE 3 ◦ <b 7 ◦ Dominic Lagrois and Gilles Joncas D´ epartement de physique, de g´ enie physique et d’optique, Centre de Recherche en Astrophysique du Qu´ ebec, Universit´ e Laval, Qu´ ebec, QC G1K 7P4, Canada; [email protected], [email protected]Received 2008 July 22; accepted 2008 November 11; published 2009 February 27 ABSTRACT In the second of this two-paper series, we present results associated with an Hα investigation, obtained using the Fabry–Perot interferometer FaNTOmM, of the tenuous ionized material found embedded in the northern portion of W4. W4 is a promising candidate for a galactic chimney, likely connected with the galactic corona, and presents evidence of shell fragmentation. We present the quantitative method for identifying shell breakout that allows us to characterize the giant H i supershell/H ii region W4 as enclosing a galactic chimney in formation. On a range of approximately 125 pc, two “south-to-north” radial velocity gradients are detected, ∇ v = (−)0.17 km s −1 pc −1 (3. ◦ 5 b< 6. ◦ 3) and ∇ v = (−)3.13 km s −1 pc −1 (6. ◦ 3 b 6. ◦ 5). This leads to radial velocities, slightly above the vicinity of the shell’s polar cap, of −70 km s −1 , blueshifted by nearly 25 km s −1 with respect to the H i supershell. The kinematic behavior is in agreement with a rarefaction scenario if the W4 superbubble presents a tilt toward the observer. This angle of inclination is estimated between 9 ◦ and 27 ◦ with respect to the plane of the sky. A line-narrowing gradient is correlated with the radial velocity gradient. The large-scale trends in radial velocities and line widths correspond to highly accelerated, well-parallelized outflows of vented ionized material. This kinematic signature is expected from the chimney model. The dynamical age of the W4 chimney is estimated at 4.1 Myr and constraints shell instabilities to have developed at latitudes lower than the blowout threshold height. Our work contributes to the evidence that the star cluster IC 1805 partially sustains the low-galactic corona above the Perseus arm. Key words: Galaxy: halo – ISM: bubbles – ISM: individual (W4) – ISM: kinematics and dynamics – techniques: interferometric 1. INTRODUCTION The implication of galactic chimneys (Norman & Ikeuchi 1989) in the sustainment of the hot, ionized galactic corona has been investigated for the past three decades. Numerical models have shown the formation of ovoid supershells fueled by the action of supernova explosions (Chevalier & Gardner 1974), the mechanical deposit of Lyα radiation (Dove et al. 2000) and stellar winds (Basu et al. 1999) of large star clusters. Assuming an exponentially decreasing galactic atmosphere model (Dickey & Lockmann 1990; Heiles 1991), blowout events occur once the polar cap of an expanding supershell overtakes the galactic layer of neutral material. According to Mac Low et al. (1989), the blowout threshold is estimated at 2 to 3 times the vertical scale height of the H i distribution above mid-plane. There is a dramatic drop in particle density and pressure from the upstream interstellar medium (hereafter, ISM). This, in turn, leads to a sudden acceleration of the shell’s polar cap segment. Dove et al. (2000) proposed this particular scenario as ideal for fast shell instability development, which is responsible for shell weaknesses and ultimately fracture. Shell openings, therefore, assure that a certain fraction of the energetic photons will exit the H ii region. The evacuated photons will likely travel to interact with the galactic corona contributing to the sustainment of the Reynolds layer (Reynolds 1989a). Observational identification of shell breakouts usually relies on visual aspects. An investigation using a more quantitative method is required especially for superbubbles displaying ob- servational evidence for ionization-bounded supershells. Due to the pressure difference between the warm interior and the outer ISM, openings found on some supershell will likely vent inte- rior gas outwards. Induced at the point of fracture, a rarefaction wave will quickly develop and sweep out a large amount of embedded ionized material. That is, a discontinuity associated with the wave will propagate from the fracture toward the cen- ter of the superbubble, while the gas that is being rarefied will move in the opposite direction, toward the fragmenting shell of the superbubble. The shocked material is accelerated through the “interior-to-exterior” pressure gradient before being evacu- ated. For gas flows not strictly parallel to the plane of the sky, a kinematic discrepancy can be established between the high- velocity-accelerated component, being evacuated, and the un- perturbed material found deeper in the superbubble. This model particularly resembles the kinematics anticipated from the em- bedded air in a pierced metal container (see Section 5.2). The galactic superbubble/H ii region W4 characterized by a slight tilt toward the observer (Normandeau et al. 1996) represents an ideal astronomical object to verify such a model. In Section 2, we present the promising galactic chimney candidate W4. Large-scale observations have led to the detection of two possible breaks located along the northern shell frame. Techniques used for data acquisition and reduction are described in Section 3. We provide, in Section 4, the results of our Fabry–Perot Hα investigation in the northern portion of W4, bounded in latitude between 3 ◦ and 7 ◦ . Our model of a pierced metal container will be presented in Section 5 and used in the interpretation of the observed gas motion. A review of the most important results and conclusion will be presented in Section 6. 186
ON THE DYNAMICAL EVOLUTION OF H ii REGIONS: AN INVESTIGATION OF THE IONIZEDCOMPONENT OF W4, A GALACTIC CHIMNEY CANDIDATE. II. KINEMATICS AND DYNAMICS
IN THE LATITUDE RANGE 3◦ < b � 7◦
Dominic Lagrois and Gilles Joncas
Departement de physique, de genie physique et d’optique, Centre de Recherche en Astrophysique du Quebec, Universite Laval, Quebec, QC G1K 7P4, Canada;[email protected], [email protected]
Received 2008 July 22; accepted 2008 November 11; published 2009 February 27
ABSTRACT
In the second of this two-paper series, we present results associated with an Hα investigation, obtained using theFabry–Perot interferometer FaNTOmM, of the tenuous ionized material found embedded in the northern portionof W4. W4 is a promising candidate for a galactic chimney, likely connected with the galactic corona, and presentsevidence of shell fragmentation. We present the quantitative method for identifying shell breakout that allows usto characterize the giant H i supershell/H ii region W4 as enclosing a galactic chimney in formation. On a rangeof approximately 125 pc, two “south-to-north” radial velocity gradients are detected, ∇v = (−)0.17 km s−1 pc−1
(3.◦5 � b < 6.◦3) and ∇v = (−)3.13 km s−1 pc−1 (6.◦3 � b � 6.◦5). This leads to radial velocities, slightly above thevicinity of the shell’s polar cap, of −70 km s−1, blueshifted by nearly 25 km s−1 with respect to the H i supershell.The kinematic behavior is in agreement with a rarefaction scenario if the W4 superbubble presents a tilt towardthe observer. This angle of inclination is estimated between 9◦ and 27◦ with respect to the plane of the sky. Aline-narrowing gradient is correlated with the radial velocity gradient. The large-scale trends in radial velocities andline widths correspond to highly accelerated, well-parallelized outflows of vented ionized material. This kinematicsignature is expected from the chimney model. The dynamical age of the W4 chimney is estimated at 4.1 Myrand constraints shell instabilities to have developed at latitudes lower than the blowout threshold height. Our workcontributes to the evidence that the star cluster IC 1805 partially sustains the low-galactic corona above the Perseusarm.
The implication of galactic chimneys (Norman & Ikeuchi1989) in the sustainment of the hot, ionized galactic corona hasbeen investigated for the past three decades. Numerical modelshave shown the formation of ovoid supershells fueled by theaction of supernova explosions (Chevalier & Gardner 1974),the mechanical deposit of Lyα radiation (Dove et al. 2000) andstellar winds (Basu et al. 1999) of large star clusters. Assumingan exponentially decreasing galactic atmosphere model (Dickey& Lockmann 1990; Heiles 1991), blowout events occur oncethe polar cap of an expanding supershell overtakes the galacticlayer of neutral material. According to Mac Low et al. (1989),the blowout threshold is estimated at 2 to 3 times the verticalscale height of the H i distribution above mid-plane. Thereis a dramatic drop in particle density and pressure from theupstream interstellar medium (hereafter, ISM). This, in turn,leads to a sudden acceleration of the shell’s polar cap segment.Dove et al. (2000) proposed this particular scenario as ideal forfast shell instability development, which is responsible for shellweaknesses and ultimately fracture. Shell openings, therefore,assure that a certain fraction of the energetic photons will exit theH ii region. The evacuated photons will likely travel to interactwith the galactic corona contributing to the sustainment of theReynolds layer (Reynolds 1989a).
Observational identification of shell breakouts usually relieson visual aspects. An investigation using a more quantitativemethod is required especially for superbubbles displaying ob-servational evidence for ionization-bounded supershells. Due to
the pressure difference between the warm interior and the outerISM, openings found on some supershell will likely vent inte-rior gas outwards. Induced at the point of fracture, a rarefactionwave will quickly develop and sweep out a large amount ofembedded ionized material. That is, a discontinuity associatedwith the wave will propagate from the fracture toward the cen-ter of the superbubble, while the gas that is being rarefied willmove in the opposite direction, toward the fragmenting shell ofthe superbubble. The shocked material is accelerated throughthe “interior-to-exterior” pressure gradient before being evacu-ated. For gas flows not strictly parallel to the plane of the sky,a kinematic discrepancy can be established between the high-velocity-accelerated component, being evacuated, and the un-perturbed material found deeper in the superbubble. This modelparticularly resembles the kinematics anticipated from the em-bedded air in a pierced metal container (see Section 5.2). Thegalactic superbubble/H ii region W4 characterized by a slighttilt toward the observer (Normandeau et al. 1996) represents anideal astronomical object to verify such a model.
In Section 2, we present the promising galactic chimneycandidate W4. Large-scale observations have led to the detectionof two possible breaks located along the northern shell frame.Techniques used for data acquisition and reduction are describedin Section 3. We provide, in Section 4, the results of ourFabry–Perot Hα investigation in the northern portion of W4,bounded in latitude between 3◦ and 7◦. Our model of a piercedmetal container will be presented in Section 5 and used in theinterpretation of the observed gas motion. A review of the mostimportant results and conclusion will be presented in Section 6.
No. 1, 2009 KINEMATICS OF W4, A GALACTIC CHIMNEY CANDIDATE 187
2. THE W4 SUPERBUBBLE
In our first paper (Lagrois & Joncas 2009, hereafter PaperI), we introduced the galactic wind-blown bubble/H ii regionW4 which was the central feature of the Canadian GalacticPlane Survey (CGPS) pilot project (Normandeau et al. 1997).Observations in the radio regime have presented W4 as animpressive H i cavity aiming toward the galactic corona andvisible in the radial velocity range between −38.46 and −45.05km s−1 as measured in the local standard of rest (hereafter,LSR) (West et al. 2007). Outflows from the star cluster IC 1805(Shi & Hu 1999) were said to be responsible for the actualsuperbubble expansion (Basu et al. 1999). A northern extensionof the CGPS spectroscopic 21 cm line observations, used inPaper I, is presented in Normandeau (2000). The H i supershellis seen extending between b = 0◦ and b = 6◦ and presentsno evidence for a neutral polar cap at the northernmost latitudes(Normandeau 2000). From polarization observations, West et al.(2007) outlined a roughly egg-shaped supershell reaching aheight of roughly 245 parsecs above the galactic mid-plane,considering a spectroscopic distance of 2.35 kpc to the starcluster (Massey et al. 1995). Considering the vertical scaleheight of the H i distribution estimated at 140 pc above thePerseus arm (Normandeau 2000), it is assumed that the shell’spolar region is located slightly below the blowout threshold andshould not, therefore, show signs of a re-accelerated expansion.
Dennison et al. (1997) obtained a large-scale view of theHα emission associated with the W4 H ii region. The 10◦circular field of view (FOV) revealed an ionized counterpart tothe H i supershell. The neutral shell is apparently eroded fromits inner side. The shell can, therefore, be referred as beingsemi-neutral, semi-ionized. A faint ionized polar cap seemsto be detected roughly 230 pc above the galactic mid-plane.Even though the outer shock wave of the expanding structureleft very little material behind it, a diffuse ionized componentis observed embedded in the superbubble. In Paper I, partialsources of material were identified as numerous and mostlymolecular blobs found either inside or at the periphery of thesupershell and exposed to the UV flux of the nearby star cluster.Generally located at low-galactic latitude, these eroded featurescontributed to establish a discrepancy in emissivity betweenwhat we referred as the southern (0◦ � b � 3◦, hereafterW4-south) and northern (3◦ < b � 7◦, hereafter W4-north)portions of W4 respectively made up of strong and faint Hαemission. This paper will mainly focus on the description andthe kinematic investigation of W4-north.
At the boundary between W4-south and -north, slightlybended neutral filaments (hereafter, referred to the “H i hori-zontal sheets”) are detected, covering in longitude an importantfraction of the bubble’s width. A second, but nonetheless im-portant, atomic feature is observed near the shell’s polar cap.Kinematically linked to the H i supershell, the intriguing ver-tical H i-spur (Normandeau 2000) is highly similar to worm-like structures obtained from numerical models of acceleratedwind-blown bubbles and interpreted as filamentary remnants ofunstable broken shells (De Avillez & Berry 2001). In fact, theinvestigation of the large-scale Hα (Dennison et al. 1997) and1420/408 MHz continuum (CGPS) emissions has revealed par-ticularly faint shell material in the direct vicinity of the H i spur(West 2003; West et al. 2007). The authors interpreted the lackof emission as an observational evidence for a recent shell frac-ture. A second possible break is also detected along the westernside of the W4 supershell. Combined with a lack of high-latitude
ionizing photons (Terebey et al. 2003) and of erodible neutralclumps, dramatic gas venting might have deprived W4-northof its emissive material; all contributing to the discrepancy inemissivity between the two portions of the nebula. In order tovisualize the location of each feature, the reader is referred tothe schematic drawing of W4-north in Figure 1.
On a much larger scale of view, the Wisconsin Hα Mapper(WHAM) Northern Sky Survey (Reynolds et al. 2001) has re-vealed a large horseshoe-shaped Hα loop above the W3/W4/W5complex, at a relatively low-galactic corona level (about 1 kpcabove galactic mid-plane). Striking similarities can be estab-lished between the bent H i capped structures observed abovethe known chimney associated with the galactic supershell GSH242-03+37 (McClure-Griffiths et al. 2006) and the giant ionizedloop (hereafter, referred as the “Reynolds loop”). Mostly due toa remarkable alignment between the W4 superbubble and theReynolds loop, Reynolds et al. (2001) proposed its sustainmentto be partially attributed to the star cluster IC 1805.
In order to investigate the percolation of energetic pho-tons through the possible shell breakouts, Hα observationsvia Fabry–Perot interferometry were carried out on the tenu-ous embedded material of W4-north. Since a strong disagree-ment exists (H i versus Hα and polarization observations) re-garding a possible polar cap, our own work becomes crucialto assess whether the W4 superbubble is a chimney or not.Our motivation is based on our model of a pierced metal con-tainer and the expected large-scale radial velocity gradients di-rected toward the shell openings. Such gradients, associatedwith gas venting outwards, have remained undetected in ourkinematic investigation of W4-south in Paper I due to a “north-to-south” sound crossing time of the nebula estimated at 25Myr, well above the proposed dynamical age of the superbubble(Dennison et al. 1997). Therefore, rarefaction waves emanat-ing from unstable northern-shell segments and propagating in aroughly sonic regime would still be found well above b = 3◦,leaving unperturbed the ionized material found in the vicinity ofthe star cluster. Additionally, a northern portion of W4 mostlydominated by accelerated outflows of ejected material wouldconfirm the formation of a galactic chimney and an obviousinteraction between the star cluster IC 1805 and the Reynoldsloop.
3. OBSERVATIONS AND DATA REDUCTION
Hα observations of W4-north were performed in 2006 and2007 using the Ritchey–Chretien 1.6 m telescope of the Ob-servatoire du mont Megantic (OmM). Similar to Paper I, theFaNTOmM (Fabry–Perot of New Technology for the Obser-vatoire du mont Megantic) device system was again used fordata gathering. Technical information about the ultrasensitiveIPCS camera can be found in Hernandez et al. (2003). The cen-tral interference order of the Fabry–Perot interferometer (here-after, FPI) was fixed at 765 for a free spectral range of 8.56 Åcentered on the Hα rest frequency. The finesse of the FPI var-ied slightly from night to night between 18 and 19. This al-lowed us to perform the spectral scanning at a fixed numberof 44 steps (channels). All Hα emission spectra, therefore, pre-sented a spectral resolution of 0.19 Å channel−1 (or 8.89 km s−1
channel−1). The λ6598.95 Ne line was used to produce inter-ferograms for the radial velocity calibration, while narrow-band(ΔλFWHM = 10 Å) filters allowed to isolate Hα lines fromother ionized emission. Interference filters were chosen ap-proximately in order to maximize flux transmission, that is, to
188 LAGROIS & JONCAS Vol. 693
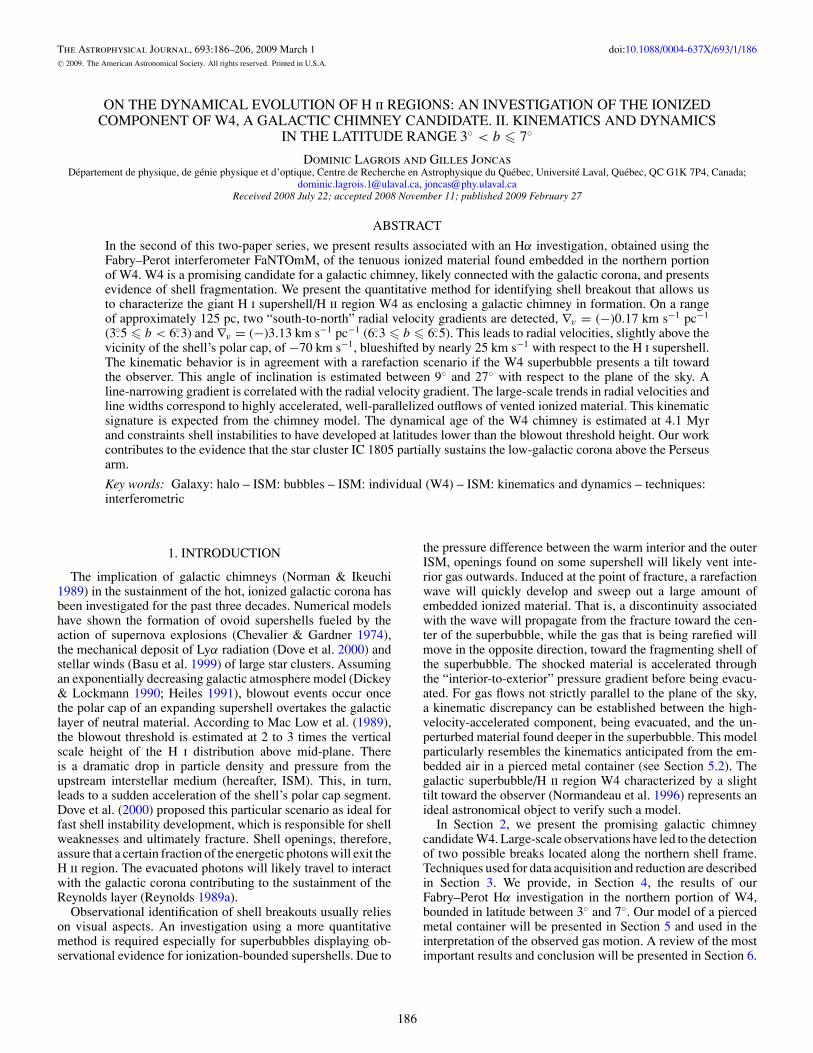
Figure 1. Schematic diagram of W4-north. The numbers coincide with the optical centers of the seven observed fields. The field labeled “DF” coincides with thelocation of the Dark Field used for night-sky subtraction. Bounded boxes enclose the FOV obtained from the FaNTOmM device system. The right-hand vertical axisshows the height above galactic mid-plane, assuming a spectroscopic distance of 2.35 kpc to the star cluster IC 1805. Atomic hydrogen features are represented bythe bold solid lines. The long-dashed line encloses the 2◦ × 2◦ portion inside the W4 superbubble where the Hα and 1420/408 MHz continuum emissions are seenparticularly low (referred as the Hα-poor cavity in the text). The dotted line is related to the semi-neutral, semi-ionized W4 supershell. Dashed line “empty fields”near Fields 24 and 25 correspond to areas that remain to be investigated in order to perfectly interpret the kinematics of W4-north.
consider the effect of blueshifting (−0.2 Å K−1) on transmis-sion caused by cold ambient temperatures and to minimize theinclination of the different filters.
The use of the Panoramix f/2 focal reducer (Godbout et al.1998) allowed us to obtain a square 12.′3×12.′3 FOV for a spatialresolution of 1.′′45 pixel−1 using the hard binned 512 × 51280 frames s−1 mode of the CCD detector. Data reduction wascarried out using IDL (Interactive Data Language) procedure(Daigle et al. 2006) specially tailored to reproduce the methodused for the TAURUS FP spectrometer (Atherton et al. 1982).
We emphasized, in Paper I, the difficulty arising from night-sky emission (Osterbrock et al. 1996). The problem was partiallyeliminated by applying a multi-component Gaussian fit to eachemission spectrum. The method demands each spectral lineto be clearly identifiable in each raw spectrum. However, thiscriterion does not hold in spatial regions above the H i horizontalsheets, where the W4 Hα component is highly dominated by theemissivity of the Earth’s mesosphere.
In order to mitigate the problem of night-sky emission, weuse a semi-parallel procedure of sky subtraction that allows us toextract, from highly contaminated spectra, extremely faint W4Hα profiles. The problem of sky subtraction must initially betreated as dual, being both spatial and temporal. Skinner et al.(1998) brilliantly demonstrated the optical variability of thenight-sky emission as being dependent on the pointing positionand the local time of the observations. In particular, the authorspointed out that the photometric properties of the sky vary onperiods as short as 15 minute. Since the Hα emission from W4
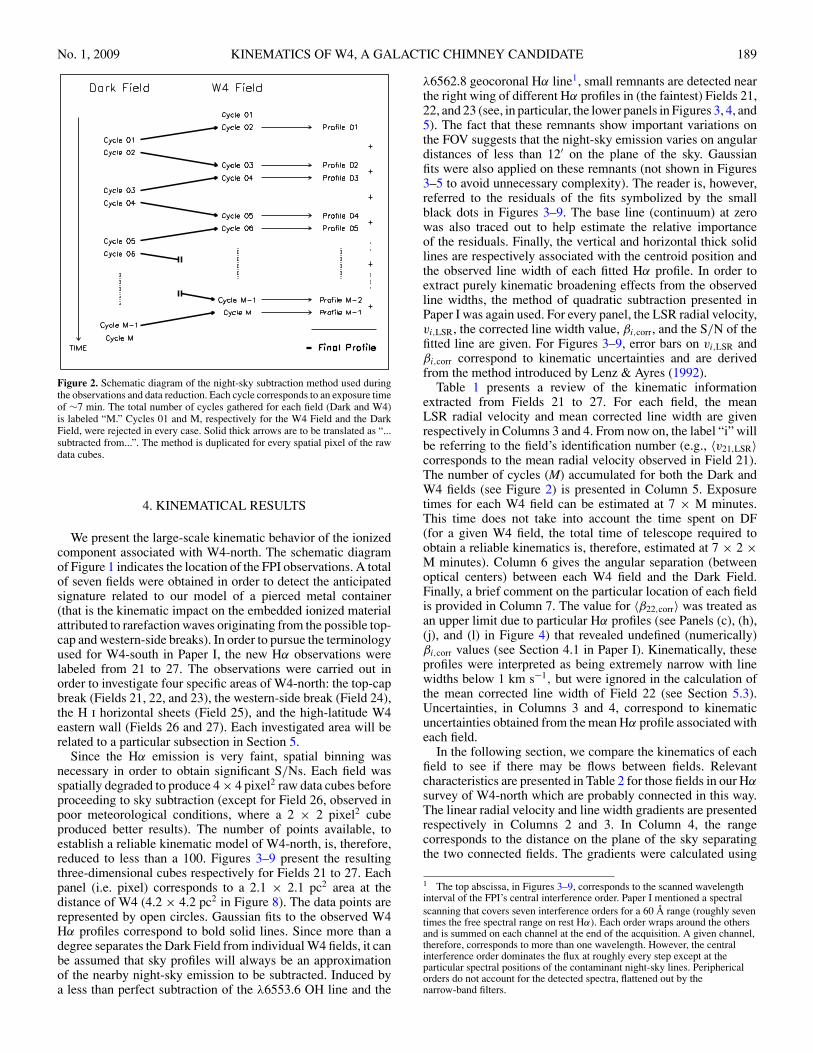
fills our FOV, a patch of sky essentially devoided of emissionwas needed near the targeted areas. Examination of Figure 12from West et al. (2007) shows a 2◦ × 2◦ ionized gas troughcentered on (l, b) = (134.◦5, 4.◦9). This area is pictured in ourFigure 1 using a long-dashed line and will be referred as theHα-poor cavity. The small region labeled “DF,” for Dark Field,was observed repeatedly during the night to measure the night-sky contamination. The sky subtraction scheme is shown inFigure 2. The angular separation between the Dark Field andindividual W4 fields is � 1◦ and the telescope was moved backand forth between W4 and DF. A given cycle, either associatedwith W4 or DF, corresponds to a one-time scanning of the60 Å-wide wavelength interval (see Paper I). Each cycle iscompleted in ∼7 minute. Hence less than 15 minute elapsesbetween two consecutive cycles, each Dark Field cycle labeled“j” can be subtracted from its associated W4 field cycle “j+1”(see Figure 2). From each DF subtracted observation, a faintbut uncontaminated Hα profile is extracted. The procedure isrepeated from j = 1 to M − 1 (W4 field cycle 01 and DF cycleM are naturally rejected from the procedure). The resultingHα profiles are all summed in order to show a clear, highsignal-to-noise ratio (hereafter, S/N), detection of the ionizedmaterial in W4-north. Once sky subtraction was completed, aGaussian-fitting routine allowed us to extract, from each profile,the centroid position (radial velocity), the observed line widthvalue (dispersion), and the amplitude of the fitted line. The Mvalue for each W4 field (Figure 1) is listed in Table 1 (seeSection 4).
No. 1, 2009 KINEMATICS OF W4, A GALACTIC CHIMNEY CANDIDATE 189
Figure 2. Schematic diagram of the night-sky subtraction method used duringthe observations and data reduction. Each cycle corresponds to an exposure timeof ∼7 min. The total number of cycles gathered for each field (Dark and W4)is labeled “M.” Cycles 01 and M, respectively for the W4 Field and the DarkField, were rejected in every case. Solid thick arrows are to be translated as “...subtracted from...”. The method is duplicated for every spatial pixel of the rawdata cubes.
4. KINEMATICAL RESULTS
We present the large-scale kinematic behavior of the ionizedcomponent associated with W4-north. The schematic diagramof Figure 1 indicates the location of the FPI observations. A totalof seven fields were obtained in order to detect the anticipatedsignature related to our model of a pierced metal container(that is the kinematic impact on the embedded ionized materialattributed to rarefaction waves originating from the possible top-cap and western-side breaks). In order to pursue the terminologyused for W4-south in Paper I, the new Hα observations werelabeled from 21 to 27. The observations were carried out inorder to investigate four specific areas of W4-north: the top-capbreak (Fields 21, 22, and 23), the western-side break (Field 24),the H i horizontal sheets (Field 25), and the high-latitude W4eastern wall (Fields 26 and 27). Each investigated area will berelated to a particular subsection in Section 5.
Since the Hα emission is very faint, spatial binning wasnecessary in order to obtain significant S/Ns. Each field wasspatially degraded to produce 4 × 4 pixel2 raw data cubes beforeproceeding to sky subtraction (except for Field 26, observed inpoor meteorological conditions, where a 2 × 2 pixel2 cubeproduced better results). The number of points available, toestablish a reliable kinematic model of W4-north, is, therefore,reduced to less than a 100. Figures 3–9 present the resultingthree-dimensional cubes respectively for Fields 21 to 27. Eachpanel (i.e. pixel) corresponds to a 2.1 × 2.1 pc2 area at thedistance of W4 (4.2 × 4.2 pc2 in Figure 8). The data points arerepresented by open circles. Gaussian fits to the observed W4Hα profiles correspond to bold solid lines. Since more than adegree separates the Dark Field from individual W4 fields, it canbe assumed that sky profiles will always be an approximationof the nearby night-sky emission to be subtracted. Induced bya less than perfect subtraction of the λ6553.6 OH line and the
λ6562.8 geocoronal Hα line1, small remnants are detected nearthe right wing of different Hα profiles in (the faintest) Fields 21,22, and 23 (see, in particular, the lower panels in Figures 3, 4, and5). The fact that these remnants show important variations onthe FOV suggests that the night-sky emission varies on angulardistances of less than 12′ on the plane of the sky. Gaussianfits were also applied on these remnants (not shown in Figures3–5 to avoid unnecessary complexity). The reader is, however,referred to the residuals of the fits symbolized by the smallblack dots in Figures 3–9. The base line (continuum) at zerowas also traced out to help estimate the relative importanceof the residuals. Finally, the vertical and horizontal thick solidlines are respectively associated with the centroid position andthe observed line width of each fitted Hα profile. In order toextract purely kinematic broadening effects from the observedline widths, the method of quadratic subtraction presented inPaper I was again used. For every panel, the LSR radial velocity,vi,LSR, the corrected line width value, βi,corr, and the S/N of thefitted line are given. For Figures 3–9, error bars on vi,LSR andβi,corr correspond to kinematic uncertainties and are derivedfrom the method introduced by Lenz & Ayres (1992).
Table 1 presents a review of the kinematic informationextracted from Fields 21 to 27. For each field, the meanLSR radial velocity and mean corrected line width are givenrespectively in Columns 3 and 4. From now on, the label “i” willbe referring to the field’s identification number (e.g., 〈v21,LSR〉corresponds to the mean radial velocity observed in Field 21).The number of cycles (M) accumulated for both the Dark andW4 fields (see Figure 2) is presented in Column 5. Exposuretimes for each W4 field can be estimated at 7 × M minutes.This time does not take into account the time spent on DF(for a given W4 field, the total time of telescope required toobtain a reliable kinematics is, therefore, estimated at 7 × 2 ×M minutes). Column 6 gives the angular separation (betweenoptical centers) between each W4 field and the Dark Field.Finally, a brief comment on the particular location of each fieldis provided in Column 7. The value for 〈β22,corr〉 was treated asan upper limit due to particular Hα profiles (see Panels (c), (h),(j), and (l) in Figure 4) that revealed undefined (numerically)βi,corr values (see Section 4.1 in Paper I). Kinematically, theseprofiles were interpreted as being extremely narrow with linewidths below 1 km s−1, but were ignored in the calculation ofthe mean corrected line width of Field 22 (see Section 5.3).Uncertainties, in Columns 3 and 4, correspond to kinematicuncertainties obtained from the mean Hα profile associated witheach field.
In the following section, we compare the kinematics of eachfield to see if there may be flows between fields. Relevantcharacteristics are presented in Table 2 for those fields in our Hαsurvey of W4-north which are probably connected in this way.The linear radial velocity and line width gradients are presentedrespectively in Columns 2 and 3. In Column 4, the rangecorresponds to the distance on the plane of the sky separatingthe two connected fields. The gradients were calculated using
1 The top abscissa, in Figures 3–9, corresponds to the scanned wavelengthinterval of the FPI’s central interference order. Paper I mentioned a spectralscanning that covers seven interference orders for a 60 Å range (roughly seventimes the free spectral range on rest Hα). Each order wraps around the othersand is summed on each channel at the end of the acquisition. A given channel,therefore, corresponds to more than one wavelength. However, the centralinterference order dominates the flux at roughly every step except at theparticular spectral positions of the contaminant night-sky lines. Periphericalorders do not account for the detected spectra, flattened out by thenarrow-band filters.
190 LAGROIS & JONCAS Vol. 693
Table 1LSR Radial Velocity and Line Width Investigations
Field Optical center 〈vi,LSR〉 〈βi,corr〉 M Separation Location(l,b) (km s−1) (km s−1) (◦)
Notes. For Fields 21–23, panels labeled “No Fit” were not considered in the calculation of 〈vi,LSR〉 and 〈βi,corr〉.a An upper limit is found due to Hα line widths estimated below 1 km s−1. These particular panels were not statistically consideredin the calculation of 〈β22,corr〉.
mean values in Columns 3 and 4 of Table 1. Of course, weassume the flow to be continuous between the fields. Table 2is mainly relevant to the verification of our model of a piercedmetal container discussed in Section 5.2.
5. DISCUSSION
5.1. Motivation
To determine whether or not ionized material is escapingthe H ii region through the fragmented shell, a large-scaleinvestigation of the ionized gas’s kinematics of W4-north isnecessary. A particular kinematic signature, directed from thecenter of the superbubble toward the breaks, should be observedif indeed ionized material flows beyond the boundaries ofW4 (see Section 1). A large-scale trend in radial velocitiesis immediately deduced from Table 1. On a “south-to-north”direction, apparently directed toward the top-cap break (seeFigure 1), radial velocities change approximately from −40km s−1 (in Fields 25 and 27) to −70 km s−1 (in Field 22). Inparticular, values measured for 〈v21,LSR〉 and 〈v22,LSR〉 are clearlyblueshifted with respect to the H i supershell (see Section 2). Webelieve that the kinematic behavior of the embedded material inW4-north resembles the behavior predicted by pressurized airin a metal container suddenly pierced along its wall. A simplemodel of this rarefaction scenario is derived in Section 5.2,which allows us to obtain the velocity of the rarefied materialexpanding toward the wall opening. In our interpretation ofour Hα survey, particular attention will be given to the ionizedmaterial found in the vicinity of the possible top-cap (see Section5.3) and western-side breaks (see Section 5.4).
5.2. Analogy: W4-North as a Pierced Metal Container
We previously presented our intuition that a shell openingassociated with W4-north could eventually be modeled by ararefaction wave propagating inside a pierced metal container(see Sections 1 and 2). Figure 13 foreshadows the modelsuggested by our analysis (see Sections 5.3–5.6). To simplifythe description, we will assume (for now) that only the shell’spolar cap has been proned to fracture. The rarefaction wave isbordered, in Figure 13 by the two weak discontinuities movingin opposite directions (see Section 5.8); Discontinuity-N ismoving toward the galactic corona and Discontinuity-S towardthe galactic mid-plane. Discontinuity-N is labeled by a questionmark since no kinematic information is provided by our Hαsurvey above Field 22. This field, still showing evidence foran accelerated ionized component (see Table 1), indicates that
Discontinuity-N can be located somewhere above b ∼ 6.◦5 (seeSection 5.7). The location of Discontinuity-S in Figure 13 isinvestigated in detail in the discussion to follow.
We follow Landau & Lifshitz (1987), who present textbookexamples of semi-infinite cylindrical pipes in which rarefactionwaves dominate the kinematics of the embedded gaseousmaterial. The particle density and pressure of any gas elementwithin a pipe decrease as the wave moves. This basicallydefines rarefaction. Rearranging the authors’ Equation (99.15),we obtain the relation for the velocity vρ of the gaseous materialbehind (above) Discontinuity-S with respect to the gas said atrest located in front of (below) it:
vρ = 2c0
(γ − 1)×
[1 −
(ρ
ρ0
) γ−12
], (1)
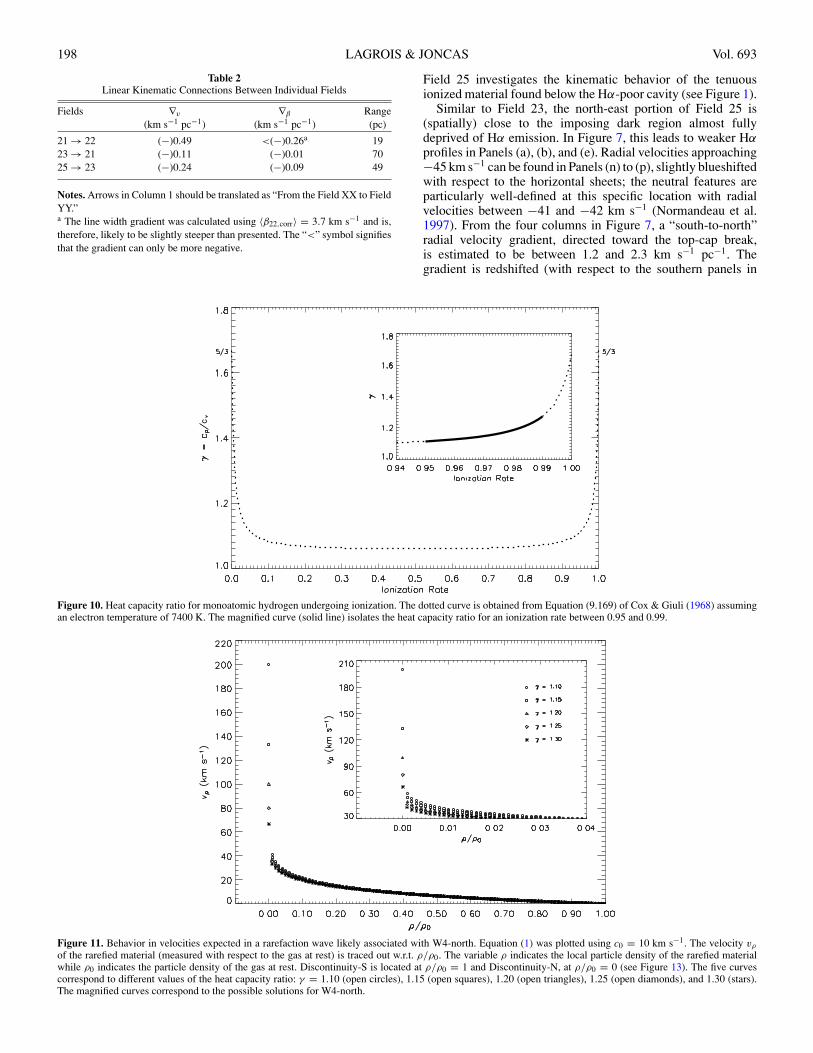
where c0 is the speed of sound in the vicinity of the gas at rest,γ is the heat capacity ratio of the accelerated material, and ρ0is the particle density of the gas at rest. The variable ρ is thelocal particle density of the rarefied material. For W4, the speedof sound was estimated at 10 km s−1. The heat capacity ratioof a monoatomic ideal gas, neutral or ionized, is 5/3. However,the lack of energetic photons at high-galactic latitudes (Terebeyet al. 2003; Dennison et al. 1997; West 2003) suggests that theplasma in W4-north can be interpreted as a mixture of perfectgases still undergoing ionization (this can be seen, in particular,from a thin H i supershell above b = 4◦ and the presence ofthe H i horizontal sheets). The heat capacity ratio’s equationfor atomic hydrogen is provided by Cox & Giuli (1968) and isshown in Figure 10 for an ionization rate between 0 and 1. Aportion of the curve is isolated for an ionization rate between0.95 and 0.99, a range of values we consider plausible for W4-north. The heat capacity ratio is, therefore, estimated between1.10 and 1.30.
From Equation (1), a family of curves is traced out inFigure 11 for five different values of γ (1.10, 1.15, 1.20, 1.25,and 1.30). The relations show the expected behavior in velocitiesas the gaseous material is rarefied (toward Discontinuity-N)following the passing of Discontinuity-S (see Figure 13). Sincethe value for ρ/ρ0 diminishes as the material moves awayfrom Discontinuity-S, a relation is likely to exist betweena particular gas element’s particle density and the distanceit has traveled inside the rarefaction wave (i.e., between thetwo discontinuities). The abscissa in Figure 11 is, therefore,an indicative of the distance (increasing from right to left)separating the accelerated material and the discontinuity moving
No. 1, 2009 KINEMATICS OF W4, A GALACTIC CHIMNEY CANDIDATE 191
Figure 3. Hard binned Hα profiles for Field 21.
into the gas at rest. The velocity gradient remains constant untilthe ratio ρ/ρ0 reaches approximately 10%. Over the same range,the variations of γ do not seem to have sizeable repercussionson the kinematic behavior (this remains true for roughly anyvalue of γ below 1.50). Below 10%, however, the velocitygradient becomes much steeper and presents a larger dispersionwith the heat capacity ratio since the (γ − 1)−1 term dominatesthe exponent in Equation (1). In every case, the peak velocityis found at 2c0/(γ − 1) when the rarefied material becomes sotenuous that its local particle density can be interpreted as 0with respect to the density of the gas at rest (ρ/ρ0 → 0). Forthe analogy of a pierced metal container, this corresponds to themaximal velocity at which the embedded pressurized air canbe ejected through the opening (using, obviously, the correctvalues for c0 and γ ).
The model presented here is unidimensional and would beappropriate if we suppose chimneys to form in a roughlycylindrical shape. In this case, only a corrective term, requiredfrom the fact that we measure radial velocities and, therefore,taking into account the angle of inclination of the “cylinder”with respect to the observer, would need to be applied to thecurves in Figure 11. However, the W4 region, in particular,
brings some geometrical constraints. For example, the apparentsize of the top-cap break is much smaller (∼10%) than themaximal width of the large superbubble (West et al. 2007).We, therefore, assume the zone of rarefaction, between thetwo discontinuities in Figure 13, to resemble the shape of aninverse light bulb. Our model might, therefore, be proned touncertainties as we investigate at ionized material located moreand more away from a central vertical axis passing by l ∼ 134.◦2.Moreover, a probable western-side break (see Section 5.4)would certainly induce a rather complicated kinematics in W4-north since the embedded ionized material would be dominatedby two rarefaction waves instead of one. All of these reasonsdemand a three-dimensional model to be eventually derived.
Our one-dimensional model also does not provide indicationsfor the behavior in line widths as the ionized material travelsaway from the discontinuity moving into the gas at rest. First,we must consider the fact that the gas at rest, in W4, probablypresents a kinematics in agreement with what we referred to asthe “chaotic” interflow medium in Paper I. From its locationclose to the center of the W4 superbubble, this componentlikely present a large diversity of radial velocity gradientsalong the line of sight (a large volume of embedded ionized
192 LAGROIS & JONCAS Vol. 693
Figure 4. Hard binned Hα profiles for Field 22.
material being investigated). Moreover, freshly ionized materialis constantly provided resulting from the photoionization ofthe atomic shell. The sustainment in gas likely contributes toturbulence in the interflow medium. These arguments are allrelated to the large Hα profiles observed in Paper I. Intuitively,we can anticipate line widths will decrease above the southerndiscontinuity in Figure 13 for two reasons. First, the productionof turbulence being suppressed following the passing of ararefaction wave (Gol’dfel’d et al. 1987), we expect a monotonicdissipation of the vorticity as the material travels away fromthe southern discontinuity. Secondly, the fact that the rarefiedmaterial converges straight at the shell opening diminishes thenumber of radial velocity gradients along the line of sight inthe zone of rarefaction. Our assumptions, therefore, proposethe ionized material found above Discontinuity-S to generallyappear more and more “ordered” with latitude. For our Hαsurvey, this would result in a narrowing of the observed linewidths with spatial change (from Discontinuity-S to -N). Thisline narrowing gradient (see the definition used in Section 4.1of Paper I) should, therefore, be correlated with the large-scaleradial velocity gradient expected from Figure 11.
5.3. Top-Cap Break
Gathered in the vicinity of the H i-spur filament (Normandeau2000), Fields 21 and 22 coincide with the northernmost latitudesinvestigated in our Hα survey. We reiterate the fact that thisparticular region of W4 appears as a closed shell lining inHα images but also reveals a fracture according to the atomicobservations (see Section 2), therefore, pinpointing a possibletop-cap break in a very low density H i shell. From Figure 1,Fields 21 and 22 are located slightly above the hypothetical H i
fracture. At this height above the star cluster IC 1805, the ionizedmaterial is extremely tenuous (Dennison et al. 1997). This canbe seen from Figures 3 and 4 where the extraction of reliableinformation has not been possible for particularly faint areaslabeled “No Fit.” We assume the faint Hα emission detected inboth fields to be associated with the polarized data (tracing thesuperbubble) of West et al. (2007) rather than, say, foregroundobjects.
Examination of Table 1 shows that the northern Field 22 ismore blueshifted, and has narrower lines, than the lower latitudeField 21. This can be interpreted as a “south-to-north” flow.
No. 1, 2009 KINEMATICS OF W4, A GALACTIC CHIMNEY CANDIDATE 193
Figure 5. Hard binned Hα profiles for Field 23.
The fact that 〈v21,LSR〉 and 〈v22,LSR〉 do not coincide with theradial velocity range of the H i supershell (see Sections 2 and5.1) makes it difficult to associate the ionized gas with theshell. From our model presented in Section 5.2, the orientationindicated by the line narrowing gradient should be correlatedwith the direction of the ionized flow itself. From the slighttilt toward the observer expected from the W4 superbubble(Normandeau et al. 1996; Lagrois & Joncas 2008) and the well-defined blueshifted radial velocity gradient directed toward thegalactic corona, we propose the observed behavior to correspondprecisely with the signature anticipated from the passing of ararefying discontinuity, the rarefaction wave itself being inducedby the appearance of an opening near the shell’s polar cap.
In Figure 3, the “south-to-north” tendency toward line nar-rowing is also well-defined intrinsically in Field 21. From aroughly sonic regime in Panels (j) to (l), northern edge’s linewidths present values slightly above 6 km s−1. The “south-to-north” blueshifted radial velocity gradient is also easily detectedwithin Field 21 in agreement with the tendency presented on alarger scale in Table 1. Particularly visible along the two middlecolumns from Panels (n) and (o) to (b) and (c) respectively, the
kinematic trend leads to northern radial velocities slightly morenegative than −60 km s−1.
On an intermediate scale, estimated at roughly 19 pc betweenFields 21 and 22, the radial velocity and line width gradientsare found respectively at ∇v = (−)0.49 km s−1 pc−1 and∇β = (−)0.26 km s−1 pc−1 (see Table 2). The larger (in absolutevalue) radial velocities obtained from our Hα survey are foundin Figure 4 where lower panels show radial velocities slightlybelow −70 km s−1, blueshifted by nearly 25 km s−1 with respectto the neutral expanding supershell. The Hα line widths alsoshow a clear continuity from Field 21 to 22 as the highlyaccelerated ionized material evacuates the W4 superbubble,aiming toward the galactic corona. In fact, four panels in Figure 4present Hα profiles so narrow that the spectral resolution of ourinterferometric device system does not allow us to properlyresolve the width of the fitted lines. Hence, either (1) thekinematic disorder (including turbulence) is minimal along theline of sight (see Section 5.7), (2) the electron temperature issmaller than the canonical value (7400 K) used so far in thiswork, or (3) all of the above. A good estimate of the electrontemperature is critical in order to convert observed line widths in
194 LAGROIS & JONCAS Vol. 693
Figure 6. Hard binned Hα profiles for Field 24.
purely kinematic line widths (see Section 3 in Paper I). Certainly,a slight overestimation of the electron temperature2 in W4-north is plausible if we assume a large fraction of the mostenergetic photons (of the star cluster IC 1805) to be absorbedby neutral material embedded in W4-south (see Paper I). Theoverestimation will lead (numerically) to line widths narrowerthan it should be. However, the fact that the abundance of neutralmaterial in W4-north is relatively small (see Section 5.2), wecan argue that the electron temperature is probably constant inW4-north and does not decrease with latitude. Therefore, theline narrowing gradient pointing toward the galactic corona isgenuine. On the other hand, the overestimation of the thermalbroadening likely contributes to undefined βi,corr values (<1 kms−1) in Field 22.
From our investigation of Fields 21 and 22, it is reasonable toassume that a discontinuity associated with a rarefaction wavehad previously accelerated and forced the ejection of ionizedmaterial beyond the boundaries of the W4 superbubble. In orderto estimate the distance over which this discontinuity, traveling
2 The lower limit for the electron temperature of the galactic diffuse ionizedmedium (hereafter, DIM) has been estimated to 5400 K from forbidden lineintensities (Reynolds 1989b).
toward southern latitudes, has affected the embedded ionizedmaterial, Field 23 was observed. The field resides halfwaybetween the northern polar cap and the possible western-sidebreak (West et al. 2007). A particularly weak signal is observednear its south-east boundary. Six panels in Figure 5 have failed toshow well-defined profiles mainly due to a slight overlap withthe Hα-poor cavity observed in the middle of W4-north (seeFigure 1). In agreement with Fields 21 and 22, Figure 5 showsa clear tendency toward line narrowing from the middle Panels(f), (g), and (k) to the north-east boundary in Panels (a), (b), and(e). The line width gradient is precisely oriented toward the top-cap break. The anticipated blueshifted radial velocity gradientis also observed as northern radial velocities are found barelymore positive than −60 km s−1, slightly redfshifted with respectto the radial velocities in the northern portion of Field 21. This ishowever in agreement with Field 23 being located closer to thesouthern discontinuity than Field 21 and, therefore, presenting akinematics slightly more in agreement with what we expect fromthe gas at rest (see Figure 11). From the values obtained in Table1 for 〈v21,LSR〉 and 〈v23,LSR〉, we calculated a particularly flatradial velocity gradient estimated at ∇v = (−)0.11 km s−1 pc−1
in Table 2. The gradient is however likely limited (in steepness)
No. 1, 2009 KINEMATICS OF W4, A GALACTIC CHIMNEY CANDIDATE 195
Figure 7. Hard binned Hα profiles for Field 25.
from the fact that it is measured on a more or less oblique axis(see Section 5.7). Moreover, considering the W4 superbubbleto be only slightly tilted toward the observer (an argumentused in Paper I to explain the low kinematic disorder on theplane of the sky), relatively flat radial velocity gradients are notsurprising in W4-north. Hence, our model presented in Section5.2 essentially uses kinematic observations in order to describea scenario of outward gas venting occurring over a particularlyextended range, rather than associated with a very steep gradient.
A well-defined signature in the northern portion of W4-northallowed us to confirm striking similarities between our modelof a rarefaction scenario and the kinematics of Fields 21 to 23.A kinematic impact on the embedded ionized material has beenobserved on a range estimated at 72 pc between Fields 22 and23 and was attributed to a rarefying discontinuity associatedwith the top-cap break and propagating toward the galacticmid-plane. An investigation on a larger scale will however beprovided in Section 5.7. We will also compare, in Section 5.8,the rate of escape of the ionized material through the chimneywith respect to the filling rate in W4-north (provided by theinner erosion of the atomic shell). The fact that the polarcap, in particular, has been proned to shell instabilities (and,
therefore, fracture) is not surprising since a low particle densityis expected from upstream ISM material more and more tenuouswith the increasing galactic latitude. A low electron density isdirectly correlated with a low recombination rate of the ionizedshell (Dyson & Williams 1980). Numerical simulations haveshown the amplitude of developing instabilities to enter a growthregime when recombination processes are turned off or highlydiminished (Mizuta et al. 2005). The kinematic confirmationof a top-cap break is of great importance as it clearly indicatesthat the W4 superbubble is currently evolving into a chimney.Considering the remarkable alignment (toward the galacticcorona) taken by the top-cap break, escaping photons (throughthe hole) will undoubtedly contribute to the sustainment of thehigh-latitude Reynolds loop (Reynolds et al. 2001).
5.4. Western-Side Break
The investigation of the second breakout identified by Westet al. (2007) is provided by Field 24. A brief review shouldhowever be made on Field 23. We already demonstrated its upperhalf to enclose ionized material kinematically in agreement withthe presence of a top-cap break (see Section 5.3). On the other
196 LAGROIS & JONCAS Vol. 693
Figure 8. Hard binned Hα profiles for Field 26.
hand, a second gradient toward line narrowing is possible, fromthe middle to the lower panels in Figure 5, oriented towardthe western-side break. However, Figure 6 (for Field 24) doesnot favor any connection with Field 23 as its eastern boundaryshows supersonic line widths. From our model (see Section 5.2),we would expect a significant decrease in line widths from thelower panels in Figure 5 to the easternmost panels in Figure 6as the ionized flows converge toward the western-side break.
Certainly, we anticipate the embedded material in W4-northto be kinematically dominated by two possible regimes: the ero-sion of the embedded atomic material (H i walls and horizontalsheets) or the large-scale trend expected from rarefaction waves.The former possibility was largely discussed in Section 5.3 ofPaper I in which we suggest the eroded material to lag behindthe advancing (toward the observer) bubble. This is similar tothe wake of material behind a solid body moving in a viscousfluid. The resulting kinematics is likely to show an ionized com-ponent redshifted with respect to the H i supershell. This is whatwas found for Fields 04, 17, and 18 in Paper I. However, theradial velocities approaching −50 km s−1, in Panels (k), (l),and (p) of Figure 5, do not coincide with this scenario. Eventhough a possible implication of the western-side break nearb = 5◦ has been ruled out by the disconnection in line widthsbetween Fields 23 and 24, the kinematics of Field 23 seems tobe entirely attributed to the passing of a rarefying discontinuitypropagating toward southern latitudes. We, therefore, assumethat the kinematic repercussions attributed to the top-cap break
can be found on a distance that likely exceeds the 72 pc rangepreviously estimated (see Section 5.5).
On the other hand, the investigation of Field 24 providesinconclusive results for the presence of a western-side break.Certainly, the blueshifted radial velocity gradient combined witha line narrowing gradient (both being precisely oriented towardthe western wall) represent a signature identical to the kinematicbehavior observed in Field 21. However, radial velocitiesbetween −30 and −40 km s−1 do not present a significantdiscrepancy with the radial velocity range of the H i supershell.In fact, interpreting Figure 6 along a “west-to-east” direction,the kinematic behavior appears very similar to what we wouldexpect from the erosion of atomic material. The radial velocitygradient presents a redshifted tendency estimated between 1.1and 2.3 km s−1 pc−1 (these are respectively the flatter and steepergradients measured from the four rows in Figure 6), perfectlymatching our results for Flows D, T, and U in Paper I. A linebroadening gradient is found slightly below 2 km s−1 pc−1, alsocoinciding with Flow D. However, the investigation of the CGPSH i observations clearly indicates that the shell is ill-defined inthe vicinity of Field 24 (Normandeau et al. 1997). This argumentalone favors the large side break detected by West et al. (2007)while the striking similarities established between Field 24 andFields 04, 17, and 18 are likely coincidental.
Two reasons are proposed to explain why the kinematicsof Field 24 does not indicate the presence of a shell openingalong the western wall of W4. First, if the outflows are oriented
No. 1, 2009 KINEMATICS OF W4, A GALACTIC CHIMNEY CANDIDATE 197
Figure 9. Hard binned Hα profiles for Field 27.
roughly perpendicular to the line of sight (in other words, if theoutflows do not “follow” the tilt of the superbubble as we wouldexpect), this particular geometry would artificially maintain theradial velocities roughly in agreement with the gas at rest. Theimportant discrepancy in radial velocities between the ionizedmaterial and the H i supershell (see Section 5.3) would remainundetected. Secondly, it can be assumed that the western-sidebreak is relatively young or, at least, much younger than thetop-cap break. We can reiterate the fact that the developmentof shell instabilities in an expanding superbubble is supposedto initially occur near the shell’s polar cap (Dove et al. 2000).In this case, it is reasonable to assume that the rarefaction nearField 24 would still be very low (that is, to assume a ρ/ρ0 value,introduced for Figure 11, very close to 1). This assumption, webelieve, supercedes the first one; not only does it explain radialvelocities almost in agreement with the atomic shell but it isalso in agreement with the “east-to-west” gradients (in radialvelocities and line widths) observed in Field 24. We, therefore,propose a scenario in which a discontinuity, probably locatednot too far away from the field’s eastern boundary, travels towardlarger longitudes. In order to further investigate on a possiblewestern-side break, a western extension to Field 24 is required
(e.g., the dashed line “empty field” on the right of Field 24in Figure 1). This extension would certainly enclosed ionizedmaterial more rarefied (than in Field 24) and, therefore, radialvelocities slightly more different than the atomic shell.
Similar to the top-cap break, the implication of a western-sidebreak is also important from the point of view of the dynamicalevolution of the expanding wind-blown bubble (see Section 5.8).However, its hypothetical orientation, favoring evacuated flowsof ionized material roughly parallel to the galactic mid-plane,would not allow for an efficient connection with the galacticcorona. On the other hand, the escaping photons would certainlycontribute to the photoionization and sustainment of the DIMfound at low-galactic latitudes (Mathis 1986).
5.5. Horizontal Sheets
The H i horizontal sheets mark the boundary between theemissive more W4-south region and the much fainter W4-north.The spectroscopic 21 cm line observations of the CGPS revealedthe horizontal sheets on a LSR radial velocity range between−38 and −45 km s−1 (Normandeau et al. 1997). Roughlylocated at the geometrical center of the expanding superbubble,
198 LAGROIS & JONCAS Vol. 693
Table 2Linear Kinematic Connections Between Individual Fields
Notes. Arrows in Column 1 should be translated as “From the Field XX to FieldYY.”a The line width gradient was calculated using 〈β22,corr〉 = 3.7 km s−1 and is,therefore, likely to be slightly steeper than presented. The “<” symbol signifiesthat the gradient can only be more negative.
Field 25 investigates the kinematic behavior of the tenuousionized material found below the Hα-poor cavity (see Figure 1).
Similar to Field 23, the north-east portion of Field 25 is(spatially) close to the imposing dark region almost fullydeprived of Hα emission. In Figure 7, this leads to weaker Hαprofiles in Panels (a), (b), and (e). Radial velocities approaching−45 km s−1 can be found in Panels (n) to (p), slightly blueshiftedwith respect to the horizontal sheets; the neutral features areparticularly well-defined at this specific location with radialvelocities between −41 and −42 km s−1 (Normandeau et al.1997). From the four columns in Figure 7, a “south-to-north”radial velocity gradient, directed toward the top-cap break,is estimated to be between 1.2 and 2.3 km s−1 pc−1. Thegradient is redshifted (with respect to the southern panels in
Figure 10. Heat capacity ratio for monoatomic hydrogen undergoing ionization. The dotted curve is obtained from Equation (9.169) of Cox & Giuli (1968) assumingan electron temperature of 7400 K. The magnified curve (solid line) isolates the heat capacity ratio for an ionization rate between 0.95 and 0.99.
Figure 11. Behavior in velocities expected in a rarefaction wave likely associated with W4-north. Equation (1) was plotted using c0 = 10 km s−1. The velocity vρ
of the rarefied material (measured with respect to the gas at rest) is traced out w.r.t. ρ/ρ0. The variable ρ indicates the local particle density of the rarefied materialwhile ρ0 indicates the particle density of the gas at rest. Discontinuity-S is located at ρ/ρ0 = 1 and Discontinuity-N, at ρ/ρ0 = 0 (see Figure 13). The five curvescorrespond to different values of the heat capacity ratio: γ = 1.10 (open circles), 1.15 (open squares), 1.20 (open triangles), 1.25 (open diamonds), and 1.30 (stars).The magnified curves correspond to the possible solutions for W4-north.
No. 1, 2009 KINEMATICS OF W4, A GALACTIC CHIMNEY CANDIDATE 199
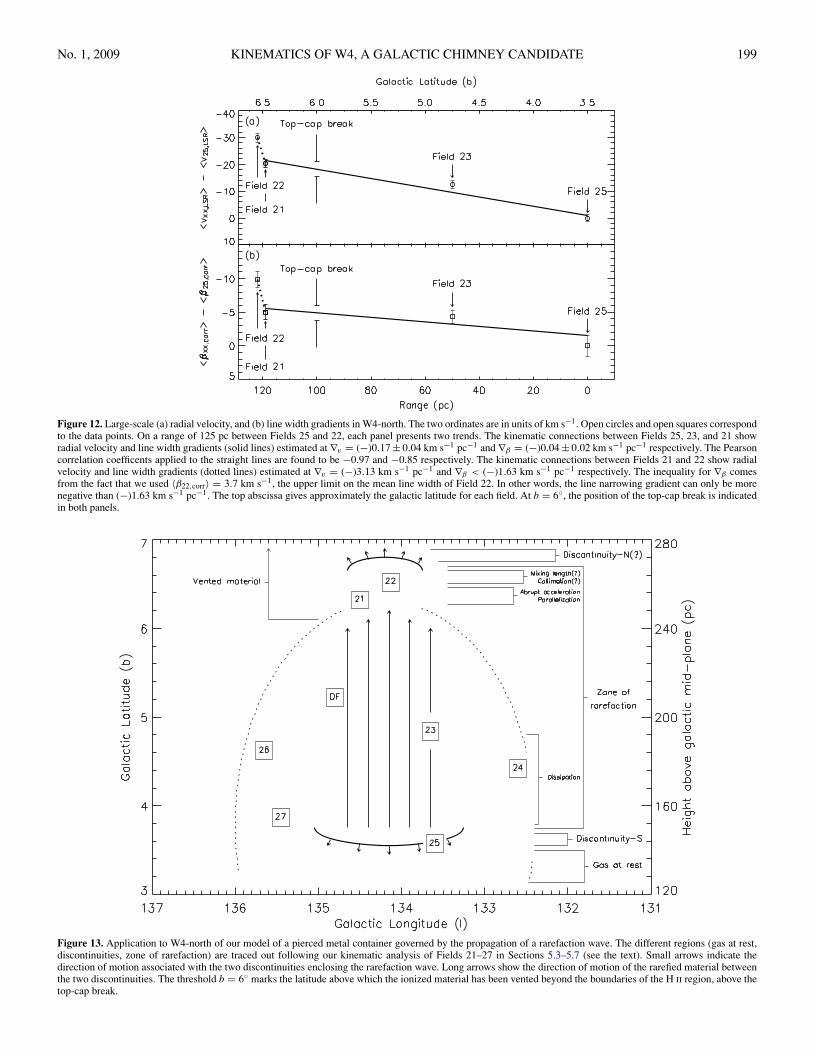
Figure 12. Large-scale (a) radial velocity, and (b) line width gradients in W4-north. The two ordinates are in units of km s−1. Open circles and open squares correspondto the data points. On a range of 125 pc between Fields 25 and 22, each panel presents two trends. The kinematic connections between Fields 25, 23, and 21 showradial velocity and line width gradients (solid lines) estimated at ∇v = (−)0.17 ± 0.04 km s−1 pc−1 and ∇β = (−)0.04 ± 0.02 km s−1 pc−1 respectively. The Pearsoncorrelation coefficents applied to the straight lines are found to be −0.97 and −0.85 respectively. The kinematic connections between Fields 21 and 22 show radialvelocity and line width gradients (dotted lines) estimated at ∇v = (−)3.13 km s−1 pc−1 and ∇β < (−)1.63 km s−1 pc−1 respectively. The inequality for ∇β comesfrom the fact that we used 〈β22,corr〉 = 3.7 km s−1, the upper limit on the mean line width of Field 22. In other words, the line narrowing gradient can only be morenegative than (−)1.63 km s−1 pc−1. The top abscissa gives approximately the galactic latitude for each field. At b = 6◦, the position of the top-cap break is indicatedin both panels.
Figure 13. Application to W4-north of our model of a pierced metal container governed by the propagation of a rarefaction wave. The different regions (gas at rest,discontinuities, zone of rarefaction) are traced out following our kinematic analysis of Fields 21–27 in Sections 5.3–5.7 (see the text). Small arrows indicate thedirection of motion associated with the two discontinuities enclosing the rarefaction wave. Long arrows show the direction of motion of the rarefied material betweenthe two discontinuities. The threshold b = 6◦ marks the latitude above which the ionized material has been vented beyond the boundaries of the H ii region, above thetop-cap break.
200 LAGROIS & JONCAS Vol. 693
Figure 14. Radial velocity profile extracted from the CGPS 21 cm line observations along the line of sight of W4-south. The rear wall of W4 is clearly detectedfrom the well-defined peak near −51.3 km s−1. The front wall peak, much broader, is likely to be contaminated by a large-scale neutral feature located between theexpanding bubble and the observer. The dashed area shows the radial velocity range associated with the H i cavity revealing the W4 H ii region. The actual expansionvelocity of W4 is estimated at 9.75 km s−1 from the radial velocity range between the H i cavity and the position of the rear wall.
Figure 7) and, therefore, cannot be related to the same dynamicalprocess described for Fields 21 and 22 (see Section 5.3). Onthe other hand, the gradient’s steepness perfectly matches theradial velocity gradients observed for Flows D, T, and U inPaper I. In fact, the kinematics of Field 25 is almost identical towhat was found for Fields 04, 17, and 18; the ionized material,eroded from the horizontal sheets, could be observed in the wakeof the advancing (toward the observer) neutral filaments. Thissupposes the horizontal sheets to be located in front of the starcluster, tilted in a way that their southern edge is slightly in frontof their northern edge (from a side point of view). Assuming thisscenario, the lagging material would certainly be in agreementwith the redshifted radial velocity gradient.
Disregarding the western column from Panel (p) to (d), a linebroadening gradient, pointing away from the atomic material,is estimated at 0.8 km s−1 pc−1 in Figure 7. The gradient ismuch flatter than 2.1 km s−1 pc−1, the value measured for ∇β
in Flow D (see Table 4 in Paper I). However, the steepnesscoincides very well with the line width gradients estimated forFlows T and U (see Table 4 in Paper I). The discrepancy in linewidths between Flow D and Flows T and U was explained bymuch more tenuous atomic material in Fields 17 and 18 whencompared to Field 04 (see Section 5.3 in Paper I). Larger linewidths can be partially related to the accumulation of differentradial velocity gradients along the line of sight and this scenariois highly favored in presence of dense erodible material. If weassume the particle density of the horizontal sheets to roughlyequal the one of the W4 eastern shell near Fields 17 and 18, itcould explain the line width behavior in Field 25. The fact that〈β25,corr〉 (see Table 1) is well into the supersonic regime, androughly in agreement with 〈βinterflow,corr〉 (see Figure 4 in PaperI), could indicate a kinematics also partially explained by theinterflow medium (see Section 5.7). This is expected since thelocation of Field 25 allows for deep lines of sight through the W4superbubble (see Section 5.2).
However, the proximity of Field 25 to the Hα-poor cavity(see Figure 1) may also be a factor that explains the relatively
flat “south-to-north” line broadening gradient in Figure 7. InSection 5.3, the kinematics of Fields 21, 22, and 23 werepresented as being directly related to the passing of a rarefyingdiscontinuity propagating toward the galactic mid-plane andassociated with an opening near the shell’s polar cap. If weassume that Discontinuity-S has reached the vicinity of Field25 (see Figure 13), the Hα-poor cavity in Figure 1 could befilled of accelerated ionized material (flowing toward the top-cap break), rarefied to such a degree that it becomes roughlyinvisible (see Section 5.7). The ionized component of Field 25could, therefore, be the most recently material “incorporated”into the evacuation process (in Figure 11, this corresponds tomaterial found at ρ/ρ0 = 1).
The transition (from unperturbed to accelerated and rarefiedmaterial) could initially be characterized by a localized attenua-tion of the line broadening gradient (expected from the erosionof the H i material) before becoming the line narrowing trendobserved on a larger scale (see the kinematic connections be-tween Fields 23 and 21 and Fields 21 and 22 in Table 2). If thisattenuation takes place on a range of a few parsecs on the planeof the sky, the line width gradient’s flatness in Field 24 mightcorrespond to it. However, a northern extension of Field 25, atthe periphery of the Hα-poor cavity (e.g., the dashed line “emptyfield” above Field 25 in Figure 1), would be required in orderto precisely detect the kinematic signature anticipated from ararefaction wave. The kinematic connection between Field 25and Field 23 is presented in Table 2. A factor of two is measuredbetween the radial velocity gradient connecting Fields 25 and23 and the one connecting Fields 23 and 21. Again, this is due tothe particularly oblique connection linking the two latter fields(see Sections 5.3 and 5.7). On the other hand, the line narrowinggradient between 〈β25,corr〉 and 〈β23,corr〉, nine times steeper thanfor Fields 23 to 21, is probably associated with more than just ageometrical effect (see Section 5.7).
The investigation of Field 25 proposes the southern disconti-nuity (associated with the polar cap’s rarefaction wave) not tohave traveled below the threshold fixed by the H i horizontal
No. 1, 2009 KINEMATICS OF W4, A GALACTIC CHIMNEY CANDIDATE 201
sheets. Even though the particular kinematic signature expectedfrom our model in Section 5.2 could not be explicitly identifiednear b = 3.◦5, we anticipate the southernmost signs of gas vent-ing outwards to appear slightly below the Hα-poor cavity. Thiswould give a range of roughly 125 pc separating the southerndiscontinuity and Field 22 slightly above the top-cap break’svicinity (see Section 5.7).
5.6. High-Latitude Eastern Wall
The investigation of the W4 eastern wall at high galacticlatitude (b > 3◦) is provided by Fields 26 and 27. Non-photometric sky conditions, absorbing high-altitude cirrostratus,and a lack of accumulated cycles have constrained us to spatiallydegrade the raw data cube of Field 26 to obtain 2 × 2 images.Even though the statistics are poor (only four points beingavailable in Figure 8), the detected motion of the ionizedmaterial is nonetheless in agreement with the kinematic behaviorobserved in Fields 04, 17, and 18 (see Paper I). From theinner erosion of the eastern wall, lagging material seems toflow toward the center of the wind-blown bubble. On an “east-to-west” direction, the redshifted radial velocity gradient isestimated as slightly below 1.1 km s−1 pc−1. From the locationof Field 26, roughly 5 to 8 pc separates it from the easternwall. Extrapolating the radial velocity gradient leads to radialvelocities roughly in agreement with the 21 cm line observationsshowing the neutral shell with velocities between −43 and −46km s−1 (Normandeau et al. 1997). In Figure 8, the expected“east-to-west” line broadening gradient is found at 1.2 kms−1 pc−1, a steepness that coincides with an intermediate casescenario between Flow D and Flows T and U. Eastern line widthsin Panels (a) and (c), well above 10 km s−1, also clearly indicatea gradient “in progress” since a transition from a subsonic toa supersonic regime is expected from the inner erosion of theneutral wall (see Section 5.3 in Paper I). Extrapolating the linewidth gradient for the missing range between Field 26 and thecompressed shell leads to line widths between 4 and 8 km s−1
in agreement with dispersion values associated with the shellmaterial in Fields 04, 17, and 18 (see Paper I).
Similar to Field 26, Field 27 is characterized by a redshiftedradial velocity gradient again directed away from the neutralwall toward the Hα-poor cavity and is estimated to be justbelow 1.5 km s−1 pc−1 in Figure 9. A 30 pc interval separatesthe optical center of Field 27 from the nearby eastern shell.Extrapolation, on this range, of the radial velocity gradientleads to radial velocities more negative than −80 km s−1,obviously in disagreement with the 21 cm line observations(Normandeau et al. 1997). The inner erosion of the eastern walldoes not properly explain the kinematic behavior of Field 27.Table 1 presents a slightly blueshifted value for 〈v27,LSR〉 whencompared to 〈v26,LSR〉. Given a larger distance separating Field27 from the neutral shell (than Field 26), we would expect aredshifted tendency between mean radial velocities from Field26 to Field 27. The complicated kinematic behavior seen inFigure 9 could be related to a contribution of radial velocitiesmore negative than −38 km s−1. This blueshifted material(with respect to 〈v27,LSR〉) is likely to be associated with thephotoerosion of the H i horizontal sheets. At the longitudeof Field 27, the neutral filaments present radial velocities justbelow −45 km s−1, slightly blueshifted from the H i materialfound in the vicinity of Field 25 (Normandeau et al. 1997).Criss-crossing ionized flows resulting from the proximity oftwo distinct erodible features (the filaments and the H i wallsegment) could explain the accumulation of different gradients
along the line of sight of Field 27. This would also explain thevalue for 〈β27,corr〉, about 20 km s−1 which is the largest observedin both W4-south and -north.
5.7. A Large Scale Trend in W4-North
The investigation of the ionized material in W4-north (seeSections 5.3–5.6) implies there are kinematic connections, inradial velocities and line widths, between four of our Hαfields (see Table 2). Figure 12 provides, on a vertical scaleof roughly 125 pc, the large-scale trends of W4-north. Field25 (see Table 1) coincides with the kinematics of the gasat rest near the southern discontinuity caused by the top-cap break’s rarefaction wave. Every radial velocity and linewidth point in Figure 12 is measured with respect to 〈v25,LSR〉and 〈β25,corr〉, respectively. This can be justified from the factthat Field 25 displays mean values of radial velocity and linewidth in agreement with 〈vinterflow,LSR〉 and 〈βinterflow,corr〉 forthe interflow medium (see Section 5.5). The interflow mediumwas introduced, for W4-south, as ionized material not a prioriassociated with a well-identified or well-defined Champagneflow (see Paper I). These areas seem to be partially formedof material that results from the inner photoerosion of the H i
supershell. In Paper I, we supposed this interflow medium toaccount for a large fraction of the embedded ionized materialin W4 and, therefore, likely constitute the medium in whichthe weak discontinuity propagates (toward the galactic mid-plane). The abscissa in Figure 12 corresponds to the distance onthe plane of the sky separating each field from Field 25. Eachpanel shows two particular trends: relatively flat radial velocity(∇v = (−)0.17 km s−1 pc−1) and line width (∇β = (−)0.04 kms−1 pc−1) gradients between Fields 25, 23, and 21 while Fields21 and 22 are spatially connected by much steeper relations(∇v = (−)3.13 km s−1 pc−1, ∇β = (−)1.63 km s−1 pc−1). Thegradients differ in steepness from Table 2 due to the fact thatthe connections were often made on a relatively oblique axis(e.g., 21 → 22, 23 → 21) rather than on a roughly verticalaxis, the most plausible direction taken by the ionized outflows.Similarities can nonetheless be found between Figure 12 andTable 2 (in particular, the 21 → 22 connection showing thesteeper gradients).
From the one-dimensional model of Landau & Lifshitz(1987), Equation (1) predicts a peak velocity of vρ,max =2c0/(γ − 1) for the rarefied material expanding behindDiscontinuity-S (see Section 5.2). At this point (when ρ/ρ0 =0), the rarefied material overtakes Discontinuity-N to enter ei-ther a regime of constant velocity or a zone in which the ve-locity gradient quickly vanishes (see below, the last paragraphof this subsection). In Figure 12, no indications are providedfor a break in the radial velocity gradient, which suggests thatDiscontinuity-N is undoubtedly located above or precisely atthe location of Field 22, beyond the boundaries of the H ii re-gion. On the other hand, the sudden change of slope betweenFields 21 and 22 resembles the kink in velocities predicted nearρ/ρ0 = 0.05 in Figure 11 (this abrupt acceleration is indicatedin Figure 13). The model, therefore, implies that the ionizedmaterial, initially swept-up by Discontinuity-S and presentlyejected through the top-cap break, has been rarefied to at most5% of the particle density of the ionized material near Field 25.In the vicinity of the shell opening, Field 22 shows a 30 kms−1 difference from the kinematics of the gas at rest in Field25. Since we only measure radial velocities, the velocity jumpbetween Fields 25 and 22 is undoubtedly larger. The sectionof our model showing velocity points larger than 30 km s−1
202 LAGROIS & JONCAS Vol. 693
is isolated in Figure 11. The “solution” for W4-north is likelyfound in these points. The large-scale blueshifted radial velocitygradient confirms the W4 superbubble to be tilted toward the ob-server, given the arguments in Section 5.3. The extremely smallline widths near b = 6.◦5 (see Figure 4) indicate that the angleof inclination, with respect to the plane of the sky, is relativelysmall since Field 22 does not seem to probe the ionized mate-rial to a significant depth through the radial velocity gradient;otherwise, an important spreading in radial velocities would beanticipated along the line of sight. An estimation of its value canbe made by assuming the 30 km s−1 difference to correspond tothe peak (radial) velocity reached by the rarefied material (thatis, to put Discontinuity-N in Figure 13 at the exact latitude ofField 22). Even though our survey cannot properly confirm thetheoretical peak velocity to have been reached at the northern-most latitudes of W4-north, the kink detected between Fields 21and 22 in Figure 12 could indicate that the vented material (seeFigure 13) in the latter field presents a velocity near vρ,max. Ifso, the inclination with respect to the plane of the sky is likelyto be between 9◦ (γ = 1.10) and 27◦ (γ = 1.30).
The behavior in line widths is precisely in agreement withour expectations presented in Section 5.2. The much greatersteepness characterizing the line narrowing gradient betweenFields 25 and 23 when compared to the connection betweenFields 23 and 21 (see Table 2) could be partially relatedto vortex dissipation immediately behind Discontinuity-S. Inparticular, supersonic turbulence will likely decay quickly oncethe material is incorporated inside the zone of rarefaction (Shu1992). The zone of turbulence dissipation is indicated in Figure13. From Table 1, values for 〈β23,corr〉 and 〈β21,corr〉 indicates aroughly constant trend in line widths between Fields 23 and 21.Even though we used a straight line to connect Fields 25, 23 and21 in Panel (b) of Figure 12, one can immediately acknowledgeroughly identical values, near −5 km s−1, associated with thetwo latter fields. Above the zone of dissipation, we, therefore,assume the ionized material to be roughly deprived of turbulentmotions; only a weak tendency related to the parallelization ofthe outflows could be responsible for the slight decrease in linewidths (see below).
In Section 5.5, we interpreted the Hα-poor cavity (see Figure1) as enclosing accelerated ionized material, rarefied by thepassing of Discontinuity-S. The rarefaction is directed towardthe top-cap break. From this assumption, the ionized materialshould appear more and more tenuous as the progression ismade away from the weak discontinuity: that is, the rarefyingdiscontinuity moves toward the horizontal sheets at b = 3.◦5while the gas becomes more and more rarefied towards b = 6.◦5.According to our one-dimensional model, Field DF, used forsky subtraction (see Section 3), should, therefore, displayan Hα emissivity greater than Fields 21 and 22 since it islocated closer to Discontinuity-S and, therefore, should havea greater ρ/ρ0 value (hence, less rarefied material). Field DFwas used as a night-sky indicator due to the fact that it islocated relatively far from the H i walls of W4-north. On theother hand, Field 21, in the vicinity of the shell’s polar cap,might be constantly fed by freshly photoeroded material. Thecontribution of this material artificially accentuates the localparticle density contrast, ρ/ρ0. This allows a clear detectioneven at high galactic latitudes whereas the material in DF doesnot have sufficient contrast. However, the kinematics predictedby the model remain unchanged as the newly ionized componentimmediately acquires the high velocities of the nearby rarefiedmaterial. In Figure 3, there is no evidence for radial velocitiesnear −45 km s−1, a value locally associated with the H i wall.
Located relatively far (roughly 20 pc) from the H i shell(similarly to Field DF), the contribution in material mentioned inthe previous paragraph cannot explain the “high” Hα emissivityin Field 22. A possible scenario can however be deduced if wemake a few assumptions regarding the geometry of the ionizedflows beyond the top-cap break. In Section 5.2, we mentionedthat the width of the top-cap break represents only a fractionof the superbubble’s width. Intuitively, this should lead to well-parallelized outflows as the material evacuates the superbubble.That is, there will be fewer orientations of velocity vectors tocontribute to the line of sight measurement, resulting in a steepline narrowing gradient between Fields 21 and 22 (see Table2). If the outflows eventually collimate above the shell opening,this would lead to the accumulation of ionized material in asmall, restricted region above the top-cap break and, therefore,a localized increase of the particle density. Due to this increase indensity, the ionized material will be more emissive than expectedin Field 22. The accumulation of material directly favors thedevelopment of turbulent motions. This scenario (of collimationleading to turbulence) seems however more significant in thenorthern portion of Field 22 (see Panels (g) and (h) of Figure 4with line widths slightly above 5 km s−1) while the lower panelsshow a minimal kinematic disorder along the line of sight (seeSection 5.3). Although an increase in density due to collimationcauses line broadening, this could possibly be compensated bythe parallelization of the outflows (which likely dominates theoverall dynamics in Field 22 according to the small value foundfor 〈β22,corr〉 in Table 1).
Additionally, collimation could even lead to a slowdown ofthe vented outflows (see Panels (d), (e), and (h) in the northernportion of Figure 4 with radial velocities slightly more positivethan 〈v22,LSR〉). This is deduced from the mass flow rate (i.e.,the product of the particle density, the velocity, and the flow’scross sectional area) treated as being constant in Field 22. Thisis plausible since (from a previous argument) the field is locatedat a latitude above the eroded shell and, therefore, no ionizedmaterial is constantly added near b = 6.◦5. From the observedbehavior in line widths, we already proposed in the previousparagraph that collimation becomes more and more significantwith latitude inside Field 22. However, the fact that the particledensity and the cross-sectional area of the outflows respectivelyincrease and decrease on a “south-to-north” direction insidethe FOV is not enough to definitively show that the velocitieswill also decrease. If the increase in density perfectly balances(numerically) the decrease in area, the velocities would remainunaffected by the collimating “bottleneck” effect. However,this possible deceleration of the outflows also favors (similarlyto localized increase in particle density) the development ofturbulent motions (Wang & Dalton 1991), again in agreementwith larger line widths in the upper panels of Figure 4.
To the simplistic collimation model described above, a seconddynamical scenario can also be considered in order to explainthe kinematics observed in the northern portion of Field 22 (akinematics, on a “south-to-north” direction, against the large-scale trends identified in Figure 12). From the formalism ofLandau & Lifshitz (1987), the large-scale velocity gradient inFigure 12 is expected to vanish above Discontinuity-N (seeFigure 13) if:
Pe < P0 ×(
2
γ + 1
) 2γ
γ−1
, (2)
where γ is the heat capacity ratio of the accelerated material(see Figure 10), Pe is the external pressure to the superbubble,and P0 is the pressure of the gas at rest embedded inside the
No. 1, 2009 KINEMATICS OF W4, A GALACTIC CHIMNEY CANDIDATE 203
superbubble. Substituting our possible values for γ (between1.10 and 1.30) and using the equation of state of a classicalideal gas leads (for the particular case of W4-north) to:
ne
n0· Te
T0< 0.30–0.34. (3)
We used canonical ratios of Te/T0 (0.01 to 0.1), betweenthe cold, outer ISM and the warm, embedded material, andne ∼ 1 cm−3 for the particle density of the atomic material foundroughly 245 pc above mid-plane. The inequality of Equation (3)is not satisfied only if n0, the density in the gas at the rest nearField 25, is �0.1 cm−3. This value, which is well below the meandensity of the galactic DIM (Mathis 1986), is unrealistic andhence we suppose that the rarefied material that overtakes thenorthern discontinuity dynamically evolves into the kinematicconfiguration of the local DIM beyond the boundaries of thelarge W4 H ii region. This scenario is precisely identical tothe concept of “mixing length” introduced in Paper I. Table1 of Reynolds et al. (2001) gives the kinematic behavior ofthe DIM component located a few parsecs above Field 22; amean radial velocity of roughly −45 km s−1 and a correctedline width of 16 km s−1. Both the redshifted radial velocityand line broadening gradients observed from the two lower totwo upper rows in Figure 4 could indicate material flowingabove Discontinuity-N and mingling with the local DIM. Thisassumption contributes to put Discontinuity-N at a latitude ofb = 6.◦5, coincident with Field 22. We firmly believe thatthis simple model of rarefied, vented material/DIM mixingsupercedes the collimation scenario since it leads to an elegantconnection with the data of the WHAM Northern Sky Survey.
5.8. The W4 Galactic Chimney: Suggestionof a Timescale Scenario
From our analysis of subsections Sections 5.3–5.7, we havestrong evidence of a rarefaction scenario in W4-north whichultimately leads to gas venting outwards in the vicinity of theshell’s polar cap. This corroborates the notion that a galacticchimney is currently forming inside the W4 superbubble. In thefollowing subsection, a timescale scenario will be proposed inorder to determine when W4 enters the chimney phase of itsexpansion; that is, to estimate at which time in the past the firstsigns of shell fragmentation would have been observed. Ourmodel remains however approximate since it highly dependsof the growth rate of the zone of rarefaction (see Figure 13)and, therefore, the velocity of the two weak discontinuitiesbounding the rarefaction wave. This information could onlybe roughly estimated from our observations. Finally, the rate ofmass input associated with the photoerosion of the H i shell willbe compared to the rate of escape of ionized material throughthe chimney.
Inconclusive results for a western-side break in Section 5.4are of great importance (relative to the dynamical evolutionof the W4 superbubble) as it implies the development of shellinstabilities on a timescale much smaller than expected. Thisfollows from our argument in Section 5.5 proposing that thelarge Hα-poor cavity (see Figure 1) formed by the evacuationof ionized material through the top-cap break alone. Doveet al. (2000) proposed the development of Rayleigh–Taylorinstabilities that could lead to shell fragmentation once asupershell enters the re-acceleration phase of its expansionabove the blowout threshold. We already demonstrated inSection 2 that W4 barely reaches the required height above the
galactic mid-plane. However, three-dimensional models haveshown that magnetohydrodynamic instabilities, in particular,are likely responsible for shell fragmentation at earlier stages(De Avillez & Breitschwerdt 2005; West et al. 2007). We expectthe chimney to keep forming as long as the Hα-poor cavitydoes not occupy all the volume available inside W4 and therarefaction wave does not dissipate.
From the kinematics observed in Fields 21, 22, 23, and 25, asimple time-dependent scenario, regarding the fragmentationof the shell’s polar cap, can be derived. The fragmentationof the shell has necessarily occurred at a time when theshell’s polar cap was located between 145 and 245 pc abovethe galactic mid-plane. The lower limit coincides with Field25; otherwise, the Hα-poor cavity would be observed belowthe H i horizontal sheets and probably well into W4-south(see Section 5.5). The higher limit corresponds to the actualheight reached by the egg-shaped supershell of West et al.(2007). The fragmentation of the shell coincides with theappearance of the two weak discontinuities associated with therarefaction wave. The formalism of rarefaction waves (Landau& Lifshitz 1987) demands that the two discontinuities traveleither along the same direction (toward the gas at rest) or inopposite directions. Since observational evidence suggests thatDiscontinuity-N is presently located above the W4 superbubble(see Section 5.7), this discontinuity is propagating toward thegalactic corona. Otherwise, the discontinuity would be evidentabove Discontinuity-S in Figure 13 but still well below the actualheight of the superbubble. The change of sign (from blueshiftedto redshifted) of the large-scale radial velocity gradient, apparentin the northern portion of Field 22 (see Section 5.7), would,therefore, be observed at a latitude well below the top-cap break(which is not the case; see Figure 12). The fact that the twodiscontinuities are moving away from each other allows us toestimate the dynamical age of the zone of rarefaction.
Equation (4) of Dennison et al. (1997) defines the timescaletD to be the time required for a superbubble to expand one scaleheight above the galactic mid-plane. Considering H = 140 pcabove the galactic mid-plane (Normandeau 2000) and using thesame values for the actual mechanical luminosity of the starcluster IC 1805 (L0 = 0.3 × 1038 ergs s−1) and the ambientparticle density of the ISM exterior to the superbubble at thegalactic plane level (nplane = 5 cm−3), we obtain a new estimateof roughly 5.6 Myr for tD, compared to 3.2 Myr proposedby Dennison et al. (1997). Assuming the superbubble to haveexpanded on a timescale between 1.5 × tD and 2.5 × tD (thistype of approximation was also used by Dennison et al. (1997))in order to reach its actual height (estimated at 1.85 × H), wepropose the dynamical age of the W4 superbubble to lay between8.4 and 14.0 Myr. The lower limit is similar to the dynamicalage of 9 Myr obtained by West et al. (2007).
The behavior in velocities of the two discontinuities associ-ated with a rarefaction wave is particularly complicated as itinvolves viscosity and thermal conductivity in the gas at restwhich ultimately lead to the dissipation of the wave in the sub-sonic regime (Landau & Lifshitz 1987). The velocities are how-ever comparable to the speed of sound in the ambient plasma. Ifwe assume both discontinuities to have a velocity of 15 km s−1,the zone of rarefaction in Figure 13 is expected to have grownat a rate of 30 km s−1 (since the discontinuities are movingaway from each other). Assuming Discontinuity-N to coincideprecisely with Field 22 (an assumption largely discussed inSection 5.7), the point of shell fracture is estimated near b = 5◦(halfway between b = 3.◦5 and b = 6.◦5), at a latitude coinci-
204 LAGROIS & JONCAS Vol. 693
dent with Field 23 (roughly 200 pc above the mid-plane). Fora distance of 2.35 kpc to the star cluster IC 1805 (Massey etal. 1995), this height corresponds to 1.4 × H, roughly 30% be-low the predicted blowout threshold (see Section 1). In order tocover, at a grown rate of 30 km s−1, the distance of 125 pc be-tween Fields 25 and 22, roughly 4.1 Myr is required. This can beinterpreted as the dynamical age of the top-cap break and, con-sequently, the chimney. By subtracting the chimney’s age fromthe range of dynamical ages obtained for the W4 superbubble(see above), shell instabilities are, therefore, likely to have de-veloped 4.3 to 9.9 Myr following the ignition of the first stellargeneration. As a check on this range of ages, we assume themechanical luminosity to have remained constant (that is, nearL0) from one stellar generation to the other and we obtain, usingEquation (1) of Mac Low & McCray (1988), the time requiredfor a superbubble to reach a height of Z parsecs above the galac-tic mid-plane:
t(Z) =(
Z
1 pc
) 53
(H
1 pc
)− 53
tD. (4)
For the W4 superbubble, roughly 10.1 Myr are necessary toreach 200 pc and initiate shell fragmentation. Adding the agederived for the chimney, our timescale scenario is in agreementwith a dynamical age of 14 Myr for the superbubble, a valuegreater than the first estimate between 6.4 and 9.6 Myr proposedby Dennison et al. (1997). The authors, however, do not provideuncertainties on their estimate.
The velocity of 15 km s−1, proposed in particular forDiscontinuity-N, is probably not too far from reality. Our previ-ous arguments have already demonstrated that Discontinuity-N,moving toward the galactic corona, is presently located slightlyabove the actual height of the superbubble, probably near thelatitude of Field 22 (see Figure 13). In other words, the velocityof the discontinuity is probably slightly greater than the polar re-gion’s mean expansion velocity between 200 pc (at fracture) and245 pc (actual height) above mid-plane. From Equation (13.5)of Lozinskaya (1992), giving the expansion velocity (with re-spect to time) of a wind-blown bubble in its phase of energyconservation, we predict a deceleration from 10.9 km s−1 (atZ = 200 pc and t = 10 Myr) to 9.6 km s−1 (at Z = 245pc and t = 14 Myr). This is obtained using a mean particledensity3 of roughly 2 cm−3 for the upstream material between37 pc (the height above mid-plane of the star cluster IC 1805)and 245 pc. For a mean expansion velocity of 10 km s−1, thedifference of 5 km s−1 between the region of the shell’s polarcap and Discontinuity-N signifies that the weak discontinuitywould have traveled an additional 20 pc during the last 4 Myr(corresponding to the age of the chimney). This simple argumentputs Discontinuity-N at an height of 265 pc above the galacticmid-plane, in agreement with the location of Field 22 (see theright-hand axis of Figures 1 and 13).
Finally, an investigation is here provided that should helpvalidate the relations established between our model of ararefaction scenario and the kinematics of W4-north. The factthat the Hα-poor cavity is well-detected demands the rate
3 This value is justified by the exponentially decreasing galactic atmospheremodel mentioned in Section 1. The atomic material displays a particle densityof n(Z) = nplane× e−Z/H . Assuming nplane = 5 cm−3, we obtain n = 2.01cm−3 for Z varying between 37 and 245 pc. The CGPS 21 cm lineobservations (Normandeau et al. 1997) in W4-south exhibit an expansionvelocity of 9.75 km s−1 for the W4 region (see Figure 14). Also, the W4-southregion is used for the determination of the expansion velocity since both thefront and rear walls of the supershell are ill-defined at the latitude of W4-north.
at which the ionized material evacuates the superbubble toexceed the discharge (toward the interior) of freshly photoerodedmaterial that results from the ionization of the neutral supershell.The rate Min at which the photoeroded material “falls” into theW4 superbubble is adapted (to our work) from the investigationof the photoevaporation of molecular clumps (Joncas & Roy1984) and is estimated at:
Min = ρH ii vH ii Sshell, (5)
where ρH ii correspond to the density (in units of mass pervolume) of the ionized material in contact with the neutralshell, vH ii is the velocity of this material with respect to theneutral shell, and Sshell, the area covered by the shell. In order toavoid distortions of the velocity measurements due to a possiblewestern-side break, we estimate vH ii to be roughly 1 km s−1
using Fields 04, 17, and 18 (Paper I, Table 5). The neutralsupershell envelops an ionized superbubble. Thus using thecharacteristics determined by West et al. (2007), such as anhalf-radius and half-height of the W4 superbubble respectivelyof 82 and 123 pc, a particle density ρH ii of ∼0.40 cm−3, andnoting that the zone of rarefaction covers about 30% of thesuperbubble area, we estimate Min ∼ 3.4 × 10⁻⁴ M yr−1.
Using the same formalism as Equation (5), we obtained Mout,the rate of evacuation through the top-cap break, as
Mout = ρbreak vevac Sbreak, (6)
where ρbreak is the density (in units of mass per volume) of theionized material in the vicinity of the shell opening, vevac isthe velocity of the rarefied material passing above b = 6◦, andSbreak, the area of the top-cap break. We assume nbreak (in unitsof particle per volume) to be roughly equivalent to the electrondensity, ne, of Point I displayed in Table 4-2 and Figure 4-2of West (2003). The value is estimated near 0.20 cm−3. Usingthe large-scale radial velocity gradient of Figure 12 (solid line),we estimate the radial component of the velocity of evacuation(with respect to the gas at rest) to approximately 17 km s−1 at theposition of the top-cap break (b = 6◦). Using the range of valuesproposed for the superbubble’s angle of inclination in Section5.7, the velocity of evacuation vevac is estimated between 37 kms−1 (θ = 27◦) and 110 km s−1 (θ = 9◦). West et al. (2007) gives20 pc for the diameter of the top-cap break for a roughly circularshape of 315 pc2. The value for Mout is estimated between 5.9× 10⁻⁵ and 1.8 × 10⁻⁴ M yr−1.
Our model of a W4 superbubble that looses ionized materialat a rate faster than it gains material does not hold evenfor large values of vevac. This could be explained by (1) avalue for vevac greater than expected (this would demand anionization rate below 95% in W4-north leading to an angleof inclination with respect to the plane of the sky below 9◦),(2) a sizeable contribution to the rarefied cavity attributed tothe (young?) western-side break, (3) an underestimation of thebreak’s dimensions, or (4) all of the above. For example, anangle of inclination slightly below 5◦ (instead of �9◦) or a shellopening characterized by a diameter of 28 pc (instead of 20pc) would give Mout greater than Min, in agreement with ourinitial assumption. However, the increase in diameter (from 20to 28 pc) would demand that the top-cap break, at the distanceof W4, is more than 10 pixels wider than its current estimatedwidth (according to the ∼1′ spatial resolution of the CGPSobservations). Such a large difference with the CGPS imagesdisplayed in West et al. (2007) is highly questionable. A possibleexplanation might however be related to the shape of the top-cap break; rather than assuming a circular opening, an irregular,
No. 1, 2009 KINEMATICS OF W4, A GALACTIC CHIMNEY CANDIDATE 205
asymmetric break (that likely has a larger dimension along theline of sight compared to the dimension observed on the planeof the sky) could contribute for a larger Sbreak value. This isplausible since the edge-on view with the W4’s polar cap doesnot allow to conclude on the shape of the shell opening.
6. CONCLUSION
The use of FaNTOmM, an interferometric device system es-pecially designed to study particularly faint extended astronom-ical objects, has allowed us to extract the kinematic informationassociated with the ionized component found embedded in thenorthern portion of the galactic superbubble/H ii region W4.Our motivation was based on the possible discovery that twofaint H i segments along the northern shell could be interpretedas evidence of shell fragmentation (see Section 2). We pro-pose a method of quantitatively identifying shell breakout (seeSection 1). The method relies on the kinematic perturbation by(inward) propagating rarefaction waves. The results from usingthis method suggest a situation that is similar to a model of apierced metal container (see Section 5.2).
A total of seven fields were observed in the galactic latituderange between 3◦ and 7◦. Two kinematic regimes are identified.First, the embedded ionized material below b = 5◦ and found atthe periphery of the H ii region seems to be mostly dominatedby the inner erosion of the compressed H i shell (see Section5.6), a behavior largely discussed in Paper I. However, a clear“south-to-north” gas flow is identified on a vertical axis of 125 pcbetween b = 3.◦5 and b = 6.◦5 (roughly centered on l = 134◦), inagreement with the passing of a weak discontinuity (labeledDiscontinuity-S in text) associated with a rarefaction wave(see Section 5.7). The discontinuity is propagating toward thegalactic mid-plane and the rarefaction wave itself results froma shell opening near the polar cap. The second discontinuity ofthe wave (labeled Discontinuity-N in text) is propagating towardthe galactic corona (see Section 5.8). Our investigation did notshow conclusive results for ionized flows through a possiblewestern-side break (see Section 5.4).
A 30 km s−1 radial velocity difference is found between Field25 (which appears to be associated with the gas at rest near thesouthern discontinuity of the wave) and Field 22, enclosing thegas located slightly beyond the boundaries of the H ii region(see Section 5.7). Between both these regions, a large Hα-poor cavity (see Figure 1) encloses accelerated and rarefiedmaterial expanding northward above (behind) Discontinuity-S(see Figure 13). Two trends in radial velocities are detected:a roughly flat gradient between Fields 25 and 21 estimated at(−)0.17 km s−1 pc−1 and a much steeper gradient found at(−)3.13 km s−1 pc−1 between the northern Fields 21 and 22(see Figure 12). The sudden change of slope corresponds tothe abrupt increase in velocities predicted from our model forhighly rarefied material (see Figure 11). The behavior in radialvelocities confirms that the W4 superbubble is tilted toward theobserver and substantiates the formation of a galactic chimney(see Section 5.7).
The dynamical age of the chimney phase is estimated at4.1 Myr assuming both discontinuities, associated with thewave, to travel with very similar velocities. This implies thatthe shell opening appeared when the shell’s polar cap wasroughly located 200 pc above galactic mid-plane (see Section5.8). In this case, shell instabilities developed in W4 at latitudeswell below the blowout threshold, which is between 280 and420 pc above mid-plane at the distance of the star clusterIC 1805. Magnetohydrodynamic instabilities are likely to have
occurred at the earlier stages of the expansion (see Section 5.8).According to a simple model of expanding wind-blown bubbles,roughly 10 Myr was necessary to reach 200 pc and initiateshell fragmentation in W4. Adding the age of the chimneyphase, we propose the dynamical age of the superbubble tobe approximately 14 Myr (see Section 5.8), a value apparentlygreater than any previous estimations.
The H i walls do not seem to have a kinematic impact onthe vented outflows of ionized material. On the other hand,their inner erosion contributes to the local particle density ofparticular areas. Otherwise, the fields observed would haveenclosed extremely rarefied material which would likely beinvisible, according to the model (see Section 5.7).
Our one-dimensional model does not provide indications onhow the Hα line widths vary inside a rarefaction wave (seeSection 5.2). However, the behavior in line widths can be bestexplained by a few assumptions regarding the hydrodynamics ofthe rarefied material and the particular geometry of W4-north.A zone characterized by a dissipation of the turbulence (seeFigure 13) could be located immediately behind the southerndiscontinuity (see Section 5.7). Correlated with the abruptacceleration observed between Fields 21 and 22 (see Figure12), the steep line narrowing gradient could be related to aparallelization of the outflows through the top-cap break (seeSection 5.7). Collimation could eventually explain the particularkinematic behavior in radial velocities and line widths observedin the northern portion of Field 22. Another scenario demandsthe northern discontinuity of the wave to be located precisely atthe latitude of Field 22; ionized material, that flows through thetop-cap break and beyond the zone of rarefaction, might evolvefor a certain distance to reach the kinematic configuration ofthe local DIM material above the superbubble (see Section 5.7).Finally, the particularly low βi,corr values in Field 22 indicatea small inclination of the W4 superbubble with respect to theplane of the sky. Using evidence that Discontinuity-N coincidesin latitudes with Field 22, we obtain an angle of inclinationbetween 9◦ and 27◦ (see Section 5.7).
Using observations in Paper I, we can estimate how muchphotoeroded material is added per year to the warm ISMenclosed by the H i shell. The rate at which W4-north losesionized material through the top-cap break is slightly lessthan this rate. However, the presence of the Hα-poor cavityindicates that the rate of evacuation should clearly dominate. Theproposed explanations are mostly associated with geometricaleffects: a larger maybe asymmetric top-cap break, a smallerangle of inclination of the superbubble with respect to the planeof the sky, or a sizeable contribution to the evacuation attributedto the western-side break, although the latter is not detected inHα. Since the uncertainties on each measurement are difficultto quantify, no particular explanation clearly emerges from theothers.
The kinematic confirmation of a shell opening near the polarregion of W4 signifies that a certain fraction of the UV flux willlikely exit the large superbubble through the hole. The formationof a dynamic chimney inside the superbubble/H ii region W4 isthe evolutionary stage that establishes an energetical connectionbetween the star cluster IC 1805 and the Reynolds loop locatedat low-galactic corona level.
The authors would like to thank the Natural Sciences and En-gineering Research Council of Canada and the Fonds Quebecoisde la Recherche sur la Nature et les Technologies who pro-vided funds for this research project. The Canadian Galactic
206 LAGROIS & JONCAS Vol. 693
Plane Survey is a Canadian project with international part-ners and is supported by a grant from the Natural Sciencesand Engineering Research Council of Canada. Data fromthe Canadian Galactic Plane Survey are publicly availablethrough the facilities of the Canadian Astronomy Data Centre(http://www1.cadc-ccda.hia-iha.nrc-cnrc.gc.ca/cgps/).
D.L. is grateful to M.-A. Miville-Deschenes and OlivierDaigle who provided useful IDL routines to carry out data re-duction. D.L. would also like to thank B. Malenfant, G. Turcotteand P.-L. Levesque for technical support during numerous ob-serving nights at the Observatoire du mont Megantic.
REFERENCES
Atherton, P. D., Taylor, K., Pike, C. D., Harmer, C. F. W., Parker, N. M., &Hook, R. N. 1982, MNRAS, 201, 661
Basu, S., Johnstone, D., & Martin, P. G. 1999, ApJ, 516, 843Chevalier, R. A., & Gardner, J. 1974, ApJ, 192, 457Cox, J. P., & Giuli, R. T. 1968, Principles of Stellar Structure (New York: Gordon
and Breach), chapter 9Daigle, O., Carignan, C., Hernandez, O., Chemin, L., & Amram, P.
2006, MNRAS, 368, 1016de Avillez, M. A., & Berry, D. L. 2001, MNRAS, 328, 708de Avillez, M. A., & Breitschwerdt, D. 2005, A&A, 436, 585Dennison, B., Topasna, G. A., & Simonetti, J. H. 1997, ApJ, 474, 31Dickey, J. M., & Lockman, F. J. 1990, ARA&A, 28, 215Dove, J. B., Shull, J. M., & Ferrara, A. 2000, ApJ, 531, 846Dyson, J. E., & Williams, D. A. 1980, The Physics of the Interstellar Medium
(Manchester: Manchester Univ. Press), chapter 5Godbout, S., Joncas, G., & Drissen, L. 1998, PASA, 15, 60Gol’dfel’d, M. A., Zinov’ev, V. N., & Lebiga, V. A. 1987, Fluid Dynamics, 22,
40Heiles, C. 1991, IAUS, 147, 43Hernandez, O., Gach, J.-L., Carignan, C., & Boulesteix, J. 2003, Proc. SPIE,
4841, 1472
Joncas, G., & Roy, J.-R. 1984, ApJ, 283, 640Lagrois, D., & Joncas, G. 2009, ApJ, 691, 1109 (Paper I)Landau, L. D., & Lifshitz, E. M. 1987, Fluid Mechanics (2nd ed.; Toronto:
Permagon Press), chapter 10Lenz, D. D., & Ayres, T. R. 1992, PASP, 104, 1104Lozinskaya, T. A. 1992, Supernovae and Stellar Wind in the Interstellar Medium
(New York: AIP), chapter 13Mac Low, M.-M., & McCray, R. 1988, ApJ, 324, 776Mac Low, M.-M., McCray, R., & Norman, M. L. 1989, ApJ, 337, 141Massey, P., Johnson, K. E., & DeGioia-Eastwood, K. 1995, ApJ, 454, 151Mathis, J. S. 1986, ApJ, 301, 423McClure-Griffiths, N. M., Ford, A., Pisano, D. J., Gibson, B. K., Staveley-Smith,
L., Calabretta, M. R., Dedes, L., & Kalberla, P. M. W. 2006, ApJ, 638, 196Mizuta, A., Kane, J. O., Pound, M. W., Remington, B. A., Ryutov, D. D., &
Takabe, H. 2005, AJ, 621, 803Norman, C. A., & Ikeuchi, S. 1989, ApJ, 345, 372Normandeau, M., Taylor, A. R., & Dewdney, P. E. 1996, Nature, 380, 687Normandeau, M., Taylor, A. R., & Dewdney, P. E. 1997, ApJS, 108, 279Normandeau, M. 2000, in ASP Conf. Ser., Stars, Gas and Dust in Galaxies:
Exploring the Links, ed. D. Alloin, G. Galaz, & K. Olsen (San Francisco,CA: ASP), 221, 41
Osterbrock, D. E., Fulbright, J. P., Martel, A. R., Keane, M. J., Trager, S. C., &Basri, G. 1996, PASP, 108, 277
Reynolds, R. J. 1989a, ApJ, 339, L29Reynolds, R. J. 1989b, ApJ, 345, 811Reynolds, R. J., Sterling, N. C., & Haffner, L. M. 2001, ApJ, 558, 101Shi, H. M., & Hu, J. Y. 1999, A&AS, 136, 313Shu, F. H. 1992, Gas Dynamics, Vol. II (Mill Valley, CA: University Science
Books), chapter 14Skinner, W. R., Yee, J.-H., Hays, P. B., & Burrage, M. D. 1998, AdSpR, 21,
835Terebey, S., Fich, M., Taylor, R., Cao, Y., & Hancock, T. 2003, ApJ, 590,
906Wang, X., & Dalton, C. 1991, International journal for numerical methods in
fluids, 12, 383West, J. L. 2003, Master Thesis, University of Manitoba, CanadaWest, J. L., English, J., Normandeau, M., & Landecker, T. L. 2007, ApJ, 656,